
Structure Determination of Novel Oxidation Products from Epicatechin: Thearubigin-Like Molecules

Abstract
:
1. Introduction
2. Results and Discussion
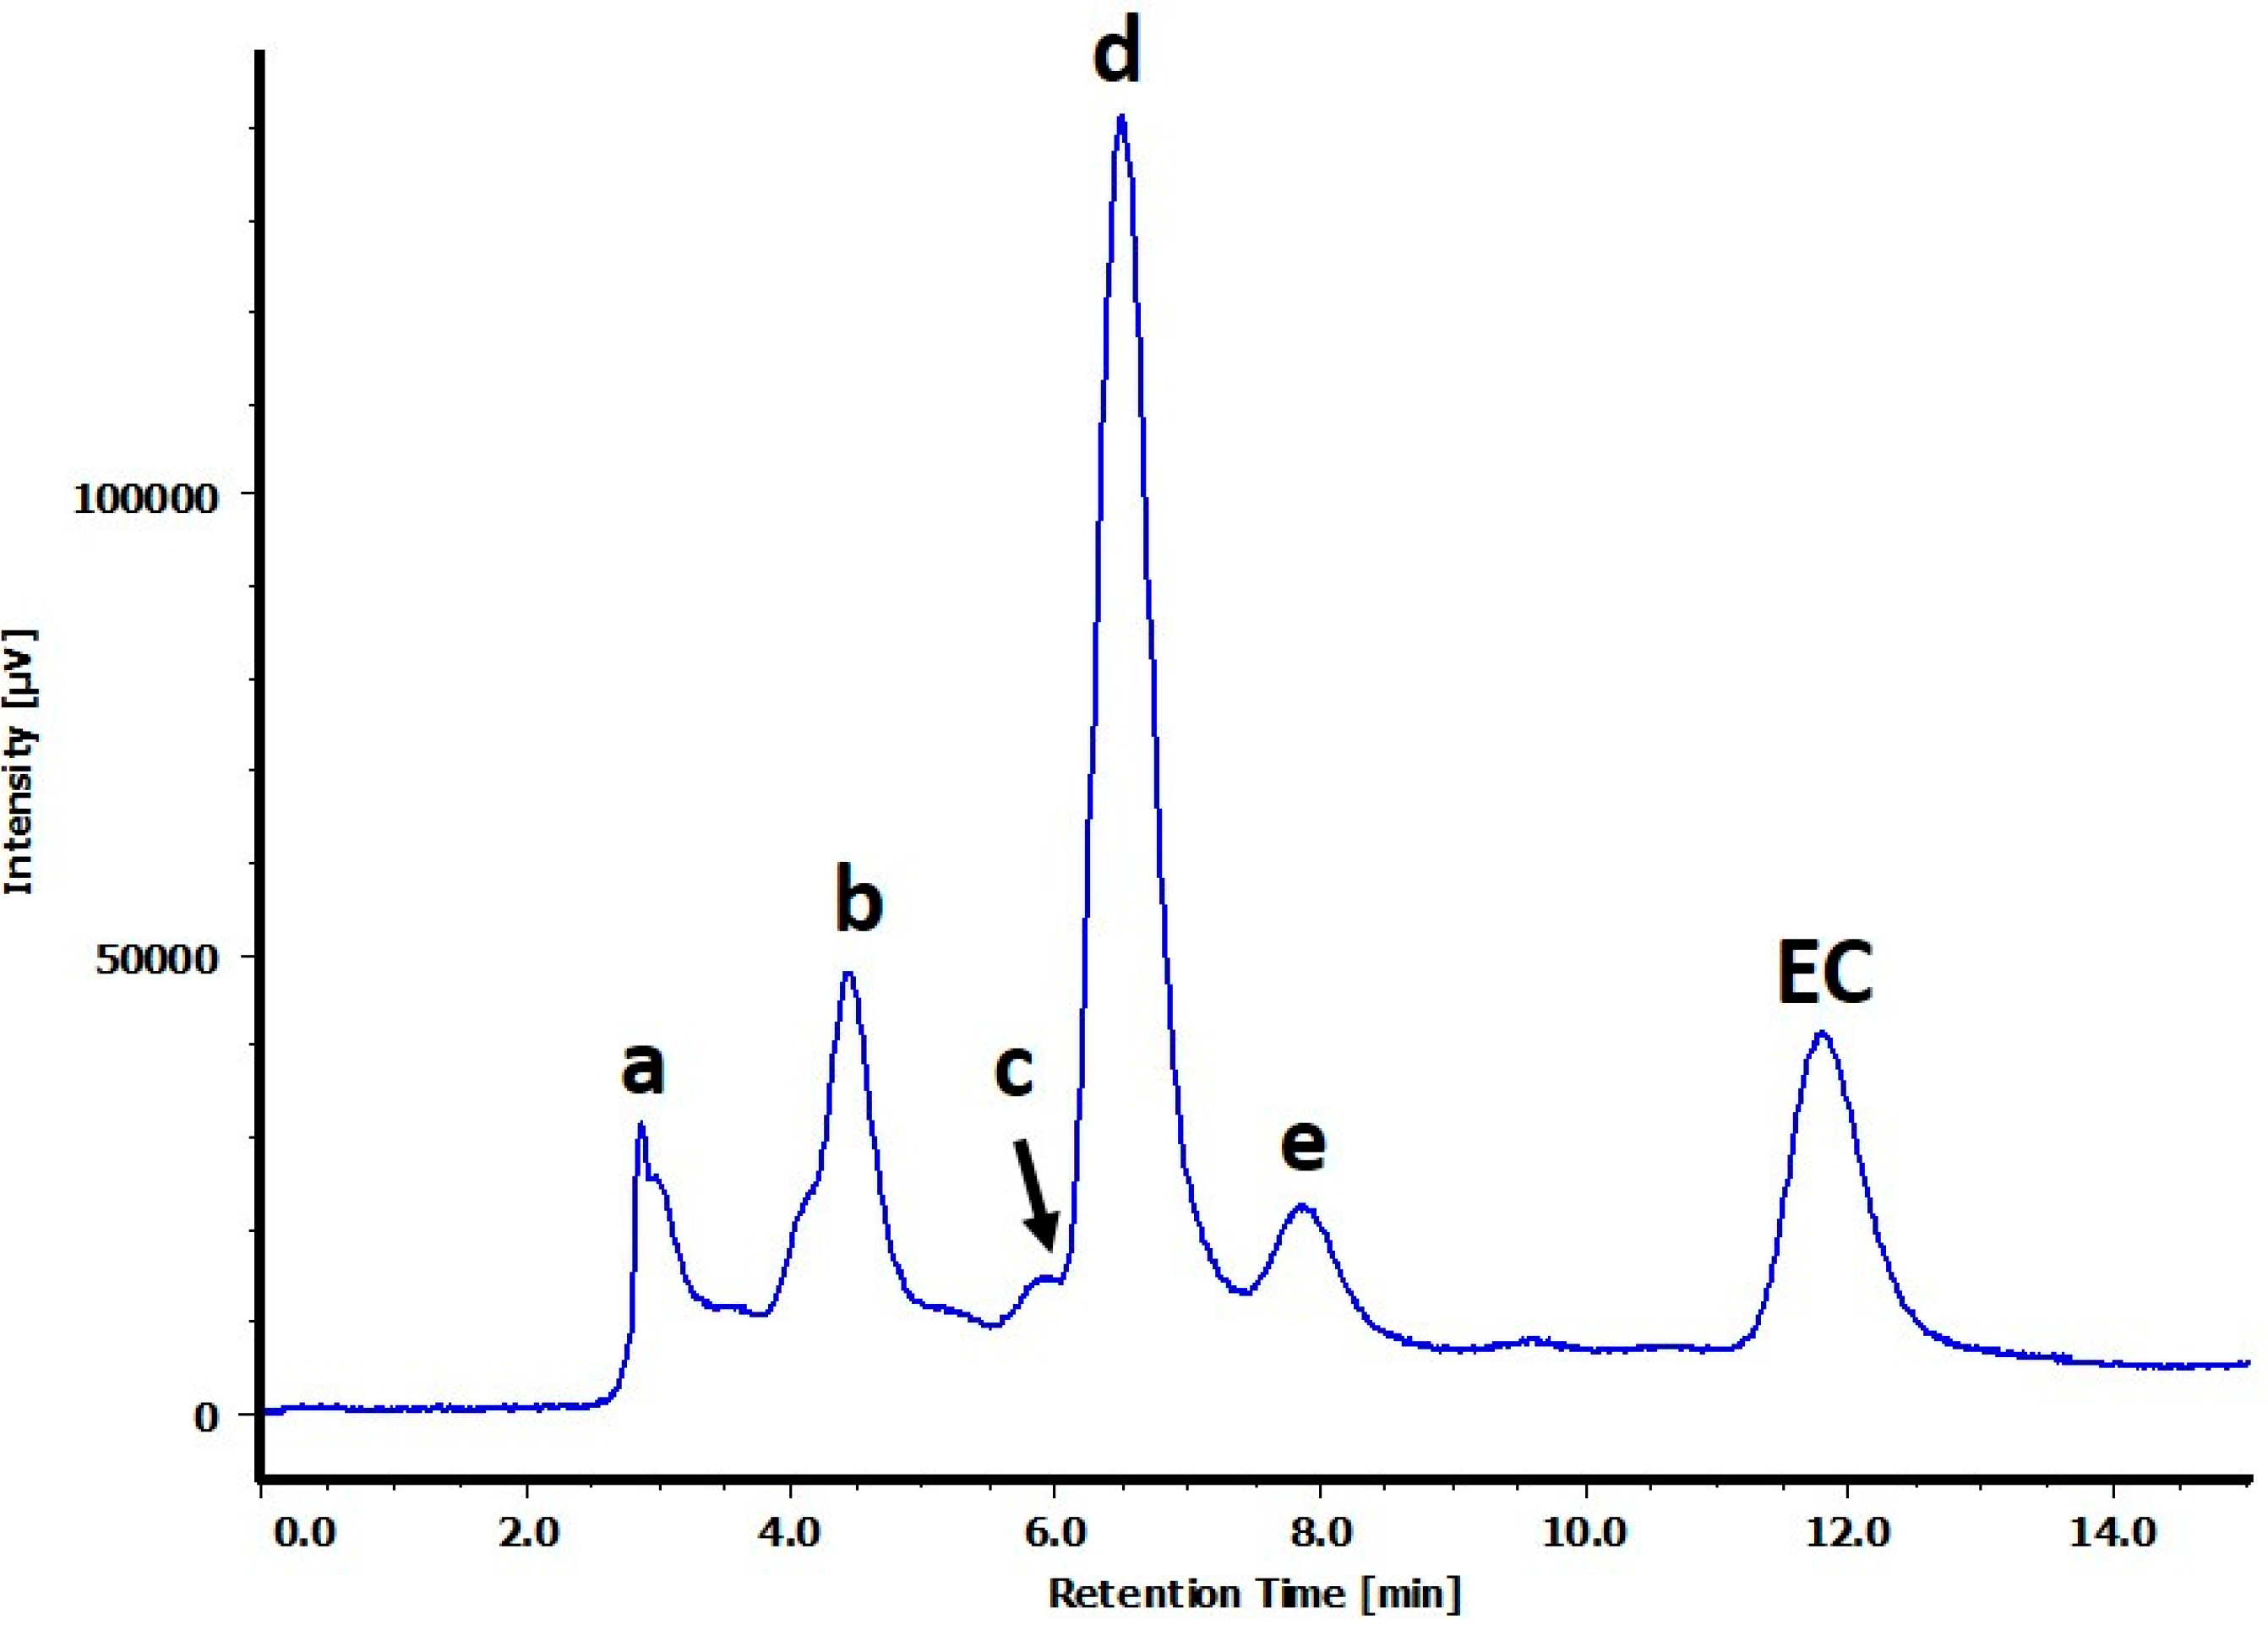
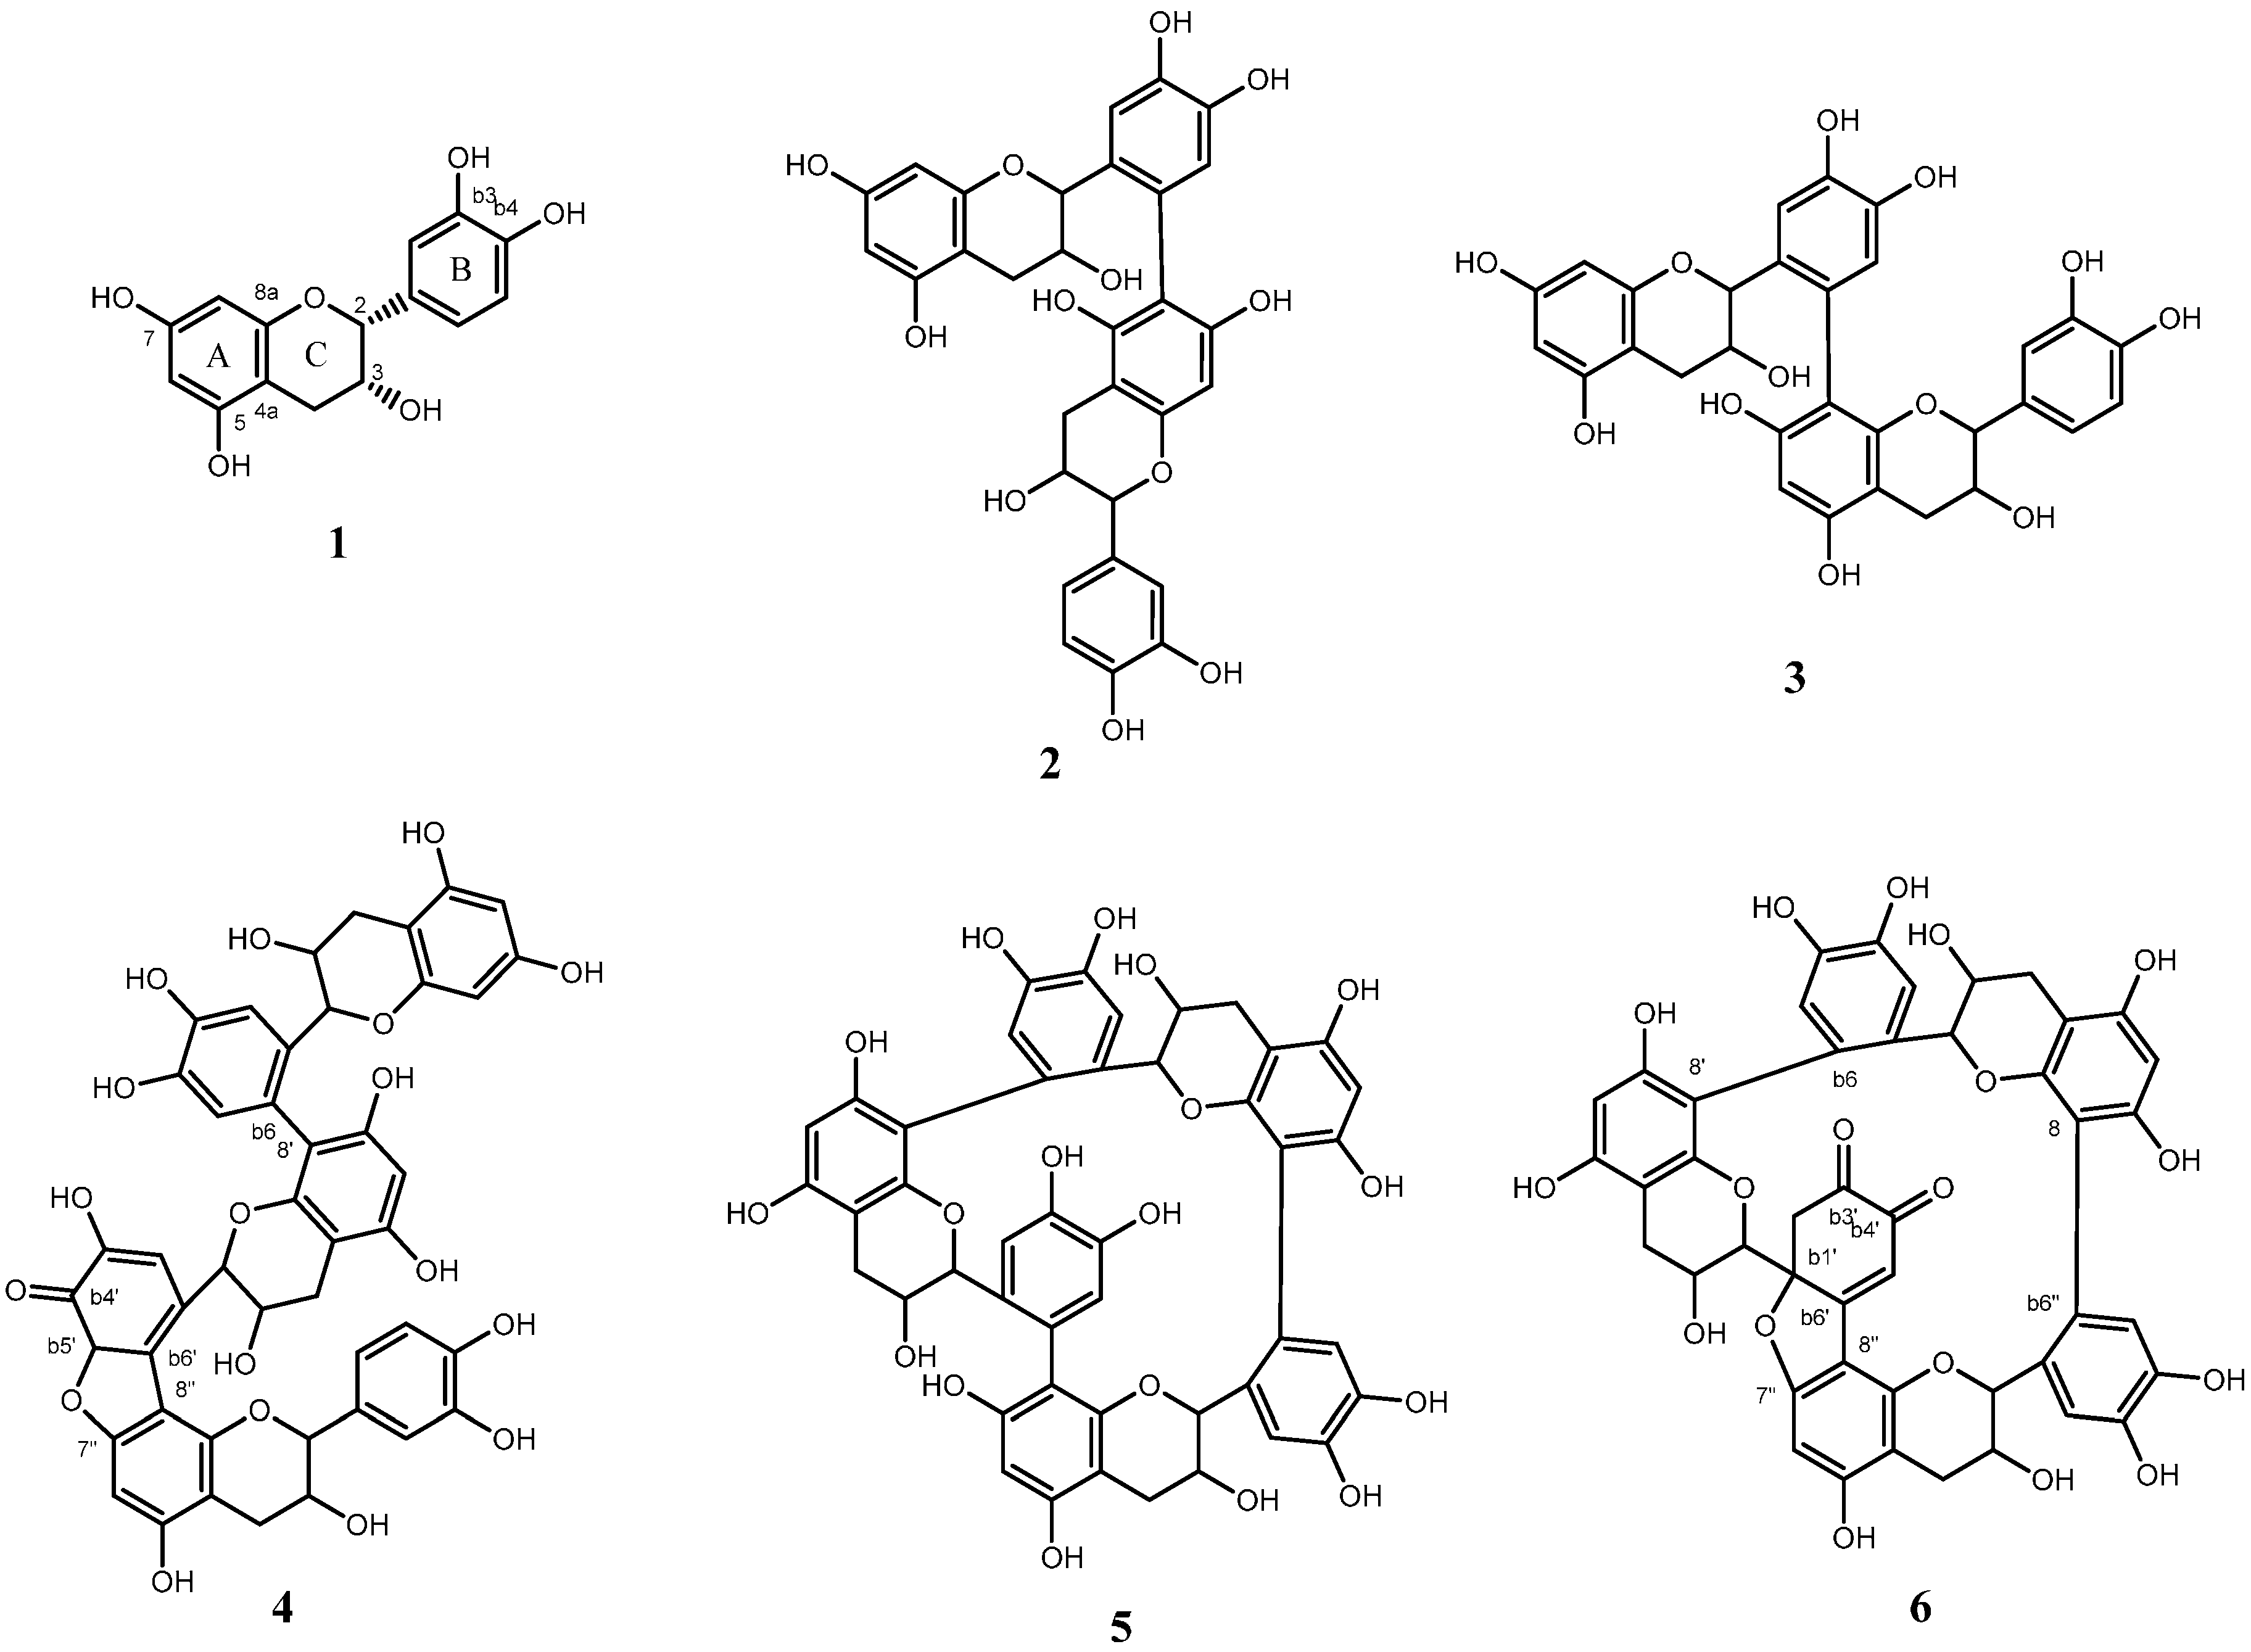
2.1. Structure Determination for Peaks c and d
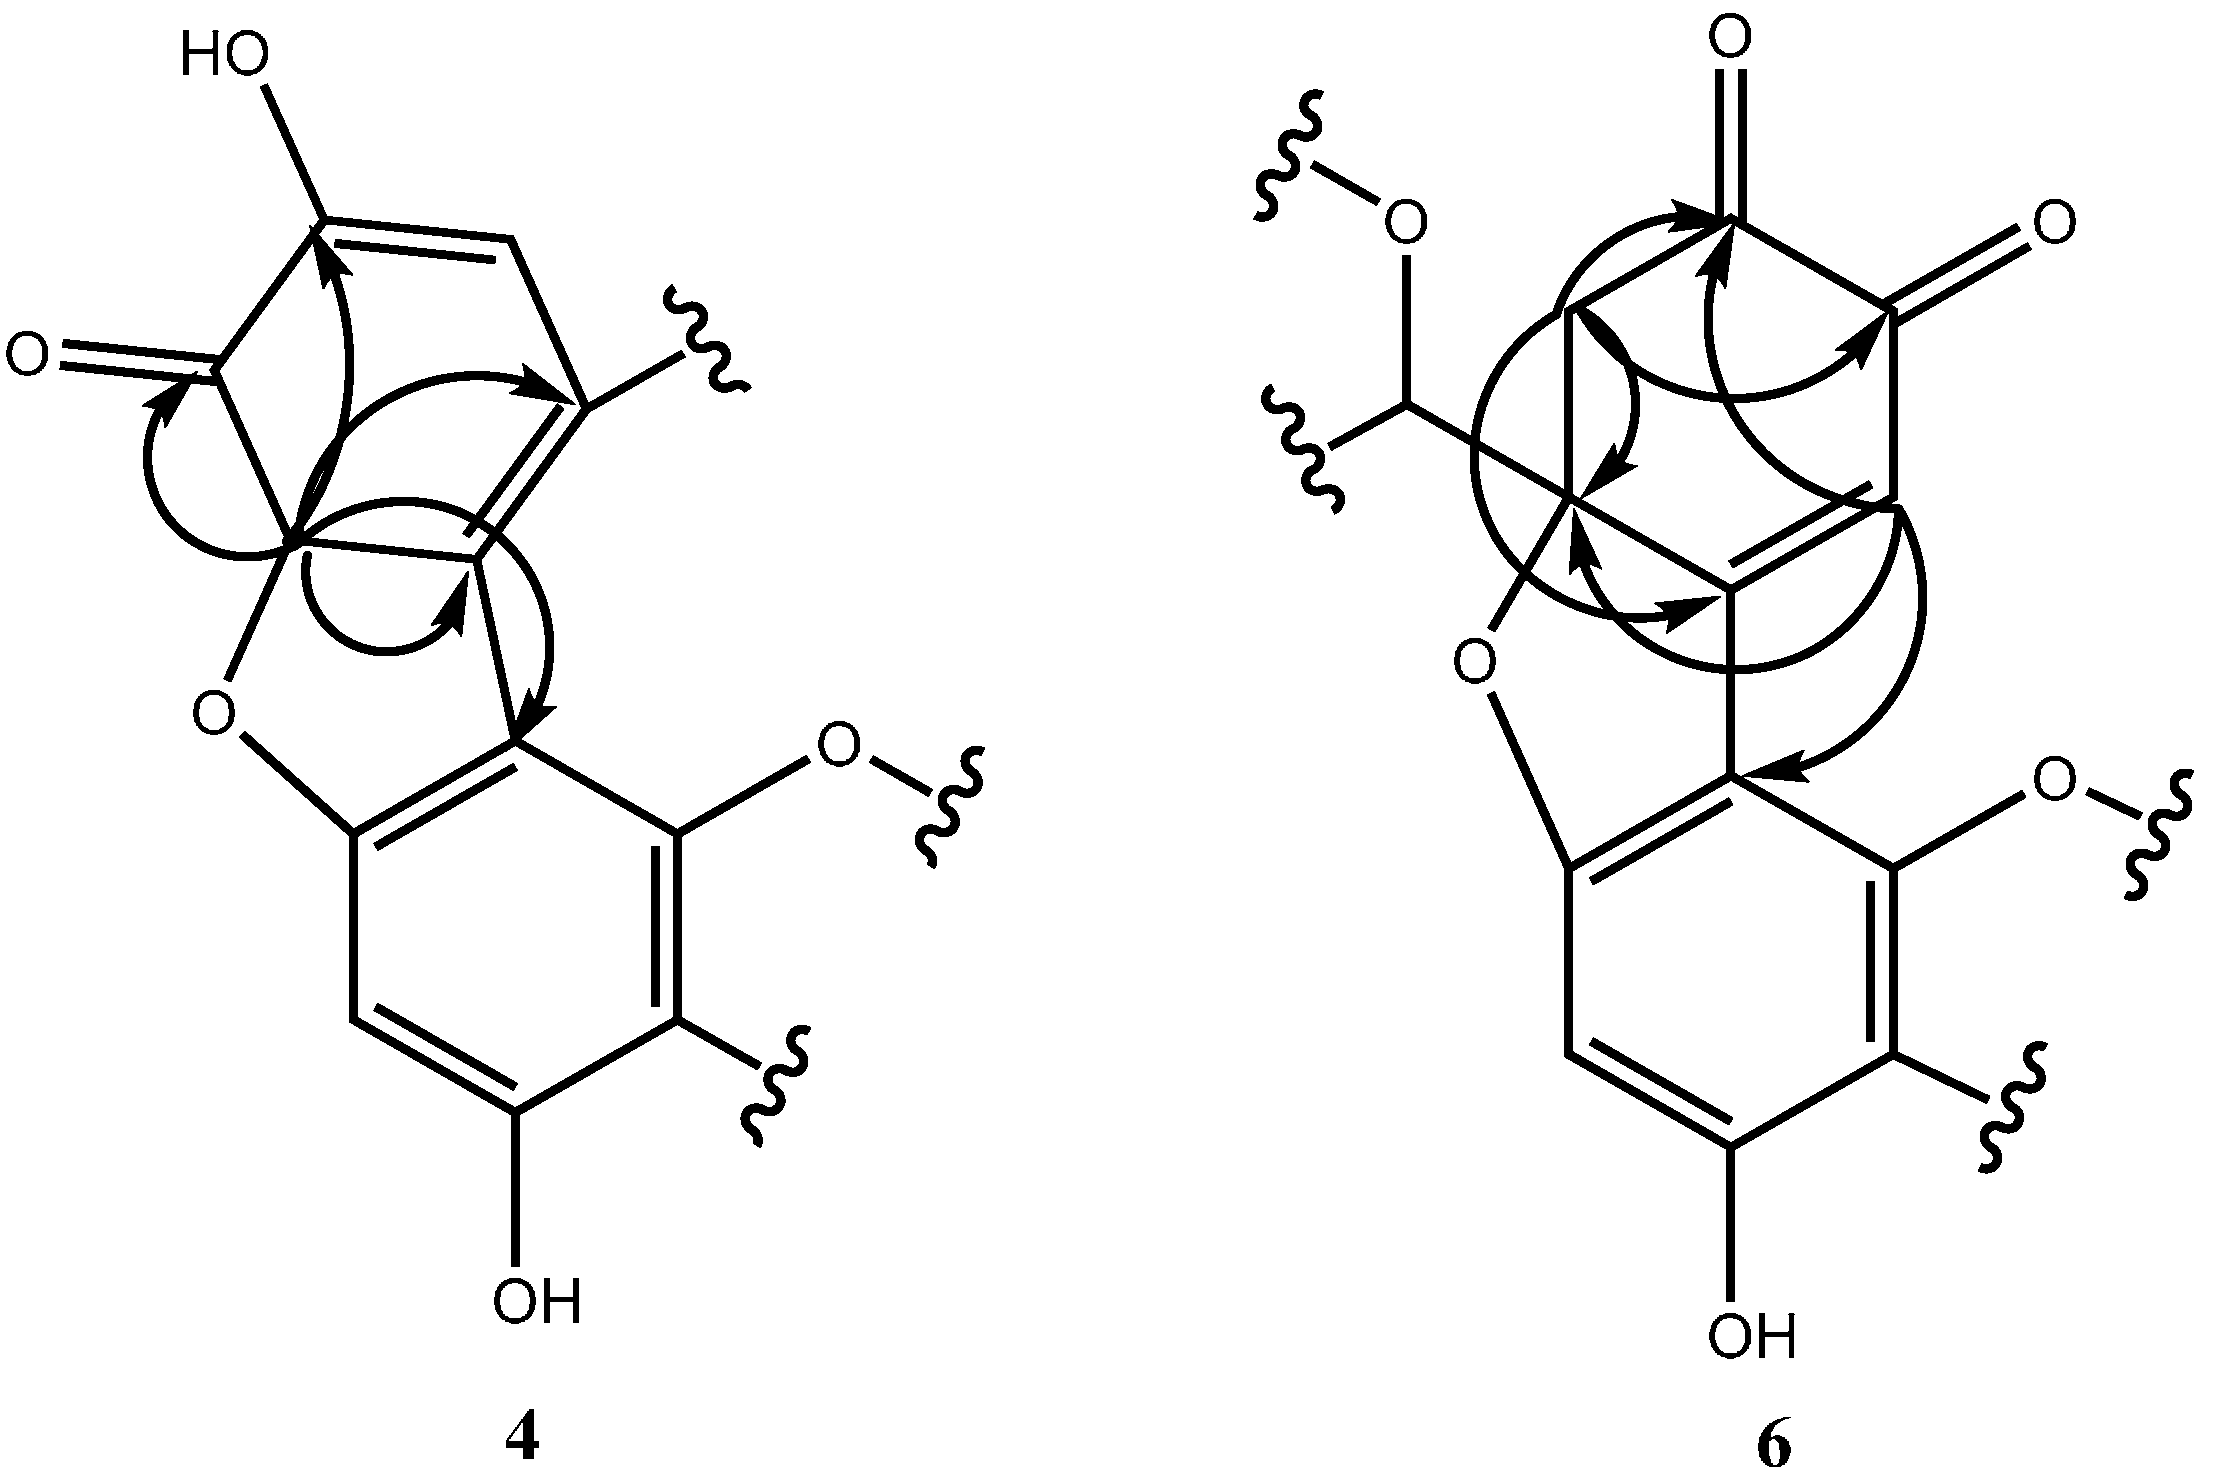
2.2. Structure Determination for Peak e
2.3. Structure Determination for Peaks a and b
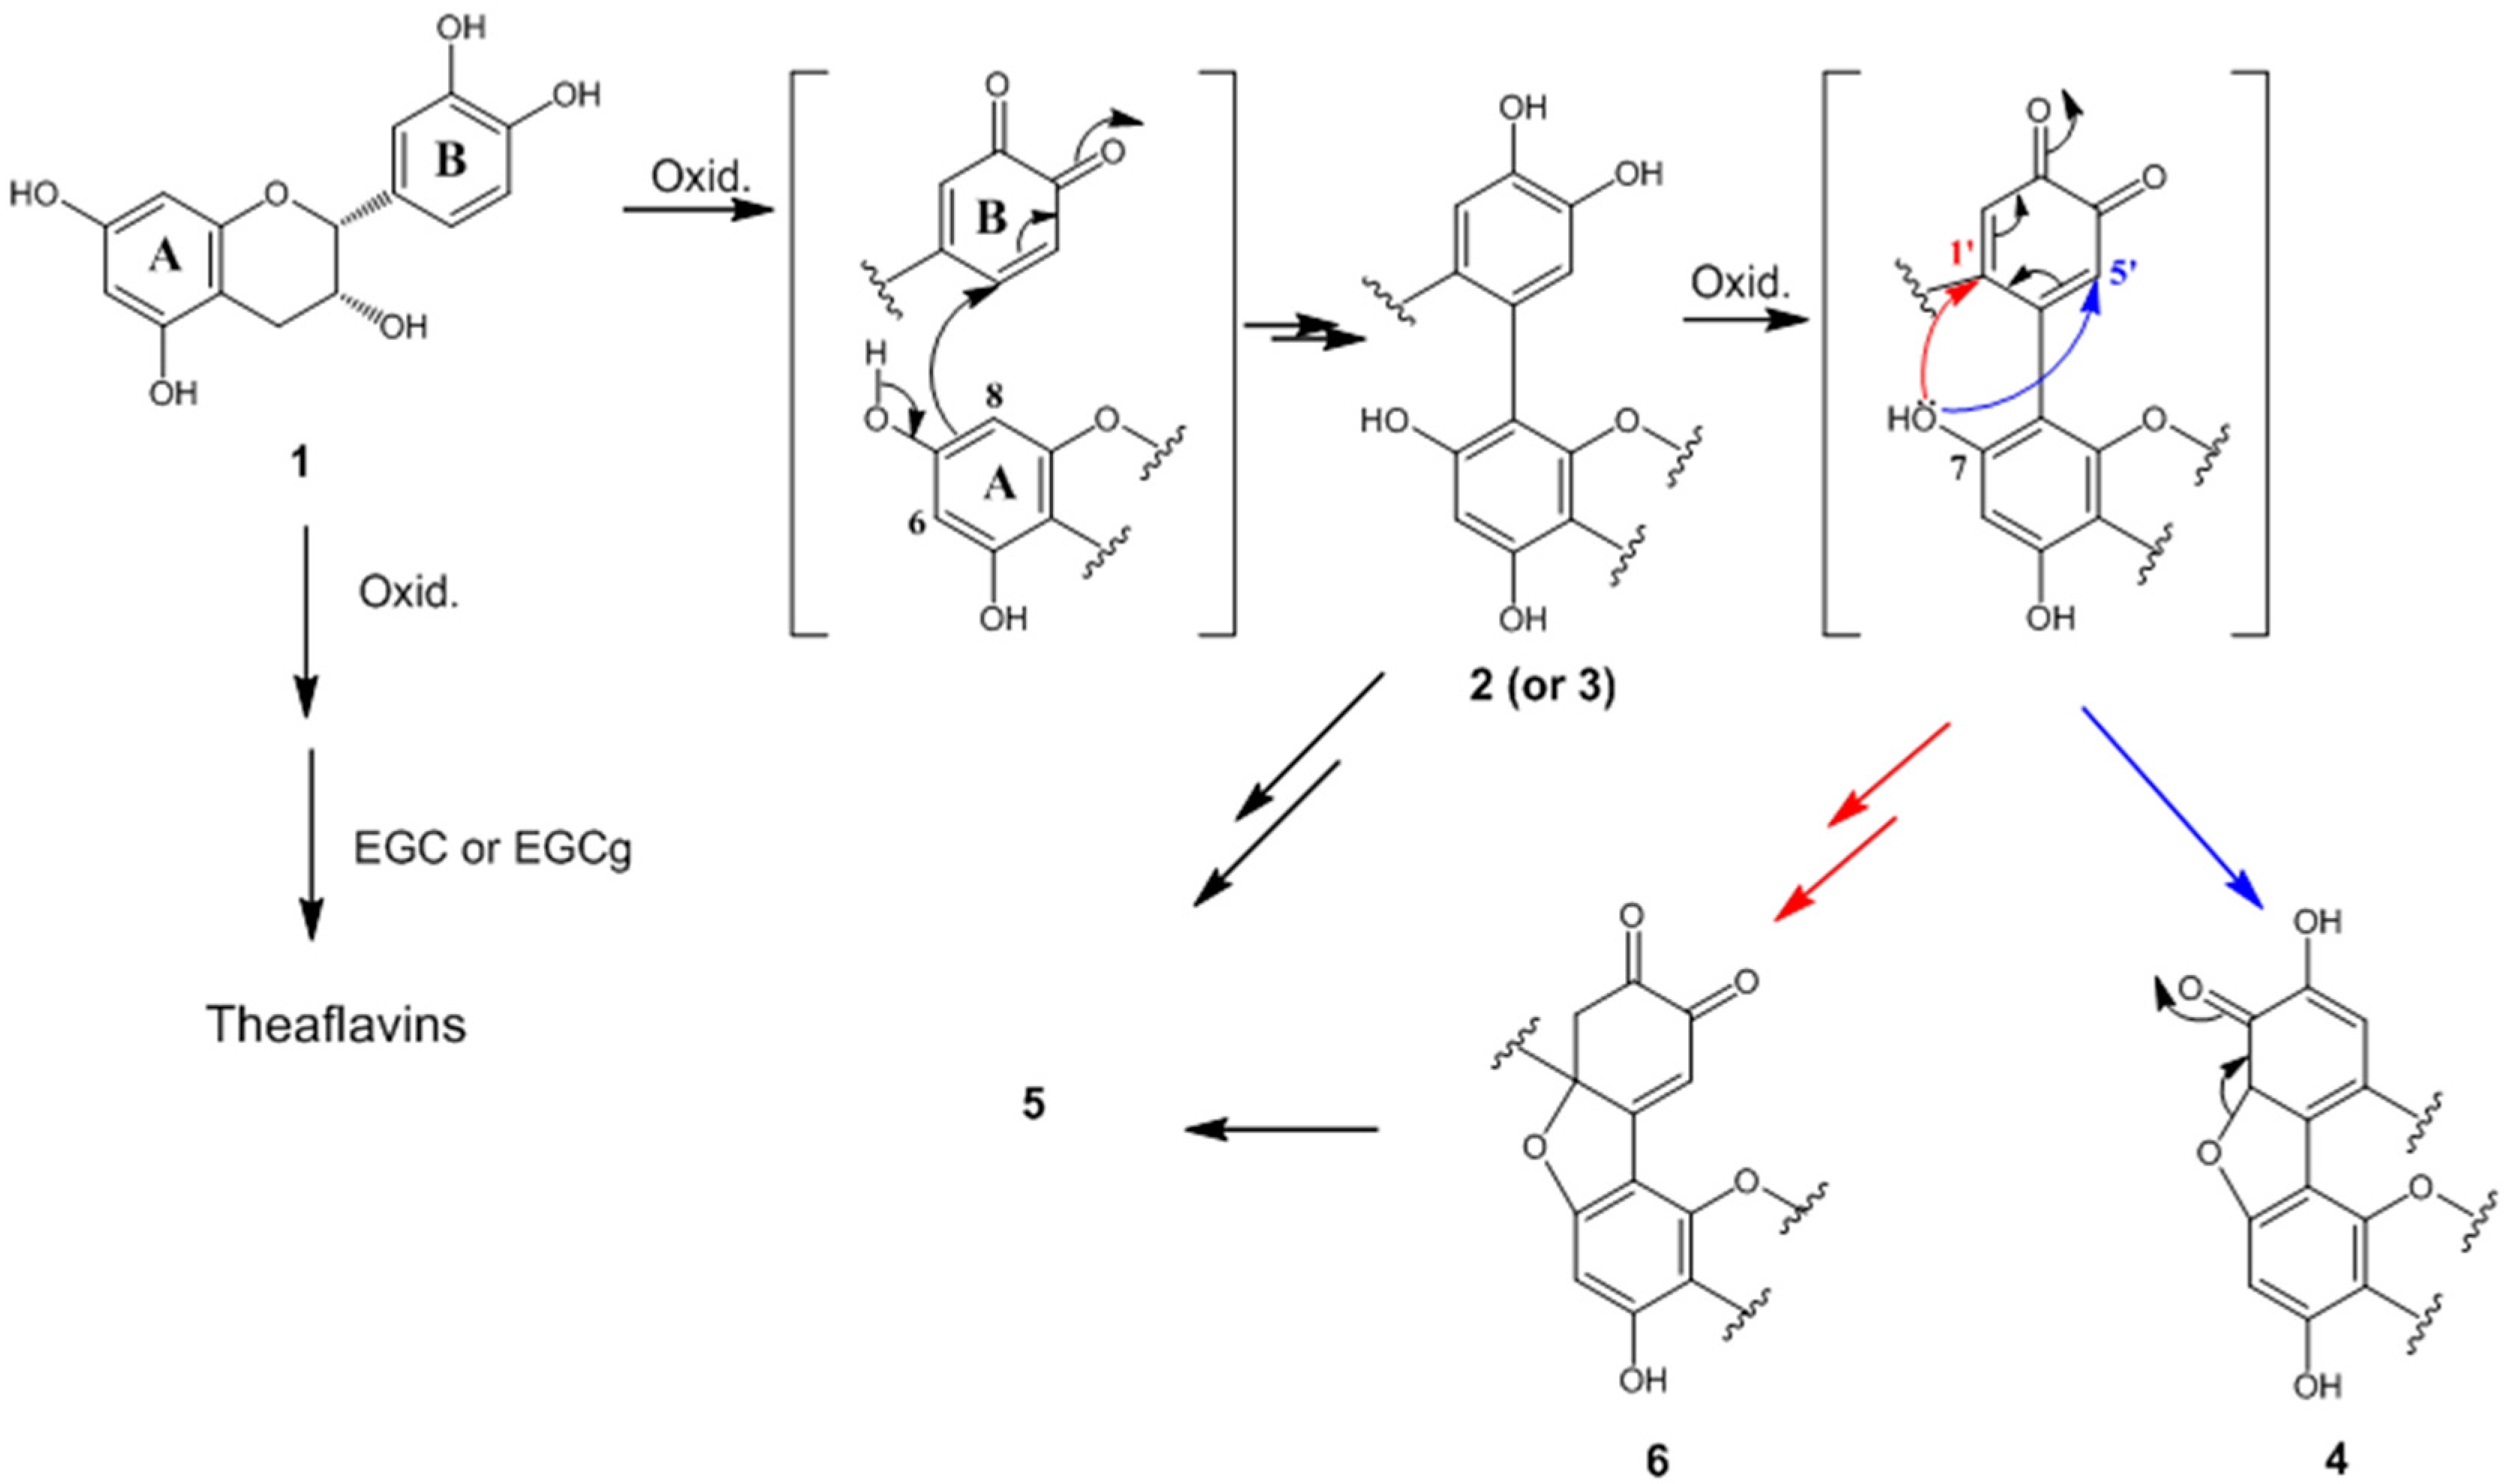
2.4. Formation Mechanisms of Compounds 2–6
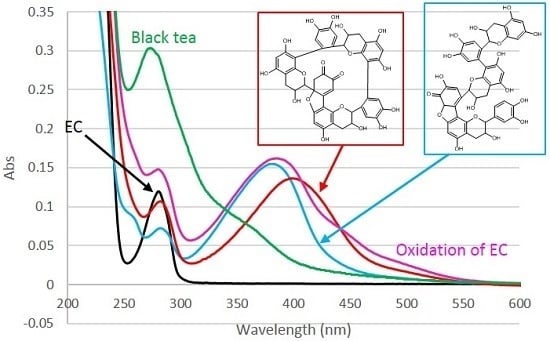
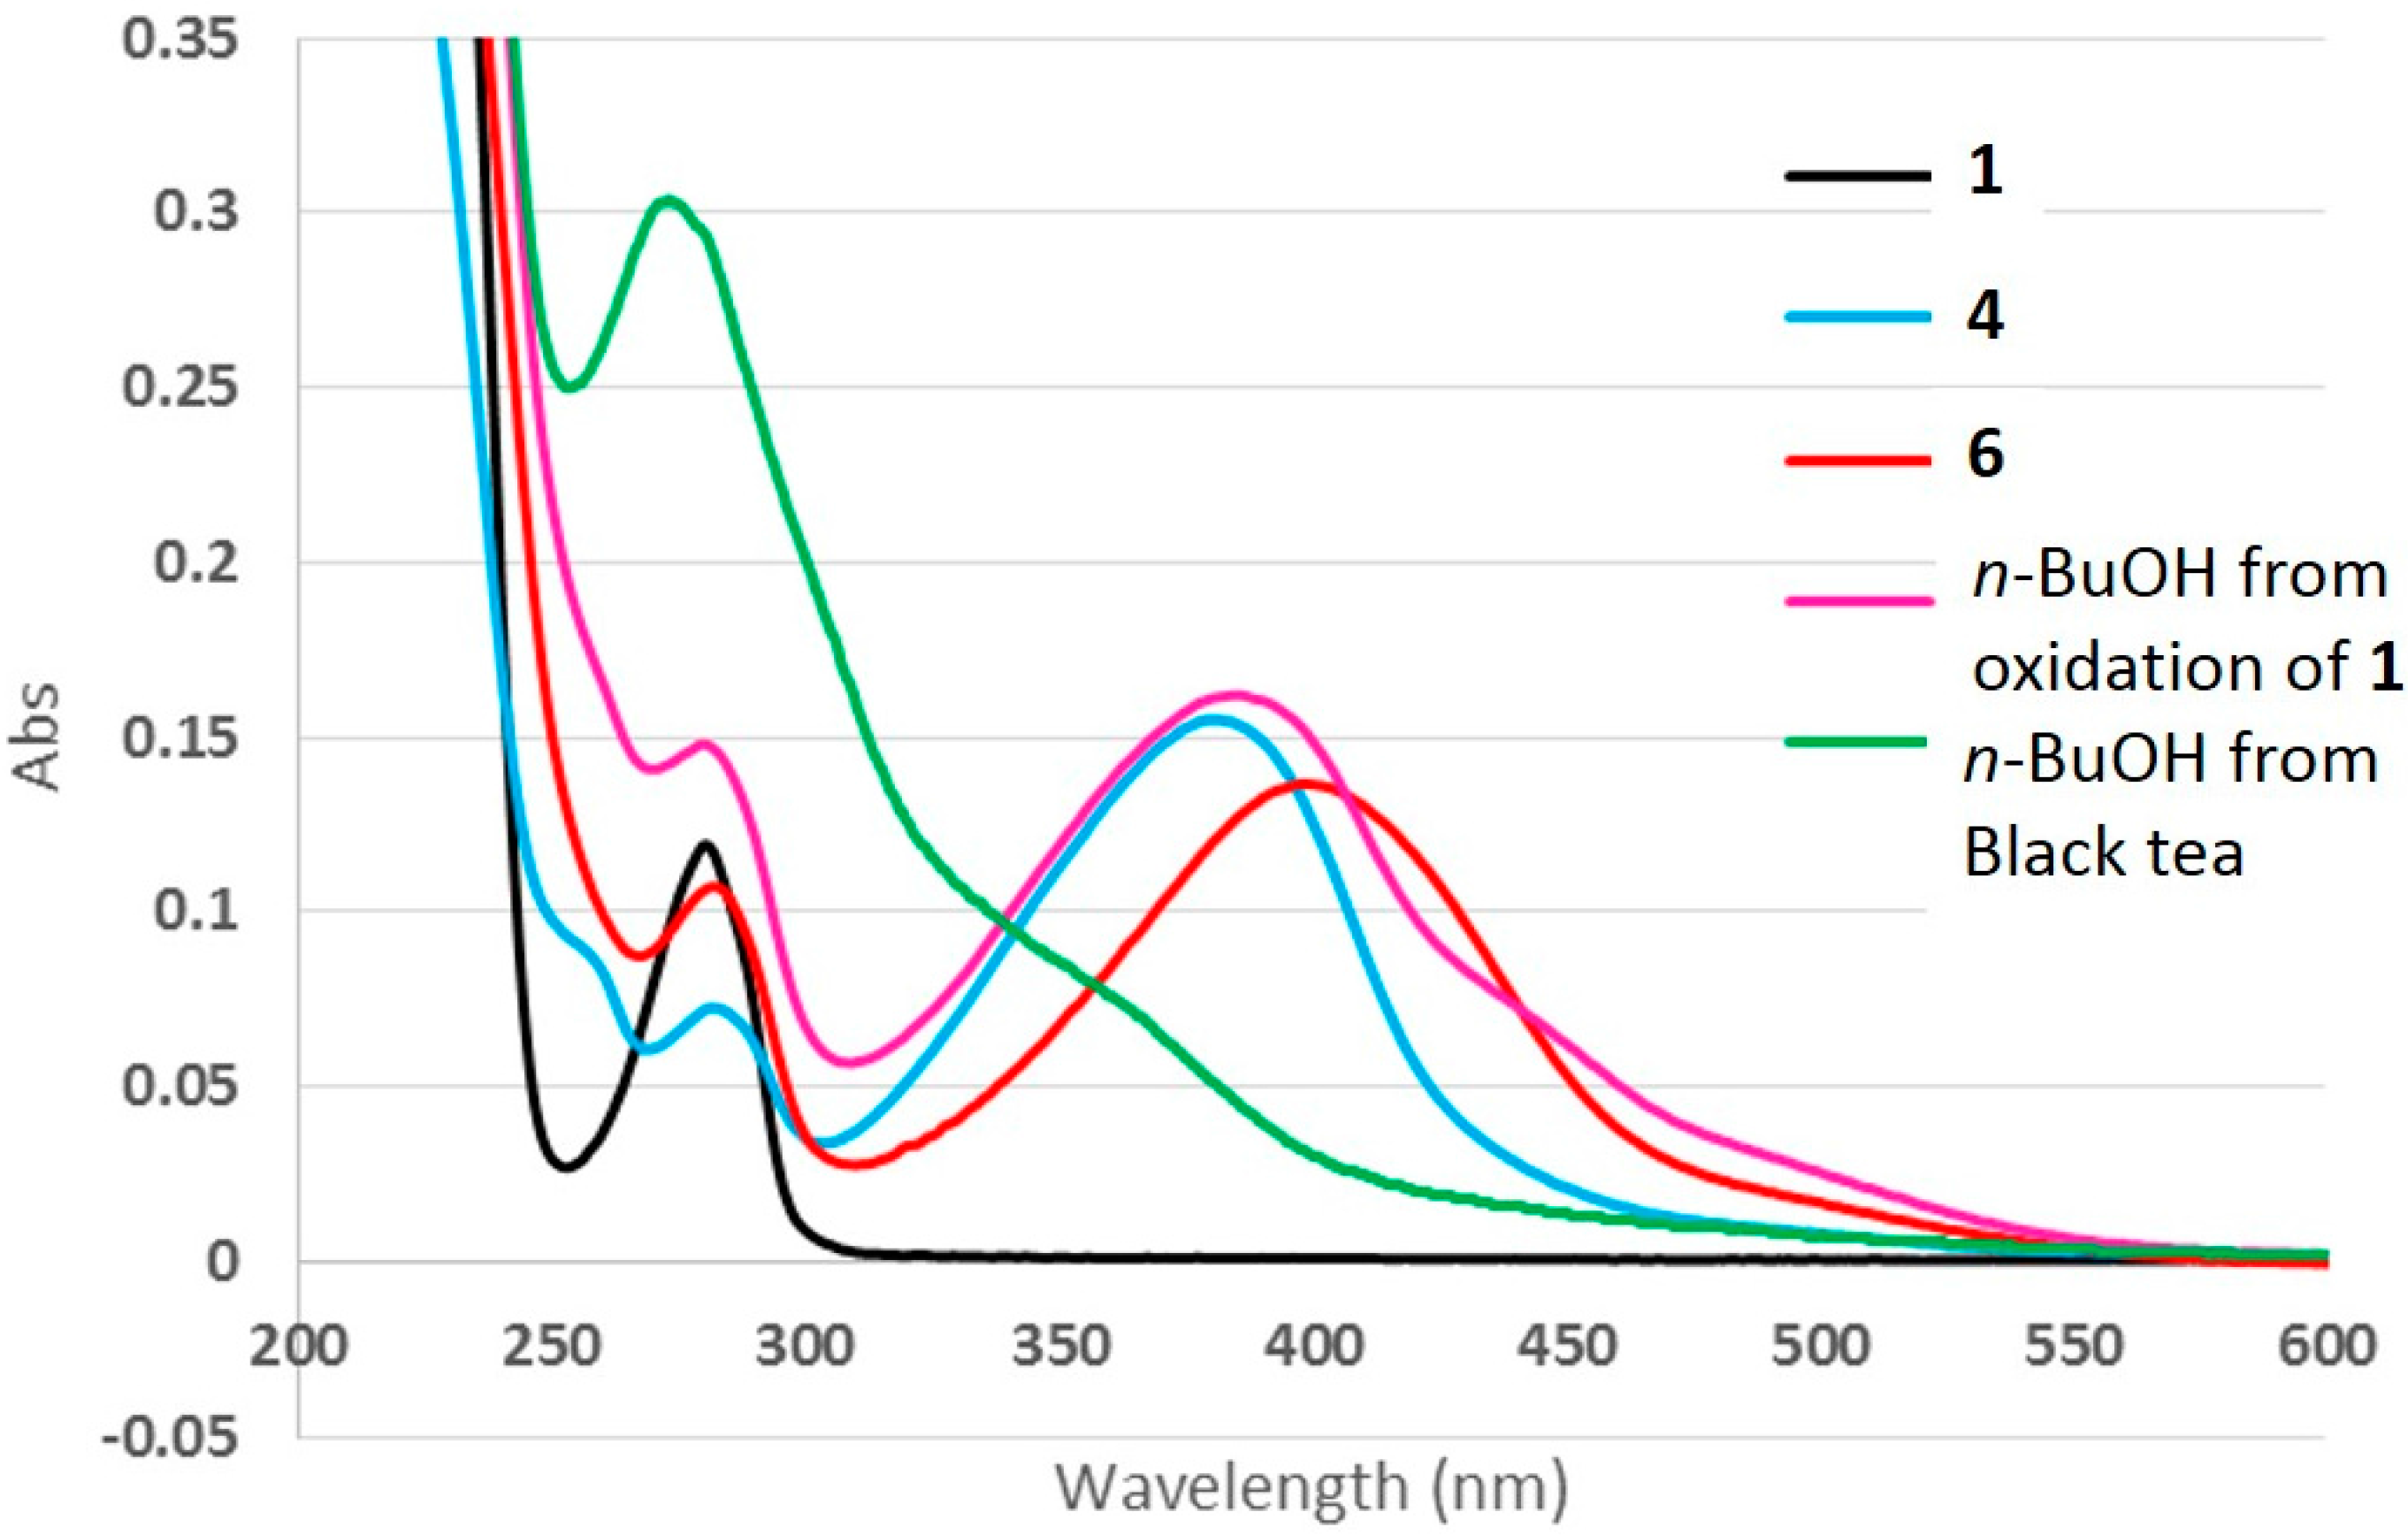
2.5. UV-Vis Spectra
3. Experimental Section
3.1. Materials
3.2. Instrumentation
3.3. Synthesis of a and b
3.4. Synthesis of c and d
3.5. Synthesis of e
3.6. Extraction of Black Tea
3.7. UV-Vis Spectra
4. Conclusions
Acknowledgments
Author Contributions
Conflicts of Interest
Abbreviations
| EC | Epicatechin |
| HPLC | High-performance liquid chromatography |
| ESIMS | Electrospray ionization mass spectrometry |
| NMR | Nuclear magnetic resonance |
| COSY | Correlation spectroscopy |
| HMQC | Heteronuclear multiple quantum coherence |
| HMBC | Heteronuclear multiple-bond correlation |
References
- Roberts, E.A.H. Economic importance of flavonoid substances: Tea fermentation. In The Chemistry of Flavonoid Compounds; Geissman, T.A., Ed.; Pergamon Press: Oxford, UK, 1962; pp. 468–512. [Google Scholar]
- Haslam, E. Thoughts on thearubigins. Phytochemistry 2003, 64, 61–73. [Google Scholar] [CrossRef]
- Tanaka, T.; Kouno, I. Oxidation of tea catechins: Chemical structures and reaction mechanism. Food Sci. Technol. Res. 2003, 9, 128–133. [Google Scholar] [CrossRef]
- Yassin, G.H.; Koek, J.H.; Kuhnert, N. Model system-based mechanistic studies of black tea thearubigin formation. Food Chem. 2015, 180, 272–279. [Google Scholar] [CrossRef] [PubMed]
- Takino, Y.; Imagawa, H.; Horikawa, H.; Tanaka, A. Studies on the mechanism of the oxidation of tea leaf catechins: Part III. Formation of a reddish orange pigment and its spectral relationship to some benzotropolone derivatives. Agric. Biol. Chem. 1964, 28, 64–71. [Google Scholar] [CrossRef]
- Brown, A.G.; Falshaw, C.P.; Haslam, E.; Holmes, A.; Ollis, W.D. The constitution of theaflavin. Tetrahedron Lett. 1966, 7, 1193–1204. [Google Scholar] [CrossRef]
- Collier, P.D.; Bryce, T.; Mallows, R.; Thomas, P.E.; Frost, D.J.; Korver, O.; Wilkins, C.K. The theaflavins of black tea. Tetrahedron 1973, 29, 125–142. [Google Scholar] [CrossRef]
- Shiraki, M.; Hara, Y.; Osawa, T.; Kumon, H.; Nakayama, T.; Kawakishi, S. Antioxidative and antimutagenic effects of theaflavins from black tea. Mutat. Res. Lett. 1994, 323, 29–34. [Google Scholar] [CrossRef]
- Yanase, E.; Sawaki, K.; Nakatsuka, S. The isolation of a bicyclo[3.2.1] intermediate during formation of benzotropolones, a common nucleus found in black tea pigments: Theaflavins. Synlett 2005, 2661–2663. [Google Scholar]
- Ikeda, I.; Yamahira, T.; Kato, M.; Ishikawa, A. Black-tea polyphenols decrease micellar solubility of cholesterol in vitro and intestinal absorption of cholesterol in rats. J. Agric. Food Chem. 2010, 58, 8591–8595. [Google Scholar] [CrossRef] [PubMed]
- Sang, S.; Cheng, X.; Stark, R.E.; Rosen, R.T.; Yang, C.S.; Ho, C.T. Chemical studies on antioxidant mechanism of tea catechins: Analysis of radical reaction products of catechin and epicatechin with 2,2-diphenyl-1-picrylhydrazyl. Bioorg. Med. Chem. 2002, 10, 2233–2237. [Google Scholar] [CrossRef]
- Sample Availability: Samples of the compounds are not available from the authors.


© 2016 by the authors. Licensee MDPI, Basel, Switzerland. This article is an open access article distributed under the terms and conditions of the Creative Commons by Attribution (CC-BY) license ( http://creativecommons.org/licenses/by/4.0/).
Share and Cite
Uchida, K.; Ogawa, K.; Yanase, E. Structure Determination of Novel Oxidation Products from Epicatechin: Thearubigin-Like Molecules. Molecules 2016, 21, 273. https://doi.org/10.3390/molecules21030273
Uchida K, Ogawa K, Yanase E. Structure Determination of Novel Oxidation Products from Epicatechin: Thearubigin-Like Molecules. Molecules. 2016; 21(3):273. https://doi.org/10.3390/molecules21030273
Chicago/Turabian StyleUchida, Kazuhiro, Kazuki Ogawa, and Emiko Yanase. 2016. "Structure Determination of Novel Oxidation Products from Epicatechin: Thearubigin-Like Molecules" Molecules 21, no. 3: 273. https://doi.org/10.3390/molecules21030273