Article

Acetaminophen Induced Hepatotoxicity in Wistar Rats—A Proteomic Approach

by
Soundharrajan Ilavenil
1,†,
Naif Abdullah Al-Dhabi
2,†,
Srisesharam Srigopalram
1,
Young Ock Kim
3,
Paul Agastian
4,
Rajasekhar Baru
5,
Ki Choon Choi
1,* and
Mariadhas Valan Arasu
2,*
1
Grassland and Forage Division, National Institute of Animal Science, RDA, Seonghwan-Eup, Cheonan-Si, Chungnam 330801, Korea
2
Department of Botany and Microbiology, Addiriyah Chair for Environmental Studies, College of Science, King Saud University, P. O. Box 2455, Riyadh 11451, Saudi Arabia
3
Department of Medicinal Crop Research, Rural Development Administration, Eumseong, Chungbuk 369-873, Korea
4
Research Department of Plant Biology and Biotechnology, Loyola College, Nungambakkam, Chennai, Tamil Nadu 600 034, India
5
Proteomics Division, Discovery Research, Dr. Reddy’s Laboratories Ltd., Miyapur, Hyderabad-500049, India
*
Authors to whom correspondence should be addressed.
These authors contributed equally to this work.
Molecules 2016, 21(2), 161; https://doi.org/10.3390/molecules21020161
Submission received: 19 November 2015 / Revised: 31 December 2015 / Accepted: 22 January 2016 / Published: 28 January 2016
(This article belongs to the Section Medicinal Chemistry)

Abstract

:
Understanding the mechanism of chemical toxicity, which is essential for cross-species and dose extrapolations, is a major challenge for toxicologists. Standard mechanistic studies in animals for examining the toxic and pathological changes associated with the chemical exposure have often been limited to the single end point or pathways. Toxicoproteomics represents a potential aid to the toxicologist to understand the multiple pathways involved in the mechanism of toxicity and also determine the biomarkers that are possible to predictive the toxicological response. We performed an acute toxicity study in Wistar rats with the prototype liver toxin; the acetaminophen (APAP) effects on protein profiles in the liver and its correlation with the plasma biochemical markers for liver injury were analyzed. Three separate groups—control, nontoxic (150 mg/kg) and toxic dose (1500 mg/kg) of APAP—were studied. The proteins extracted from the liver were separated by 2-DE and analyzed by MALDI-TOF. The differential proteins in the gels were analyzed by BIORAD’s PDQuest software and identified by feeding the peptide mass fingerprint data to various public domain programs like Mascot and MS-Fit. The identified proteins in toxicity-induced rats were classified based on their putative protein functions, which are oxidative stress (31%), immunity (14%), neurological related (12%) and transporter proteins (2%), whereas in non-toxic dose-induced rats they were  oxidative stress (9%), immunity (6%), neurological (14%) and transporter proteins (9%). It is evident that the percentages of oxidative stress and immunity-related proteins were up-regulated in toxicity-induced rats as compared with nontoxic and control rats. Some of the liver drug metabolizing and detoxifying enzymes were depleted under toxic conditions compared with non-toxic rats. Several other proteins were identified as a first step in developing an in-house rodent liver toxicoproteomics database.

1. Introduction

The liver is the largest complex organ in the body which plays an important role in the internal environment maintenance by its multiple functions. It plays a central role in the metabolic pathways of carbohydrates, lipids and proteins. It is also involved in the detoxification and excretion of many endogenous and exogenous compounds by its xenobiotic metabolism. An impairment of its function is a serious health problem. Approximately 18,000 people have died per year in India due to liver function impairment [1].
Acetaminophen (N-acetyl-p-aminophenol; APAP) is widely used as an analgesic and antipyretic drug worldwide. It produces alanine derivatives by hydrolysis, which are directly converted into hydroxylamine. N-Acetyl-p-benzoquinoneimine (NAPQI), is an intermediate product of acetaminophen produced in the presence of cytochrome-p450 that causes hepatic damage [2] and tubular necrosis in the kidney [3] in both humans and experimental animals [4]. In this situation, a large amount of APAP is metabolized by the presence of P450s, which leads to reduced GSH levels by NAPQI conjugation and covalent binding of NAPQI. Acetaminophen’s clinical and biochemical side effects are well known and it is therefore used as a reference compound to assess the strengths and weaknesses of genomic and proteomic technologies as toxicological tools.
Proteomic approaches and complementary global gene expression analysis are important tools for identifying differentially expressed proteins in cells. The protein expression analysis by two dimensional electrophoresis (2DE) and matrix assisted laser desorption/ionization time of flight (MALTI-TOF) were reported for different types of diseases and offered opportunities for identifying new markers and therapeutic targets [5]. Differentially expressed proteins indicates proteins occuring in a specific function that are either the up regulated or down regulated level as compared with normal levels. The differential expression may be a consequence of disease- or disorder-related variations in transcription, translation, transport, degradation and covalent modification [6]. The systematic proteomic approach has been used to identify the proteins which are responsible for abnormal functions in the various cells. Especially, the molecular mechanisms of cell maturation [7] function [8] and pathology [9]. 2D gel electrophoresis was recently used to identify more than 1000 single proteins. The systematic proteomic approach performs different functions like energy production, protein synthesis and turnover, protein folding and transport, cell cycle, apoptosis and oxidative stress, cytoskeleton, flagella movement, signal transduction, cell recognition and metabolism as well as unknown protein functions [10,11,12]. The aim of the present study was to analyze the proteomic changes in male Wistar rat liver associated with toxicity induced by acetaminophen.

2. Results

2.1. Biochemical Analysis

Plasma alanine amino transferase (ALT) and aspartate amino transferase (AST) levels identified by the routine clinical chemistry showed marked increases at the APAP concentration of mg/kg. The results are summarized in Table 1.
Table 1. AST and ALT activity of experimental group of rats.
Enzymes (IU/L)Acetaminophen (mg/kg)
0 (Control)1501500
Aspartate aminotransferase139 ± 4.9115 ± 2.4251 ± 1.2
Alanine aminotransferase083 ± 1.5076 ± 1.1130 ± 8.5
The control liver histopathological sections exhibited well preserved hepatocytes, nuclei, and cytoplasms with proper central veins, whereas slightly damaged hepatocytes and improper cytoplasm distribution, and infiltration of inflammatory cells around the central vein were noted in toxic dose-induced rats. Almost similar architecture was showed in non-toxic dose-induced rats (Figure 1).
Figure 1. Histopathological analysis of experimental liver tissues. A—Control, B—Non toxic dose, C—Toxic dose induced liver tissue. N—Nucleus, H—Hepatocyte, CV—Central vein, IF—Inflammatory cells.
Molecules 21 00161 g001

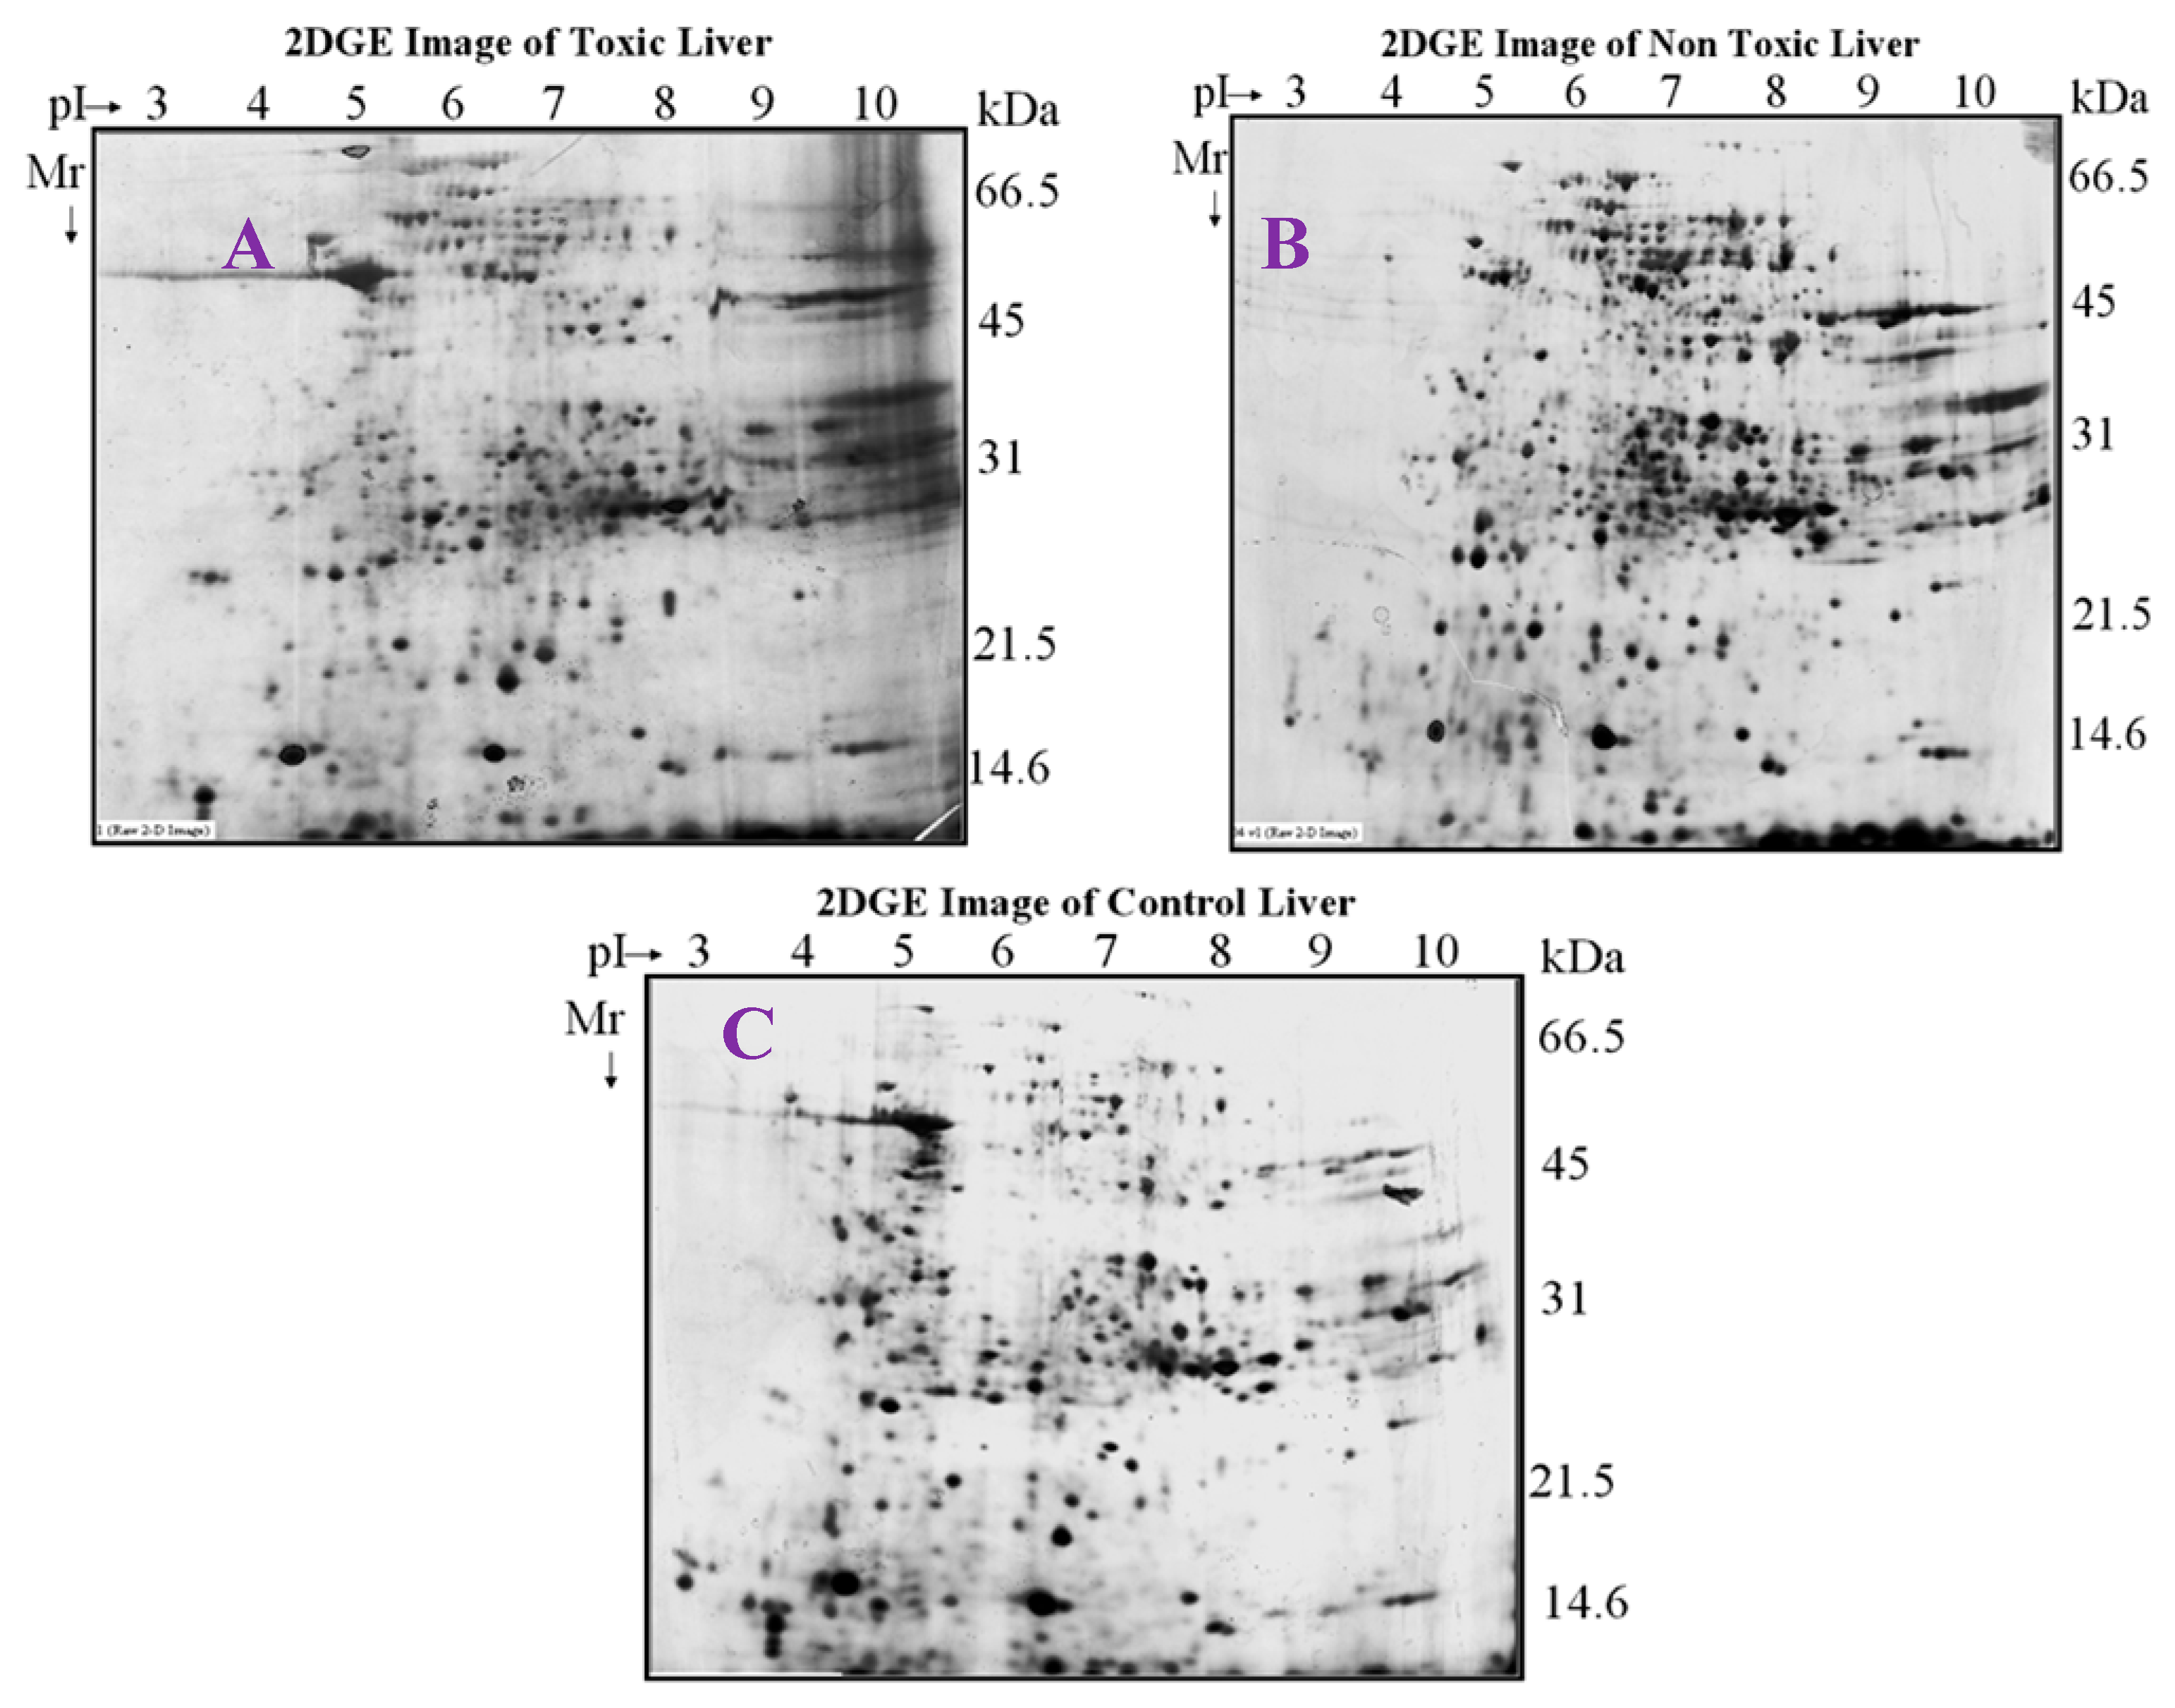
2.2. 2D Gel Analysis
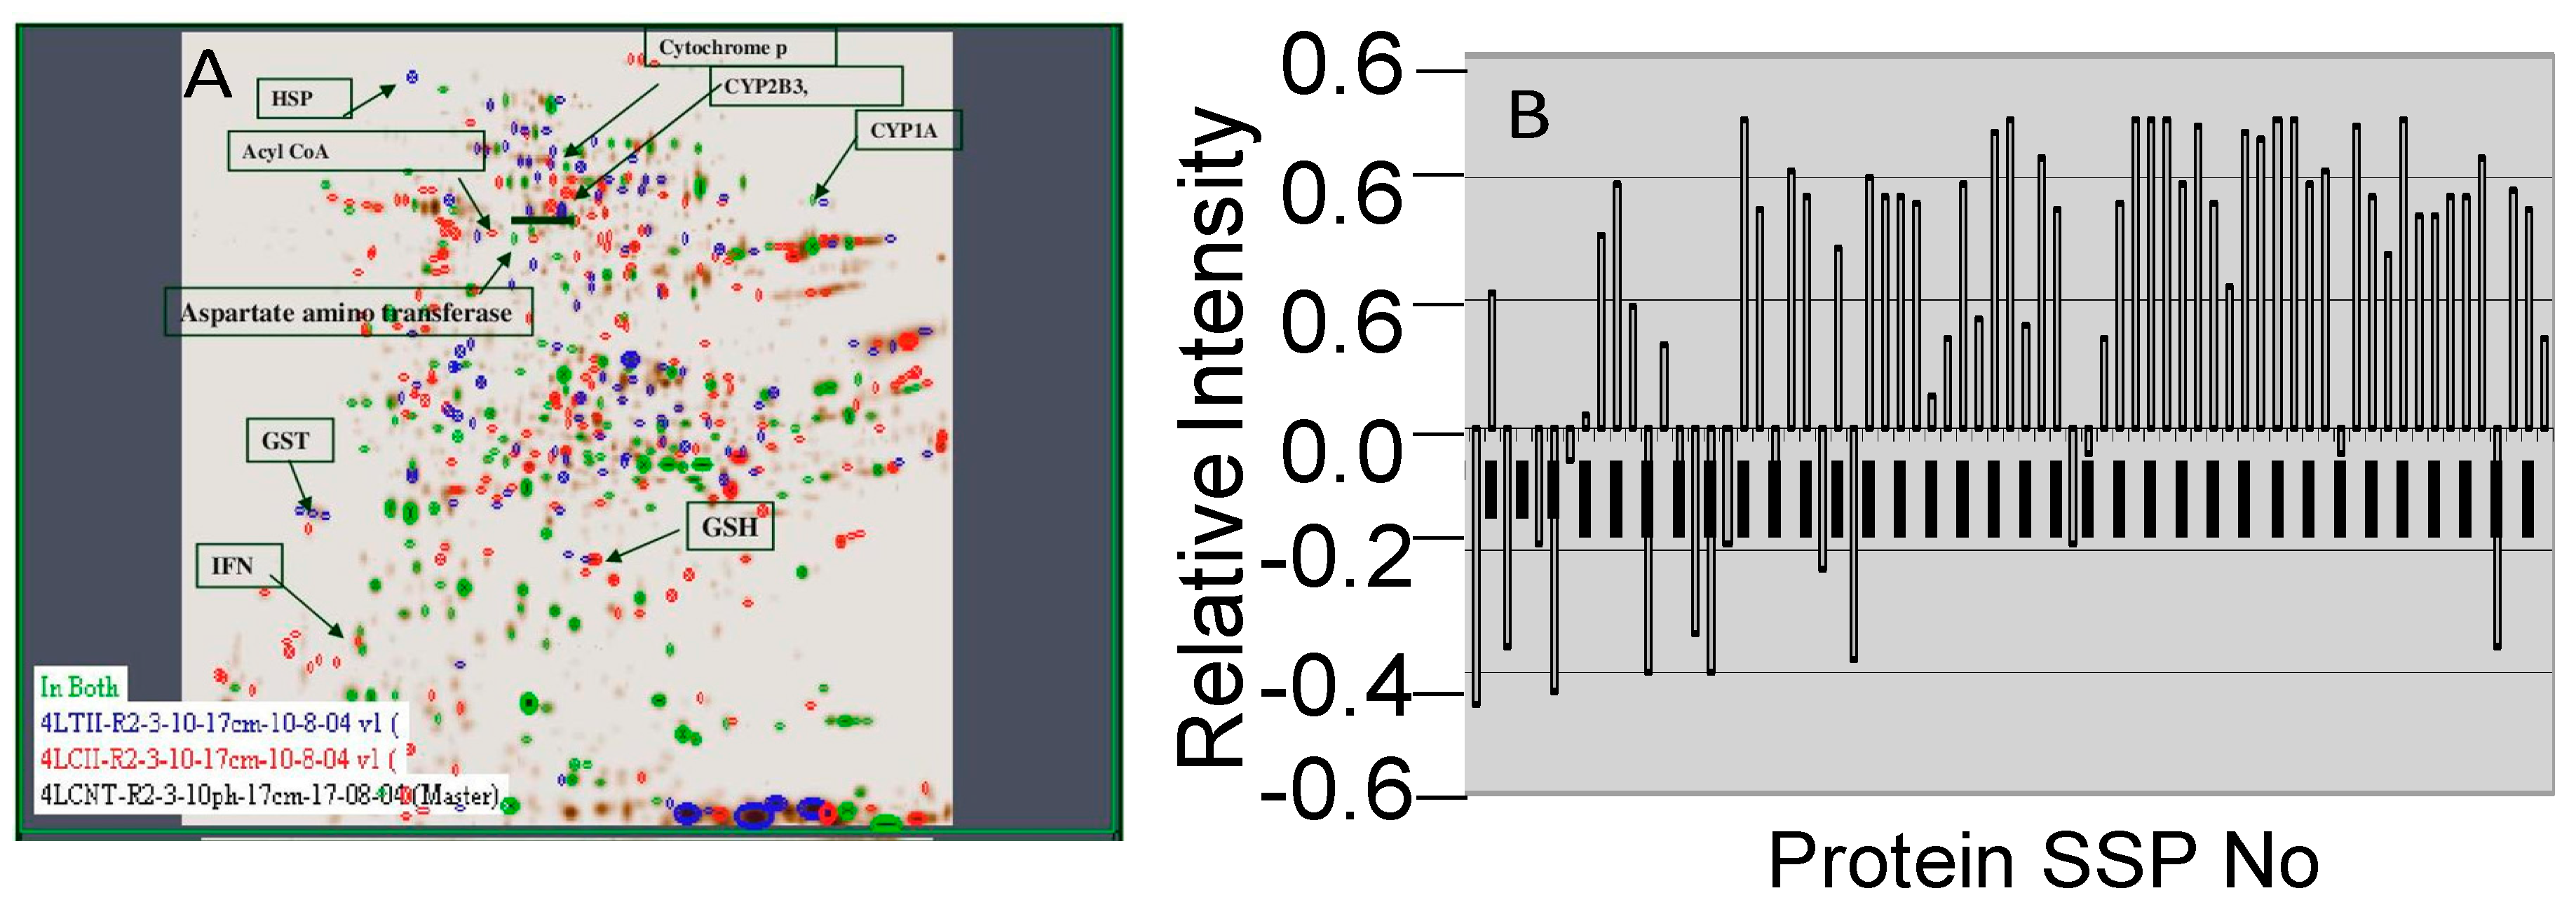
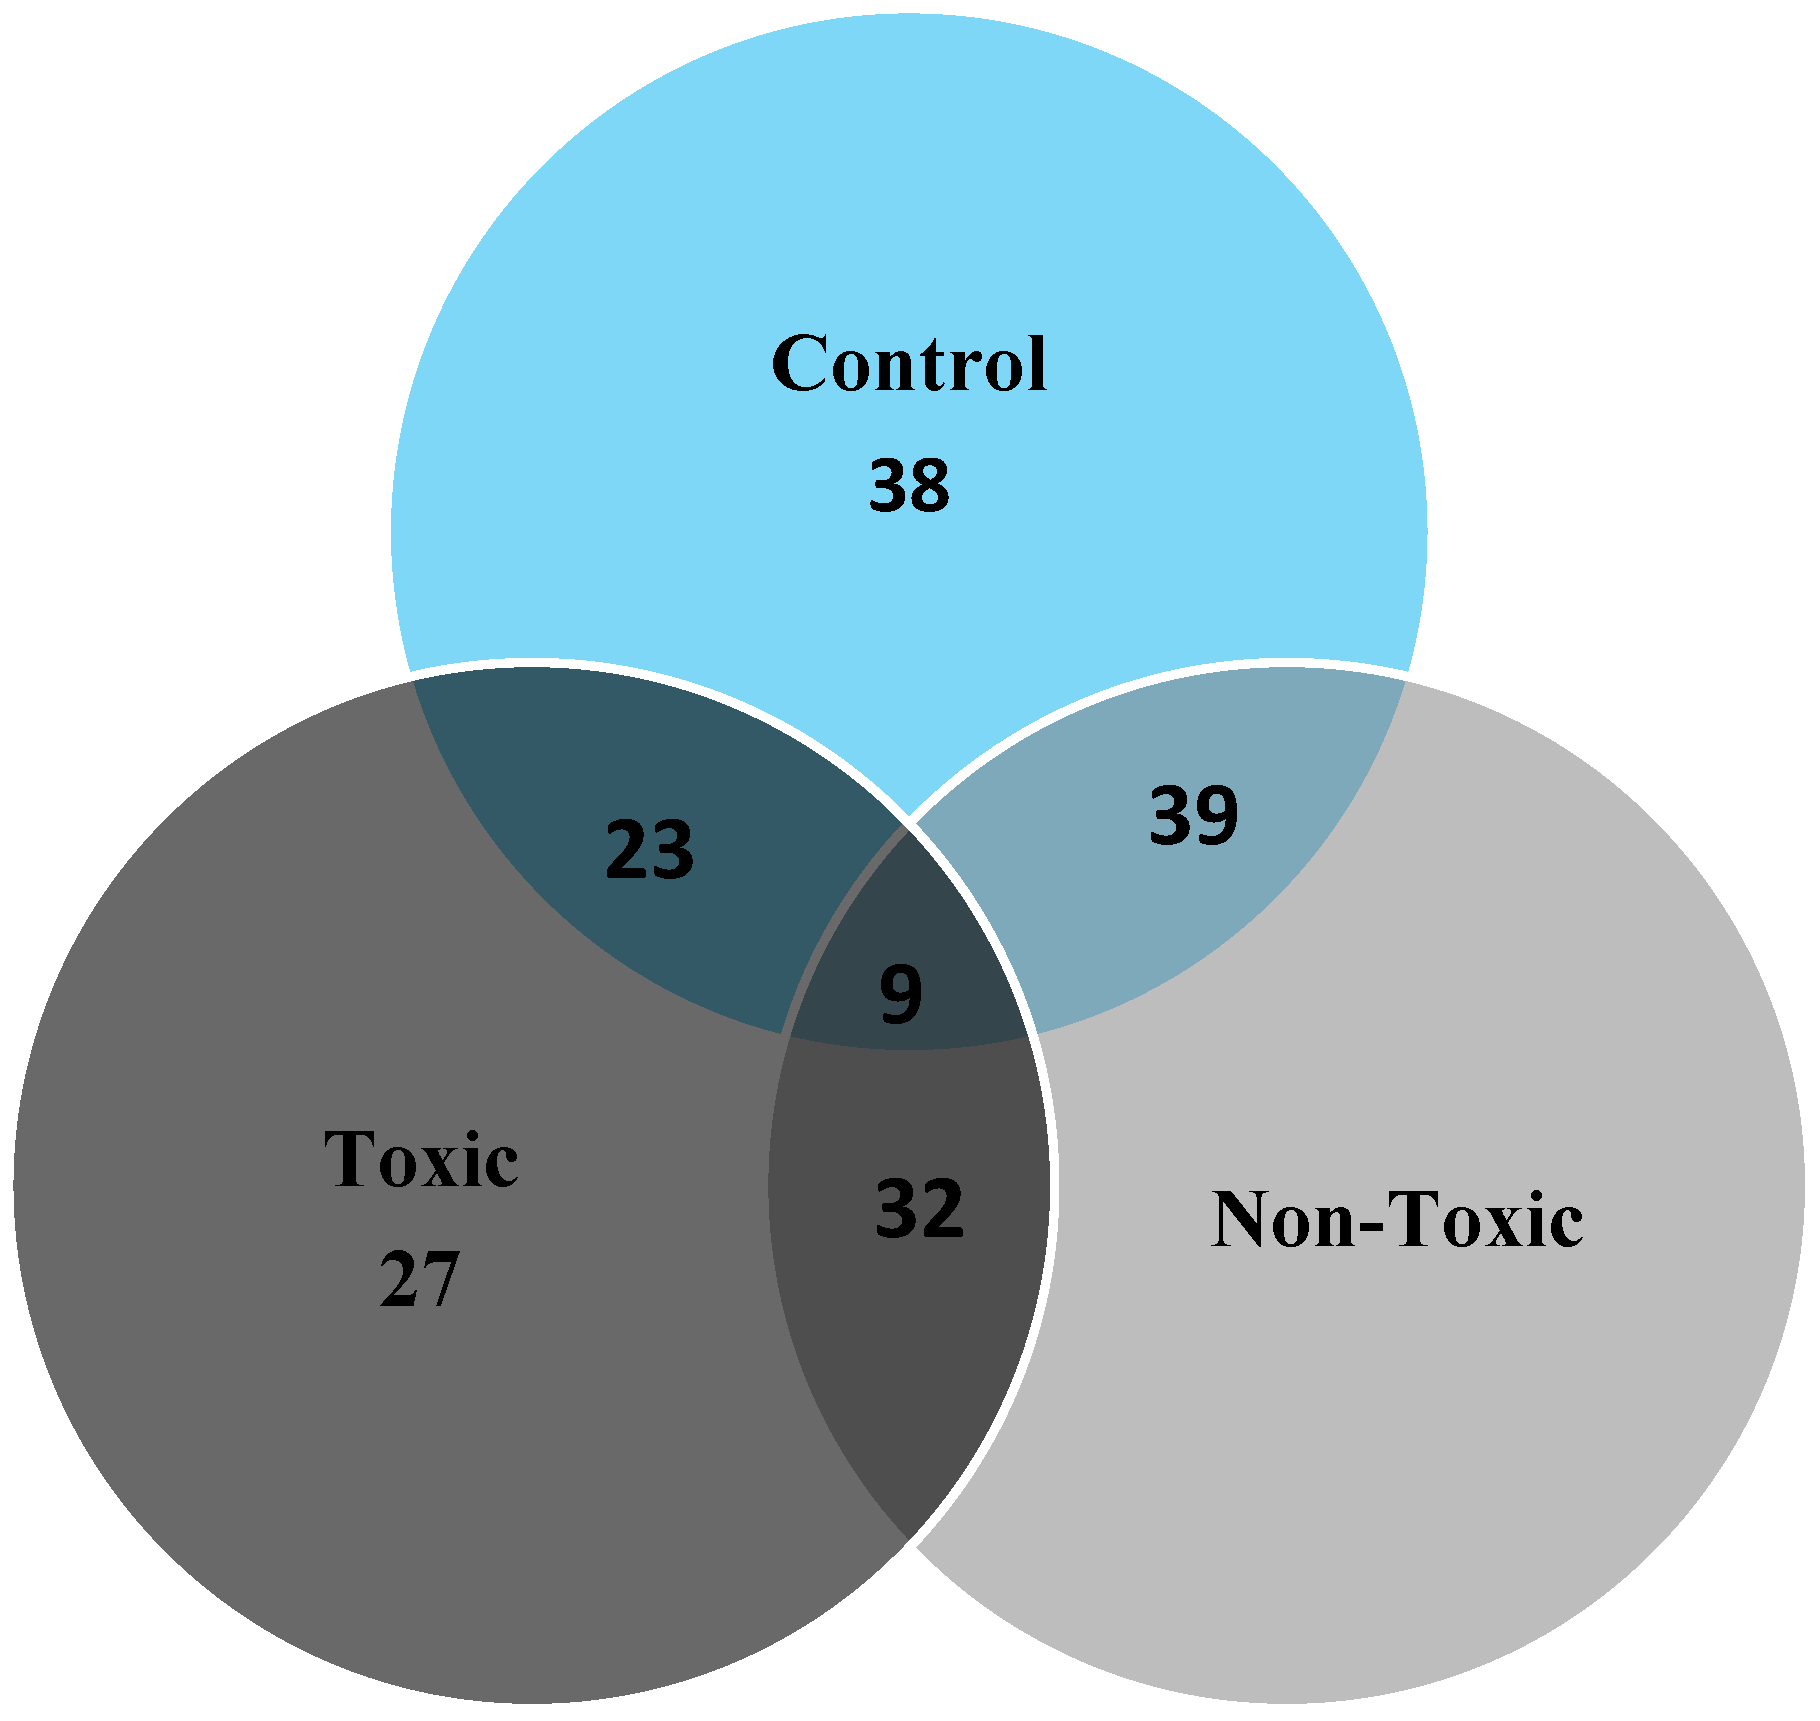
The proteins in the toxic, non-toxic and normal livers were separated by 2-DE on large format gels (17 × 20 cm, Figure 2). Comparison of the toxic, normal, and non-toxic dosed liver tissues protein profiles revealed significant quantitative and qualitative differences. Twenty three (23) spots were differentially expressed between control vs. toxic doses of the liver tissue and 39 spots were differentially expressed between the control vs. non-toxic doses of liver tissues, similarly, 32 spots were significantly expressed as differential protein spots between toxic and non-toxic doses.
Figure 2. 2D map of experimental rat liver. Liver proteins were separated by pH gradient 3–10 by 12% SDS-PAGE. A—Control, B—Non-toxic dose (150 mg/kg), C—Toxic dose (1500 mg/kg).
Molecules 21 00161 g002
Spots in the gel were cut and the corresponding proteins identified were indicated in Figure 3A. The relative expression levels of the proteins in experimental rats were showed in the graphical representation (Figure 3B). It showed their corresponding SSP numbers on the X axis and their relative intensities on Y-axis.
Figure 3. Master gel image (A) and relative expression of proteins (B).
Molecules 21 00161 g003

2.3. Image Analysis

Image analysis of the toxic, non-toxic and normal liver tissues showed number of differential proteins that were summarized in the Venn diagram (Figure 4).
Figure 4. Venn graphical representation of no.of spots in the control, non-toxic and toxic dose rats.
Molecules 21 00161 g004

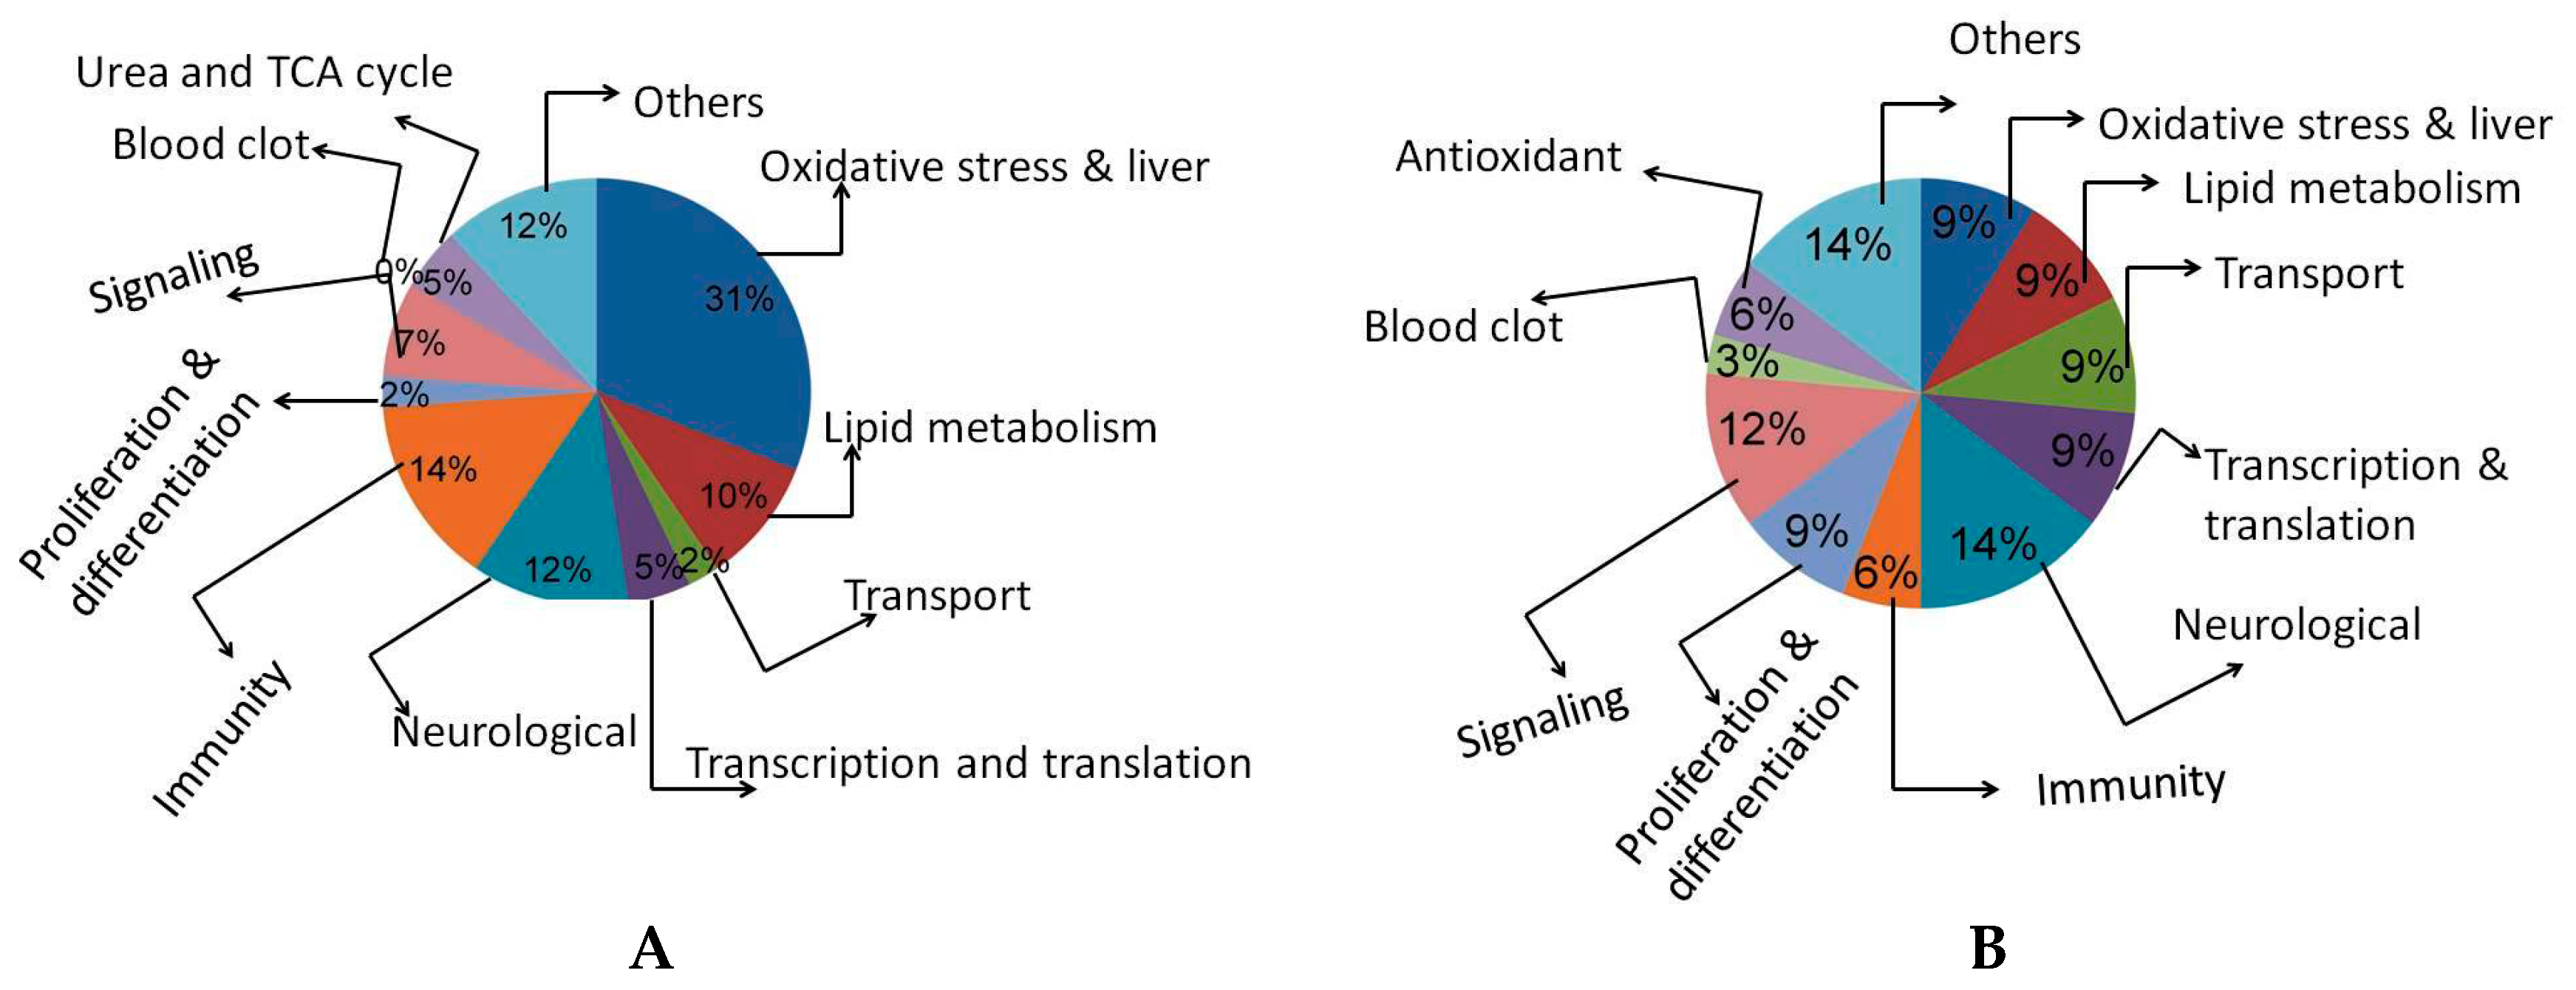
2.4. MALDI-TOF Analysis

The 2D gels of toxic, non-toxic and control liver tissues were resolved on 12% SDS-PAGE and then silver stained. The selected protein spots after image analysis were taken from the gel with the listed SSP numbers and analyzed on MALDI-TOF for protein identification by submitting the peptide mass finger print data. All the protein spots were analyzed on Micromass MALDI-TOF in the reflectron mode. Based on peptide mass finger prints, the protein spots were accordingly identified by using the mascot distiller software from Matrix science UK the identified proteins are listed along with their Swissprot accession numbers (Table 2 and Table 3). The identified proteins were classified in the pie chart according to their cellular localization (Figure 5).
Table 2. Differentially expressed proteins in rats received 150 mg/kg of APAP.
S. NoSSPProtein NameSequence Coverage (%)Estimated M.WTPISwissprot No
14514Cold-inducible RNA-binding protein23387.0P60825
23716CYP2D338576.7P12938
35910Tissue factor pathway inhibitor precursor (TFPI)29727.6Q02445
42204Homeobox protein DRG112128.65.9Q62798
5608SEC14-like protein 339
63Low-density lipoprotein receptor-related protein 4 precursor4245.14.8Q9Z1J8
72308Splice isoform 1; Variant Displayed2731.66.1Q8VHQ7-00-00-00
82206Trypsin V-B precursor41286.1P32822
95(NLG1_RAT) Splice isoform3213 Q62765-03-00-00
10135Somatostatin precursor2415.44.9P60042
113402Guanine nucleotide-binding protein G[I]33336.4P54313
127602Transforming growth factor beta 1 precursor3848.28.4P17246
134801Synaptotagmin X4760.76.8O08625
147210(EPOR_RAT) Splice isoform4228.28.9Q07303-01-00-00
156412Sphingosine 1-phosphate receptor Edg-53936.68.2P47752
163823Hydroxymethylglutaryl-CoA synthase,3560.66.8P17425
175807Splice isoform Long; Variant Displayed;4261.577.4Q09137-00-00-00
188101Trefoil factor 2 precursor1915.9 Q09030
192808Nonspecific lipid-transfer protein, mitochondrial precursor34616.P11915
206804Cyclic-nucleotide-gated olfactory channel3661.47.8Q64359
213408Nuclear transcription factor Y subunit gamma2934.46.5Q62725
226701Neural Wiskott-Aldrich syndrome protein3553.27.8O08816
238305Kinesin heavy chain isoform4729 P56536
242601P2X purinoceptor 11647.95.8P47824
255108Synaptosomal-associated protein41217.5O70377
268101Phospholipase A2 precursor3815.9 P04055
2734093,2-trans-enoyl-CoA isomerase,3235.56.6P23965
28M6Cytochrome P4505460.76.8P30839
295807Growth factor receptor-bound protein 143661.57.4O88900
306710Methionine aminopeptidase’s 24953.27.8P38062
311206Trypsin I, anionic precursor5127.25.5P00762
32110360 S Ribosomal protein2815.55.1P62907
334101Peripheral myelin protein 223311.96.8Q63199
34M1GST3624.04.9P08011
355215GSH47247.0P19468
Table 3. Differentially expressed proteins in rats received 1500 mg/kg of APAP.
S. NoSSPProtein NameSequence Coverage (%)ScoreEstimated M.WTPISwissprot No.
13716CYP2D32522576.7P12938
28305Homeobox protein DRG112419299.5Q62798
337054-Aminobutyrate aminotransferase3535566.4P50554
43312Serine/threonine protein phosphatase323431.56.7P13353
56101Acyl CoA413918.387.8Q64559
65504ArgininosPuccinate synthase383243.87.3P09034
74801Synaptotagmin X363860.76.8O08625
88314CD82 antigen252230 O70352
93823Hydroxymethylglutaryl-CoA synthase,292860.66.8P17425
103306F-box/LRR-repeat protein 20403529.46.6Q9QZH7
118301Suppressor of cytokine signaling 1 (SOCS-1)363229.29.1Q9QX78
121403Calcineurin-binding protein Cabin 1343134.25.1O88480
133115Hydroxymethylglutaryl-CoA synthase332818.76.6P22791
145712Lipopolysaccharide-binding protein precursor4541567.5Q63313
153705Cytochrome P450464056.006.4P20812
162908Liver carboxylesterase B-1 precursor353266.96.2Q63010
175106Acetyl-CoA acetyltransferase, mitochondrial precursor333420.47.5P17764
183908Hyaluronan synthase 2221766.46.6O35776
193522Carbonic anhydrase III252138.66.7P14141
206019Cytochrome c oxidase polypeptide VIa-liver292314.08.3P10818
212710CYP2B3242054.86.3P13107
224003Peripheral myelin protein 22363211.96.8Q63199
238705CYP1A23735 P04799
24M2Heat shock protein 703634705.8Q07439
25M3Aspartate aminotransferase3033556.1P13221
26M4Alanine aminotransferase272154 P25409
27M5IFN gamma2326194.8P01581
28501Mitogen-activated protein kinase212043.44.9Q9WTY9
292710CYP2B3282454.86.3P13107
30M6Cytochrome P450302460.76.8P30839
318305Kinesin heavy chain isoform3332
327802(Pyruvate dehydrogenase (Lipoamide))-phosphatase 23831608.5O88484
337602Transforming growth factor beta 1 precursor 363548.28.4P17246
347210Calcium-activated potassium channel beta subunit 24138288.9Q811Q0
35135Hippocalcin-like protein5247154.9P62749
364002Cadherin-14 (Fragment) (Rat)172111.06.8Q9Z2V8
373Single-stranded DNA-binding protein202514 P28042
38850Splice isoform Displayed241743.44.9Q9R0E0
393512Wnt-5a protein precursor353441.76.5Q9QXQ7
40120460S ribosomal protein L7212023 5.3P37805
413823Phosphoglucomutase343260.66.8P38652
428705Glutamate decarboxylase363460.59.2P18088
Figure 5. Classification of differentially expressed proteins based on the localization.
Molecules 21 00161 g005
The identified proteins were classified according to their putative functions, the percentage of transporter proteins, cell proliferation and differentiation related proteins, transcription and translational proteins, neurological and antioxidants protein were down-regulated in high dose APAP-treated rats as compared with non-toxic dose treated rats, whereas, oxidative stress, urea and TCA cycle, and immunity-related protein expressions were up regulated in higher APAP-treated rats as compared with non-toxic dose-treated rats (Figure 6).
Figure 6. Classification of proteins based on their putative function extracted from experimental rat livers. A—150 mg/kg of APAP-treated rats; B—1500 mg/kg of APAP-treated rats.
Molecules 21 00161 g006
Among the identified proteins in the toxicity induced rats, we have separated differentially expressed proteins that are known to play a vital role in the toxicity assessments, which are summarized in Table 4.
Table 4. High differentially expressed proteins in rats received 1500 mg/kg of APAP.
S. NoProtein IdentifiedSwiss Port NOM.WT (Kda)
1Cytochrome P450P2081256.00
2Heat shock protein70Q0743970
3IFN-γP0158119
4Cyp2B3P1310754.8
5Cyp2D3P1293857
6ASTP1322155
7ALTP2540954
8Suppressor of cytokine signaling 1Q9QX7829.2
9Liver carboxylesterase B-1 precursorQ6301066.9
10Acetyl-CoA acetyltransferase, mitochondrial precursorP1776420.4
11Cytochrome c oxidase polypeptide VIa-liverP1081814.0
12Calcineurin-binding protein Cabin 1O8848034.2
13Hydroxymethylglutaryl-CoA synthase18.7P22791

3. Discussion

The liver plays an important role in preventing the accumulation of compounds by converting them into a suitable form for elimination. All compounds undergo xenobiotic metabolism, which requires multiple biochemical transformations. During this process some of the intermediates exhibit toxic responses. Generally, the liver is potentially susceptible to injury during the action of intermediate products of compounds or drugs. An improved quantitative understanding of the balance between the xenobiotic detoxification process and hepatic injury could provide guidelines for safe levels in both pharmaceutical and the toxicological conditions. Especially, the ability to predict the toxicity profile of lead candidates is critical to streamlining pharmaceutical drug development [13]. A better understanding of the beginning of liver injury is an opportunity to recognize personalized medicine according to the genetics, active biomarkers and environment of the individual patient [14].
Acetaminophen toxicity is related to the accumulation of toxic intermediate metabolites such as N-acetyl-p-benzoquinoneimine(NAPQI). Normally, acetaminophen is metabolized into NAPQI by cytochrome P450-dependent mixed-function oxidase in the liver and by the prostaglandin synthetase system in the kidney. Then, these metabolites are detoxified by reduced glutathione (GSH). When glutathione levels are depleted, this intermediate can covalently bind to nucleophilic targets of macromolecules in cells that eventually causes cell death. In the present study, we investigated the effect of acetaminophen on liver proteomic changes in rats. The rats treated with 1500 mg/ kg of body weight exhibited increased activities of AST and ALT. This indicates that acetaminophen induced liver damage at the concentration of 1500 mg/kg. The AST and ALT levels were found higher in the cytoplasm and mitochondria. During liver damage, the transport function of hepatocytes is disturbed and as a result plasma membrane damage ocurrs thereby causing increased activities of these enzymes, further leading to cellular leakage and loss of cellular integrity [15].
The American Liver Foundation reported that 35% of severe liver failures were caused by acetaminophen toxicity. Addition of N-acetylcysteine to acetaminophen tablets was proposed to prevent liver toxicity [16]. The protein glutathione S-transferase gets up regulated during liver damage induced by excessive doses of acetaminophen. Glutathione transferases(GSTs) are complex enzymes that are involved in many biological functions, especially in detoxification of a large number of electrophilic intermediates. A large amount of electrophilic intermediates is produced by APAP oxidation in the presence of cytochrome P450. The liver is highly susceptible to these intermediates. However, these intermediates are detoxified by reduced glutathione, but higher doses of APAP exhibit more hepatotoxicity that reduce GSH levels and it permit the binding of unconjugated NAPQI to macromolecules in cells [17,18,19,20].
Many possible nucleophilic targets are found in the cells that are bound by the unconjugated NAPQI. This interaction mechanism between the cells and unconjugated NAPQI stimulates the cell death program [21,22]. Cytochrome P450s are responsible for most xenobiotics, and are needed for the proper elimination of toxic chemicals from the body. These enzymes metabolically activate biologically inert compounds into electrophilic derivatives that can cause toxicity, cell death and cancer. Advances in proteomics and genomics are providing a much improved view of the molecular players and pathways involved in the metabolism of xenobiotics. Here, we studied proteomic changes caused by treatment with higher doses of acetaminophen using 2D gel electrophoresis and MALDI-TOF. The results indicated that the percentages of transporter proteins, cell proliferation and differentiation proteins, transcription and translational proteins, neurological proteins and some of the antioxidants were down-regulated in higher APAP-treated rats as compared with non-toxic dose treated ones, whereas, oxidative stress-related proteins, urea and TCA cycle and immunity-related proteins were abundantly expressed in higher APAP-treated rats as compared with non-toxic dose treated rates.

4. Experimental Section

4.1. Animal Treatment

All animal procedures were performed under GLP conditions. Animals were separated into three groups, each consisting of five wild-type adult male Wistar rats (average weight 150–200 g) that were housed in a controlled environment and quarantined for 72 h. Group I received 0.25% CMC (control vehicle), Group II received 150 mg/kg of APAP (nontoxic dose; A5000, Sigma-Aldrich (St. Louis, MO, USA) and Group III received 1500 mg/kg of APAP (toxic dose). After the experiments the animals were sacrificed by the terminal anesthesia method and their liver tissues were removed, frozen in liquid nitrogen and stored at –80 °C.

4.2. Biochemical Analysis

Plasma alanine amino transferase (ALT) and aspartate amino transferase (AST) levels in the plasma toxic, non-toxic and control animals were analyzed by routine clinical chemistry.

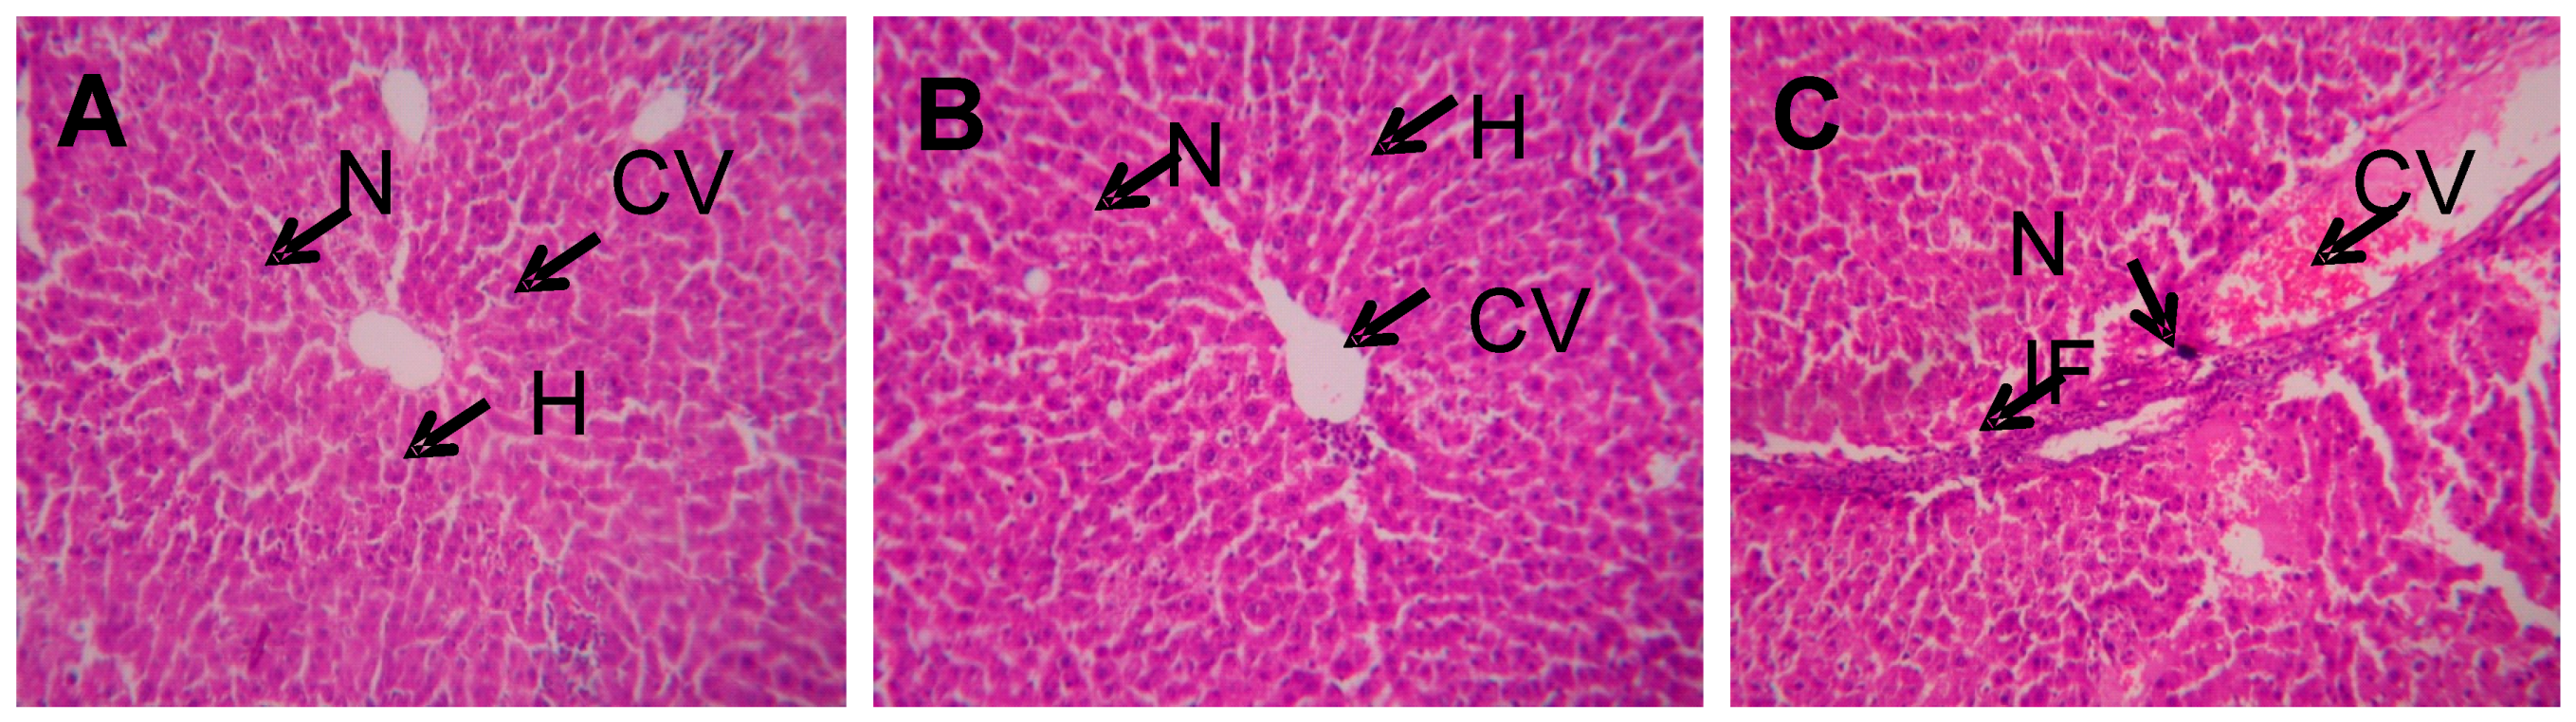
4.3. Histopathology Analysis

Portion liver tissues were cut into small species and fixed in 10% formalin solution and then embedded in paraffin wax. The fixed tissues were stained with haematoxylin-eosin [12].

4.4. Protein Sample Preparation

Liver samples from each animal were processed separately. The whole liver was washed thoroughly in phosphate buffer saline (PBS) and finely sliced with sharp edge knife and homogenized in 5 mL of homogenization buffer I (40 mM Tris, 1 mM phenylmethylsulfonyl fluoride and 20 μL of protease inhibitor cocktail (Sigma)) on ice, with motor and pestle to a fine paste. The protein suspension was centrifuged at 15,000 rpm for 20 min at 4 °C. The pellet was dissolved in 0.5 mL buffer II (40 mM Tris, 8 M Urea, 4% CHAPS, 0.2% Biorad Biolyte [3,4,5,6,7,8,9,10], 2 mM TBP, 2 mM DTT and protease inhibitors cocktail) and centrifuged at 15,000 rpm for 20 min at 15 °C. The supernatants were aliquot and stored at −70 °C. Protein concentrations for each supernatant were estimated by Biorad’s RCDC™ method.

4.5. DE and Image Analysis

An equal amount of protein (300 μg) from each sample was diluted in Biorad rehydration buffer (300 µL) of and loaded onto 17 cm, pH 3–10 immobilized pH gradient IPG, strips (Biorad, Philadelphia, PA, USA). The proteins were separated on the first dimension with total of 60 kVh of Isoelectric focusing on rapid ramp using Protean IEF Cell (Biorad). The focused strips were equilibrated in buffer containing 6 M urea, 2% (w/v) SDS, 0.375 M Tris-HCl, pH 8.8, 20% (v/v) glycerol, 2.4% (w/v) acrylamide and 5 mM TBP, for 1 h at room temperature with slight agitation. The equilibrated strips were applied directly to 12.5% SDS-polyacrylamide gels (20 × 24 cm) and separated for 4 hrs at 200 V constant voltages. The gels were fixed in 40% methanol, 10% acetic acid for overnight and stained with silver stain. After rinsing, the gels were scanned with a GS800 calibrated Densitometer scanner (Biorad). Images from two replicate gels with good separation were selected for comprehensive image analysis using the PDQuest software program (Biorad, version-7). Protein profiles of samples extracted with buffer II were only considered for image analysis. Three replicate groups of the gels of control, nontoxic and toxic samples were created. Each replicate group consisted of five gels representing the liver profiles of animals in that set. The gels were normalized for any other variations like background staining, staining times, exposure times etc. Spots with average quantitative change greater than 2-fold between the replicate groups were considered statistically significantly regulated spots.

4.6. In-gel Tryptic Digestion and Mass Spectrometry (MALDI-TOF) Analysis

Spots that were significantly regulated were excised from the 2-D gel with a ProteomeWorksTM spot cutter (Biorad) and placed in 96-well plates.The gel pieces were washed and destained by a mixture of 25 mM ammonium bicarbonate and 50% acetonitrile (3 × 30 min). The destained gel pieces were washed with water and reduced for 1 h at 57 °C using buffer (100 mM ammonium bicarbonate and 10 mM dithiothreitol (DTT)). The spots were then alkylated using buffer (100 mM ammonium bicarbonate and 55 mM iodoacetamide) and incubated in the dark for 30 min at room temperature. The gel pieces were dehydrated with 50 µL of 100% acetonitrile, and then dried under vacuum using the speedvac concentrator for 30 min. To the dried gel pieces, digestion solution (100 ng/µL trypsin) in 50 mM of NH4HCO3 was added and incubated overnight at 37 °C. The peptides were extracted twice from the gel pieces by adding 100 µL of extraction buffer (50% acetonitrile containing 5% trifluoroacetic acid) and the extracts were concentrated by Speedvac for 1 h. The concentrated mixture was desalted by C-18 Ziptips (Millipore, Temecula, CA, USA). The cleaned peptides crystallized with α-cyano-4-hydroxycinnamic acid (HCCA) matrix solution were analyzed by MALDI-TOF (Micromass, Temecula, CA, USA) mass spectrometry in reflectron mode. A pulsed nitrogen laser of 337 nm was fired to accumulate 100 shots per spectra and the peptide mass fingerprints (PMF) of the samples were generated. The spectra width was narrowed to a range from 500 to 3500 Daltons m/z. The spectra were processed (baseline correction, noise removal, deisotoping) by using the Mass Lynx version 3.5 software (Philadelphia, PA, USA). Protein identification was generated by feeding the peptide mass finger print data into the public domain search engines Mascot and MS-Fit and by searches in the Swiss Prot database (http://www.ebi.ac.uk/uniprot).

5. Conclusions

In this study, AST, ALT, CYP2B3, heat shock protein 70, cytochrome c oxidase, cytochrome P450, suppressor of cytokine signaling 1, liver carboxylesterase B-1 precursor, acetyl-CoA acetyltransferase, mitochondrial precursor, cytochrome c oxidase polypeptide VIa-liver, calcineurin-binding protein cabin 1, andhydroxymethylglutaryl-CoA synthasewere highly up regulated in toxic dose-treated rats. The overall resultssuggest that overdoses of drug treatments modify the regularmetabolic andmolecular pathways in the liver. These data should be useful to predict the toxicological changes in liver proteins by the overdose of acetaminophen and cholesterol lowering drugs.

Acknowledgments

The authors extend their sincere appreciation to the Deanship of Scientific Research at King Saud University for its funding this Prolific Research Group (PRG-1437-28).

Author Contributions

NAA-D, SS, YOK and MVA and designed and performed the experiments. Data were analyzed and manuscript written by SI, MVA, NAA-D, PA, RB and KCC. All authors read and approved the final version of the manuscript.

Conflicts of Interest

The authors declare no conflict of interest.

References

  1. Boutis, K.; Shannon, M. Nephrotoxicity after acute severe acetaminophen poisoning in adolescents. Clin. Toxicol. 2001, 39, 441–445. [Google Scholar] [CrossRef]
  2. Davidson, D.G.; Eastham, W.N. Acute liver necrosis following overdose of paracetamol. Br. Med. J. 1996, 5512, 497–499. [Google Scholar] [CrossRef]
  3. Kleinman, J.G.; Breitenfield, R.V.; Roth, D.A. Acute renal failure associated with acetaminophen ingestion:Report of a case and review of the literature. Clin. Nephrol. 1980, 14, 201–205. [Google Scholar] [PubMed]
  4. Mudge, G.H.; Gemborys, M.W.; Duggin, G.G. Covalent binding of metabolites of acetaminophen to kidney protein and depletion of renal glutathione. J. Pharmacol. Exp. Ther. 1978, 206, 218–226. [Google Scholar]
  5. Vidal, B.C.; Bonventre, J.V.; I-Hong Hsu, S. Towards the application of proteomics in renal disease in renal disease. Clin. Sci. 2005, 109, 421–430. [Google Scholar] [CrossRef] [PubMed]
  6. Pixton, K.L.; Deeks, E.D.; Flesch, F.M. Sperm proteome mapping of a patient who experienced failed fertilization at IVF reveals altered expression of at least 20 proteins compared with fertile donors: case report. Hum. Reprod. 2004, 19, 1438–1447. [Google Scholar] [CrossRef] [PubMed]
  7. Baker, M.A.; Witherdin, R.; Hetherington, L. Identification of posttranslational modifications that occur during sperm maturation using difference in two-dimensional gel electrophoresis. Proteomics 2005, 5, 1003–1012. [Google Scholar] [CrossRef] [PubMed]
  8. Naaby-Hansen, S.; Mandal, A.; Wolkowicz, M.J.; Sen, B.; Westbrook, V.A.; Shetty, J.; Coonrod, S.A.; Klotz, K.L.; Kim, Y.H.; Bush, L.A.; et al. CABYR, a novel calcium-binding tyrosine phosphorylation-regulated fibrous sheath protein involved in capacitation. Dev. Biol. 2002, 242, 236–254. [Google Scholar] [CrossRef] [PubMed]
  9. Turner, R.M.; Musse, M.P.; Mandal, A. Molecular genetic analysis of two human sperm fibrous sheath proteins, AKAP4 and AKAP3, in men with dysplasia of the fibrous sheath. J. Androl. 2001, 22, 302–315. [Google Scholar] [PubMed]
  10. Bohring, C.; Krause, W. Immune infertility: towards a better understanding of sperm [auto]-immunity. The value of proteomic analysis. Hum. Reprod. 2003, 18, 915–924. [Google Scholar] [CrossRef] [PubMed]
  11. Nandhini, V.S.; Viji Stella Bai, G. In-vitro phytopharmacological effect and cardio protective activity of Rauvolfia tetraphylla L. South Ind. J. Biol. Sci. 2015, 1, 97–102. [Google Scholar]
  12. Kleiner, D.E.; Brunt, E.M.; van Natta, M.; Behling, C.; Contos, M.J.; Cummings, O.W.; Ferrell, L.D.; Liu, Y.C.; Torbenson, M.S.; Unalp-Arida, A.; et al. Non alcoholic steato hepatitis clinical research network, design and validation of a histological scoring system for nonalcoholic fatty liver disease. Hepatology 2005, 41, 1313–1321. [Google Scholar] [PubMed]
  13. Dorne, J.L.; Skinner, L.; Frampton, G.K.; Spurgeon, D.J.; Ragas, A.M. Human and environmental risk assessment of pharmaceuticals: differences, similarities, lessons from toxicology. Anal. Bioanal. Chem. 2007, 387, 1259–1268. [Google Scholar] [CrossRef] [PubMed]
  14. Burke, W.; Psaty, B.M. Personalized medicine in the era of genomics. JAMA 2007, 298, 1682–1684. [Google Scholar] [CrossRef] [PubMed]
  15. Rajesh, M.G.; Latha, M.S. Protective effect of Glycyrrhiza glabra Linn. on carbon tetrachloride-induced peroxidative damage. Ind. J. Pharmacol. 2004, 36, 284–286. [Google Scholar]
  16. Martin, J.; Smilkstein, M.D.; Gary, L.; Knapp, M.S.; Kenneth, W.; Kulig, M.D.; Barry, H.; Rumack, M.D. Efficacy of Oral N-Acetylcysteine in the Treatment of Acetaminophen Overdose. N. Engl. J. Med. 1988, 319, 1557–1562. [Google Scholar]
  17. Corcoran, G.B.; Mitchell, J.R.; Vaishnav, Y.N.; Horning, E.C. Evidence that acetaminophen and N-hydroxyacetaminophen form a common arylating intermediate, N-acetyl-p-benzo-quinoneimine. Mol. Pharmacol. 1980, 18, 536–542. [Google Scholar] [PubMed]
  18. Dahlin, D.C.; Miwa, G.T.; Lu, A.Y.; Nelson, S.D. N-acetyl-pbenzoquinone imine: a cytochrome P-450-mediated oxidation product of acetaminophen. Proc. Natl. Acad. Sci. USA 1984, 81, 1327–1331. [Google Scholar] [CrossRef] [PubMed]
  19. Manautou, J.E.; Emeigh Hart, S.G.; Khairallah, E.A.; Cohen, S.D. Protection against acetaminophen hepatotoxicity by a single dose of clofibrate: effects on selective protein arylation and glutathione depletion. Fundam. Appl. Toxicol. 1996, 29, 229–237. [Google Scholar] [CrossRef] [PubMed]
  20. Rashed, M.S.; Myers, T.G.; Nelson, S.D. Hepatic protein arylation, glutathione depletion, and metabolite profiles of acetaminophen and a non-hepatotoxic regioisomer, 3’-hydroxyacetanilide, in the mouse. Drug Metab. Dispos. 1990, 18, 765–770. [Google Scholar] [PubMed]
  21. Bartolone, J.B.; Birge, R.B.; Bulera, S.J.; Bruno, M.K.; Nishanian, E.V.; Cohen, S.D.; Khairallah, E.A. Purification, antibody production, and partial amino acid sequence of the 58-kDa acetaminophen-binding liver proteins. Toxicol. Appl. Pharmacol. 1992, 113, 19–29. [Google Scholar] [CrossRef]
  22. Bulera, S.J.; Birge, R.B.; Cohen, S.D.; Khairallah, E.A. Identification of the mouse liver 44-kDa acetaminophen-binding protein as a subunit of glutamine synthetase. Toxicol. Appl. Pharmacol. 1995, 134, 313–320. [Google Scholar] [CrossRef] [PubMed]
  • Sample Availability: Samples of the compounds acetaminophen are available from the authors. Also it can be purchased from Sigma-Aldrich.

