
Synthesis and Evaluation of New Benzodioxole- Based Thiosemicarbazone Derivatives as Potential Antitumor Agents


 , and
, and
Abstract
:1. Introduction
2. Results and Discussion
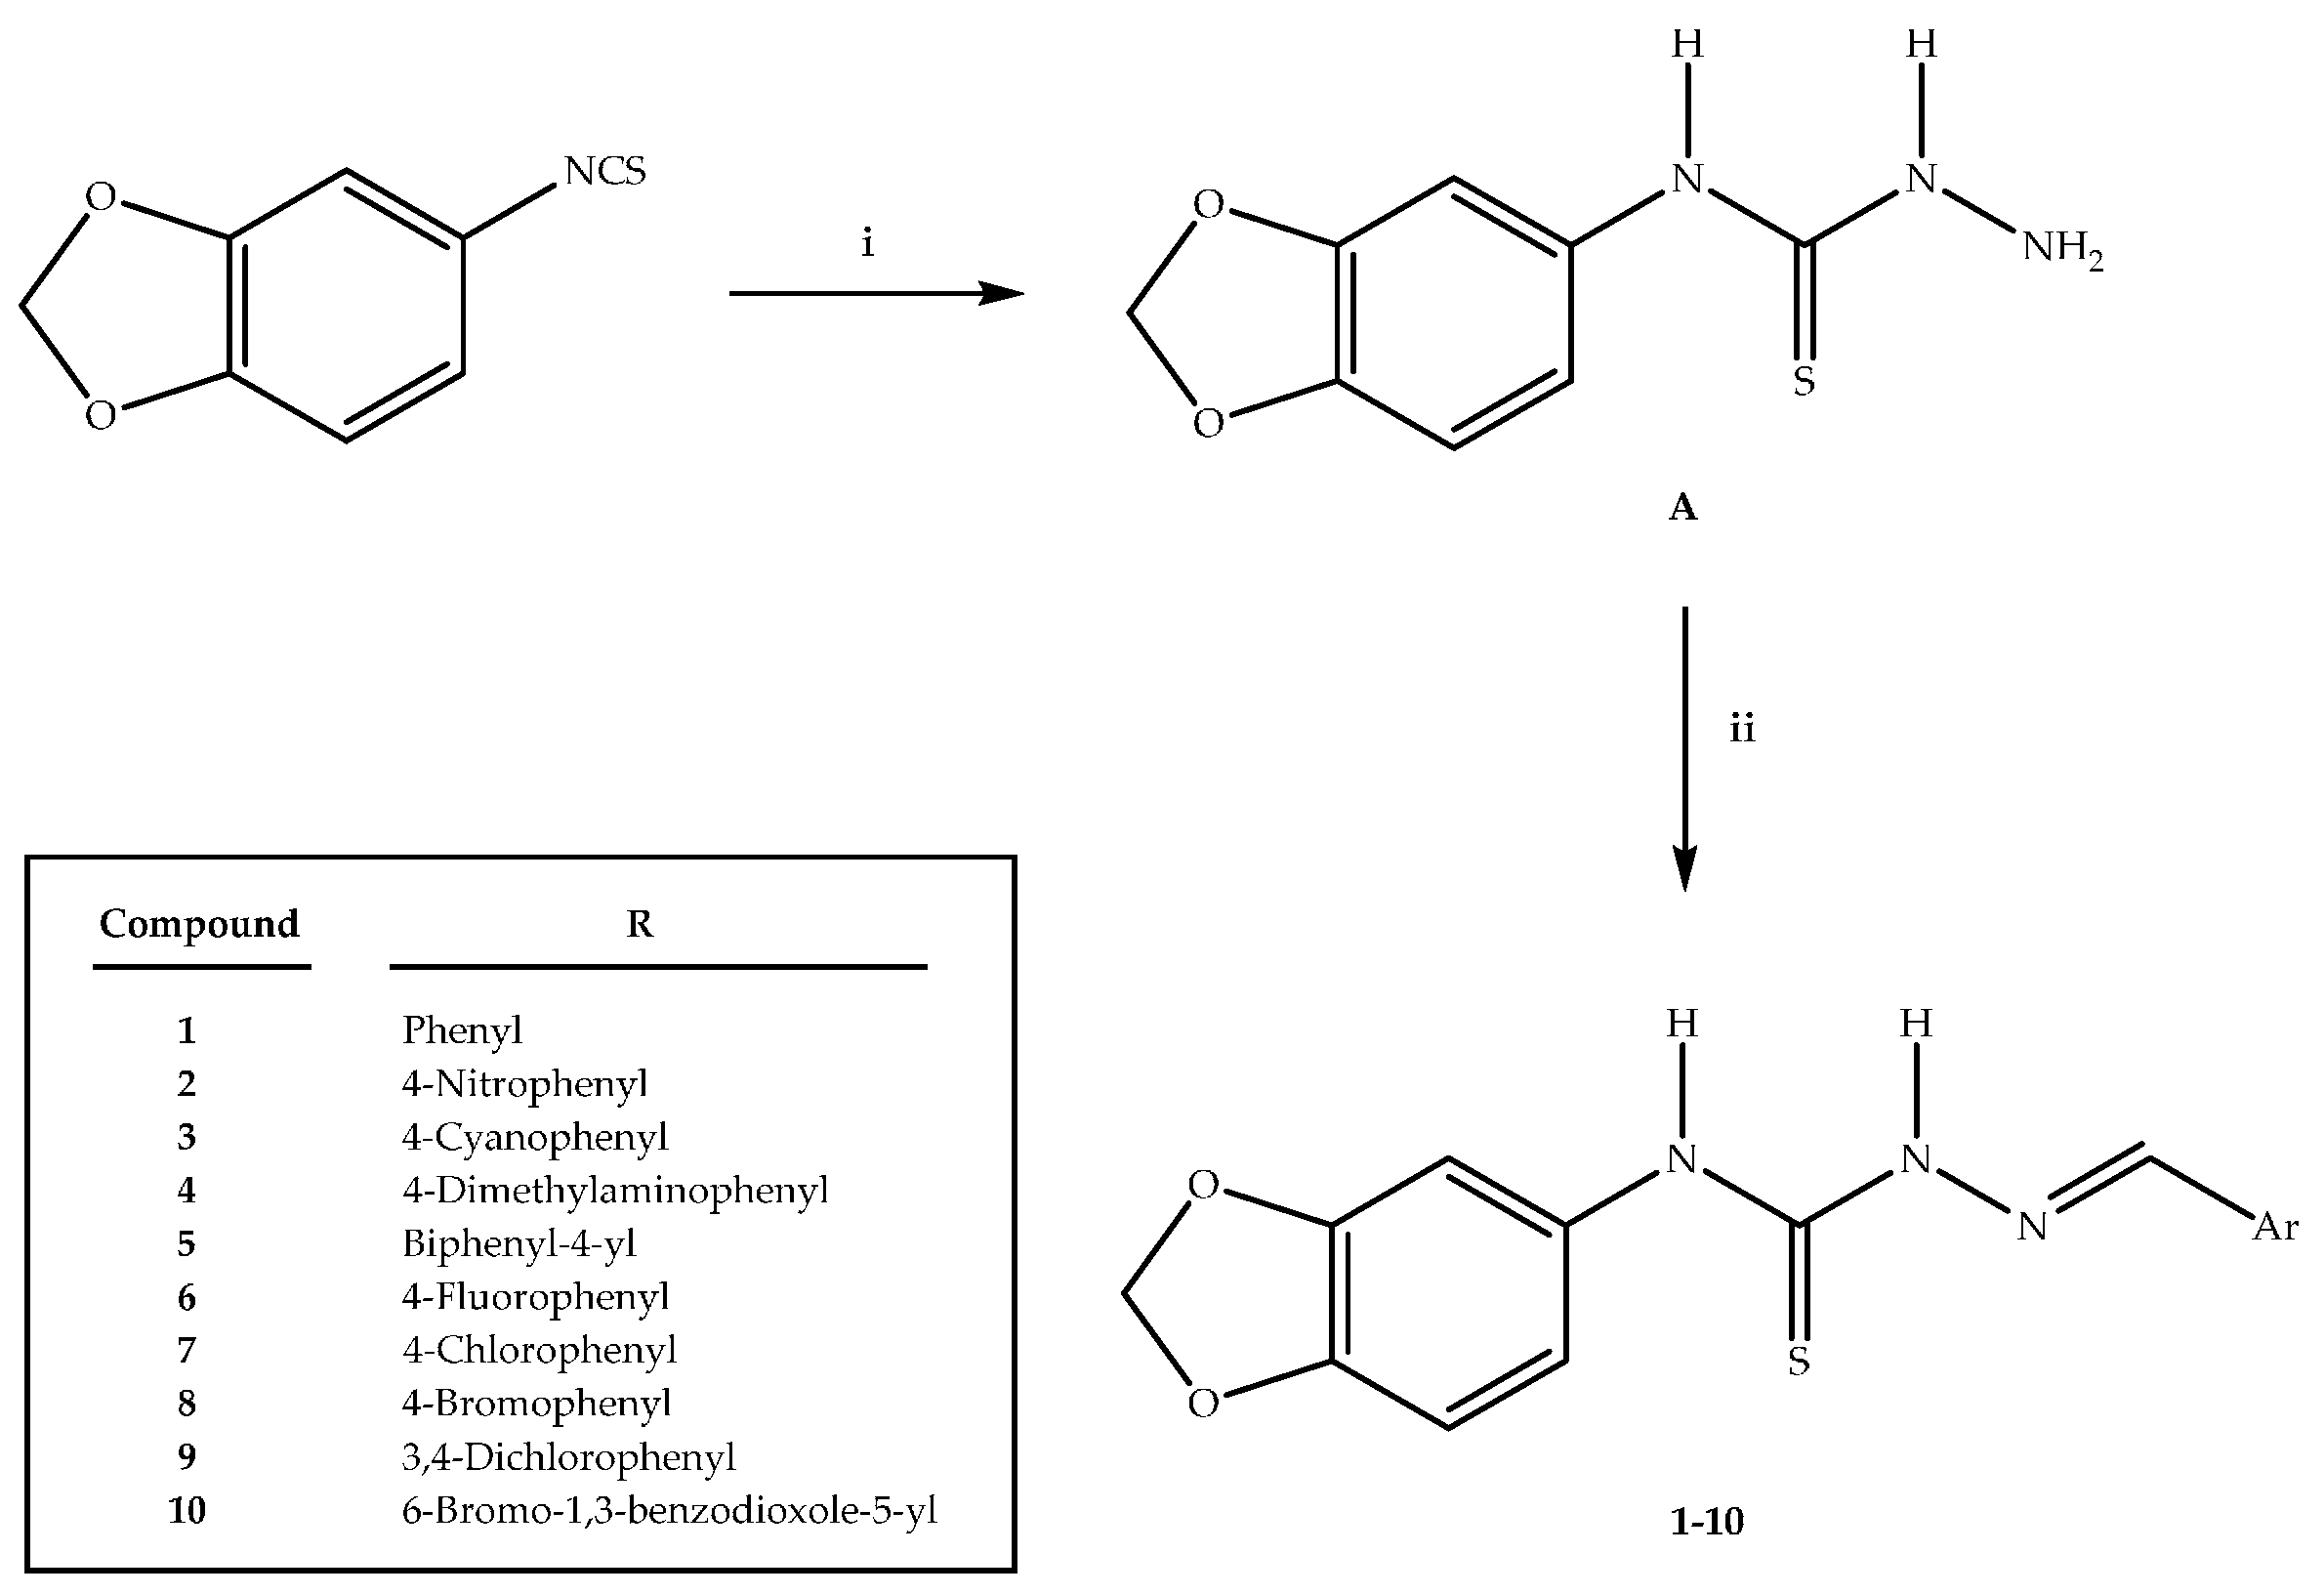
2.1. Chemistry
2.2. Biochemistry
2.2.1. Cytotoxicity
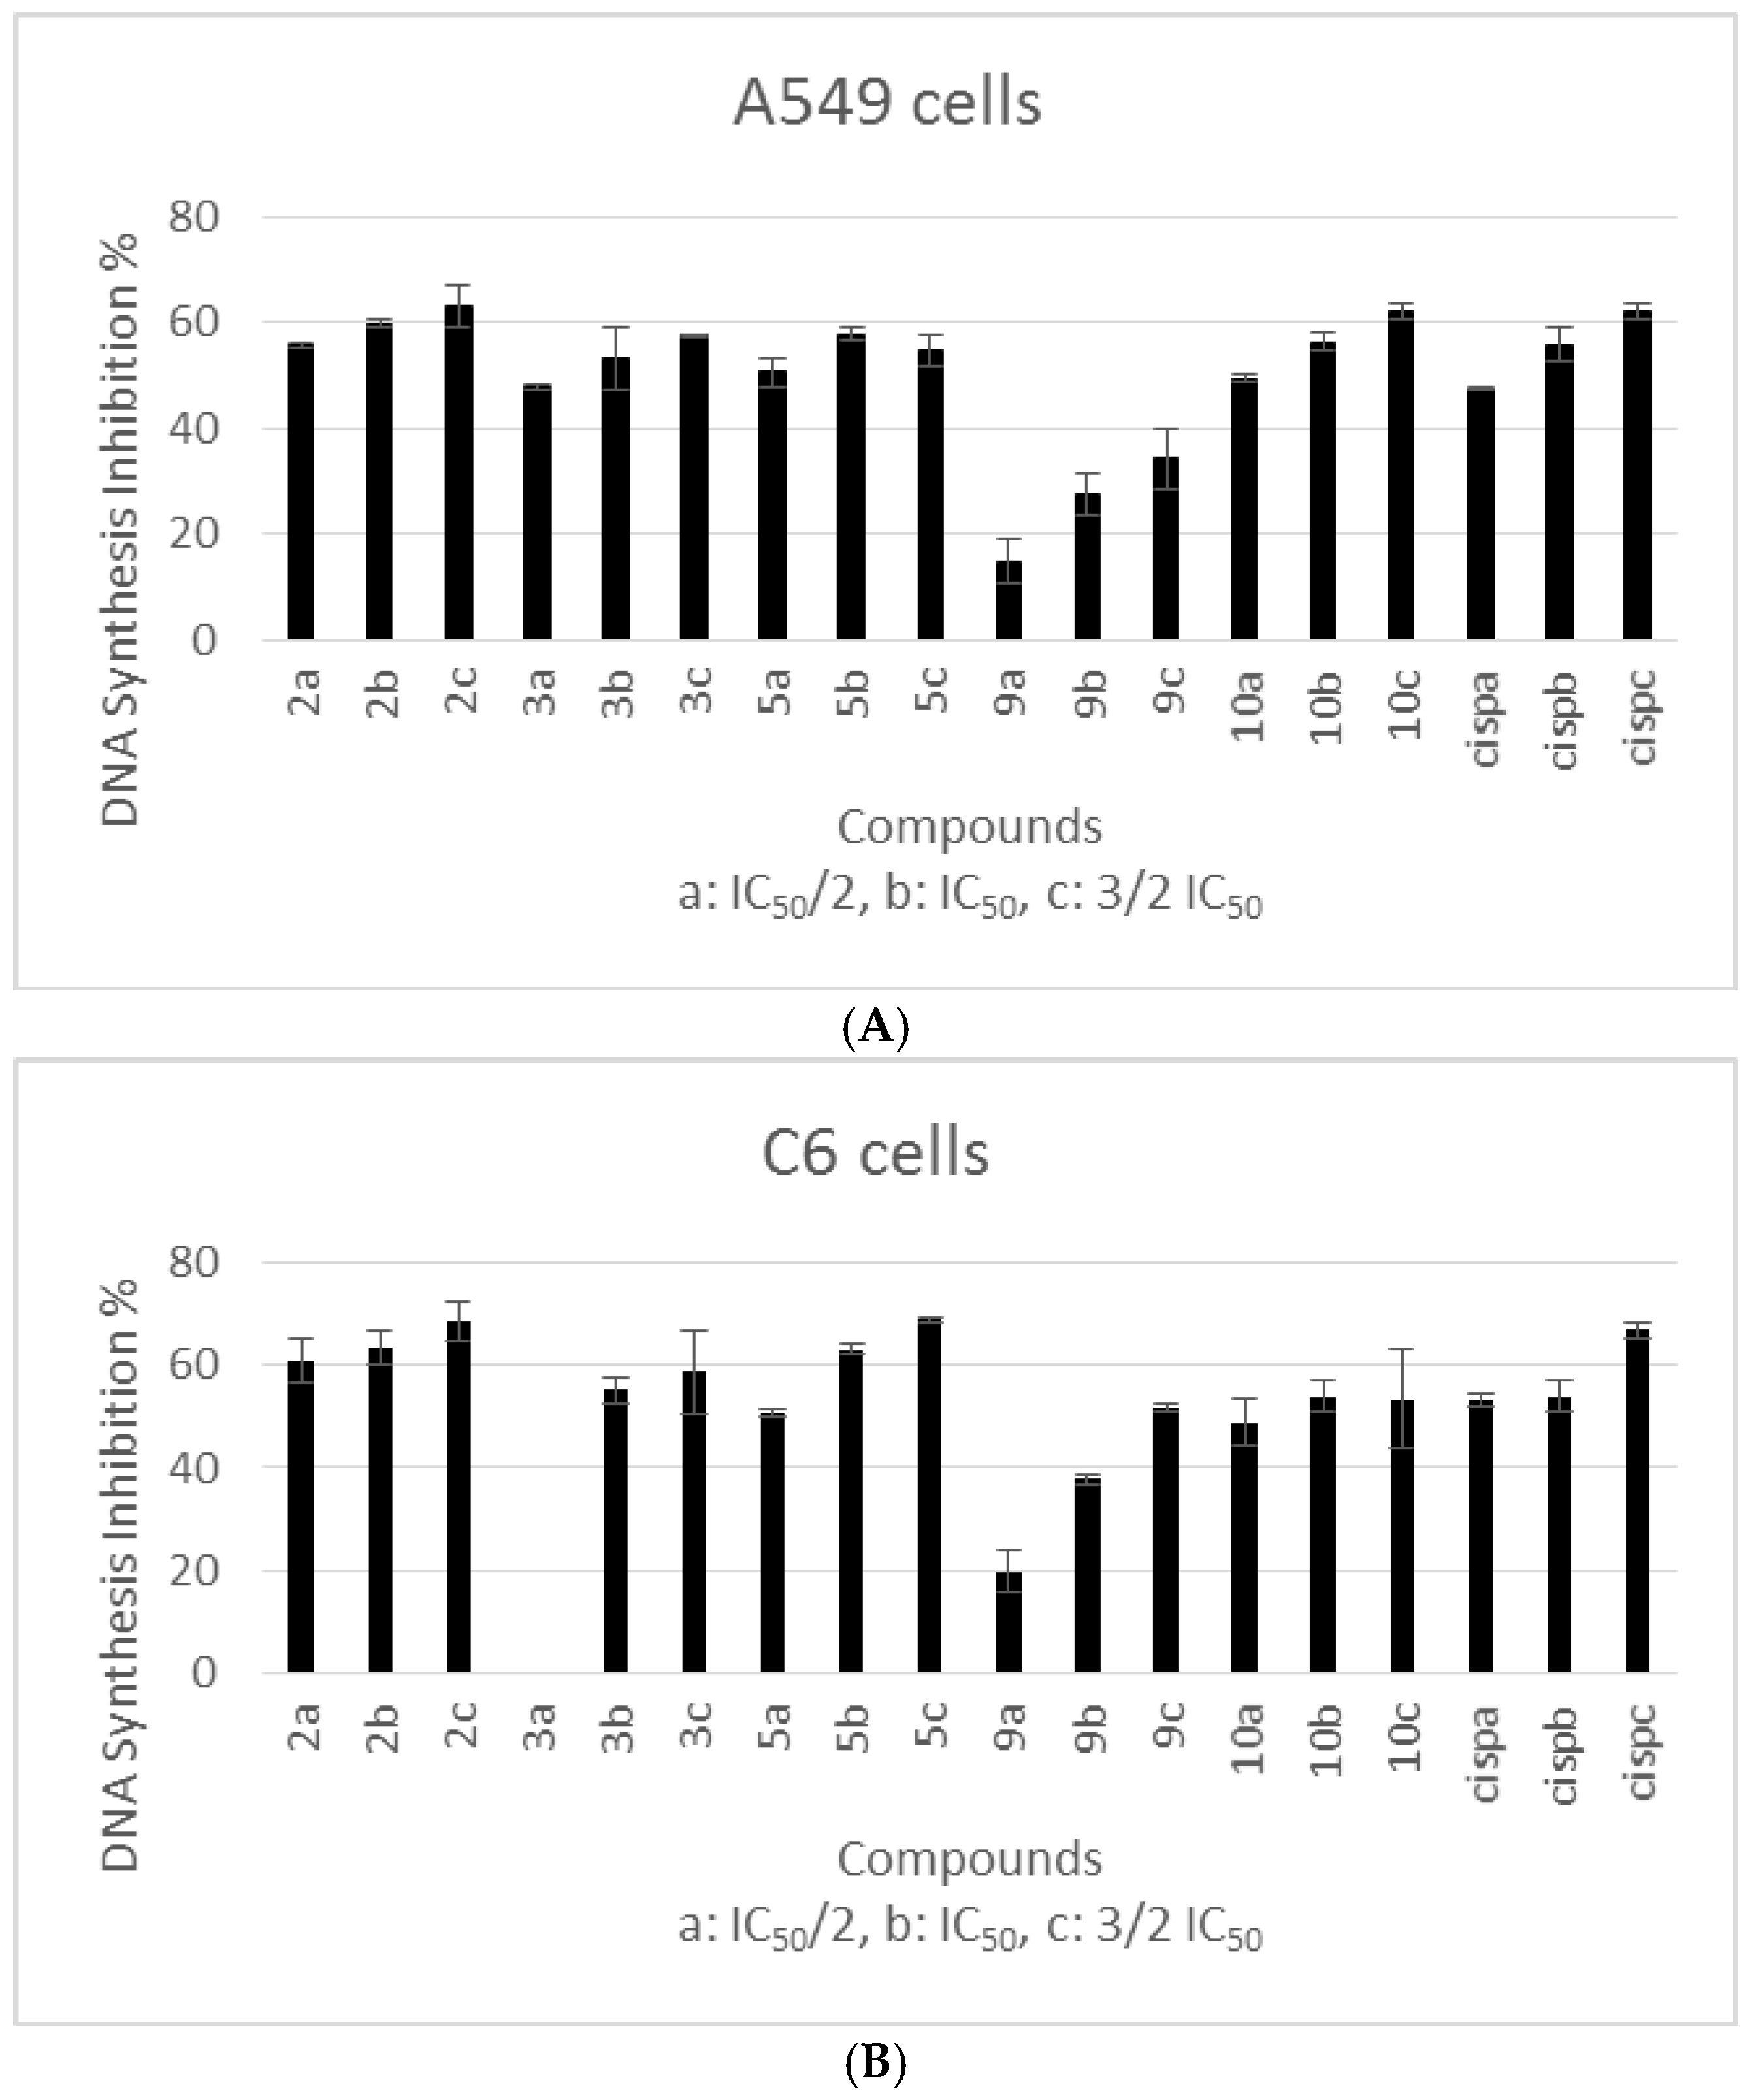
2.2.2. Evaluation of DNA Synthesis Inhibition
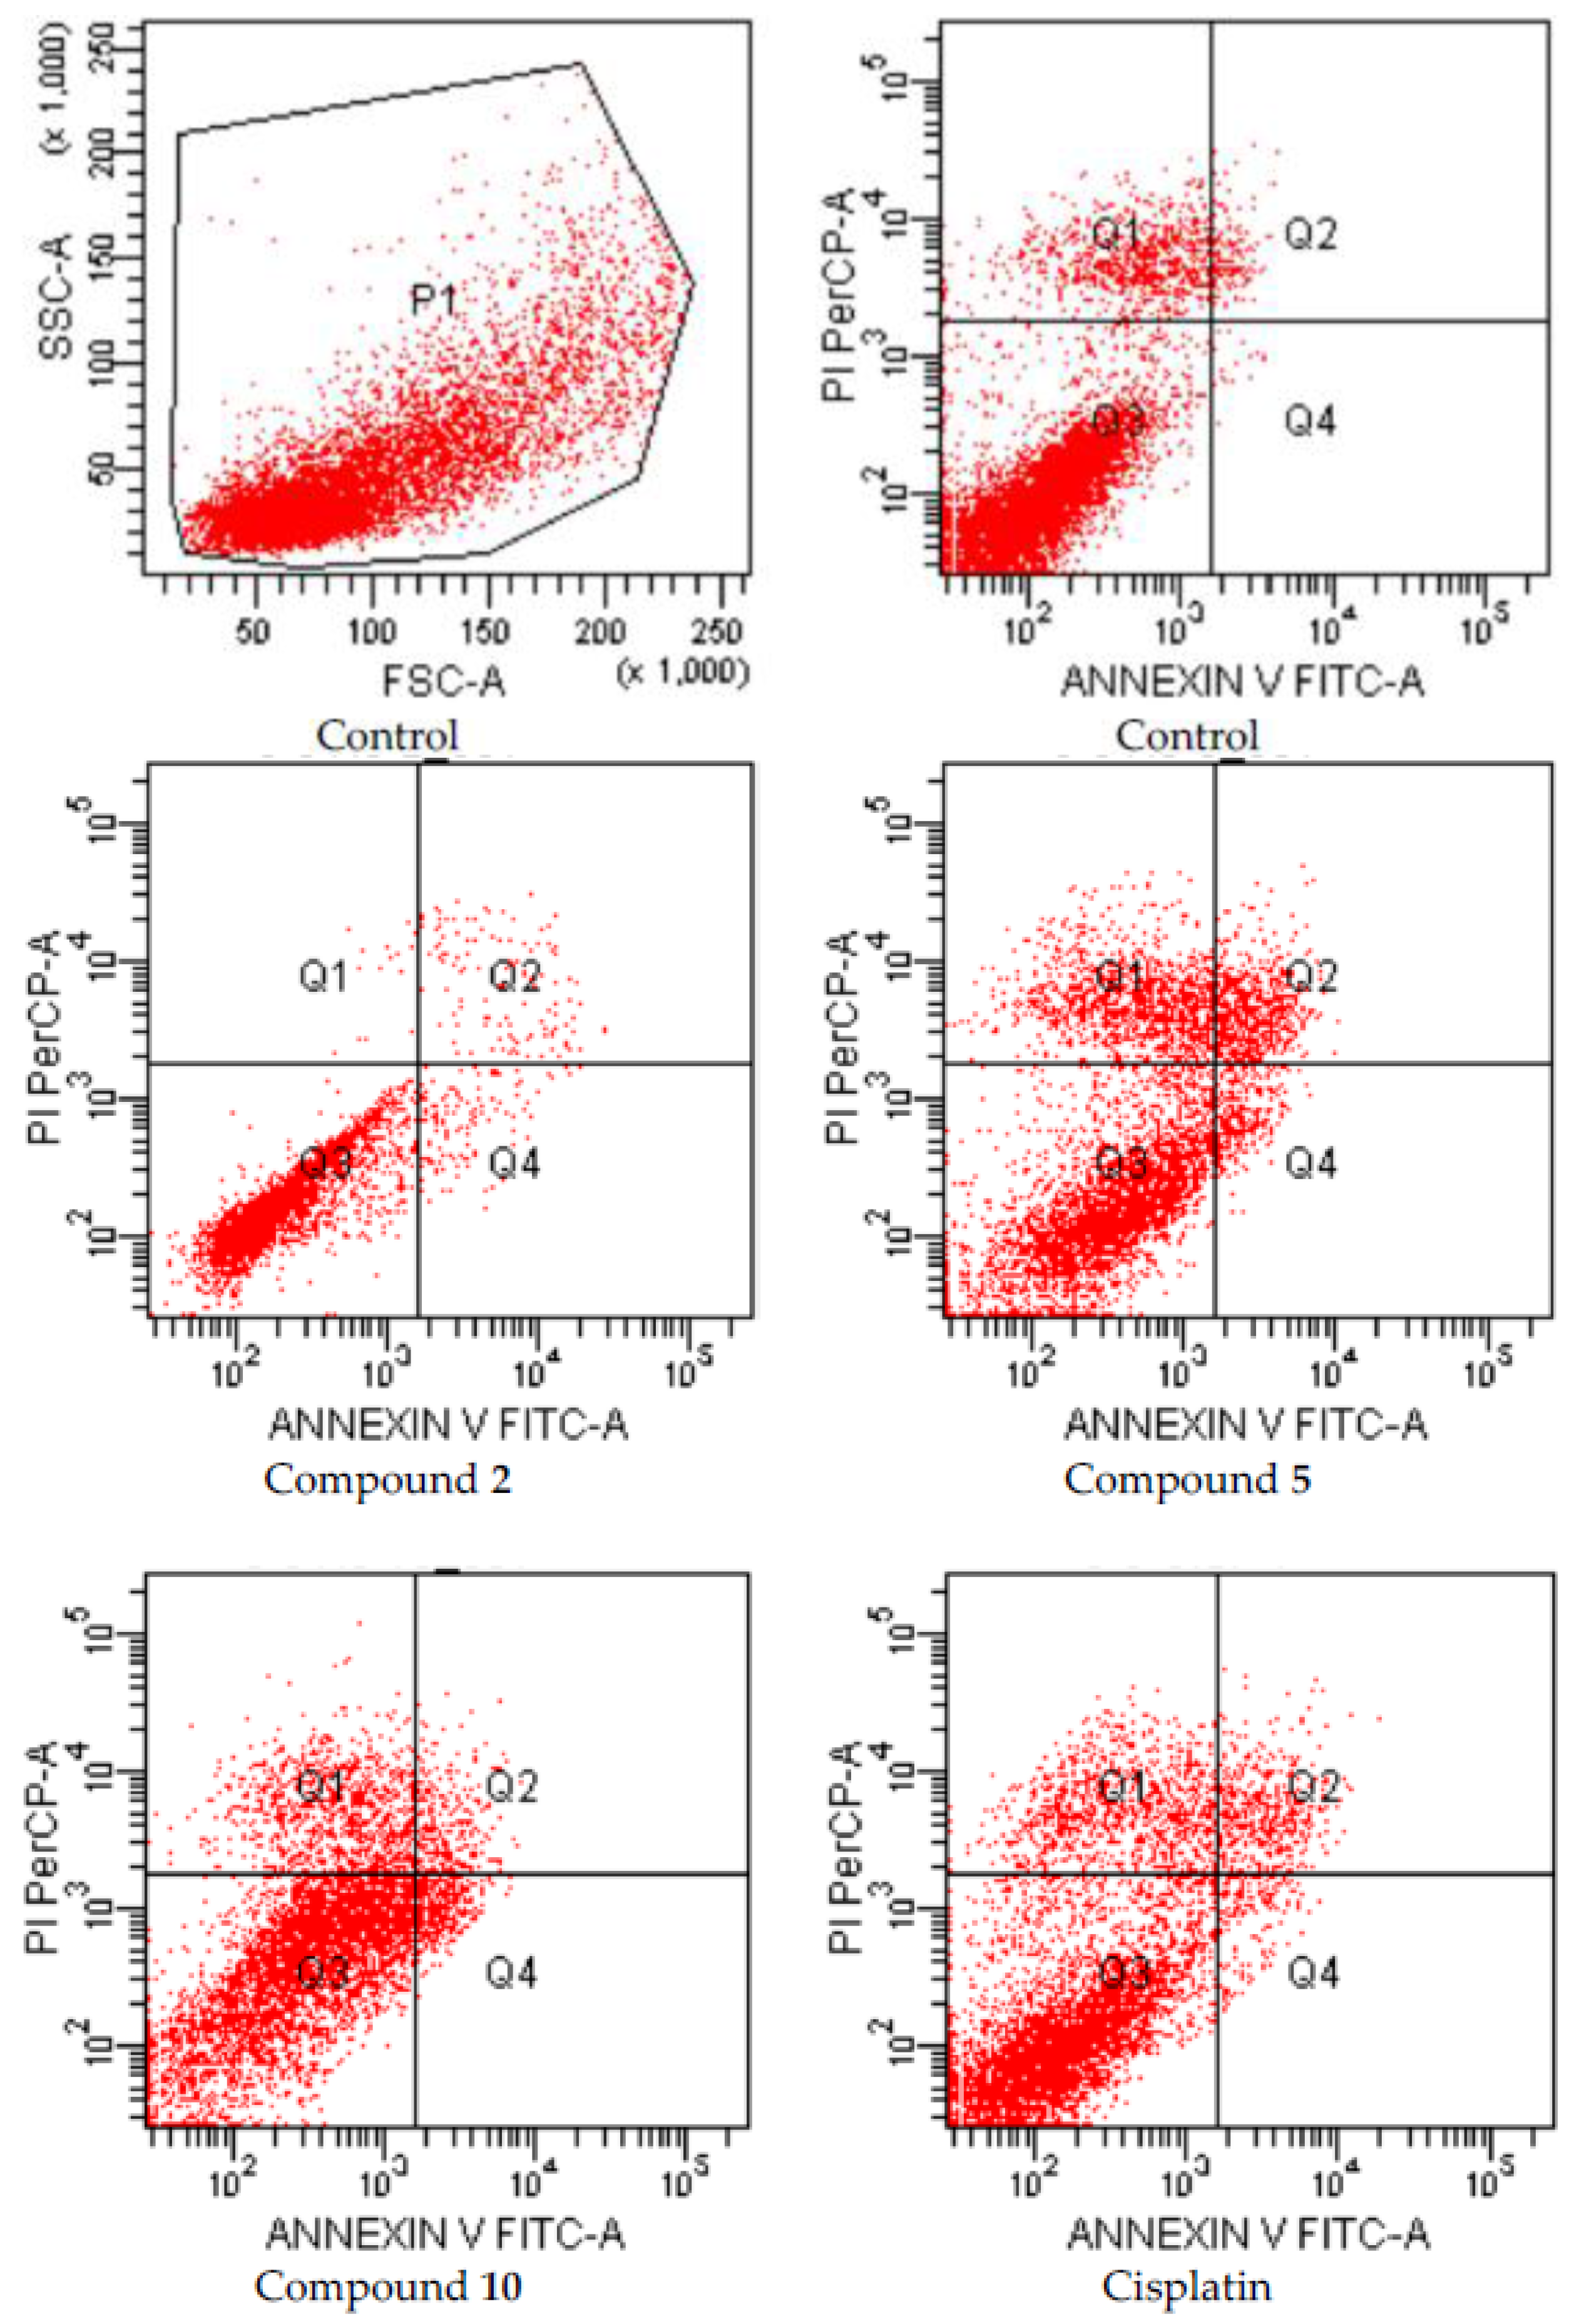
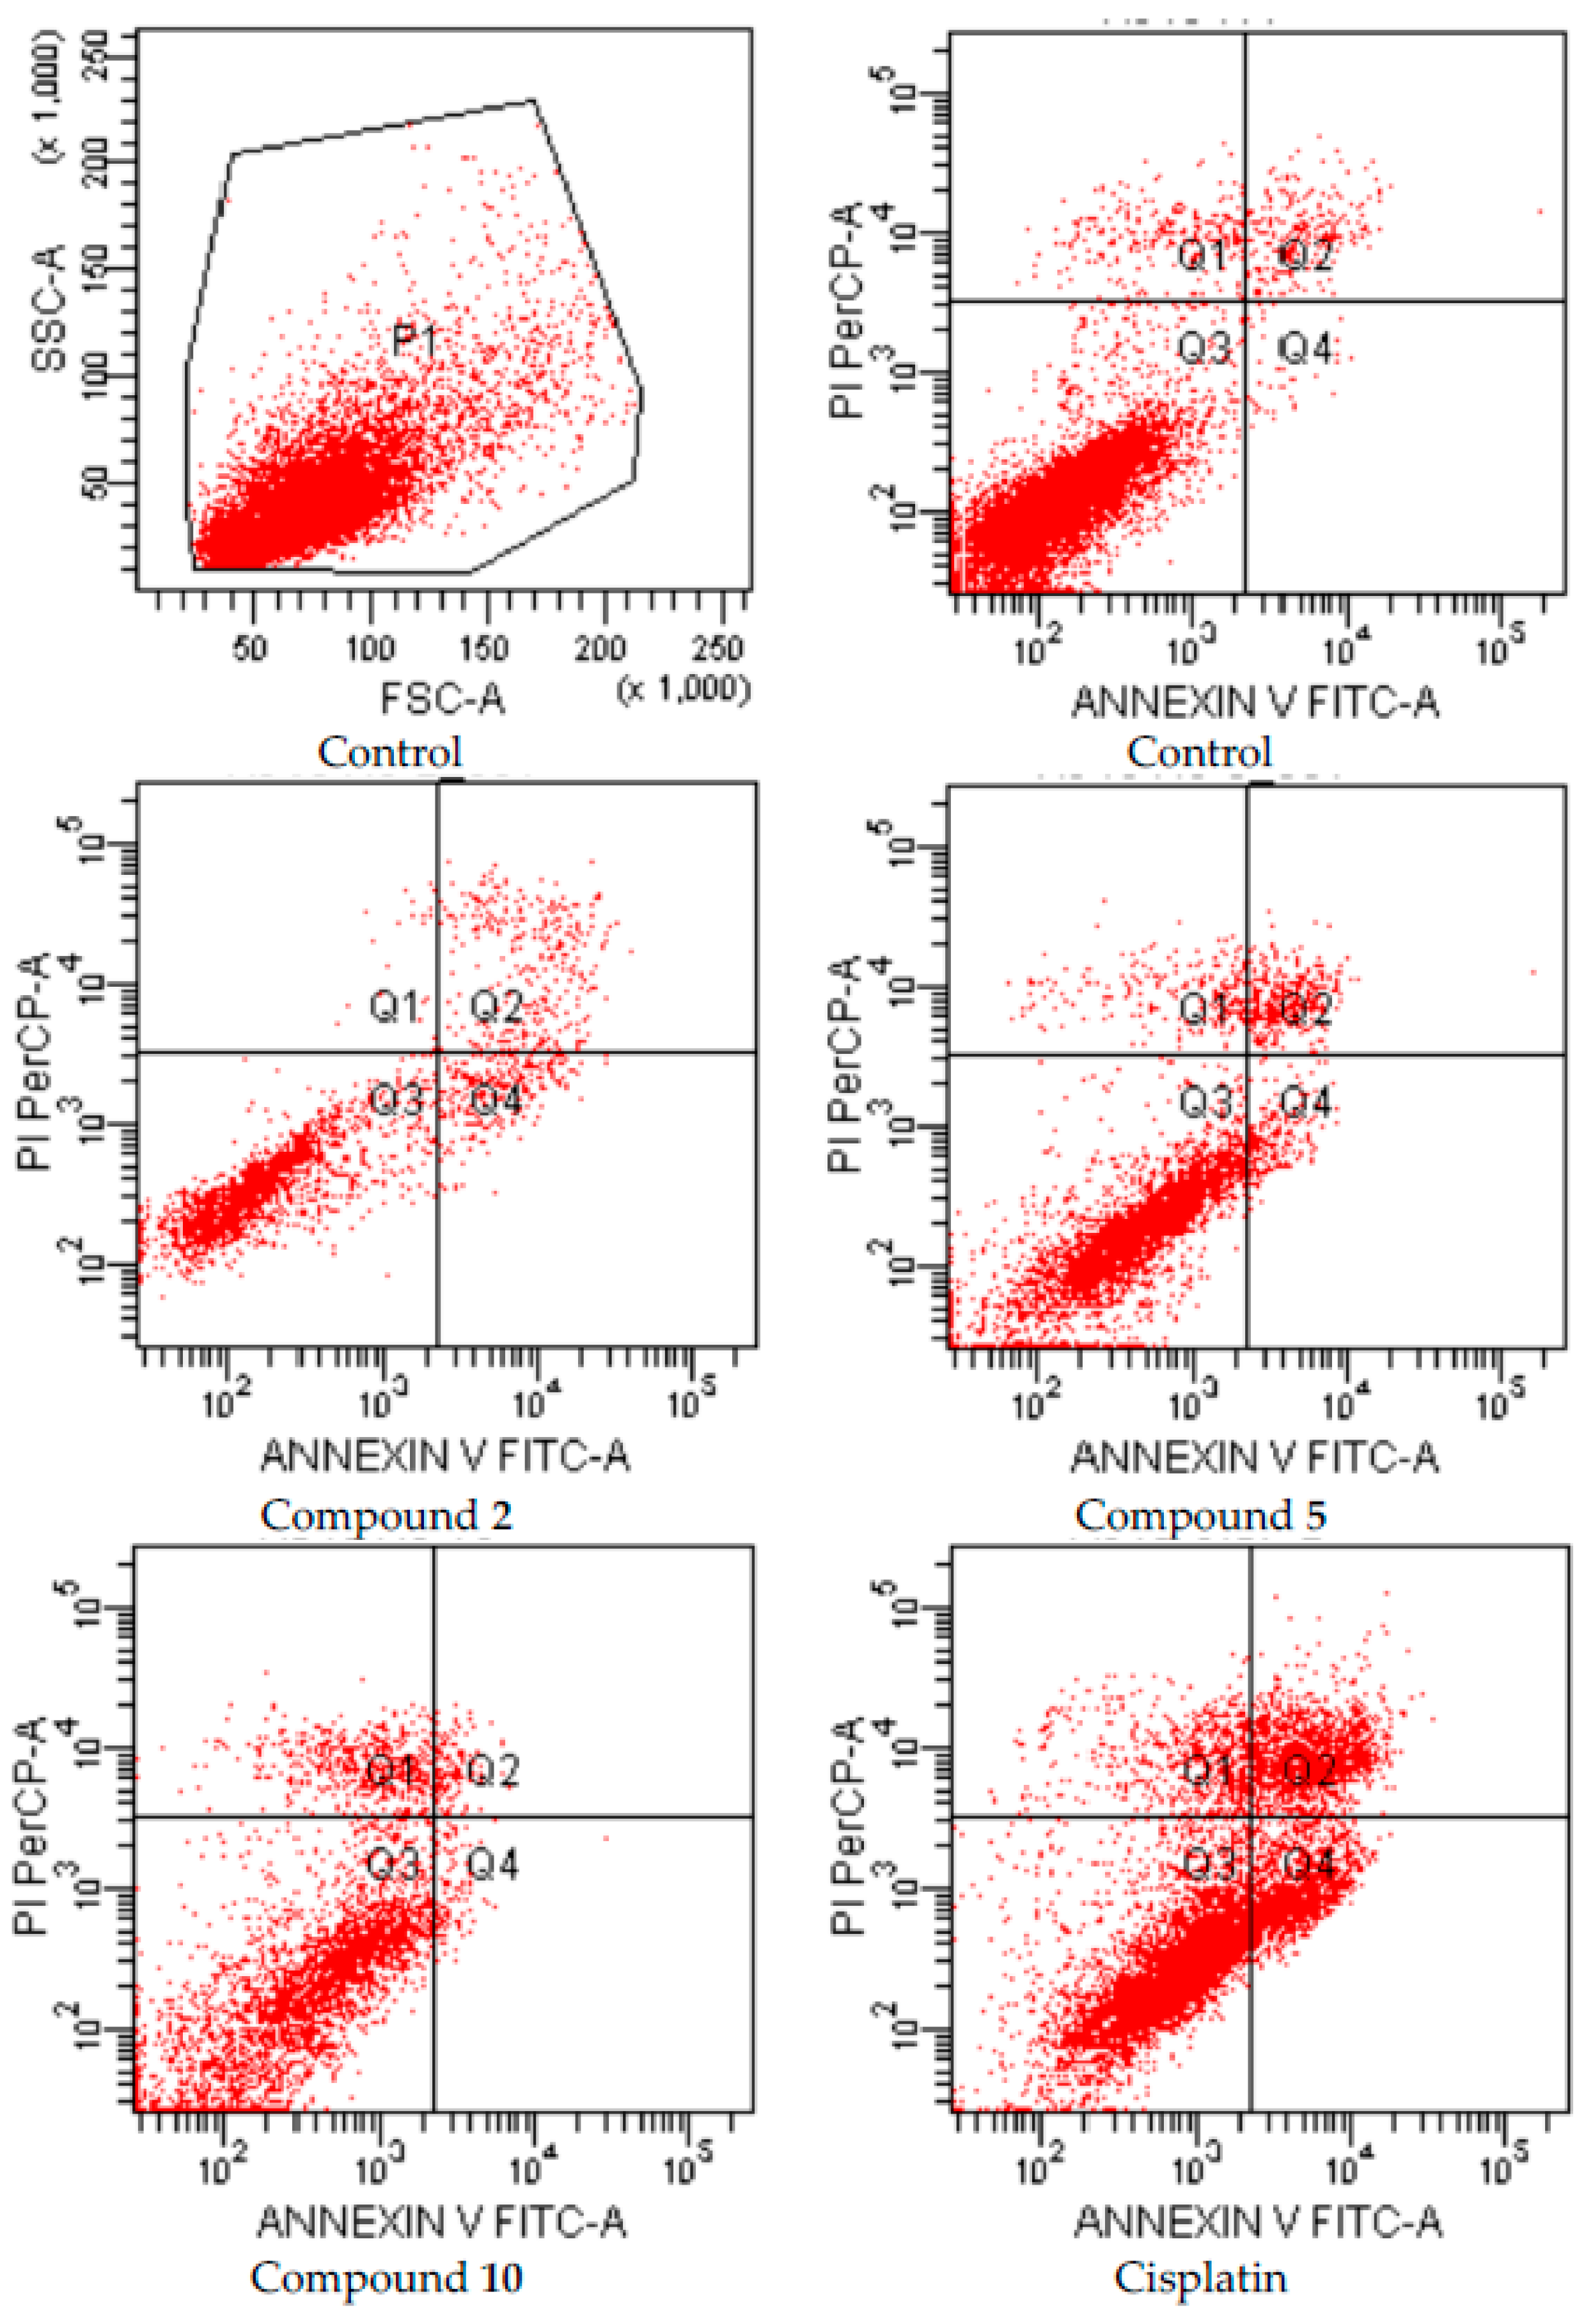
2.2.3. Evaluation of Flow Cytometric Analyses
Apoptosis
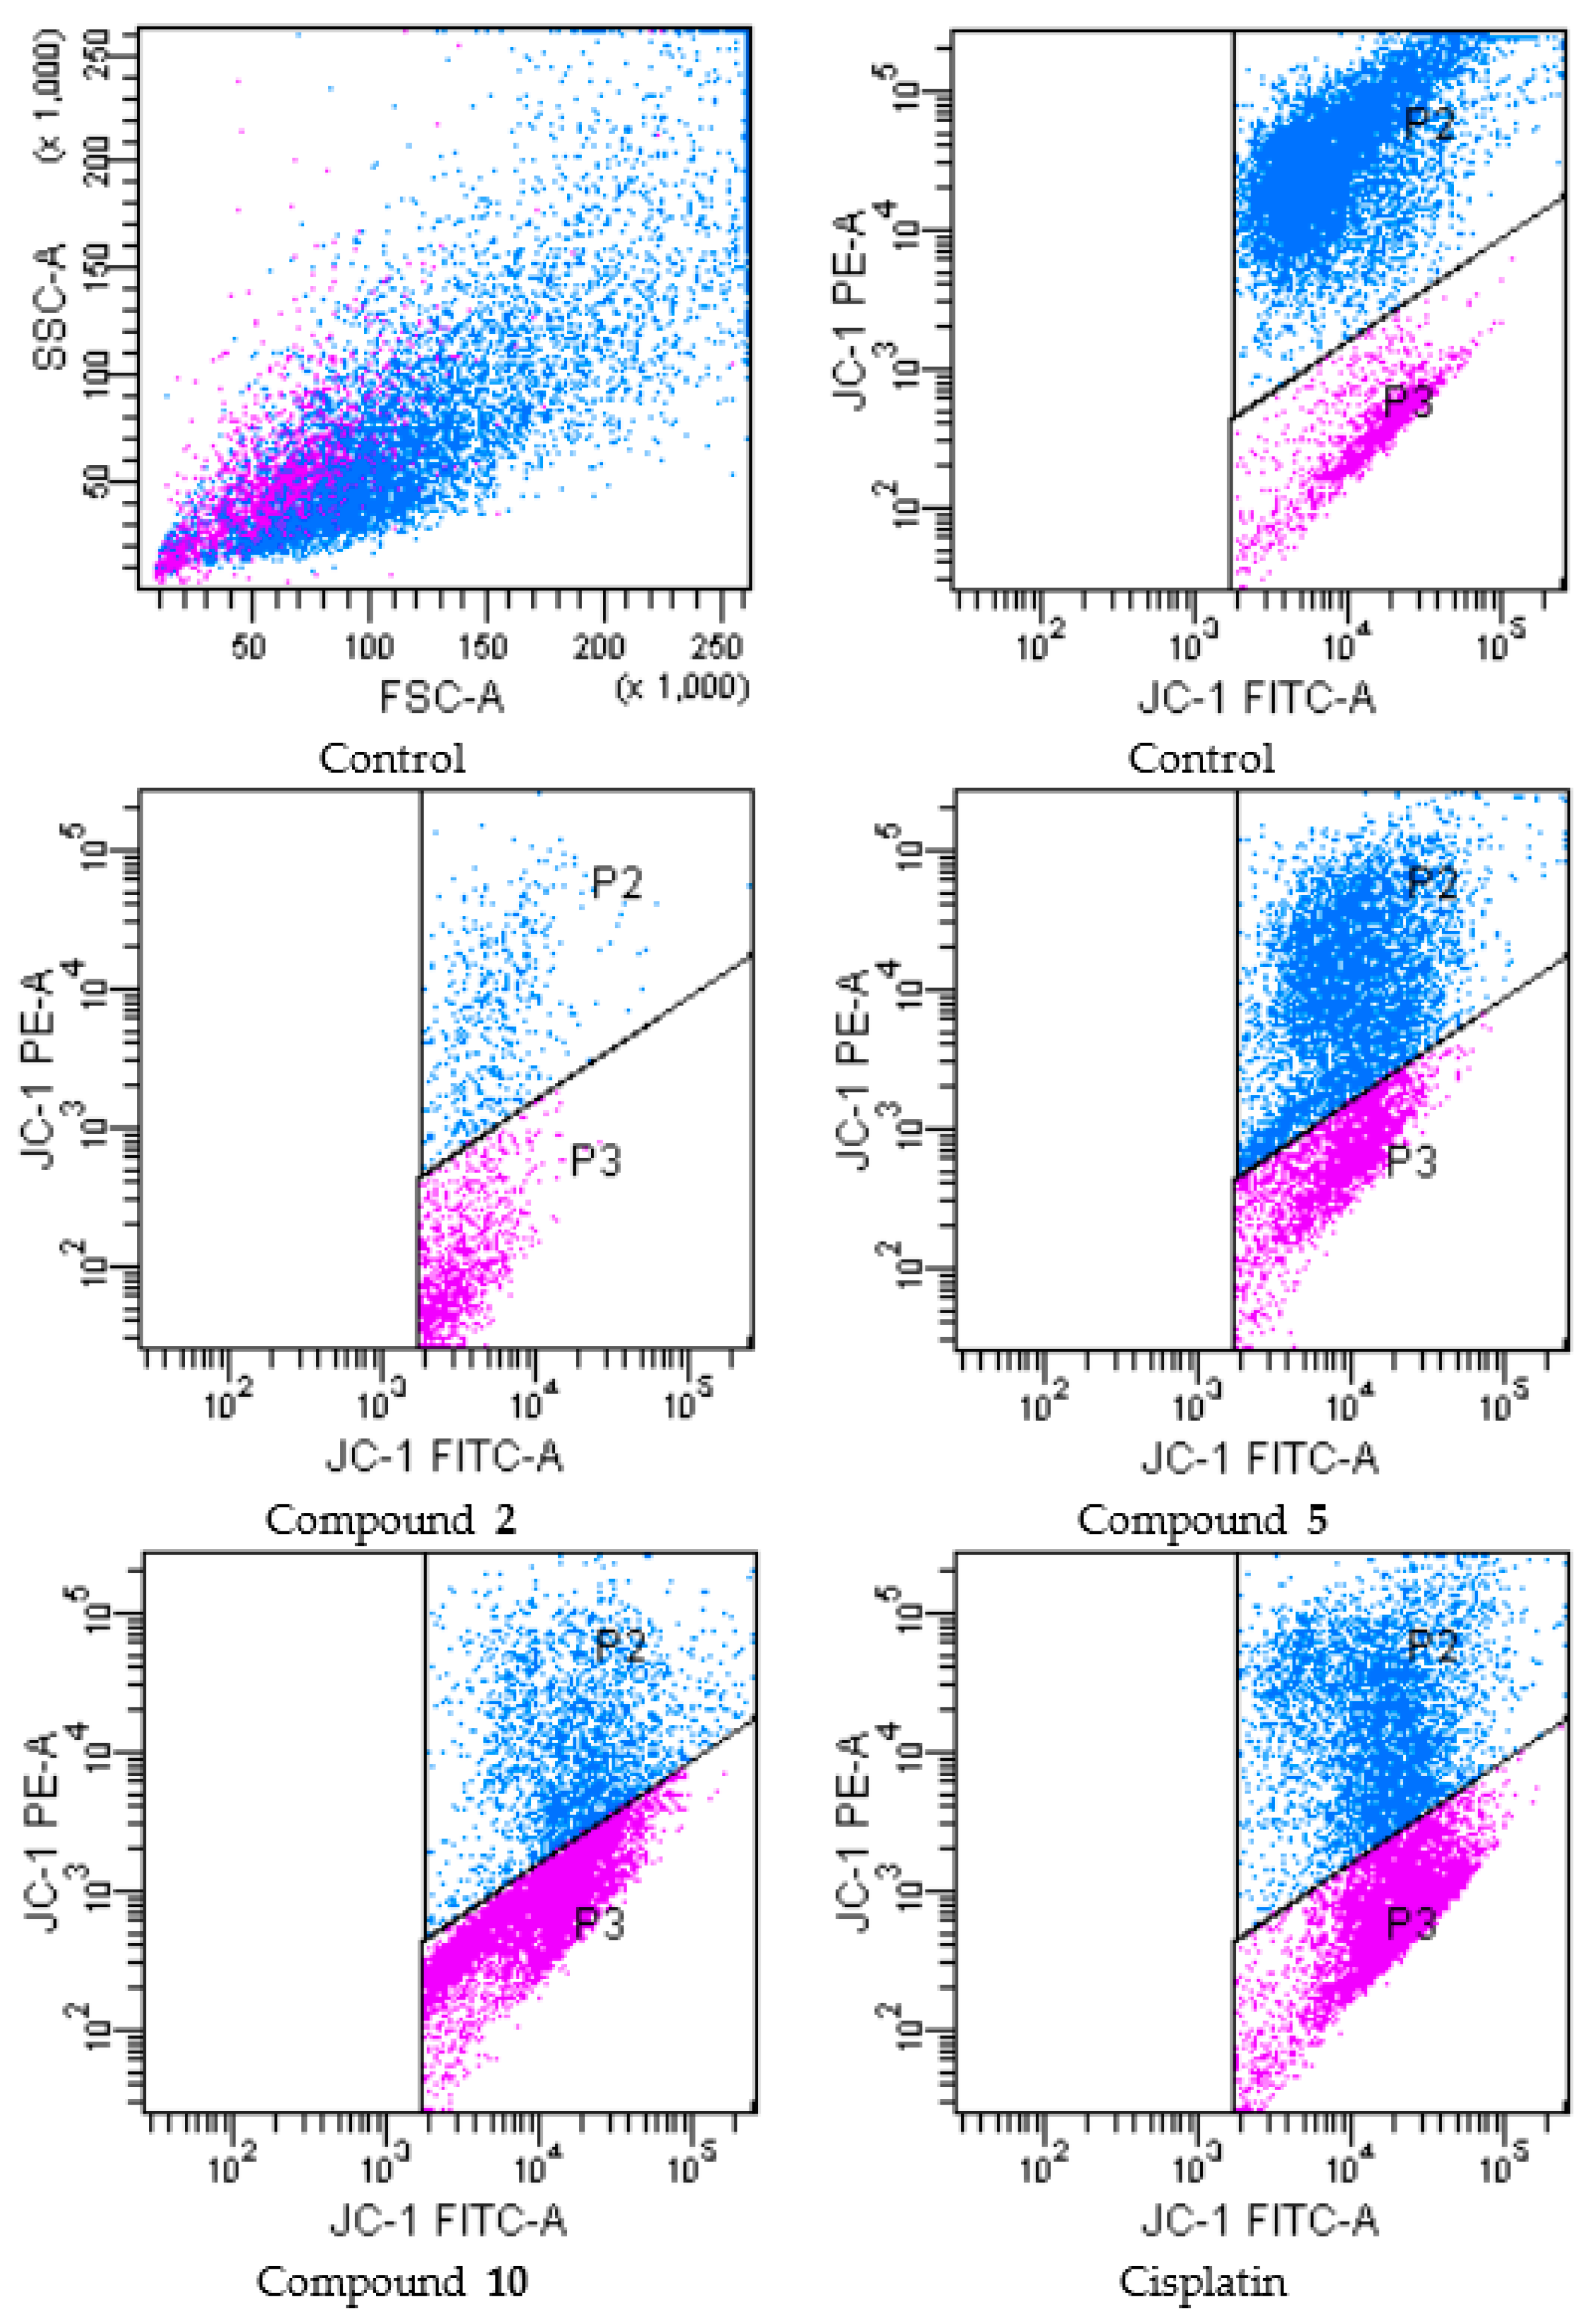
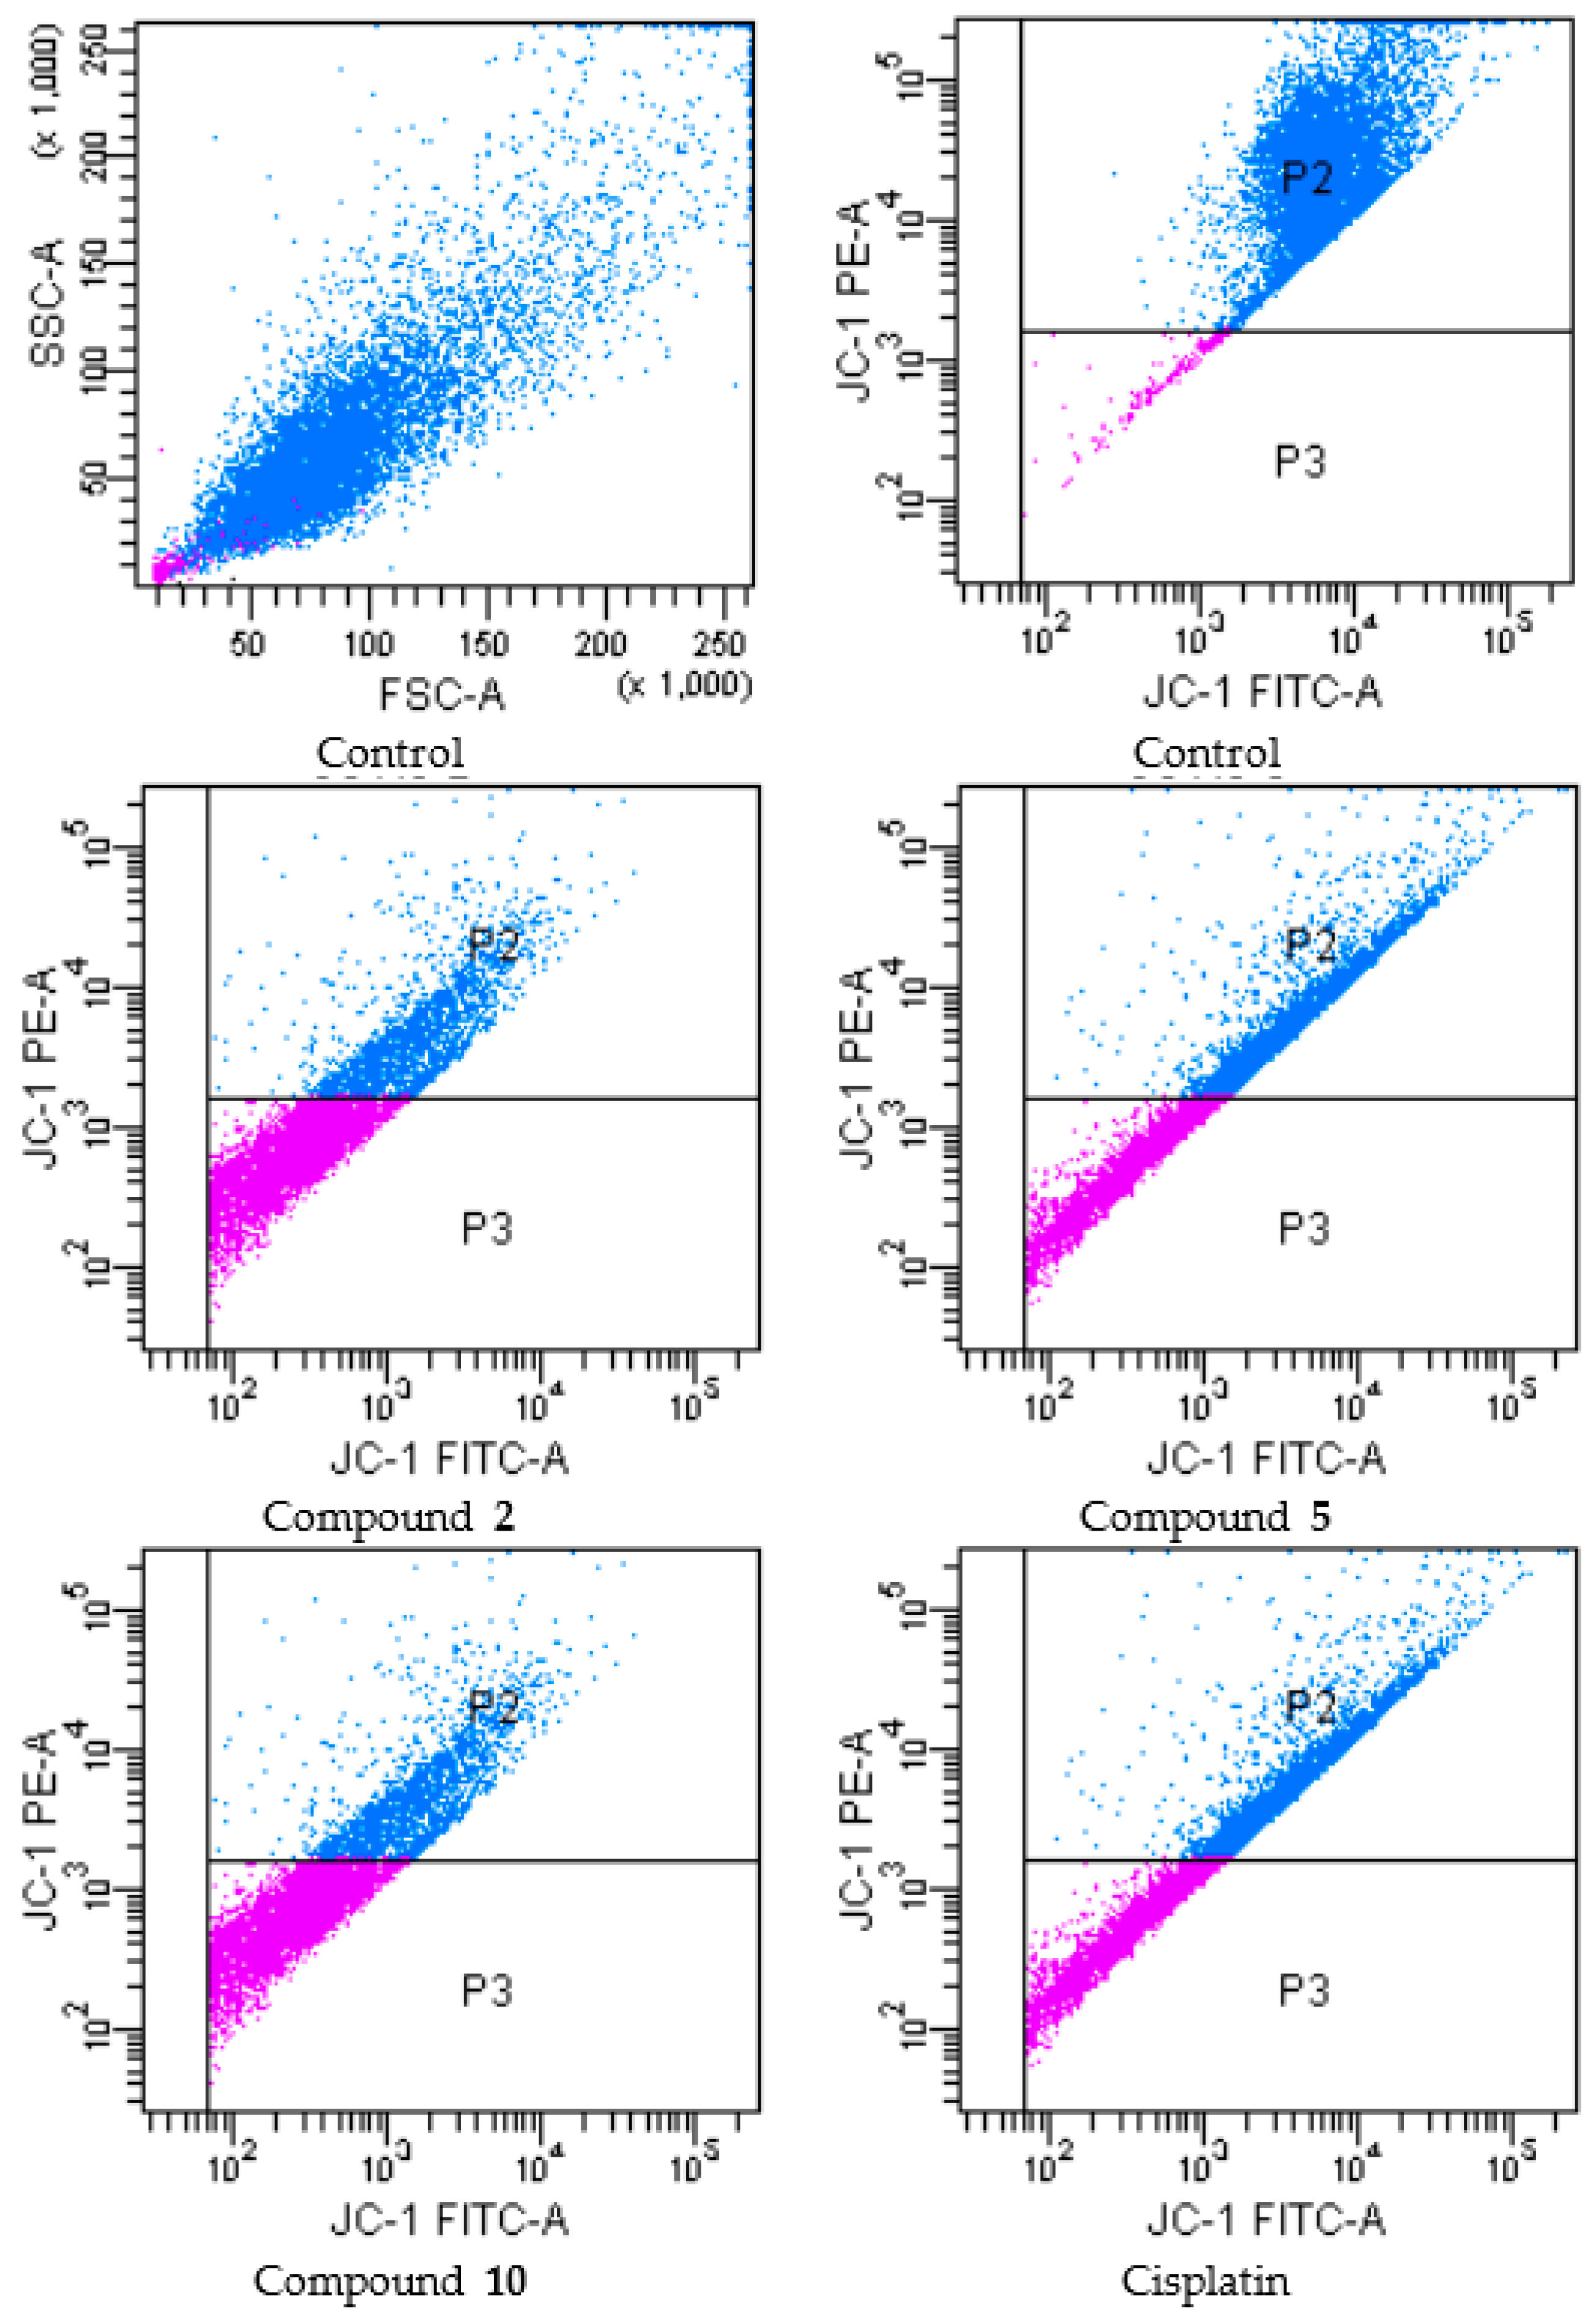
Mitochondrial Membrane Potential (JC-1)
2.2.4. Evaluation of AChE and BuChE Inhibition
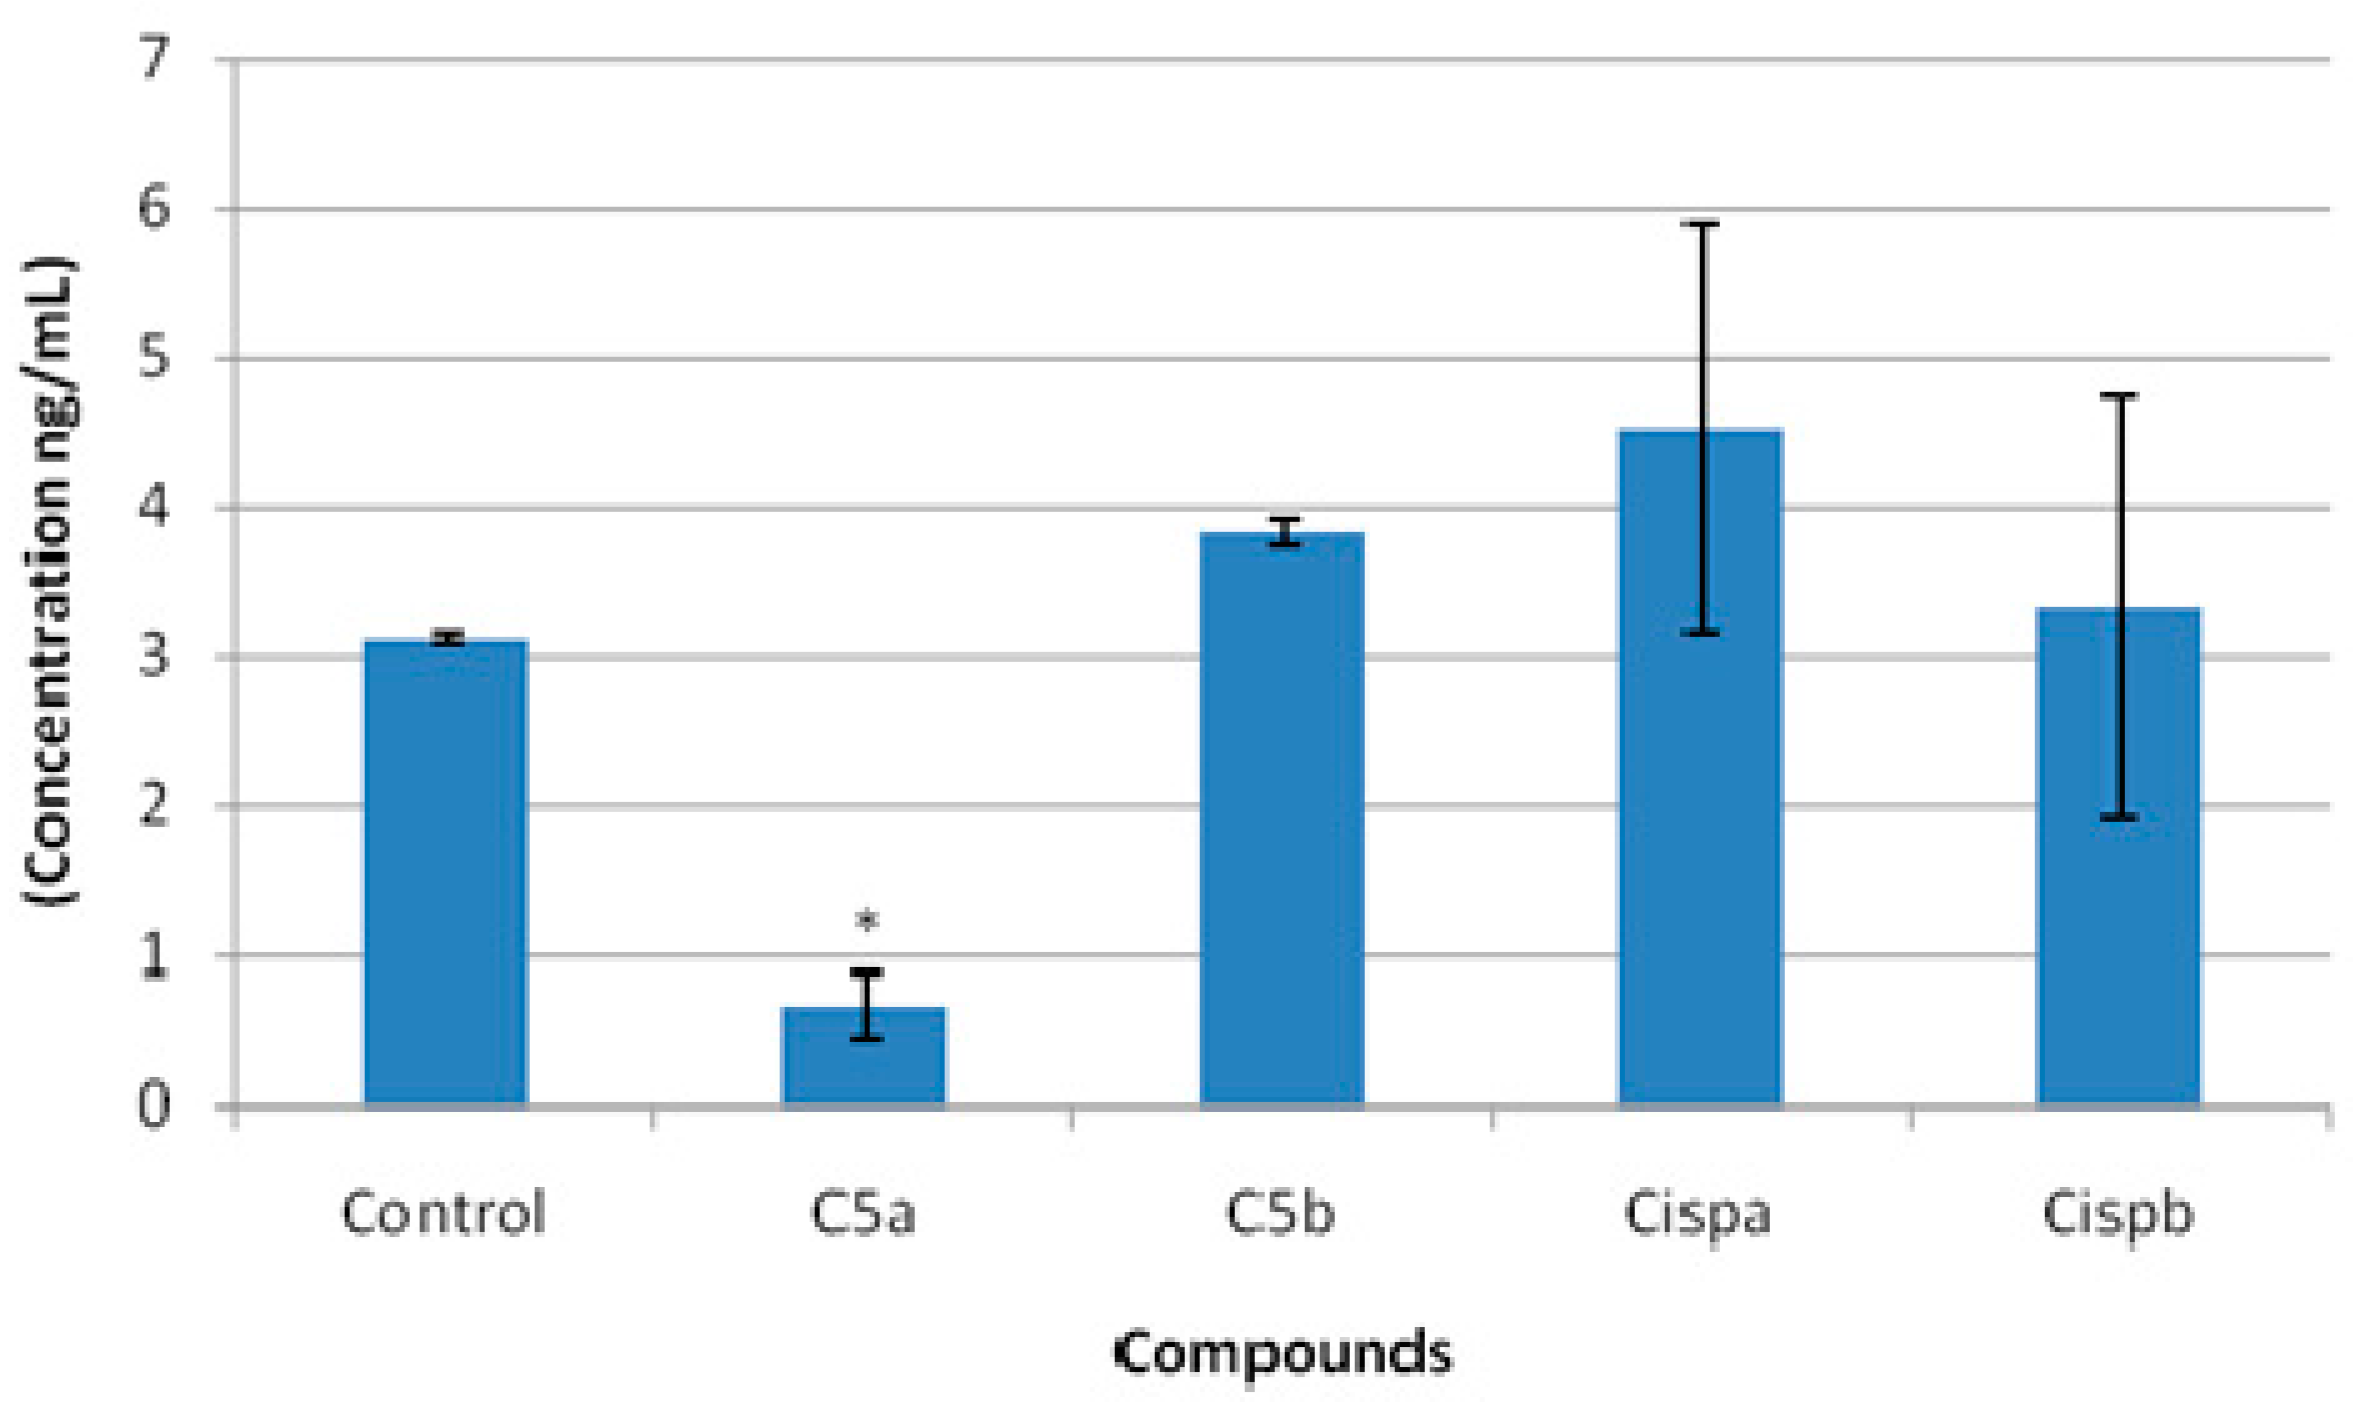
2.2.5. Evaluation of Sirtuin-1 Activity
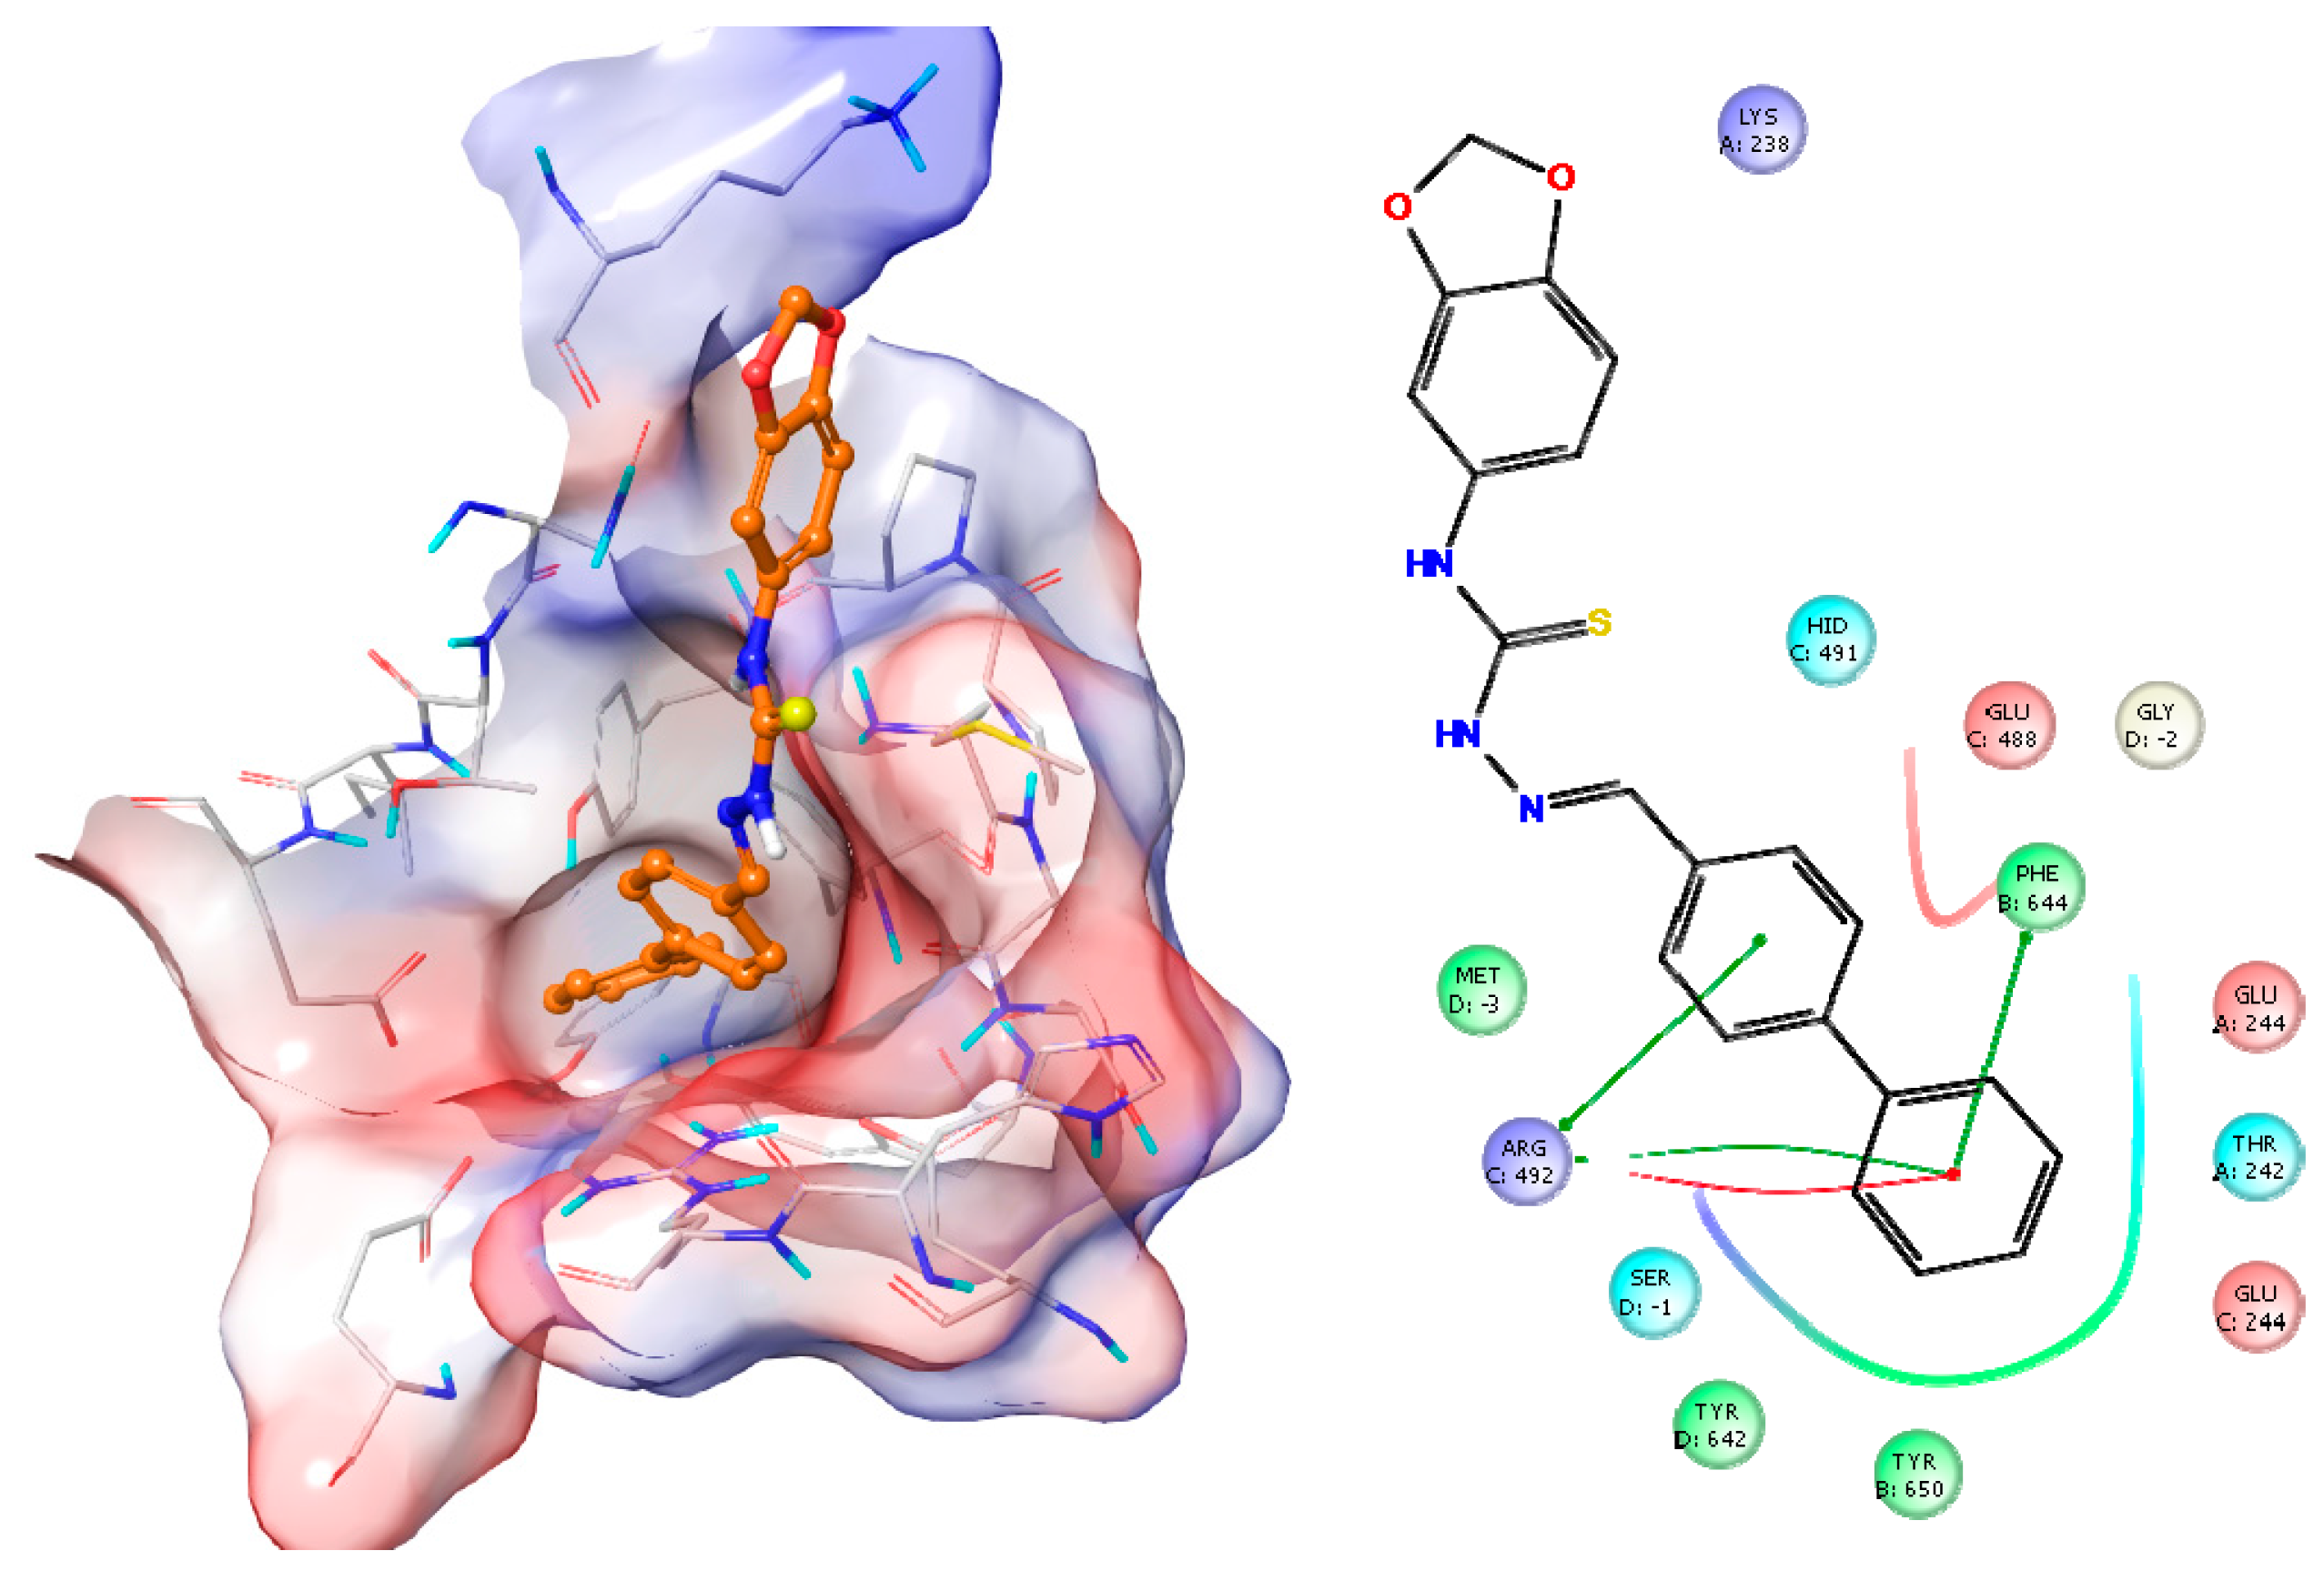
2.2.6. Docking Studies
3. Materials and Methods
3.1. General Information
3.2. General Procedures for the Synthesis of the Compounds
3.2.1. 4-(1,3-Benzodioxol-5-yl)thiosemicarbazide (A)
3.2.2. 4-(1,3-Benzodioxol-5-yl)-1-[(aryl)methylene]thiosemicarbazides 1–10
3.3. Biochemistry
3.3.1. Cell Culture and Drug Treatment
3.3.2. MTT Assay
3.3.3. Analysis of DNA Synthesis
3.3.4. Flow Cytometric Analyses of Apoptosis
3.3.5. Analysis of Mitochondrial Membrane Potential (JC-1) by Flow Cytometry
3.3.6. AChE and BuChE Inhibitory Activity
3.3.7. Sirtuin-1 Activity Detection by ELISA
3.3.8. Statistical Analyses
3.3.9. Docking Studies
4. Conclusions
Supplementary Materials
Acknowledgments
Author Contributions
Conflicts of Interest
References
- Silverstein, A.; Silverstein, V.; Silverstein Nunn, L. Cancer, Conquering a Deadly Disease; A Division of Lerner Publishing Group: Minneapolis, MN, USA, 2006; pp. 9–11. [Google Scholar]
- Ruddon, R.W. Cancer Biology, 4th ed.; Oxford University Press: New York, NY, USA, 2007; pp. 4–5. [Google Scholar]
- Almeida, C.A.; Barry, S.A. Cancer: Basic Science and Clinical Aspects; Wiley-Blackwell: Hoboken, NJ, USA, 2010; pp. 2–3. [Google Scholar]
- Giamas, G.; Man, Y.L.; Hirner, H.; Bischof, J.; Kramer, K.; Khan, K.; Ahmed, S.S.; Stebbing, J.; Knippschild, U. Kinases as targets in the treatment of solid tumors. Cell Signal 2010, 22, 984–1002. [Google Scholar] [CrossRef] [PubMed]
- Von Mehren, M.; Widmer, N. Correlations between imatinib pharmacokinetics, pharmacodynamics, adherence, and clinical response in advanced metastatic gastrointestinal stromal tumor (GIST): An emerging role for drug blood level testing? Cancer Treat. Rev. 2011, 37, 291–299. [Google Scholar] [CrossRef] [PubMed]
- Sestak, V.; Stariat, J.; Cermanova, J.; Potuckova, E.; Chladek, J.; Roh, J.; Bures, J.; Jansova, H.; Prusa, P.; Sterba, M.; et al. Novel and potent anti-tumor and anti-metastatic di-2-pyridylketone thiosemicarbazones demonstrate marked differences in pharmacology between the first and second generation lead agents. Oncotarget 2015, 6, 42411–42428. [Google Scholar] [PubMed]
- Massoulié, J.; Perrier, N.; Noureddine, H.; Liang, D.; Bon, S. Old and new questions about cholinesterases. Chem. Biol. Interact. 2008, 175, 30–44. [Google Scholar] [CrossRef] [PubMed]
- Pérez-Aguilar, B.; Vidal, C.J.; Palomec, G.; García-Dolores, F.; Gutiérrez-Ruiz, M.C.; Bucio, L.; Gómez-Olivares, J.L.; Gómez-Quiroz, L.E. Acetylcholinesterase is associated with a decrease in cell proliferation of hepatocellular carcinoma cells. Biochim. Biophys. Acta 2015, 1852, 1380–1387. [Google Scholar] [CrossRef] [PubMed]
- Xi, H.-J.; Wu, R.-P.; Liu, J.-J.; Zhang, L.-J.; Li, Z.-S. Role of acetylcholinesterase in lung cancer. Thorac. Cancer 2015, 6, 390–398. [Google Scholar] [CrossRef] [PubMed]
- Firestein, R.; Blander, G.; Michan, S.; Oberdoerffer, P.; Ogino, S.; Campbell, J.; Bhimavarapu, A.; Luikenhuis, S.; de Cabo, R.; Fuchs, C.; et al. The SIRT1 deacetylase suppresses intestinal tumorigenesis and colon cancer growth. PLoS ONE 2008, 3, 2020–2029. [Google Scholar] [CrossRef] [PubMed] [Green Version]
- Finkel, T.; Deng, C.X.; Mostoslavsky, R. Recent progress in the biology and physiology of sirtuins. Nature 2009, 460, 587–591. [Google Scholar] [CrossRef] [PubMed]
- Davenport, A.M.; Huber, F.M.; Hoelz, A. Structural and functional analysis of human SIRT1. J. Mol. Biol. 2014, 426, 526–541. [Google Scholar] [CrossRef] [PubMed]
- Feng, H.; Guo, P.; Wang, J.; Xu, J.; Xie, C.; Gao, F. Expression of Leptin and Sirtuin-1 is associated with poor prognosis in patients with osteosarcoma. Pathol. Res. Pract. 2016, 4, 319–324. [Google Scholar] [CrossRef] [PubMed]
- Lin, Z.; Fang, D. The Roles of SIRT1 in Cancer. Genes Cancer 2013, 4, 97–104. [Google Scholar] [CrossRef] [PubMed]
- Kalinowski, D.S.; Quach, P.; Richardson, D.R. Thiosemicarbazones: The new wave in cancer treatment. Future Med. Chem. 2009, 1, 1143–1151. [Google Scholar] [CrossRef] [PubMed]
- Chapman, T.R.; Kinsella, T.J. Ribonucleotide reductase inhibitors: A new look at an old target for radiosensitization. Front. Oncol. 2012, 1. [Google Scholar] [CrossRef] [PubMed]
- Moorthy, N.S.; Cerqueira, N.M.; Ramos, M.J.; Fernandes, P.A. Aryl- and heteroaryl-thiosemicarbazone derivatives and their metal complexes: A pharmacological template. Recent Pat. Anticancer Drug Discov. 2013, 8, 168–182. [Google Scholar] [CrossRef] [PubMed]
- Yu, Y.; Kalinowski, D.S.; Kovacevic, Z.; Siafakas, A.R.; Jansson, P.J.; Stefani, C.; Lovejoy, D.B.; Sharpe, P.C.; Bernhardt, P.V.; Richardson, D.R. Thiosemicarbazones from the old to new: İron chelators that are more than just ribonucleotide reductase inhibitors. J. Med. Chem. 2009, 52, 5271–5294. [Google Scholar] [CrossRef] [PubMed]
- Stefani, C.; Al-Eisawi, Z.; Jansson, P.J.; Kalinowski, D.S.; Richardson, D.R. Identification of differential anti-neoplastic activity of copper bis(thiosemicarbazones) that is mediated by intracellular reactive oxygen species generation and lysosomal membrane permeabilization. J. Inorg. Biochem. 2015, 152, 20–37. [Google Scholar] [CrossRef] [PubMed]
- Jagadeesh, M.; Rashmi, H.K.; Subba Rao, Y.; Sreenath Reddy, A.; Prathima, B.; Uma Maheswari Devi, P.; Reddy, A.V. Synthesis and spectroscopic characterization of 3,4-difluoroacetophenone-thiosemicarbazone and its palladium(II) complex: Evaluation of antimicrobial and antitumour activity. Spectrochim. Acta A Mol. Biomol. Spectrosc. 2013, 115, 583–587. [Google Scholar] [CrossRef] [PubMed]
- Taşdemir, D.; Karaküçük-İyidoğan, A.; Ulaşli, M.; Taşkin-Tok, T.; Oruç-Emre, E.E.; Bayram, H. Synthesis, molecular modeling, and biological evaluation of novel chiral thiosemicarbazone derivatives as potent anticancer agents. Chirality 2015, 27, 177–188. [Google Scholar] [CrossRef] [PubMed]
- Bacher, F.; Dömötör, O.; Chugunova, A.; Nagy, N.V.; Filipović, L.; Radulović, S.; Enyedy, É.A.; Arion, V.B. Strong effect of copper(II) coordination on antiproliferative activity of thiosemicarbazone-piperazine and thiosemicarbazone-morpholine hybrids. Dalton Trans. 2015, 44, 9071–9090. [Google Scholar] [CrossRef] [PubMed]
- Lin, Z.P.; Ratner, E.S.; Whicker, M.E.; Lee, Y.; Sartorelli, A.C. Triapine disrupts CtIP-mediated homologous recombination repair and sensitizes ovarian cancer cells to PARP and topoisomerase inhibitors. Mol. Cancer Res. 2014, 12, 381–393. [Google Scholar] [CrossRef] [PubMed]
- Wang, H.H.; Qiu, K.M.; Cui, H.E.; Yang, Y.S.; Yin-Luo; Xing, M.; Qiu, X.Y.; Bai, L.F.; Zhu, H.L. Synthesis, molecular docking and evaluation of thiazolyl-pyrazoline derivatives containing benzodioxole as potential anticancer agents. Bioorg. Med. Chem. 2013, 21, 448–455. [Google Scholar] [CrossRef] [PubMed]
- Malikova, J.; Swaczynova, J.; Kolar, Z.; Strnad, M. Anticancer and antiproliferative activity of natural brassinosteroids. Phytochemistry 2008, 69, 418–426. [Google Scholar] [CrossRef] [PubMed]
- Green, D.R.; Reed, J.C. Mitochondria and apoptosis. Science 1998, 281, 1309–1312. [Google Scholar] [CrossRef] [PubMed]
- Mosmann, T. Rapid colorimetric assay for cellular growth and survival: Application to proliferation and cytotoxicity assays. J. Immunol. Methods 1983, 16, 55–63. [Google Scholar] [CrossRef]
- Keiser, K.; Johnson, C.C.; Tipton, D.A. Cytotoxicity of mineral trioxide aggregate using human periodontal ligament fibroblasts. J. Endod. 2000, 26, 288–291. [Google Scholar] [CrossRef] [PubMed]
- Ellman, G.L.; Courtney, K.D.; Anders, V.; Featherstone, R.M. A new and rapid colorimetric determination of acetylcholinesterase activity. Biochem. Pharmacol. 1961, 7, 88–95. [Google Scholar] [CrossRef]
- Sample Availability: Samples of the compounds (1–10) are available from the authors.


| Compound | IC50 (µM) | ||
|---|---|---|---|
| A549 Cell Line | C6 Cell Line | NIH/3T3 Cell Line | |
| 1 | >167.0 | >167.0 | >167.0 |
| 2 | 24.0 ± 3.46 | 23.33 ± 2.08 | >145.2 |
| 3 | 28.0 ± 1.0 | 49.33 ± 1.15 | >154.1 |
| 4 | >146.0 | >146.0 | >146.0 |
| 5 | 10.67 ± 1.53 | 4.33 ± 1.04 | 21.33 ± 5.77 |
| 6 | >157.6 | >157.6 | 2.87 ± 0.05 |
| 7 | >149.7 | >149.7 | 9.50 ± 2.50 |
| 8 | >132.2 | >132.2 | 9.16 ± 2.47 |
| 9 | 51.5 ± 4.95 | 25.33 ± 1.53 | >135.8 |
| 10 | 29.67 ± 5.51 | 12.33 ± 4.93 | 38.33 ± 2.08 |
| Cisplatin | 3.0 ± 0.88 | 6.83 ± 0.28 | ND |
| Groups | Early and Late Apoptotic Cells % | Viability % | ||
|---|---|---|---|---|
| C6 Cells | A549 Cells | C6 Cells | A549 Cells | |
| Control (untreated) | 4.5 | 3.1 | 83.9 | 94.3 |
| Compound 2 treated cells | 5.4 | 23.7 | 94.5 | 75.2 |
| Compound 5 treated cells | 25.0 | 12.11 | 60.2 | 81.8 |
| Compound 10 treated cells | 15.8 | 6.2 | 69.6 | 81.2 |
| Cisplatin treated cells | 16.3 | 32.4 | 69.0 | 60.5 |
| Groups | P2 (%) | P3 (%) | ||
|---|---|---|---|---|
| C6 Cells | A549 Cells | C6 Cells | A549 Cells | |
| Control (untreated) | 98.3 | 82.6 | 1.7 | 13.1 |
| Compound 2 treated cells | 44.8 | 4.5 | 21.1 | 9.8 |
| Compound 5 treated cells | 49.8 | 52.7 | 45.0 | 24.6 |
| Compound 10 treated cells | 35.1 | 21.9 | 63.7 | 57.9 |
| Cisplatin treated cells | 46.6 | 41.4 | 48.4 | 54.0 |
| Compound | IC50 (µM) | |
|---|---|---|
| AChE | BuChE | |
| 1 | >267.25 | --- |
| 2 | >232.32 | --- |
| 3 | --- | --- |
| 4 | >233.68 | --- |
| 5 | --- | --- |
| 6 | >252.10 | --- |
| 7 | >239.67 | >239.67 |
| 8 | >211.51 | >211.51 |
| 9 | 205.0 ± 5.0 | --- |
| 10 | 108.0 ± 3.53 | >189.46 |
| Galantamine | 1.83 ± 0.21 | 18.17 ± 0.76 |
| Compound | SIRT1 Concentration (ng/mL) |
|---|---|
| Control | 3.12 ± 0.03 |
| Compound 5 a | 0.67 ± 0.22 |
| Compound 5 b | 3.82 ± 0.08 |
| Cisplatin a | 4.53 ± 1.37 |
| Cisplatin b | 3.32 ± 1.41 |
© 2016 by the authors. Licensee MDPI, Basel, Switzerland. This article is an open access article distributed under the terms and conditions of the Creative Commons Attribution (CC-BY) license ( http://creativecommons.org/licenses/by/4.0/).
Share and Cite
Altıntop, M.D.; Temel, H.E.; Sever, B.; Akalın Çiftçi, G.; Kaplancıklı, Z.A. Synthesis and Evaluation of New Benzodioxole- Based Thiosemicarbazone Derivatives as Potential Antitumor Agents. Molecules 2016, 21, 1598. https://doi.org/10.3390/molecules21111598
Altıntop MD, Temel HE, Sever B, Akalın Çiftçi G, Kaplancıklı ZA. Synthesis and Evaluation of New Benzodioxole- Based Thiosemicarbazone Derivatives as Potential Antitumor Agents. Molecules. 2016; 21(11):1598. https://doi.org/10.3390/molecules21111598
Chicago/Turabian StyleAltıntop, Mehlika Dilek, Halide Edip Temel, Belgin Sever, Gülşen Akalın Çiftçi, and Zafer Asım Kaplancıklı. 2016. "Synthesis and Evaluation of New Benzodioxole- Based Thiosemicarbazone Derivatives as Potential Antitumor Agents" Molecules 21, no. 11: 1598. https://doi.org/10.3390/molecules21111598