Article

Effects of Light Intensity on the Growth, Photosynthetic Characteristics, and Flavonoid Content of Epimedium pseudowushanense B.L.Guo

Institute of Medicinal Plant Development, Chinese Academy of Medical Sciences, Peking Union Medical College, Beijing 100193, China
*
Author to whom correspondence should be addressed.
Molecules 2016, 21(11), 1475; https://doi.org/10.3390/molecules21111475
Submission received: 7 October 2016 / Revised: 29 October 2016 / Accepted: 2 November 2016 / Published: 4 November 2016

Abstract

:
Epimedium pseudowushanense B.L.Guo is used in traditional medicine as an aphrodisiac and to strengthen muscles and bones. Several recent reports have shown that flavonoids from Epimedium also significantly affect the treatment of breast cancer, liver cancer, and leukemia. However, few studies have examined the medicinal-ingredient yield of Epimedium, a light-demanding shade herb, under different light intensities. To investigate the effects of light intensity on medicinal-ingredient yields, Epimedium was exposed to five levels of light intensity until harvest time. Leaf dry biomass under L4 was the highest among different light treatments. L4 was also associated with the highest net photosynthetic rate. Quantification of epimedin A, epimedin B, epimedin C, and icariin showed that L3 produced the highest amount of epimedin C, and that flavonoid content responded to light levels differently. Results indicated that L3 and L4 were the optimal light levels for medicinal-ingredient yield.

1. Introduction

Epimedii Folium, commonly called Yinyanghuo, is an important perennial shade herb in traditional Chinese medicine. Epimedium belongs to the Berberidaceae family and is widely used as an aphrodisiac and to strengthen muscles and bones. Epimedium leaves contain high amounts of flavonoid glycosides, such as epimedin A, epimedin B, epimedin C, and icariin [1,2]. Recent reports have shown that flavonoids from Epimedium significantly affect the treatment of breast cancer, liver cancer, and leukemia [3,4,5]. The recognition of the health benefits of Epimedium has increased its market demand. However, its resource recycling rate is low and environmentally dependent. Furthermore, its natural sources are endangered, further increasing prices. Commercial culture can address resource constraints of Epimedium. E. pseudowushanense B.L.Guo is an important resource of Epimedii Folium and is the first Epimedium species introduced and cultivated in Guizhou Province, China.
Light is an important environmental factor influencing plant growth, development, and secondary metabolism [6]. Under high light conditions, certain plant species, such as bayberry trees, do not grow because light irradiance decreases photosynthetic rates [7]. Therefore, all plants have their own optimal light intensity ranges for growth. Light intensity that is too high or too low impacts morphology, photosynthetic physiology, and secondary metabolite production. These characteristics are closely related to medicinal plant productivity. For example, Ma and others [8] reported that Camptotheca acuminata grown under 75% irradiance had significantly greater height, net photosynthetic rate (Pn), stomatal conductance (gs), total aboveground biomass, and chlorophyll fluorescence than plants grown under 100% (1500 ± 30 μmol·m−2·s−1), 50%, and 25% irradiance.
The function of different flavonoids varies according to the structure and specific flavonoids are involved for instance in limiting exogenous microbial growth, helping generate new fruits or leaves, providing light protection, and enhancing antioxidant defense [9,10]. Qualitative and quantitative composition of flavonoids varies under different environments [9]. Changes in light intensity may influence flavonoid content because the flavonoid hydroxyl groups on the A and B rings vary in number and position. Several studies have shown that high light irradiance promotes the biosynthesis of flavonoids, such as dihydroxy B-ring-substituted flavonoids (luteolin 7-O- and quercetin 3-O-glycosides) but does not influence the biosynthesis of monohydroxy B-ring-substituted flavonoids (pigenin 7-O- and kaempferol 3-O-glycosides) [11,12,13,14]. Pacheco and others [15] reported that Piper aduncum grown under 50% natural light irradiance had higher total flavonoid concentration than those grown under 100% natural irradiance. Based on these reports and the harvest time of E. pseudowushanense, the present study exposed Epimedium to five different light intensities for 60 days.
In the natural environment, E. pseudowushanense grows in woodlands, scrub, and forest edges. In commercial culture, E. pseudowushanense seedlings are usually shade-grown by a simulated wild cultivation method. However, our understanding of the photosynthesis and flavonoid content of E. pseudowushanense under shade management is limited. This study aims to determine the optimal light conditions for commercial Epimedium production. This study also aims to investigate flavonoid accumulation in Epimedium under different light intensities to improve its propagation and cultivation. The results of the present study may contribute to the scientific culture and management of Epimedium, as well as provide a reference for other Epimedium species. We anticipate that our results will improve our understanding of the changes in photosynthetic parameters and concentrations of secondary metabolites in Epimedium under different light treatments. Our results will provide a sound theoretical foundation for the standardized cultivation of this important medicinal plant.

2. Results

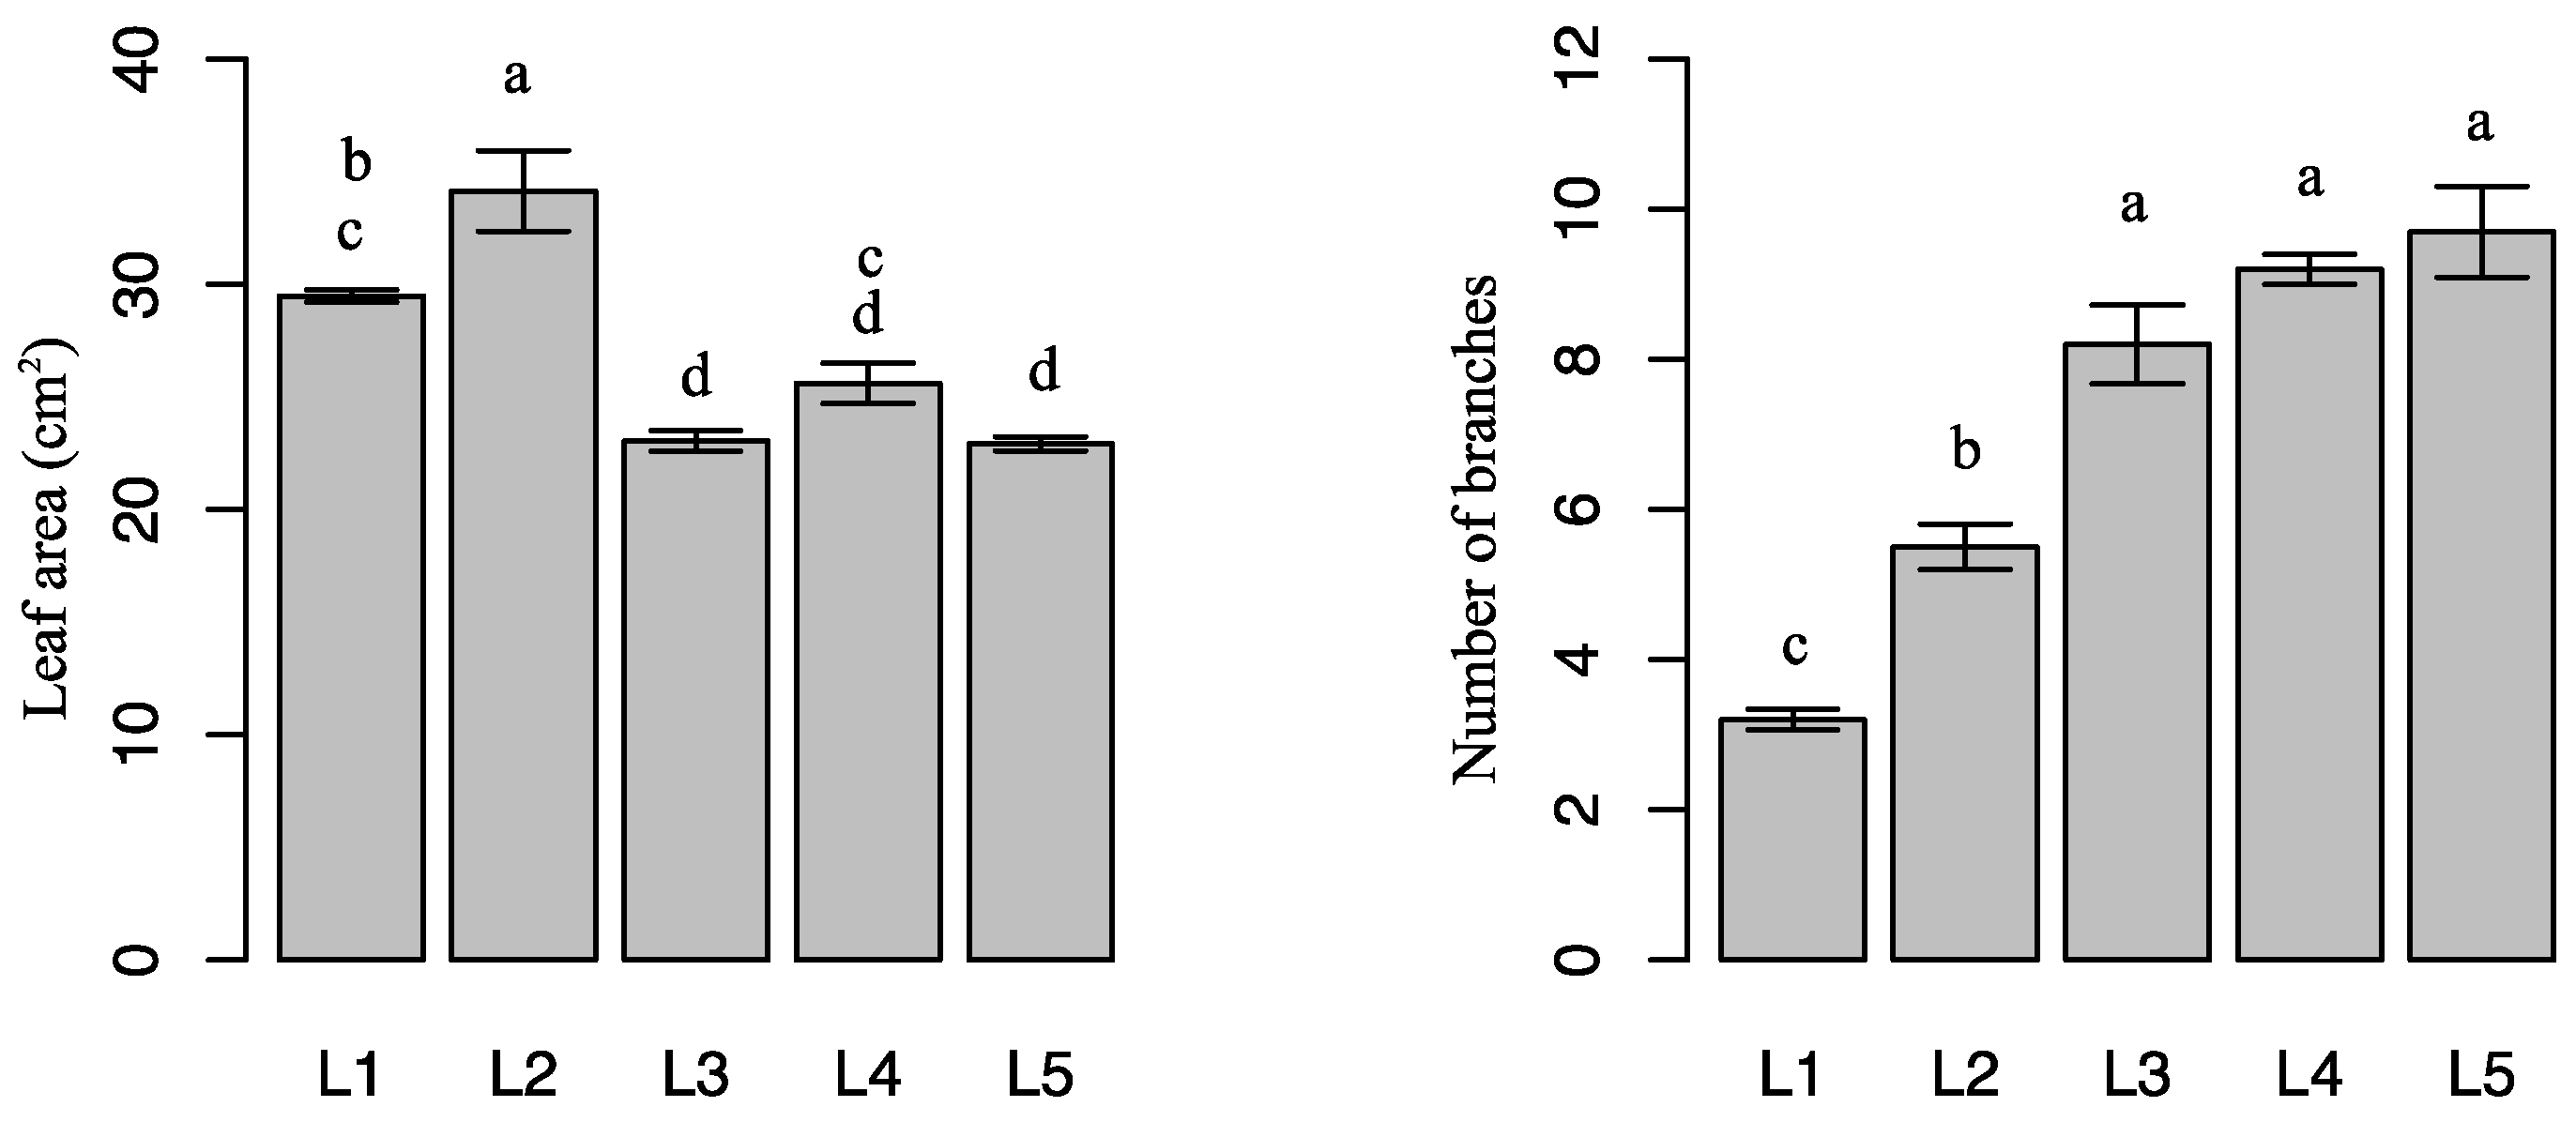
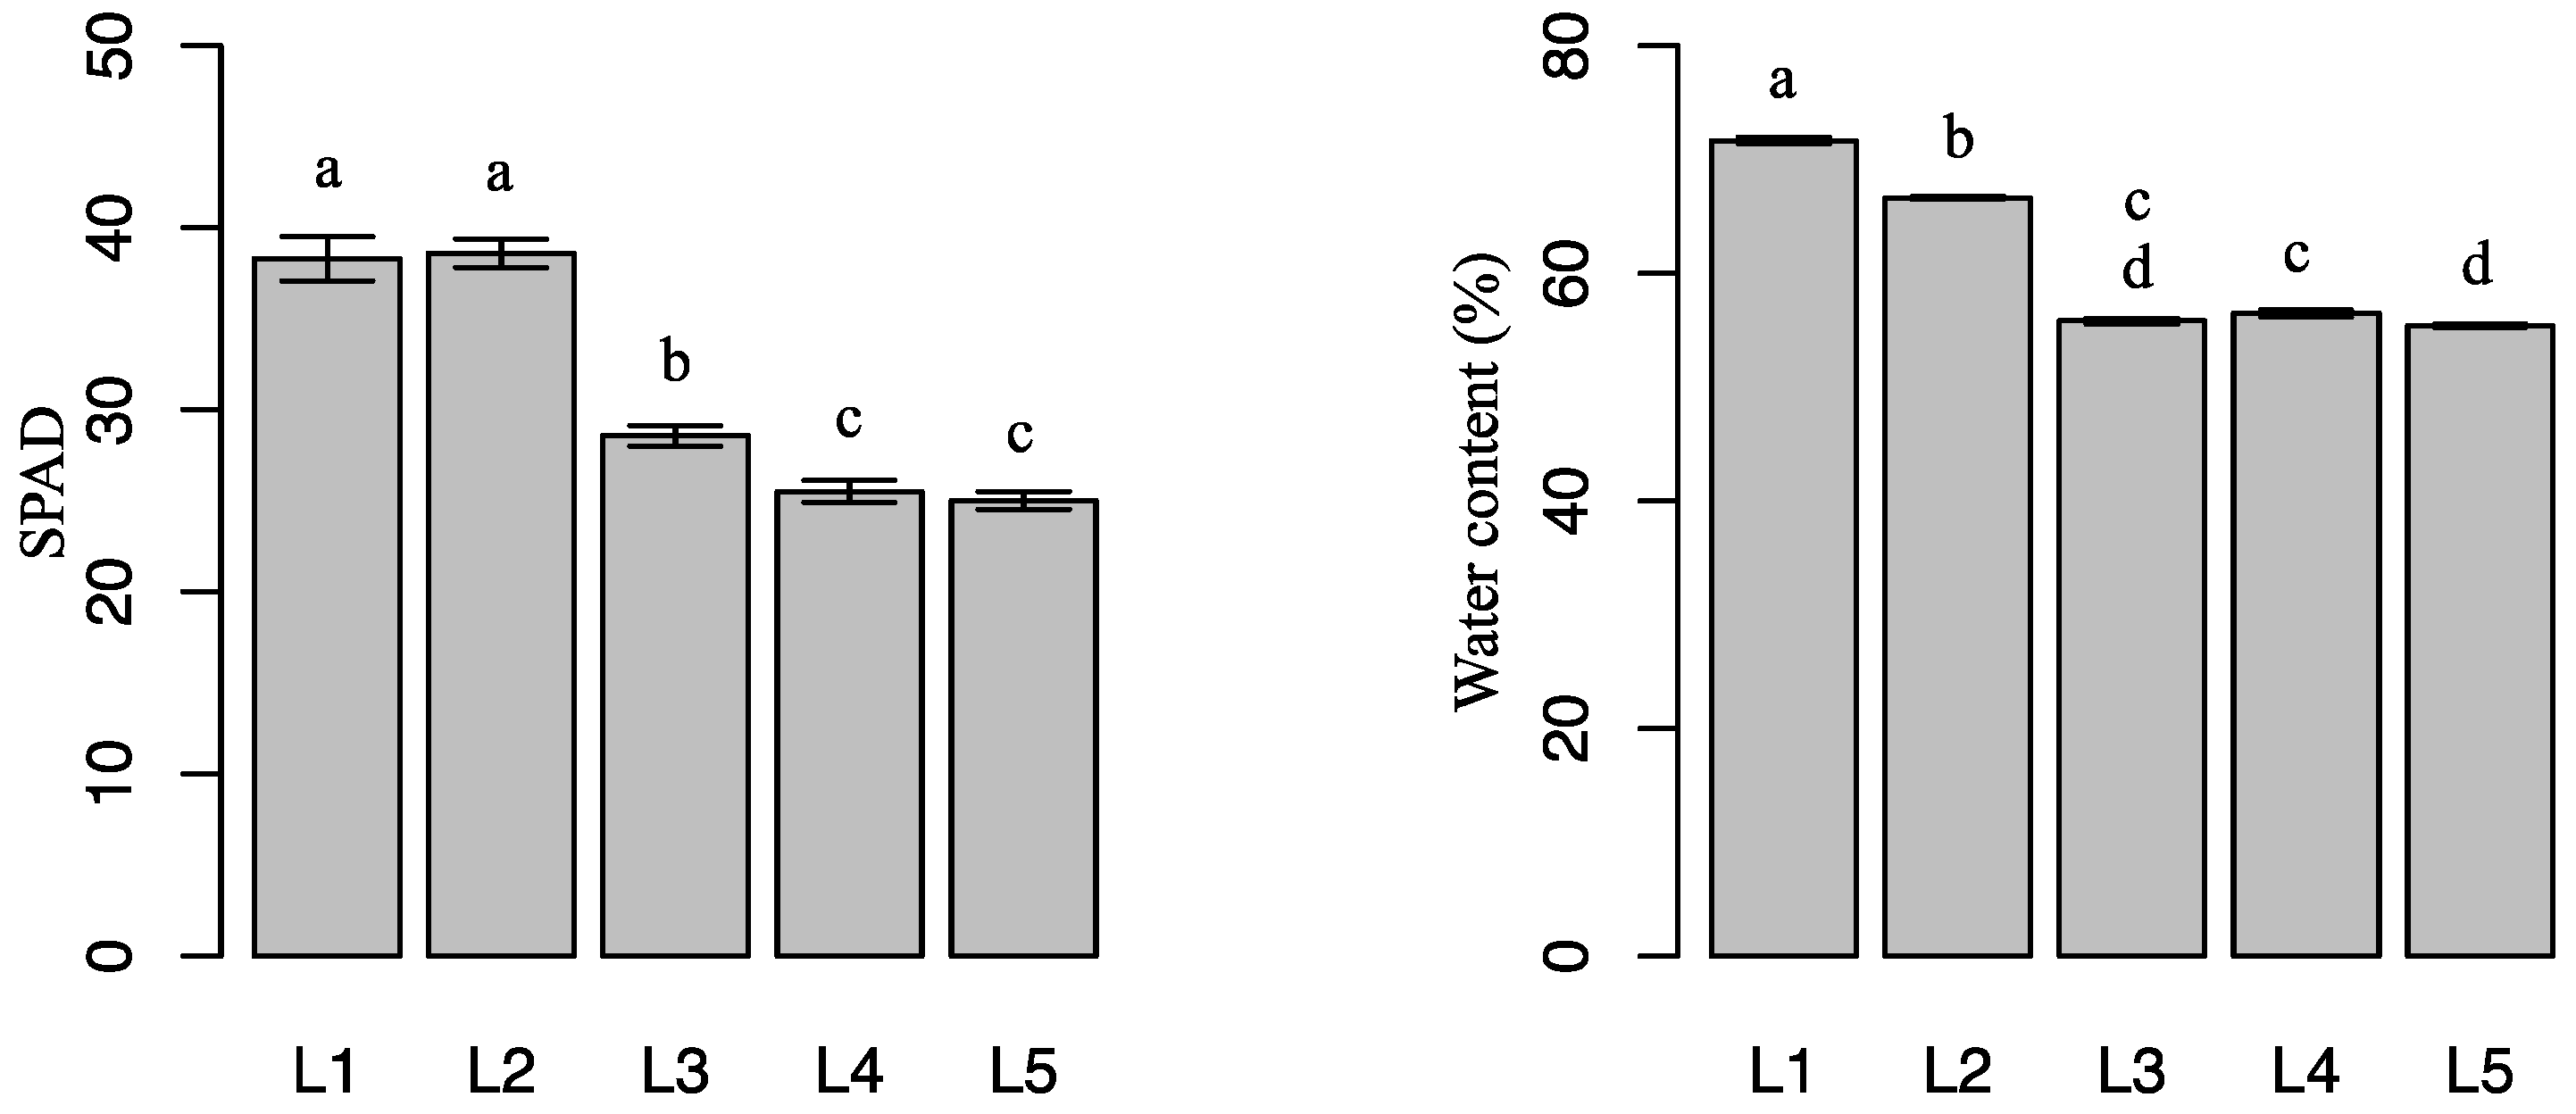
2.1. Effects of Light Intensity on Plant Growth

Clear external differences were observed among plants grown under 60 days of different light intensities. Compared with high light intensities (L3, L4, and L5), leaf areas were higher under low light intensities (L1 and L2). L2 resulted in the highest leaf area. Light intensity had different effects on E. pseudowushanense growth: L3, L4, and L5 resulted in higher number of branches. On the contrary, L1 and L2 resulted in higher SPAD and water content. The number of branches under L3, L4, and L5 were 156.3% (p < 0.05), 187.5% (p < 0.05), and 203.1% (p < 0.05) higher, respectively, than of plants grown under L1. SPAD values under L1 and L2 were 53.1% (p < 0.05) and 54.3% (p < 0.05) higher, respectively, than in plants grown under L5. Water content responded similarly. The highest values were observed in plants under L1 and the lowest were in plants under L5 (Figure 1).

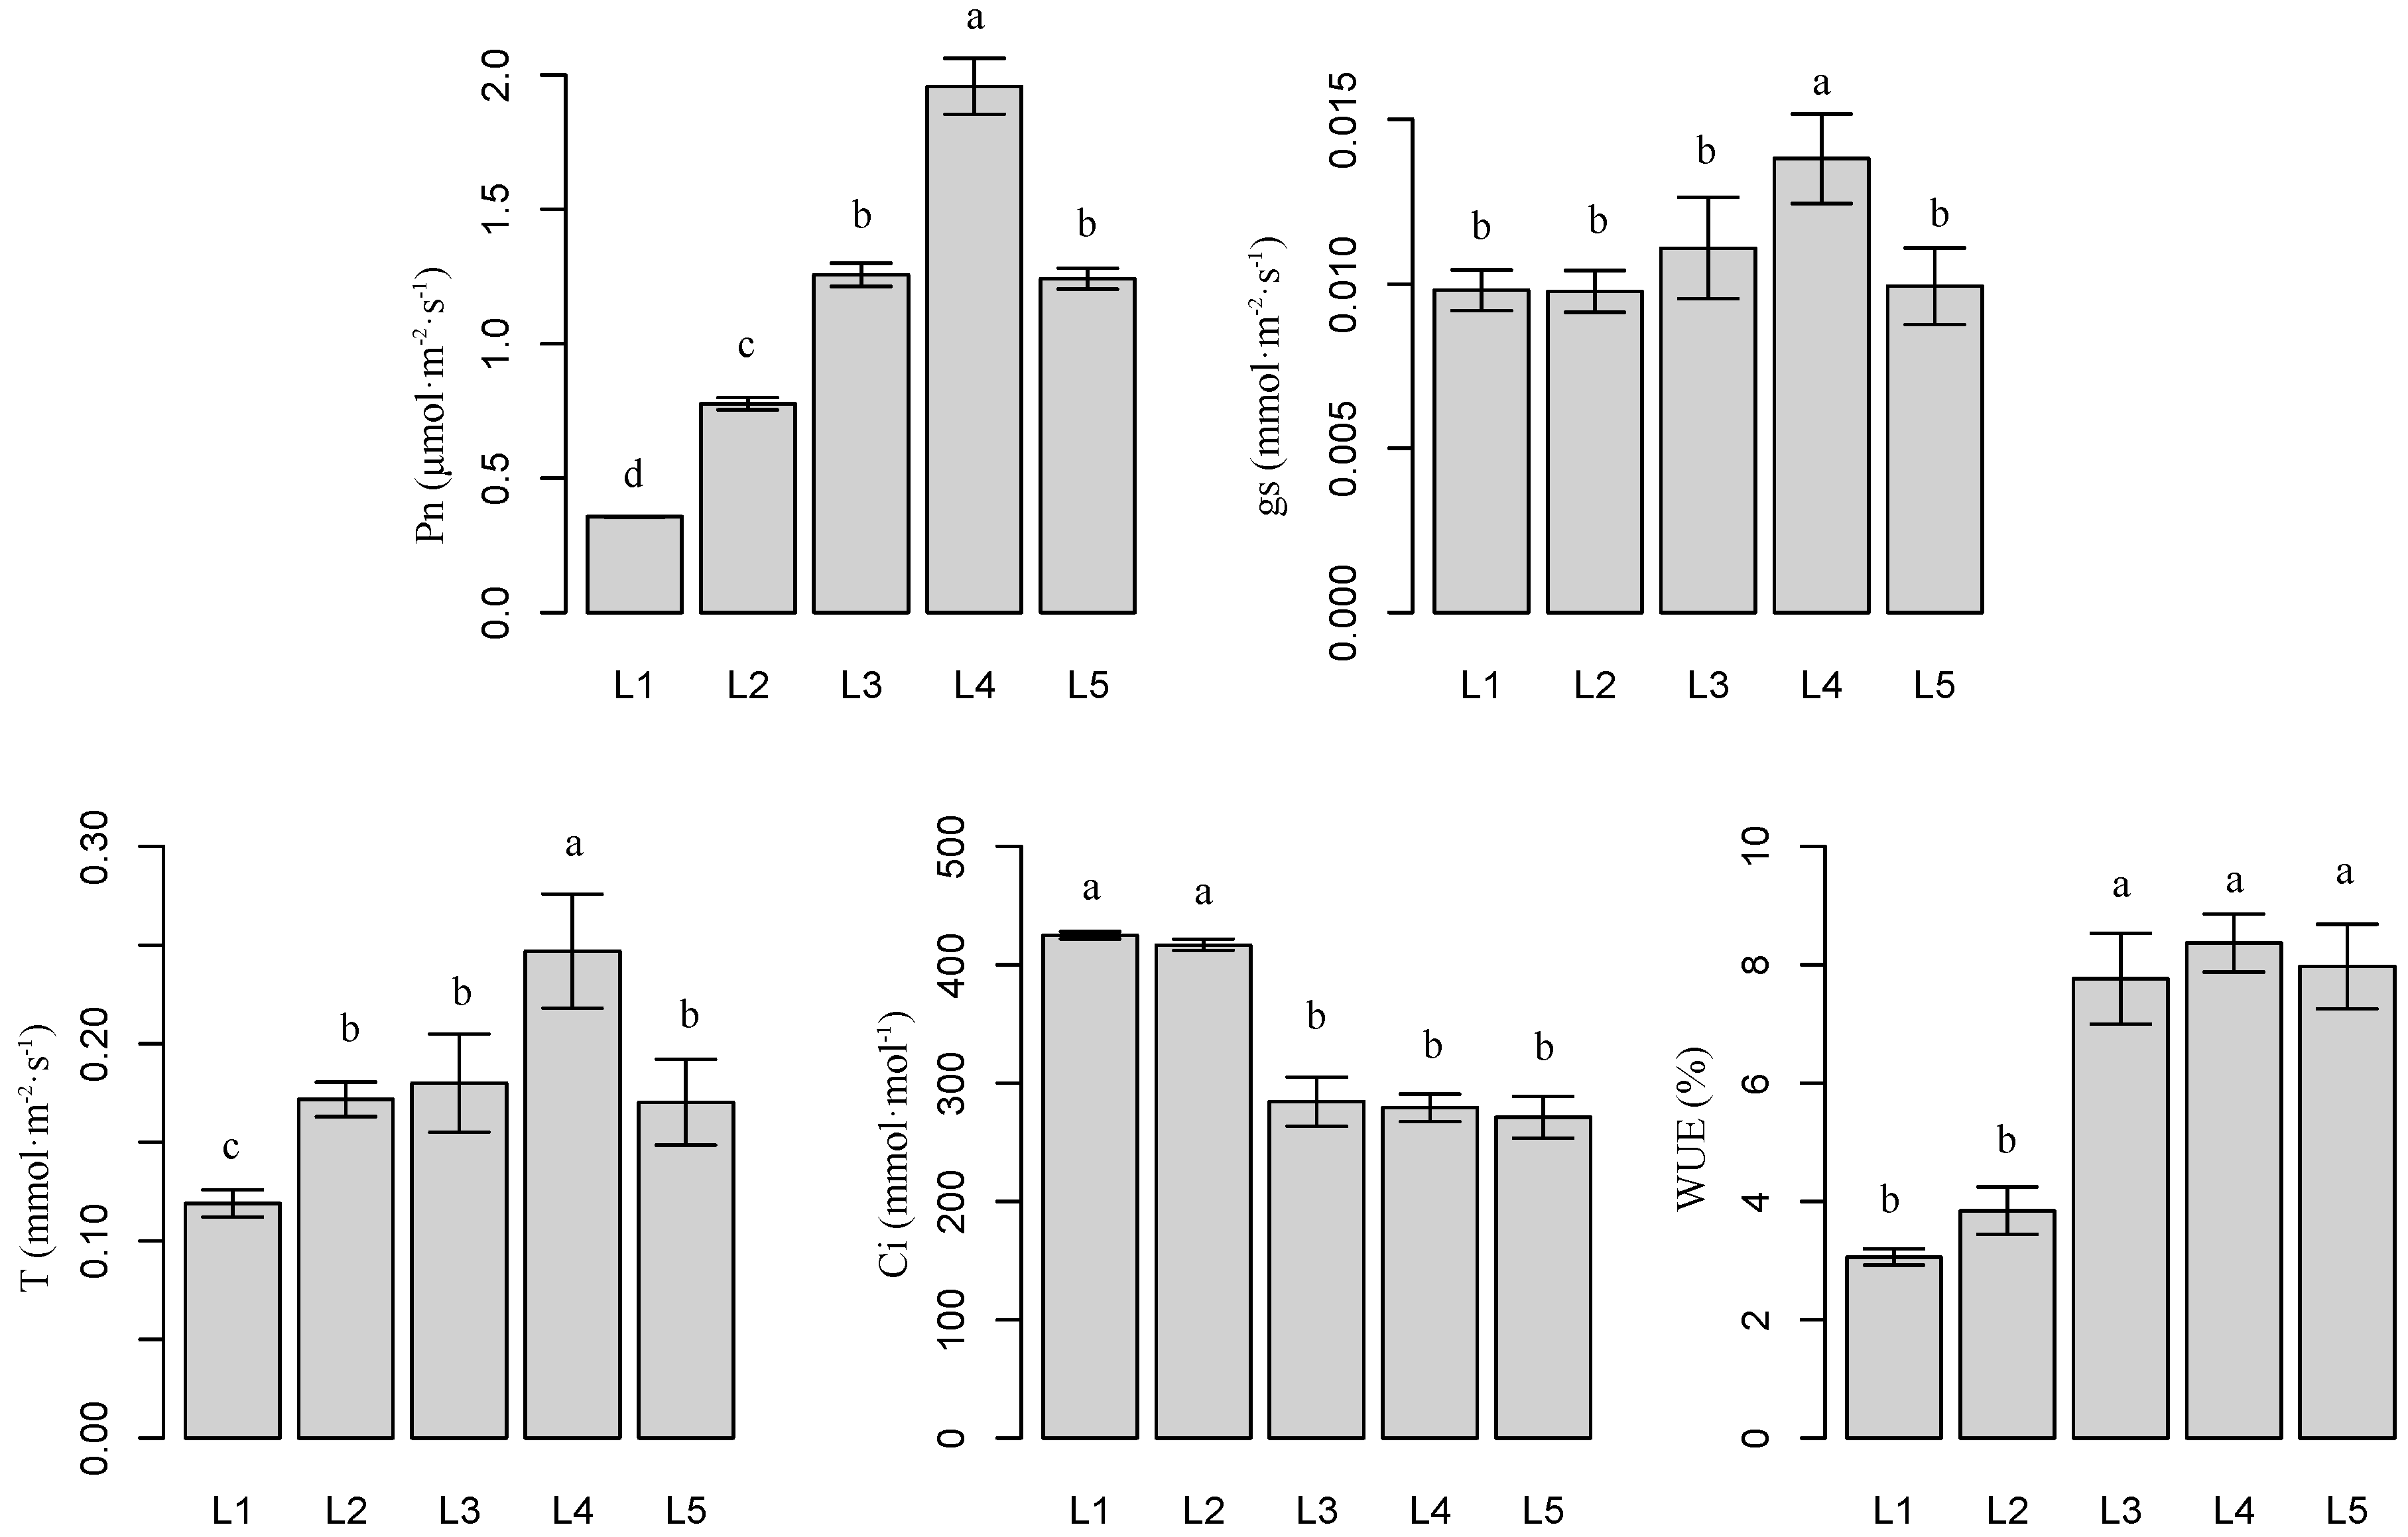
2.2. Effects of Light Intensity on Plant Photosynthetic Parameters

Figure 2 presents the effects of different light intensities on leaf photosynthetic parameters. Compared with L1, leaf net photosynthesis (Pn), transpiration rate (T), and water use efficiency (WUE) increased as light intensity increased, but not under L5. L4 resulted in the highest Pn, T, and WUE, whereas L1 resulted in the lowest measurements. Compared with L1, L4 increased Pn, T, and WUE by 457.9% (p < 0.05), 107.6% (p < 0.05), and 173.7% (p < 0.05), respectively. The highest gs values were observed under L4. No significant differences were observed between other treatments (p > 0.05). Compared with L1, intercellular CO2 concentration (Ci) decreased by 33.1% (p < 0.05), 34.3% (p < 0.05), and 36.2% (p < 0.05) under L3, L4, and L5, respectively.

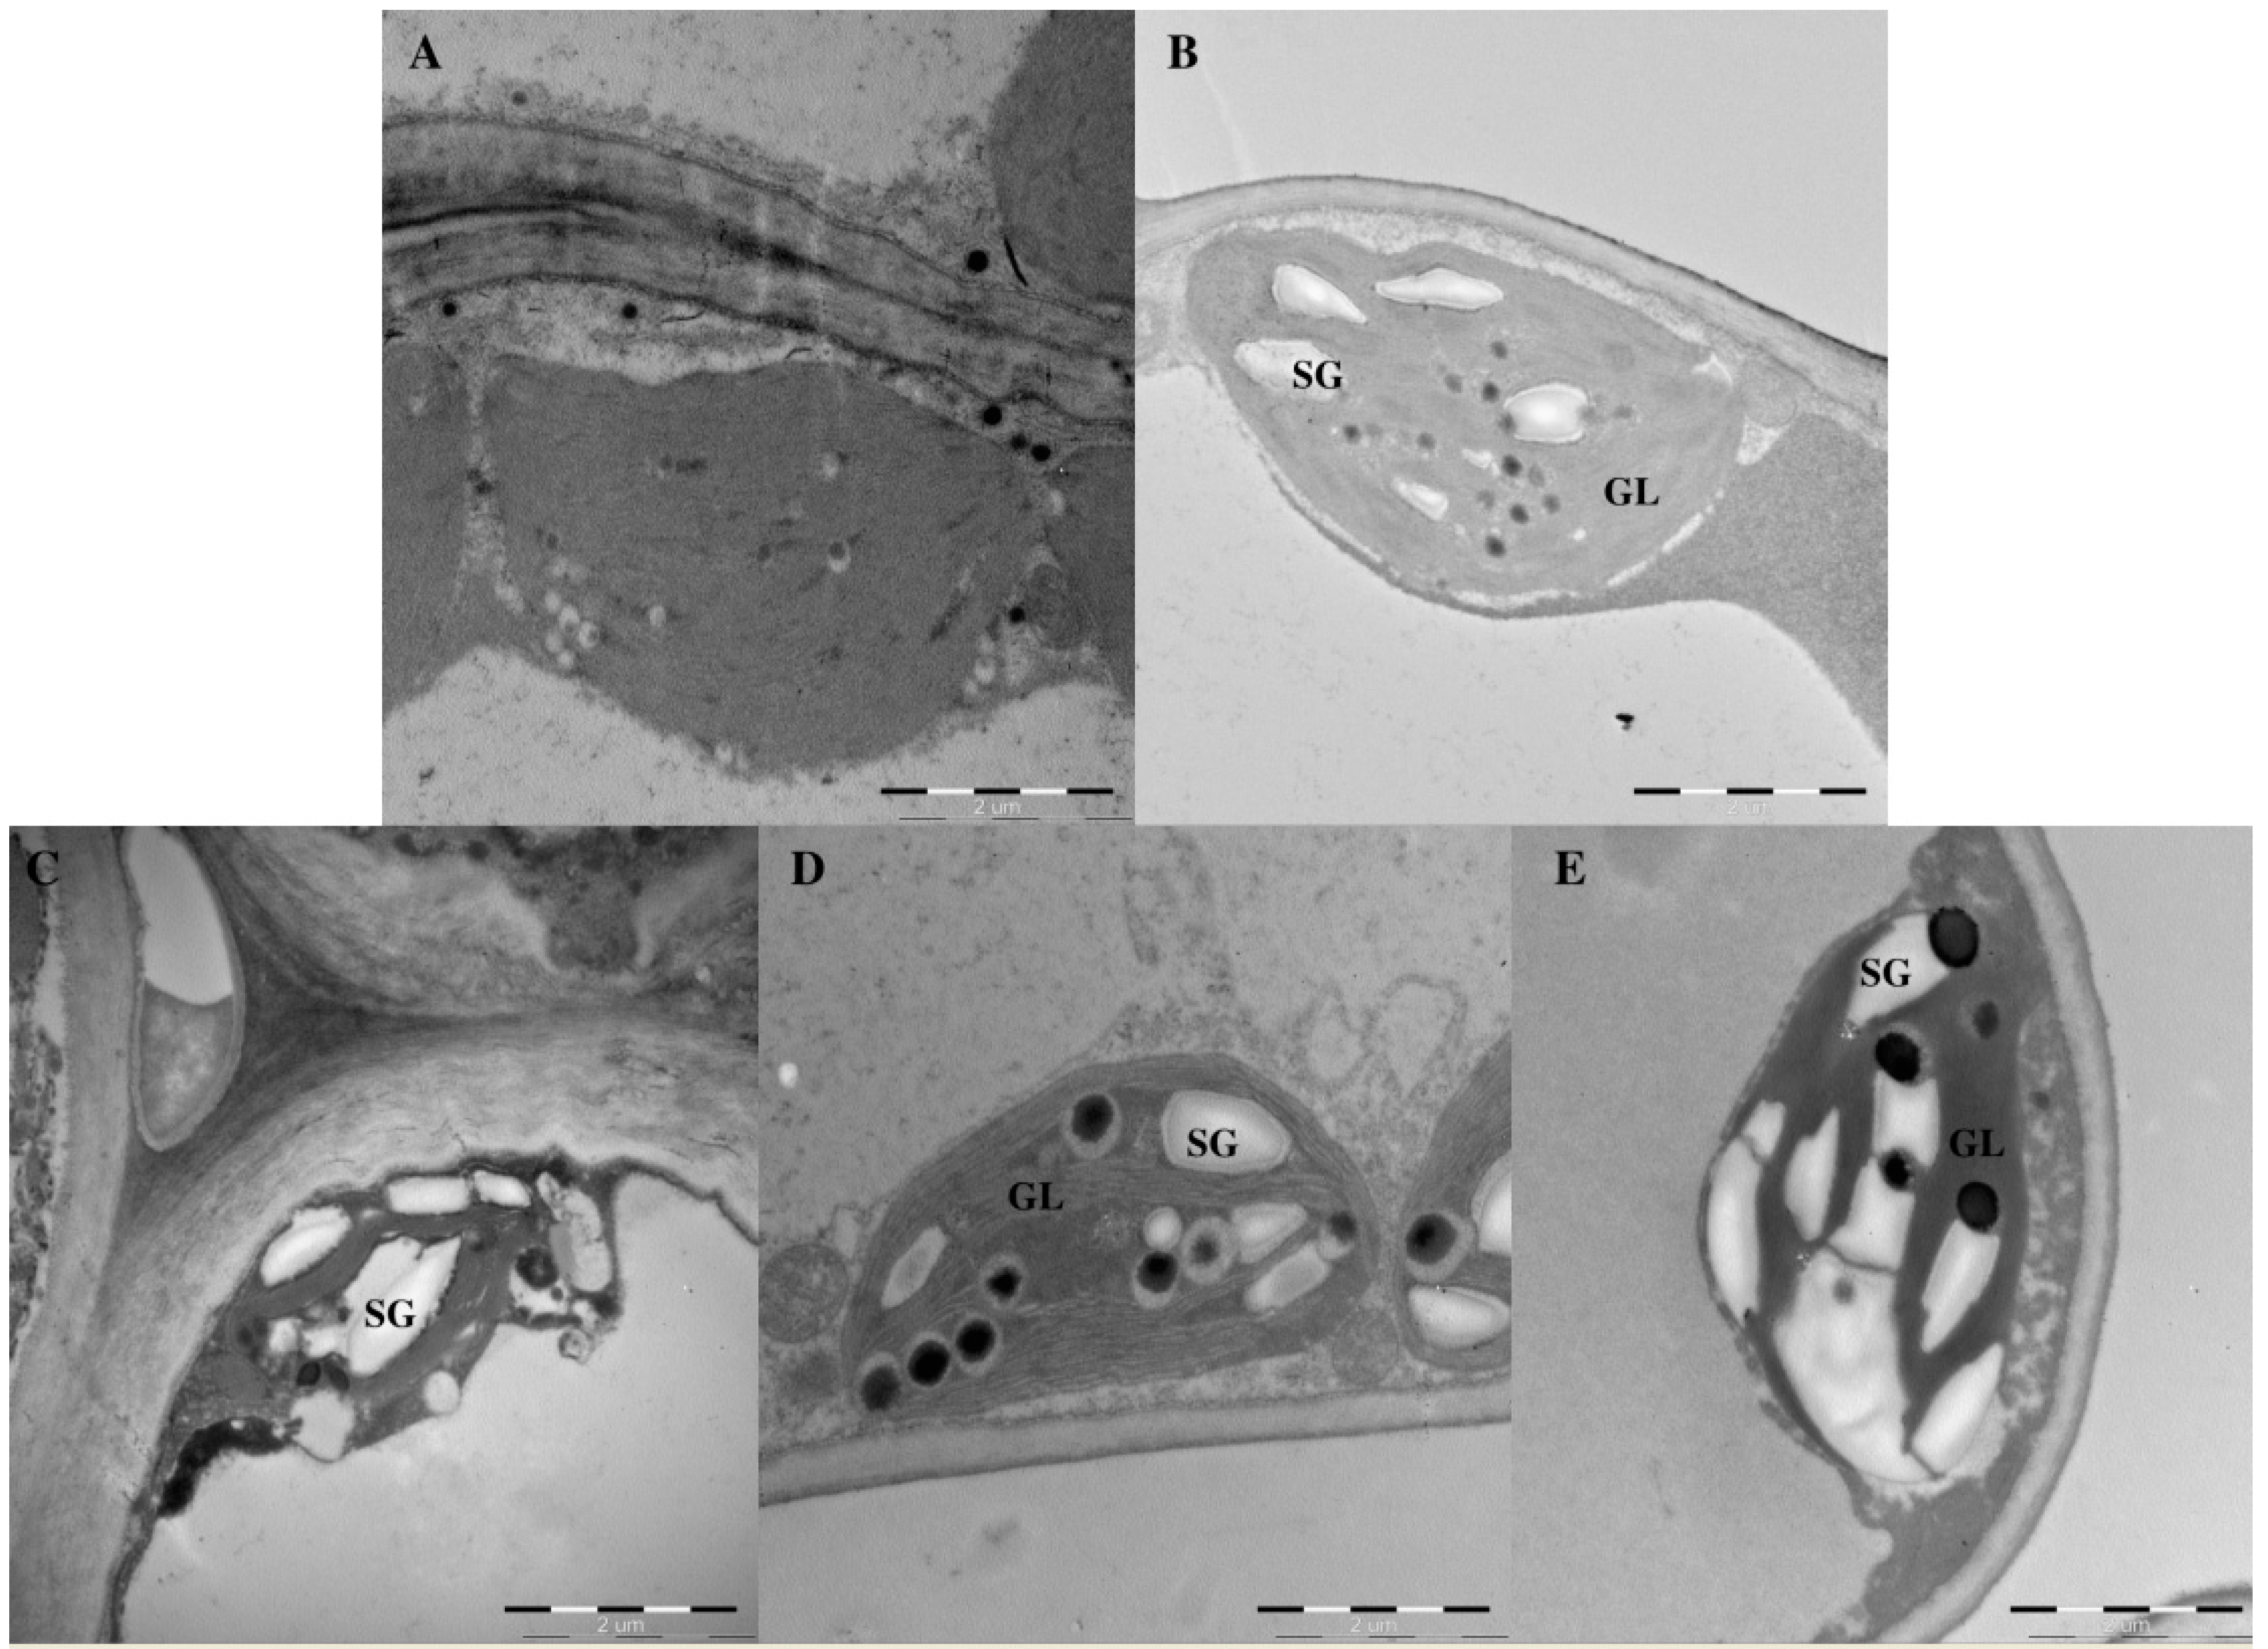
2.3. Effects of Light Intensity on Chloroplast Ultrastructure

Light intensity markedly influenced the shape and number of starch grains and grana lamellae in Epimedium (Figure 3). L4 resulted in more grana lamellae than other treatments, with approximately 11 to 14 grana lamellae per grana. Plants under L5 had more starch grains per chloroplast. Starch grains seldom appeared under L1. Interestingly, plants under L1 and L2 had narrower chloroplasts than plants under L3, L4, and L5.

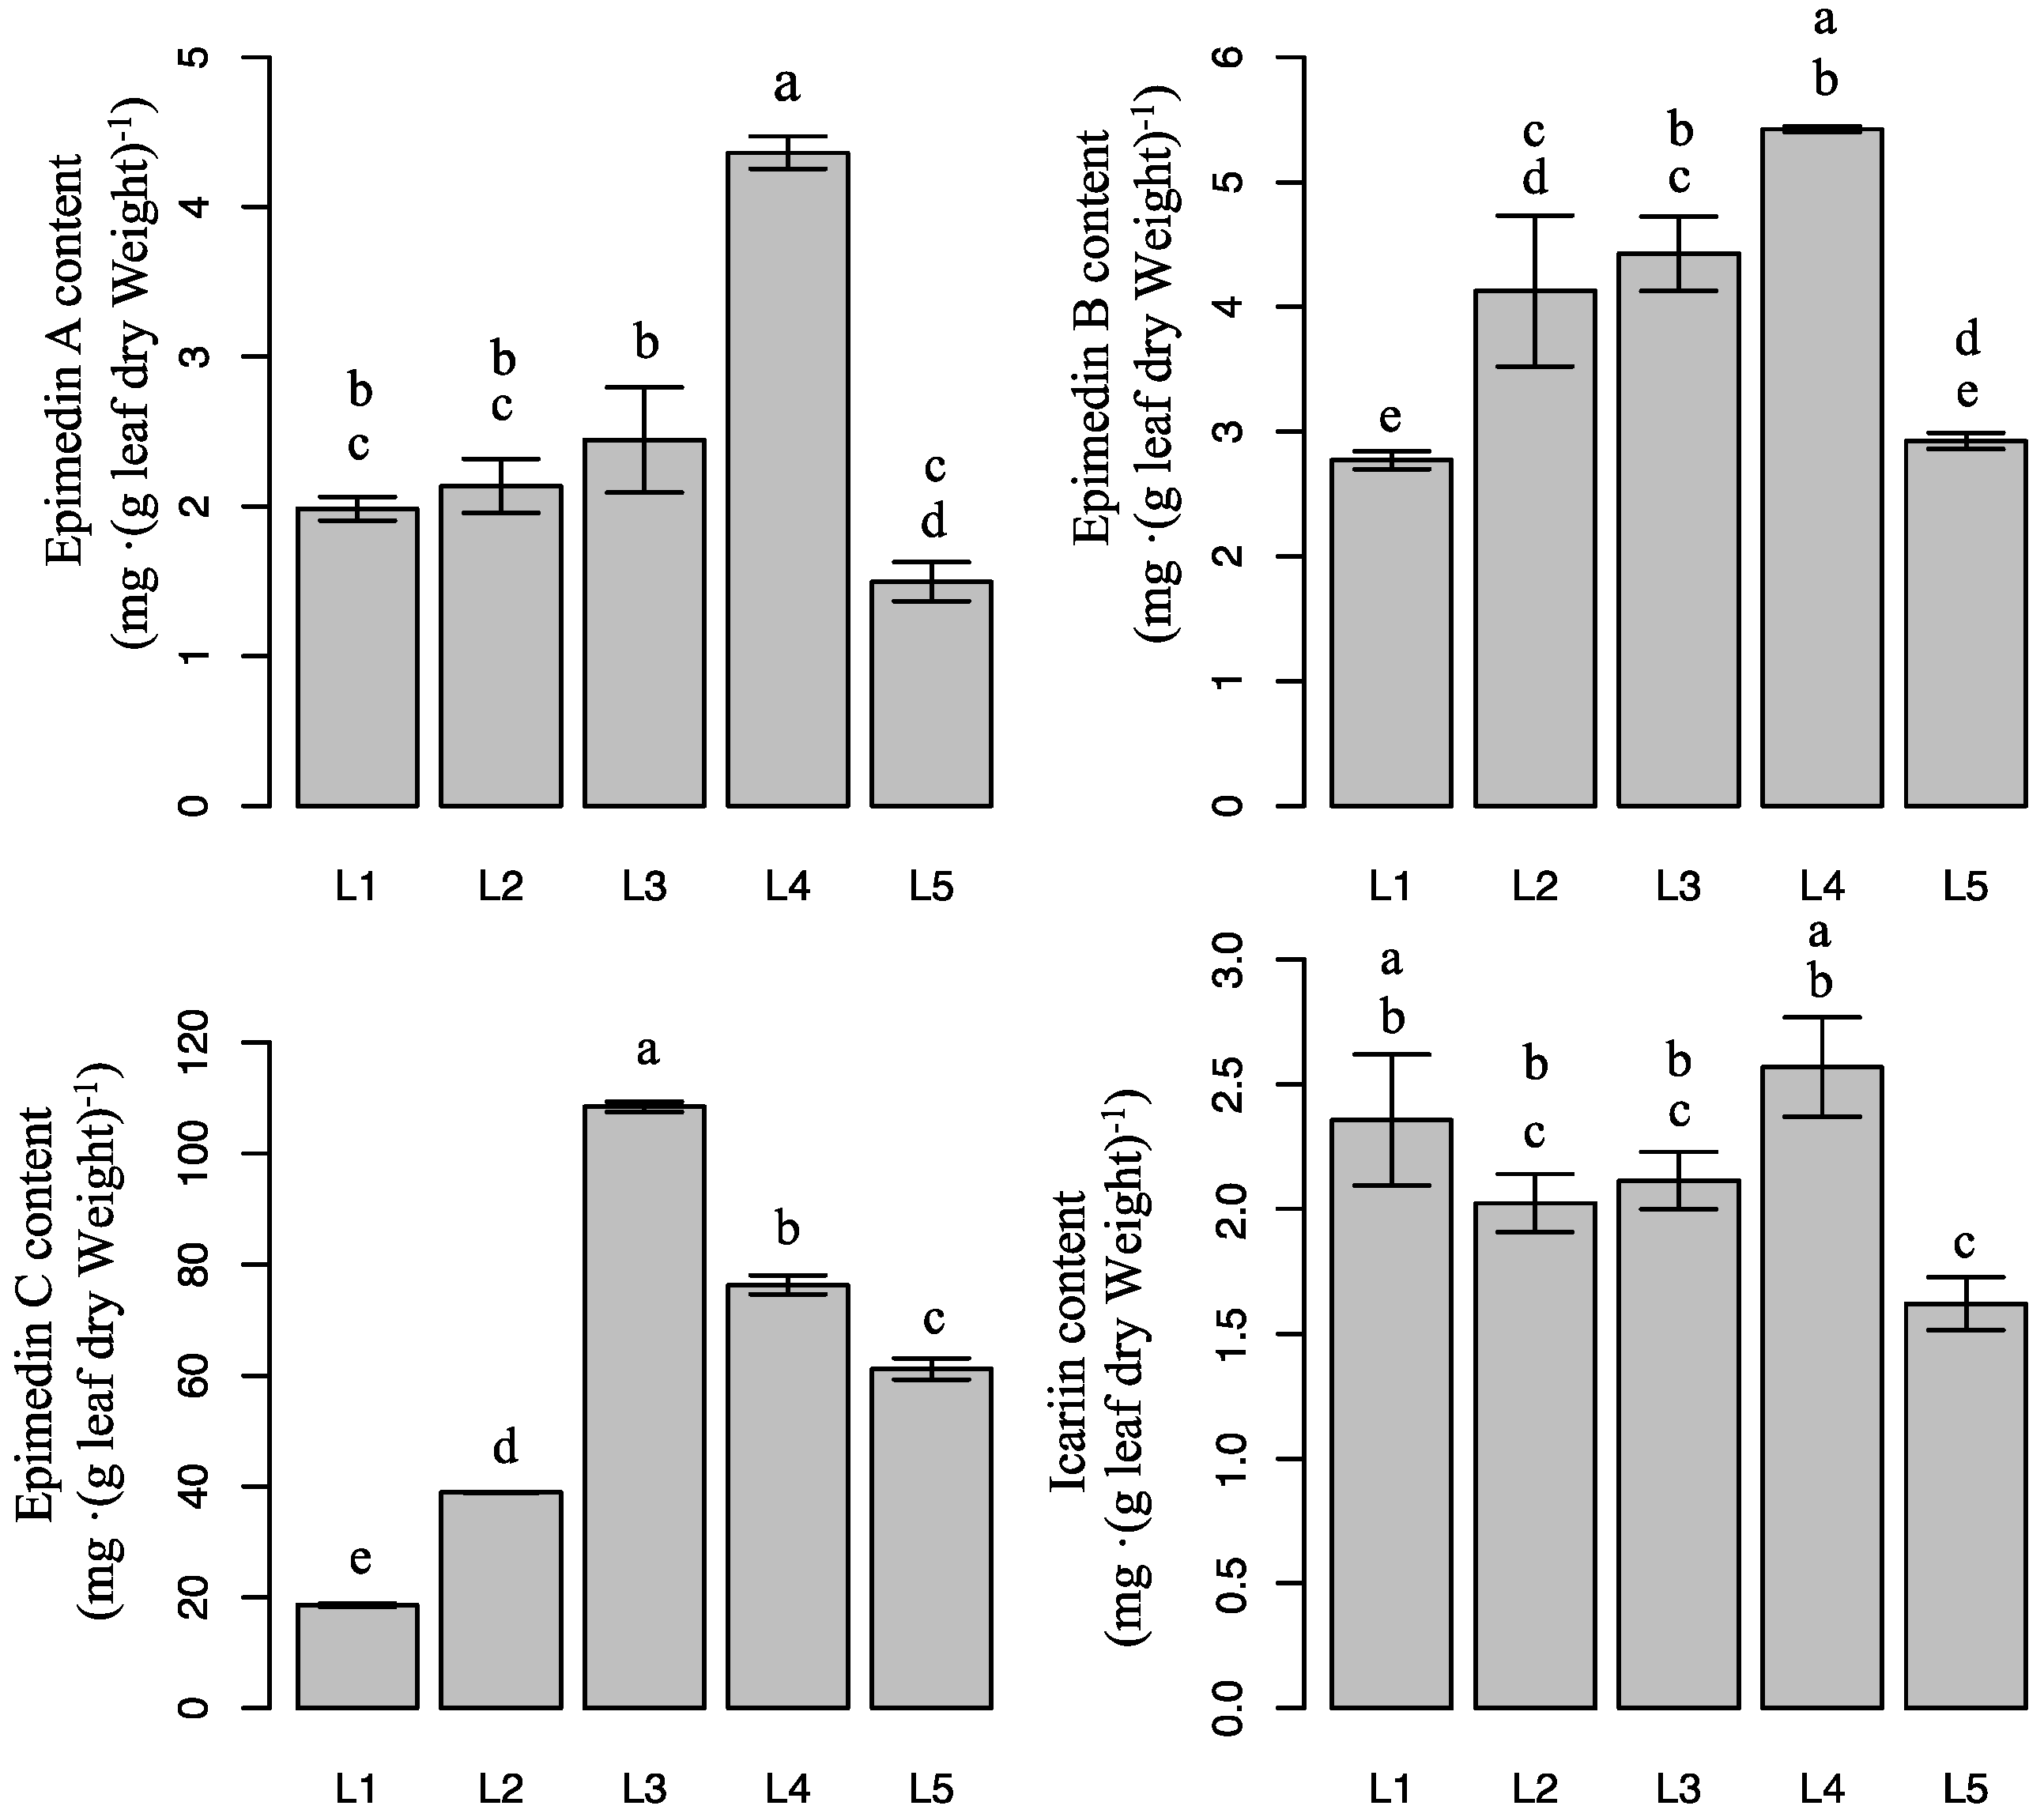
2.4. Effect of Light Intensity on Flavonoid Content in Epimedium

Table 1 shows that the method of determining the flavonoid glycosides is highly accurate. Figure 4 shows the changes in the contents of four different flavonoid glycosides in E. pseudowushanense under different light intensities. Epimedin A and epimedin B amounts showed similar changes. Epimedin A and epimedin B increased when light intensity increased from L1 to L4, whereas both decreased under L5. The highest epimedin A and epimedin B contents were observed under L4. Epimedin A and epimedin B contents were 191.4% (p < 0.05) and 95.8% (p < 0.05) higher, respectively, than under L1. Furthermore, epimedin C content increased as light intensity increased from L1 to L3, whereas epimedin C content decreased as light intensity increased from L3 to L5. Thus, L3 increased epimedin C by 483.6% (p < 0.05) compared with L1. Interestingly, icariin content was unaffected by light treatment. Icariin contents in plants under L4 and L1 were significantly higher than in plants under L5. Icariin contents under L2 and L3 were intermediate. Epimedin C was the major flavonoid in Epimedium.

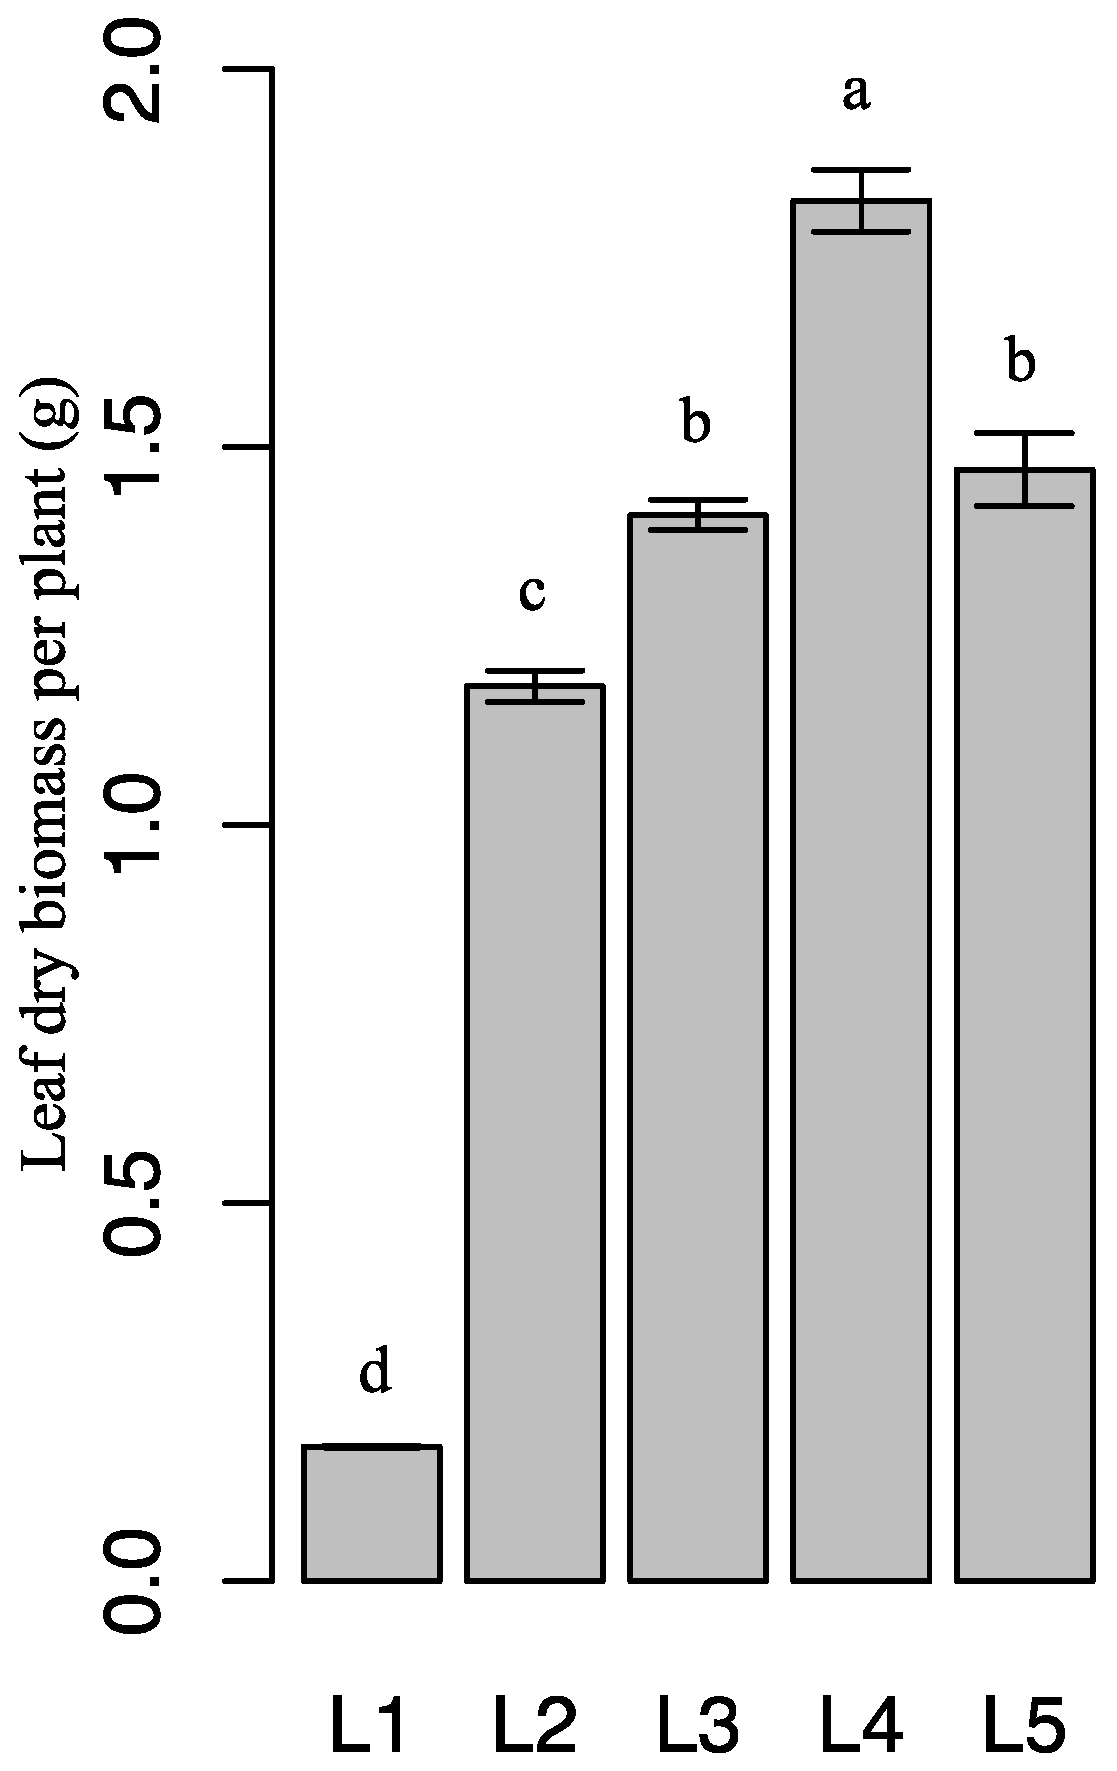
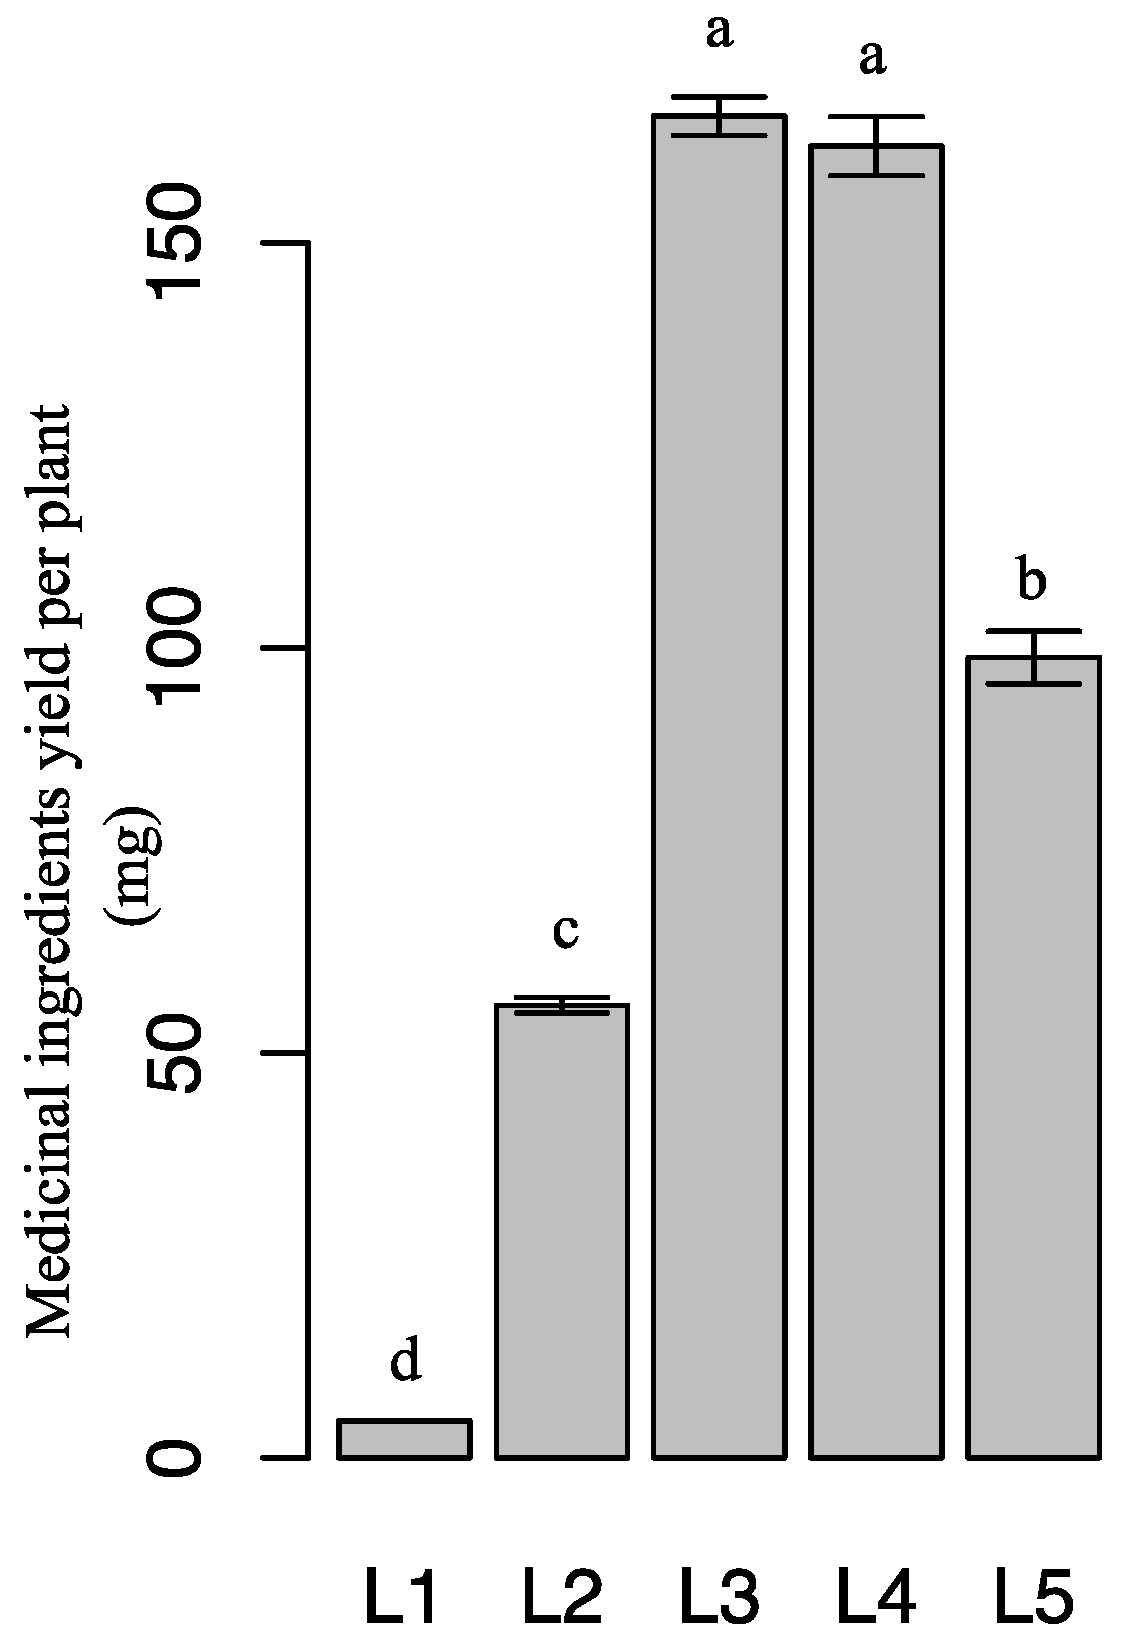
2.5. Effect of Light Intensity on Leaf Dry Biomass and Medicinal-Ingredient Yield of Epimedium

Different light intensities were associated with differences in leaf dry biomass (Figure 5). The highest leaf dry biomass was observed in plants under L4. Leaf dry biomass gradually increased as light intensity increased from L1 to L4. L4 increased leaf dry biomass by 926.3% (p < 0.05) compared with L1. Interestingly, leaf dry biomass decreased as light intensity increased from L4 to L5.
Given that the total of epimedin A, epimedin B, epimedin C, and icariin content in flavonoid glycosides was more than 90% in any treatment (data not shown), these four components represented flavonoid glycosides in Epimedium. Medicinal-ingredient yield was calculated as the product of flavonoid glycoside content and leaf dry biomass per plant. Figure 6 shows that plants under 60 days of L3 and L4 had higher medicinal-ingredient yields than under other treatments (p < 0.05). Medicinal-ingredient yield gradually increased as light intensity increased from L1 to L3, whereas it decreased by 40.3% (p < 0.05) as light intensity increased from L3 to L5.

3. Discussion

Although Epimedium is a shade-tolerant species, light intensity plays an important role in its survival, early growth, development of photosynthetic apparatus, and production of secondary metabolites [16,17,18]. Four major flavonoids including icariin, epimedin A, epimedin B, and epimedin C are quality indicators of Epimedii Folium [2]. Our study showed that medicinal-ingredient yields of individual plants were higher under 60 days of L3 and L4 treatment (Figure 6). This result suggests that the L3 and L4 are the optimal conditions for the medicinal ingredient production of Epimedium. Meanwhile, content of epimedin C, the major Epimedium flavonoid, was lower under low and high light intensity treatments, therefore reducing the medicinal-ingredient yield of individual plants under L1, L2, and L5 treatments (Figure 4). Interestingly, the production of different flavonoids was induced by different light ranges. A large number of other flavones were probably stimulated by lower light in addition to the four major components. In addition, epimedin A and epimedin B contents increased significantly as light intensity increased from L1 to L4, but decreased as light intensity increased from L4 to L5. Epimedin C content increased significantly as light intensity increased from L1 to L3, whereas it decreased as light intensity increased from L3 to L5. Furthermore, icariin content changed differently compared with other flavonoids. These results signify the complex relationships between light intensity and epimedin A, epimedin B, epimedin C, and icariin biosynthesis. Further studies are necessary to better understand the factors regulating the synthetic balance of the four medicinal flavones in the flavonoid pathway.
Leaf dry biomass influences the medicinal-ingredient yield of Epimedium. Leaf dry biomass is influenced by light intensity. Various plant characteristics, such as leaf area, number of branches, water content, and SPAD are influenced by light intensity [19]. Differences in plant morphology are documented in different species adapted to various light environments [20,21]. In the present study, E. pseudowushanense seedlings grown under relatively low light intensities (L1–L2) had larger leaves compared with those grown under high light intensities (L3–L5) (Figure 1). These findings are similar to the results reported by Tang and others [22]. Our study showed that E. pseudowushanense seedlings grown under L3–L5 treatments had significantly higher number of branches and lower water content (Figure 1). In E. pseudowushanense, the number of branches was directly associated with leaf biomass. More branches signify more leaves and more leaf dry biomass. Lower water content influenced leaf dry biomass similarly. Additionally, the highest Pn, gs, and T were observed in plants under L4 (Figure 2). Decreased Pn was associated with reduced T, gs, and Ci as light intensity increased from L4 to L5. This result indicates that stomatal limitation occurred and is presumably consistent with E. pseudowushanense stomatal traits. SPAD is another important factor determining photosynthetic rate and plant growth. In this study, we observed that SPAD decreased as light intensity increased from L3 to L5 (Figure 1), suggesting that excessive light intensity induced pigment damage [23]. This finding is consistent with the response of T. hemsleyanum [19]. Interestingly, higher SPAD and lower Pn were observed under L1 and L2. Thus, these results might be considered as responses to different light conditions [24].
Chloroplasts are the only organelles in which photosynthesis occurs. Photoreactions are localized in the internal chloroplast membrane (i.e., the thylakoid). Thylakoid structure and integrity are critical for effective photosynthesis [25]. In this study, leaves grown under L4 had better-developed grana and more thylakoids than those under other treatments (Figure 3), consistent with the highest photosynthetic rates and leaf dry biomass under L4. E. pseudowushanense chloroplasts were damaged under high light intensities (L5), thus decreasing flavonoid glycoside content because chloroplasts synthesize flavonoids in the plant cell [26,27]. Similar results were reported for Camptotheca acuminata seedlings [8].
E. pseudowushanense is most commonly utilized in the treatment of osteoporosis, liver cancer, and leukemia because of its high flavonoid content [4,28,29]. Based on previous studies on Epimedium species [30], the most suitable intensity for flavonoid accumulation in E. sagittatum ranged from 40–160 μmol·m−2·s−1. We set the L1 to L5 light regimes from 9.1–127.3 μmol·m−2·s−1. We conclude that L3 (54.6 ± 2.5 μmol·m−2·s−1) and L4 (90.9 ± 2.5 μmol·m−2·s−1) treatments achieved higher medicinal-ingredient yields after 60 days, and are therefore recommended for Epimedium cultivation. The present study provides a better understanding of the responses of growth, photosynthesis, and secondary metabolite accumulation in E. pseudowushanense seedlings exposed to various light intensities. Our results could serve as a theoretical basis for the standardized cultivation of E. pseudowushanense.

4. Materials and Methods

4.1. Plant Materials and Growth Conditions

E. pseudowushanense buds germinate in February. Flowering occurs from March to April and fruiting occurs in May [31]. E. pseudowushanense is cultivated under 10% to 30% irradiance in greenhouses. Its rhizome buds develop during winter. New leaves and stems with flowers develop in the following early spring. For this study, healthy, homogenous two-year-old E. pseudowushanense seedlings were collected from Lei Shan County (16° N, 108° E) in Guizhou Province. Each stem had two compound leaves. Each compound leaf had three leaflets (Figure 7). Seedlings were transferred to plastic pots (inner diameter: 10 cm, height: 10 cm) with drainage holes. One seedling was transferred per pot. All pots contained a substrate mixture of 75% peat and 25% vermiculite. On 26 December 2013, the transplanted seedlings were transferred to the greenhouse of the Institute of Medicinal Plant Development. Seedlings were then grown under shade. Each seedling was disinfected with 800-fold carbendazim solution. A completely randomized design with three replications per treatment and 10 seedlings per replicate was set up on 1 February 2014, or approximately one month after transferring. Inflorescences were removed upon blossoming to promote growth of the leaves utilized in medicinal treatments. Temperature range was set as 20–21 °C during the entire cultivation period. Humidity was maintained at 60%. The five light intensities were supplied by T5-fluorescent lamps at 16-h irradiation durations per day. Light treatment groups were as follows: L1 (9.1 ± 2.5 μmol·m−2·s−1), L2 (18.2 ± 2.5 μmol·m−2·s−1), L3 (54.6 ± 2.5 μmol·m−2·s−1), L4 (90.9 ± 2.5 μmol·m−2·s−1), and L5 (127.3 ± 2.5 μmol·m−2·s−1). Light intensities were measured by LI-6400 external quantum sensor (LI-COR, Lincoln, NE, USA) system. Sufficient water was provided for plants once every four days until the end of experimentation.

4.2. Plant Growth, Chlorophyll Content, and Leaf Dry Biomass

The number of newly germinated branches was recorded after 60 days of light treatment. Leaf areas of three leaflets were measured by LI-3000C (LI-COR, Lincoln, NE, USA). Fresh leaf weights were measured by an electronic balance. Leaf dry weights were measured after oven drying leaves at 60 °C to constant weight. Water content was calculated as: water content = 1 − dry weight/wet weight. Chlorophyll content was measured by a chlorophyll meter SPAD-502 (Konica Minolta Inc., Tokyo, Japan). Measurement light wavelengths were 650 nm and 940 nm. At the end of each treatment, all leaves of intact plants were collected to calculate leaf dry biomass.

4.3. Photosynthetic Parameters

Photosynthetic measurements were taken between 9:00 AM and 11:00 AM. Healthy, fully-developed, topmost leaflets of fronds were taken from three randomly selected plants per replicate treatment. Photosynthesis (Pn) was measured by a LI-6400 portable photosynthesis system (Li-Cor, Inc., Lincoln, NE, USA) with a standard leaf chamber equipped with a 6400-02B LED light source. Data were recorded under 21% O2, 500 μmol (CO2)·m−2·s−1 air concentration, 60% relative humidity, 200 μmol (CO2)·s−1 air flow, and 20 ± 0.5 °C temperature. Vapor pressure deficit (VPD) was calculated with leaf and air temperatures and relative humidity. VPD was similar among the five experimental treatments.

4.4. Assessment of Chloroplast Ultrastructure

To observe the chloroplast ultrastructure of mesophyll cells in E. pseudowushanense seedlings subjected to different light intensities for 60 days, a fully expanded leaflet from a randomly selected plant from each replicate per treatment was collected. Fresh leaves were cut into 4–6 slices (1 mm2) at their adaxial surfaces for transmission electron microscopy. Sections were placed immediately in 2.5% (v/v) glutaraldehyde (0.1 M phosphate buffer, pH 7.2), then de-gassed and fixed for at least 4 h. Samples were then post-fixed with 1% (v/v) osmium acid. After fixation, samples were washed three times with the same buffer for 15 min. Specimens were dehydrated by a graded ethanol series (50%, 70%, 90%, 95%, and 100% at 30 min each) then embedded in epoxy resin, from which ultrathin sections were prepared. The ultrathin sections were sequentially stained with uranyl acetate and lead citrate and then examined with a transmission electron microscope (JEM-1400, Hitachi, Tokyo, Japan).

4.5. Flavonoid Content and Medicinal-Ingredient Yield

One ternate leaf was collected per plant after 30, 60, 90, and 120 days of exposure to different light intensity treatments. Fresh leaves of 10 seedlings per replicate were fixed for 3 min in a microwave, then dried to a constant weight at 60 °C. Sample pretreatment was performed according to the Chinese Pharmacopoeia Commission (2010). Samples were crushed and sifted through a No. 3 pharmacopoeia sieve. Approximately 200 mg of sample was added to 50 mL 70% ethanol then extracted by ultrasonication for 30 min. The extract was then filtered with a 0.45 μm microfiltration membrane for HPLC analysis. Eluent A contained double distilled water and eluent B contained acetonitrile. The gradient elution program was as follows: 0–17 min (25%–26% B), 17–26 min (26%–100% B). The column was washed with 100% eluent B between every two samples for 15 min and then re-equilibrated with 25% eluent B for 10 min. Elution conditions were as follows: 1.0 mL·min−1 flow rate, 25 °C column temperature, 270 nm detection wavelength, and 20 μL injection volume. Six gradient concentrations of epimedin A (3.1–32.3 μg·mL−1), epimedin B (3.1–32.3 μg·mL−1), epimedin C (20.5–520.6 μg·mL−1), and icariin (3.1–32.3 μg·mL−1) were prepared. A Zorbax SB-C18 column (Agilent Technologies, Palo Alto, CA, USA) was utilized as the chromatographic column in chromatographic analysis (250 mm × 4.6 mm I.D., 5 μm). HPLC analysis data were processed by PerkinElmer ChemStation software (version 6.3.1, PerkinElmer, Waltham, MA, USA).
Medicinal ingredient yield was calculated as: medicinal-ingredient yield = (epimedin A content + epimedin B content + epimedin C content + icariin content) × leaf dry biomass.

4.6. Data Analysis

Statistical analysis was conducted with one-way ANOVA software (R language version 3.1.1, https://www.r-project.org/about.html). Differences between means were detected with Tukey HSD test. p value was set at 0.05 and 0.01 for ANOVA and Tukey HSD tests, respectively.

Acknowledgments

The National Natural Science Foundation of China (81473302) supported this study. We would like to thank Zhang Yali for his insightful suggestions regarding the manuscript and Ding Wanlong for taking pictures. We are very grateful for the experiment support of GUOYAOJITUAN TONGJITANG (GUIZHOU) PHARMACEUTICAL CO.LTD, and some personal support from Xiangbo Yang, Zhihai Jiang, and Li Li. Funding: The National Natural Science Foundation of China (81473302).

Author Contributions

B.G. and J.P. conceived and designed the experiments; J.P. performed the experiments; J.P. analyzed the data; B.G. contributed reagents/materials/analysis tools; J.P. wrote the paper.

Conflicts of Interest

The authors declare no conflict of interest.

Abbreviations

PnNet photosynthetic rate
gsStomatal conductance
SPADSoil and Plant Analyzer Development (the relative content of chlorophyll)
TTranspiration rate
WUEWater use efficiency
CiIntercellular CO2 concentration
SGStarch grains
GLGrana lamellae
VPDVapor pressure deficit

References

  1. Wu, H.; Lien, E.J.; Lien, L.L. Chemical and pharmacological investigations of Epimedium species: A survey. In Progress in Drug Research; Jucker, E., Ed.; Birkhäuser Basel: Basel, Switzerland, 2003; pp. 1–57. [Google Scholar]
  2. Liu, J.J.; Li, S.P.; Wang, Y.T. Optimization for quantitative determination of four flavonoids in Epimedium by capillary zone electrophoresis coupled with diode array detection using central composite design. J. Chromatogr. A 2006, 1103, 344–349. [Google Scholar] [CrossRef] [PubMed]
  3. Kim, B.; Park, B. Baohuoside I suppresses invasion of cervical and breast cancer cells through the downregulation of CXCR4 chemokine receptor expression. Biochemistry 2014, 53, 7562–7569. [Google Scholar] [CrossRef] [PubMed]
  4. Lin, C.C.; Ng, L.T.; Hsu, F.F.; Shieh, D.-E.; Chiang, L.C. Cytotoxic effects of coptis chinensis and Epimedium sagittatum extracts and their major constituents (berberine, coptisine and icariin) on hepatoma and leukaemia cell growth. Clin. Exp. Pharmacol. Physiol. 2004, 31, 65–69. [Google Scholar] [CrossRef] [PubMed]
  5. Kang, S.H.; Jeong, S.J.; Kim, S.H.; Kim, J.H.; Jung, J.H.; Koh, W.; Kim, J.H.; Kim, D.K.; Chen, C.Y.; Kim, S.H. Icariside ii induces apoptosis in U937 acute myeloid leukemia cells: Role of inactivation of STAT3-related signaling. PLoS ONE 2012, 7, e28706. [Google Scholar]
  6. Zoratti, L.; Karppinen, K.; Luengo Escobar, A.; Häggman, H.; Jaakola, L. Light-controlled flavonoid biosynthesis in fruits. Front. Plant Sci. 2014, 5, 534. [Google Scholar] [CrossRef] [PubMed]
  7. Guo, Y.-P.; Guo, D.-P.; Zhou, H.-F.; Hu, M.-J.; Shen, Y.-G. Photoinhibition and xanthophyll cycle activity in bayberry (myrica rubra) leaves induced by high irradiance. Photosynthetica 2006, 44, 439–446. [Google Scholar] [CrossRef]
  8. Ma, X.; Song, L.; Yu, W.; Hu, Y.; Liu, Y.; Wu, J.; Ying, Y. Growth, physiological, and biochemical responses of Camptotheca acuminata seedlings to different light environments. Front. Plant Sci. 2015, 6, 321. [Google Scholar] [CrossRef] [PubMed]
  9. Jaakola, L.; Hohtola, A. Effect of latitude on flavonoid biosynthesis in plants. Plant Cell Environ. 2010, 33, 1239–1247. [Google Scholar] [CrossRef] [PubMed]
  10. Guo, J.; Han, W.; Wang, M.-H. Ultraviolet and environmental stresses involved in the induction and regulation of anthocyanin biosynthesis: A review. Afr. J. Biotechnol. 2008, 7, 4966–4972. [Google Scholar]
  11. Agati, G.; Stefano, G.; Biricolti, S.; Tattini, M. Mesophyll distribution of ‘’antioxidant“ flavonoid glycosides in ligustrum vulgare leaves under contrasting sunlight irradiance. Ann. Bot. 2009, 104, 853–861. [Google Scholar] [CrossRef] [PubMed]
  12. Agati, G.; Biricolti, S.; Guidi, L.; Ferrini, F.; Fini, A.; Tattini, M. The biosynthesis of flavonoids is enhanced similarly by UV radiation and root zone salinity in L. Vulgare leaves. J. Plant Physiol. 2011, 168, 204–212. [Google Scholar] [CrossRef] [PubMed]
  13. Koyama, K.; Ikeda, H.; Poudel, P.R.; Goto-Yamamoto, N. Light quality affects flavonoid biosynthesis in young berries of cabernet sauvignon grape. Phytochemistry 2012, 78, 54–64. [Google Scholar] [CrossRef] [PubMed]
  14. Agati, G.; Brunetti, C.; di Ferdinando, M.; Ferrini, F.; Pollastri, S.; Tattini, M. Functional roles of flavonoids in photoprotection: New evidence, lessons from the past. Plant Physiol. Biochem. 2013, 72, 35–45. [Google Scholar] [CrossRef] [PubMed]
  15. Pacheco, F.V.; Alvarenga, I.C.A.; Ribeiro Junior, P.M.; Pinto, J.E.B.P.; Avelar, R.D.P.; Alvarenga, A.A. Growth and production of secondary compounds in monkey-pepper (Piper aduncum L.) leaves cultivated under altered ambient light. Aust. J. Crop Sci. 2014, 8, 1510–1516. [Google Scholar]
  16. Gottschalk, K.W. Shade, leaf growth and crown development of Quercus rubra, Quercus velutina, Prunus serotina and Acer rubrum seedlings. Tree Physiol. 1994, 14, 735–749. [Google Scholar] [CrossRef] [PubMed]
  17. Müller, V.; Albert, A.; Barbro Winkler, J.; Lankes, C.; Noga, G.; Hunsche, M. Ecologically relevant UV-B dose combined with high PAR intensity distinctly affect plant growth and accumulation of secondary metabolites in leaves of Centella asiatica L. Urban. J. Photochem. Photobiol. B Biol. 2013, 127, 161–169. [Google Scholar] [CrossRef] [PubMed]
  18. Wang, M.L.; Jiang, Y.S.; Wei, J.Q.; Wei, X.; Qi, X.X.; Jiang, S.Y.; Wang, Z.M. Effects of irradiance on growth, photosynthetic characteristics, and artemisinin content of Artemisia annua L. Photosynthetica 2008, 46, 17–20. [Google Scholar] [CrossRef]
  19. Dai, Y.; Shen, Z.; Liu, Y.; Wang, L.; Hannaway, D.; Lu, H. Effects of shade treatments on the photosynthetic capacity, chlorophyll fluorescence, and chlorophyll content of Tetrastigma hemsleyanum Diels et Gilg. Environ. Exp. Bot. 2009, 65, 177–182. [Google Scholar] [CrossRef]
  20. Valladares, F.; Chico, J.; Aranda, I.; Balaguer, L.; Dizengremel, P.; Manrique, E.; Dreyer, E. The greater seedling high-light tolerance of Quercus robur over Fagus sylvatica is linked to a greater physiological plasticity. Trees 2002, 16, 395–403. [Google Scholar]
  21. Aleric, K.M.; Katherine Kirkman, L. Growth and photosynthetic responses of the federally endangered shrub, Lindera melissifolia (Lauraceae), to varied light environments. Am. J. Bot. 2005, 92, 682–689. [Google Scholar] [CrossRef] [PubMed]
  22. Tang, H.; Hu, Y.-Y.; Yu, W.-W.; Song, L.-L.; Wu, J.-S. Growth, photosynthetic and physiological responses of Torreya grandis seedlings to varied light environments. Trees 2015, 29, 1011–1022. [Google Scholar] [CrossRef]
  23. Shao, Q.; Wang, H.; Guo, H.; Zhou, A.; Huang, Y.; Sun, Y.; Li, M. Effects of shade treatments on photosynthetic characteristics, chloroplast ultrastructure, and physiology of Anoectochilus roxburghii. PLoS ONE 2014, 9, e85996. [Google Scholar] [CrossRef] [PubMed]
  24. Murchie, E.H.; Horton, P. Acclimation of photosynthesis to irradiance and spectral quality in british plant species: Chlorophyll content, photosynthetic capacity and habitat preference. Plant Cell Environ. 1997, 20, 438–448. [Google Scholar] [CrossRef]
  25. Liu, Y.; Li, X.; Liu, M.; Cao, B.; Tan, H.; Wang, J.; Li, X. Responses of three different ecotypes of reed (Phragmites communis trin.) to their natural habitats: Leaf surface micro-morphology, anatomy, chloroplast ultrastructure and physio-chemical characteristics. Plant Physiol. Biochem. 2012, 51, 159–167. [Google Scholar] [CrossRef] [PubMed]
  26. Saunders, J.A.; McClure, J.W. The distribution of flavonoids in chloroplasts of twenty five species of vascular plants. Phytochemistry 1976, 15, 809–810. [Google Scholar] [CrossRef]
  27. Agati, G.; Matteini, P.; Goti, A.; Tattini, M. Chloroplast-located flavonoids can scavenge singlet oxygen. New Phytol. 2007, 174, 77–89. [Google Scholar] [CrossRef] [PubMed]
  28. Zhai, Y.-K.; Guo, X.; Pan, Y.-L.; Niu, Y.-B.; Li, C.-R.; Wu, X.-L.; Mei, Q.-B. A systematic review of the efficacy and pharmacological profile of Herba epimedii in osteoporosis therapy. Pharmazie 2013, 68, 713–722. [Google Scholar] [PubMed]
  29. Li, C.; Li, Q.; Mei, Q.; Lu, T. Pharmacological effects and pharmacokinetic properties of icariin, the major bioactive component in Herba epimedii. Life Sci. 2015, 126, 57–68. [Google Scholar] [CrossRef] [PubMed]
  30. Liang, Q.; Wei, G.; Chen, J.; Wang, Y.; Huang, H. Variation of medicinal components in a unique geographical accession of horny goat weed Epimedium sagittatum maxim. (Berberidaceae). Molecules 2012, 17, 13345–13356. [Google Scholar] [CrossRef] [PubMed]
  31. Guo, B.-L.; He, S.-Z.; Zhong, G.-Y.; Xiao, P.-G. Two new species of Epimedium (Berberidaceae) from China. Acta Phytotaxon. Sin. 2007, 45, 813–821. [Google Scholar] [CrossRef]
  • Sample Availability: Samples of the compounds are available from the authors.
Figure 1. Morphological parameters of E. pseudowushanense under different light intensities. The data are expressed as mean ± SD. Different letters indicate significant differences between light intensity treatments (p < 0.05); n = 30.
Molecules 21 01475 g001aMolecules 21 01475 g001b
Figure 2. Net photosynthetic rate (Pn), stomatal conductance (gs), intercellular CO2 concentration (Ci), transpiration rate (T), and water use efficiency (WUE) of E. pseudowushanense leaves under different light intensities. The data are expressed as mean ± SD; n = 9. Different letters indicate significant differences between light intensity treatments (p < 0.05).
Molecules 21 01475 g002
Figure 3. Chloroplast ultrastructure of E. pseudowushanense mesophyll cells under L1 (A); L2 (B); L3 (C); L4 (D); and L5 (E) treatment at 60 days. Abbreviation: SG, starch grains; GL, grana lamellae.
Molecules 21 01475 g003
Figure 4. Epimedin A, epimedin B, epimedin C, and icariin content of E. pseudowushanense under different light intensities. The data are expressed as mean ± SD. Different letters indicate significant differences between light intensity treatments (p < 0.05); n = 30.
Molecules 21 01475 g004
Figure 5. Leaf dry biomass of E. pseudowushanense under different light intensities. The data are expressed as mean ± SD. Different letters indicate significant differences between light intensity treatments (p < 0.05); n = 30.
Molecules 21 01475 g005
Figure 6. Medicinal-ingredient yields of E. pseudowushanense under different light intensities. The data are expressed as mean ± SD. Different letters indicate significant differences between light intensity treatments (p < 0.05); n = 30.
Molecules 21 01475 g006
Figure 7. E. pseudowushanense flowers and leaves. There are two compound leaves on each stem and each compound leaf consisted of three leaflets.
Molecules 21 01475 g007
Table 1. Calibration data of four analytes.
Analyte aLinear Range (μg·mL−1)Calibration Equation br2LOD (μg·mL−1)LOQ (μg·mL−1)Intra-Day RSD (%) (n = 6)Inter-Day RSD (%) (n = 6)Recovery and RSD (%) (Mean, n = 6)
L1L3L5L1L3L5
13.1~32.2Y = 7701.546x + 99830.99920.260.812.461.911.361.060.981.39105.54, 3.32
23.1~32.2Y = 5548.525x + 15,7620.99950.290.953.272.381.571.621.781.20104.06, 2.96
320.5~520.6Y = 7171.274x + 31,5440.99930.030.113.361.502.021.831.191.14102.95, 3.37
43.1~32.2Y = 9108.011x + 61410.99960.110.372.501.661.461.791.541.44104.92, 2.70
a The compound codes 1, 2, 3, and 4 of each analyte refers to epimedin A, epimedin B, epimedin C, and icariin, respectively; b Y: peak area; X: concentration of compound (μg·mL−1).

