Article

Phylogenetic and Diversity Analysis of Dactylis glomerata Subspecies Using SSR and IT-ISJ Markers

Department of Grassland Science, Animal Science and Technology College, Sichuan Agricultural University, Chengdu 611130, China
*
Authors to whom correspondence should be addressed.
Molecules 2016, 21(11), 1459; https://doi.org/10.3390/molecules21111459
Submission received: 31 August 2016 / Revised: 13 October 2016 / Accepted: 26 October 2016 / Published: 31 October 2016
(This article belongs to the Section Molecular Diversity)

Abstract

:
The genus Dactylis, an important forage crop, has a wide geographical distribution in temperate regions. While this genus is thought to include a single species, Dactylis glomerata, this species encompasses many subspecies whose relationships have not been fully characterized. In this study, the genetic diversity and phylogenetic relationships of nine representative Dactylis subspecies were examined using SSR and IT-ISJ markers. In total, 21 pairs of SSR primers and 15 pairs of IT-ISJ primers were used to amplify 295 polymorphic bands with polymorphic rates of 100%. The average polymorphic information contents (PICs) of SSR and IT-ISJ markers were 0.909 and 0.780, respectively. The combined data of the two markers indicated a high level of genetic diversity among the nine D. glomerata subspecies, with a Nei’s gene diversity index value of 0.283 and Shannon’s diversity of 0.448. Preliminarily phylogenetic analysis results revealed that the 20 accessions could be divided into three groups (A, B, C). Furthermore, they could be divided into five clusters, which is similar to the structure analysis with K = 5. Phylogenetic placement in these three groups may be related to the distribution ranges and the climate types of the subspecies in each group. Group A contained eight accessions of four subspecies, originating from the west Mediterranean, while Group B contained seven accessions of three subspecies, originating from the east Mediterranean.

1. Introduction

The genus Dactylis L. comprises wind-pollinated and out-crossing cool-season perennial grasses belonging to the grass tribe Poeae, the subfamily Pooideae, and the family Poaceae [1,2]. This genus includes only one species, Dactylis glomerata L. [3], which was interpreted as monotypic, consisting of a single diverse species complex [4,5] and referred to as orchardgrass or cocksfoot grass. Dactylis is native to the northern hemisphere and can be found throughout Europe, temperate and tropical Asia, North Africa, and the Canary Islands [6,7,8]. It has been an important forage grass for more than 100 years in almost all temperate regions of the world.
According to chromosome number, Dactylis can be either diploid (2n = 14), tetraploid (2n = 28), or, in rare instances, hexaploid (2n = 42). Almost all diploids have restricted ranges and occur in particular regions, and together they account for about 5% of all wild Dactylis [9]. Tetraploids, in contrast, are distributed continuously across temperate Europe, the Middle East, West and Central Asia, and North Africa [10]. In many localities the two types are sympatric [11], hexaploids exist across limited ranges in Libya and western Egypt [11,12,13,14].
It is clear that there is a large and continuous range of variation in the genus Dactylis, making it difficult to validate any proposed species within the genus. Most subspecies were acknowledged by the early 1930s [15,16,17,18]. Though many researchers have studied the classification of the genus using cytology, chromosomes, or genetics, taxonomic interpretations of the genus concern distinct knowledge of its natural range, and there is no modern taxonomic treatment for interpreting all subspecies on a unified standard [4]. The taxonomist Domin, who is thought to be the first researcher to interpret taxa in the genus using herbaria and field studies, has recognized one species, Dactylis glomerata L., and eight subspecies [19]. According to even earlier reports [5,20], there were 17 diploid subspecies and three tetraploid subspecies. Still other researchers [21] have suggested 14 diploid subspecies and three major tetraploid subspecies, and in the summary of Lumaret [10], the genus was classified into 15 distinct diploid subspecies, three major tetraploid subspecies, and several minor tetraploid subspecies. Stewart and Ellison [22] divided the genus into 17 diploid subspecies and six tetraploid subspecies. The subspecies santai and “castellata” were described collectively, due to difficulties in differentiating them via flavonoid phytochemistry, enzyme, and morphology data [10]. However in the later report of Stewart and Ellison [4], in the diploid subspecies numbered 18, santai and “castellata” had been regarded as individual subspecies, since “castellata” was often treated as one subspecies since 1969 [9]. Consequently, in our study, we have investigated the collected subspecies, and provided a basis for further classification of these subspecies.
With the development of advances in biotechnology, DNA molecular markers have been used in the phylogenetic analysis of plants since the 1980s. Because DNA molecular markers are not affected by environment or gene expression but reflect the status of the entire genome, they offer some advantages over traditional phenotypic characters. They can be highly polymorphic while also being genetically stable, and so they are regarded as reliable tools for phylogenetic analysis. Simple sequence repeat (SSR) markers are tandem DNA repeats several nucleotides long that can be found in most eukaryotic genomes [23]. Variations in the number of repeats and in the repeats themselves provide polymorphic information at a gene locus. SSRs are considered to be the genetic markers that provide the greatest amount of genetic information [24,25,26], generally displaying high levels of polymorphism [27,28]. Therefore, SSR markers have been used to analyze the phylogenies of many plants, including Agropyron by Che et al., 2015 [29], Oryza by Nishikawa et al., 2005 [30], Sorghum bicolor and Sorghum sundanense by Zhan et al., 2008 [31], Glycine by Wu et al., 2000 [32], and Cicer reticulatum by Sethy et al., 2006 [33]. These results suggest that SSRs are an outstanding tool for phylogenetic analysis. Moreover, SSRs were used in the construction of the Dactylis genetic map [34] and in analyzing genetic variation in Dactylis [35,36]. IT-ISJ (intron-targeted intron-exon splice junction) markers are a new type genetic marker based on the conserved sequences of intron splice junction sites, which can be amplified from intronic regions. They were designed by Zheng [37] with reference to methods developed by Weining and Langridge [38]. IT-ISJ markers present several advantages over other markers, such as lower costs and higher stability than sequence-related amplified polymorphisms, as well as high levels of polymorphism [37].
In this study, SSR and IT-ISJ markers were employed to test the nine subspecies, ranging from four different distribution ranges and three different climate types. The specific objectives were: (1) to study the genetic diversity of all nine subspecies; (2) to discuss the genetic relationship of these nine subspecies, hoping to provide more information for further study into the classification of the genus Dactylis.

2. Results

2.1. Polymorphism and Marker Efficiency Analysis of SSR and IT-ISJ Markers

The 21 SSR primer pairs and 15 IT-ISJ primer pairs were used to amplify DNA fragments from the 20 accessions. A total of 196 bands were obtained from SSR primers, and all of these were polymorphic (100%), with an average number of 9.333 polymorphic bands per primer pair and a range of 6–13 bands. PIC values for SSRs ranged from 0.861 to 0.962, with an average of 0.909. The 15 IT-ISJ primer combinations amplified a total of 99 bands, and all of these were also polymorphic (100%) with a range of 3–10 bands. The average number of polymorphic bands per primer pair was 6.6, and the average PIC was 0.780, with a range from 0.545 to 0.957. These data indicate that SSR and IT-ISJ primer combinations exhibit high amplification efficiency and are reliable in the discovery of polymorphisms (Table 1).
The efficiencies of SSR and IT-ISJ markers were compared using the MI parameters (Table 2). The Ibav index value for IT-ISJ markers (0.54) was higher than that of SSR markers (0.49). However, the EMR index value of SSR markers (9.33) was higher than that of IT-ISJ markers (6.6). The SSR MI value (4.58) was an order of magnitude higher than that of IT-ISJ (3.54), indicating that SSRs are highly efficient markers.

2.2. Genetic Diversity and AMOVA Analysis of Dactylis Subspecies

Nei’s gene diversity index within subspecies ranged from 0.135 (D. glomerata subsp. lusitanica) to 0.252 (D. glomerata subsp. hispanica), and Shannon’s diversity index ranged from 0.211 (D. glomerata. subsp. lusitanica) to 0.425 (D. glomerata subsp. hispanica). The average intra-population diversity was 0.321, and Shannon’s index for all taxa as a population was 0.448. Therefore, the proportion of intra-population diversity was 71.7%, and the proportion of inter-population diversity was 28.3% (Table 3). Additional information about genetic variation statistics and Shannon’s diversity estimation for all accessions are listed in Supplementary Table S1. This indicates a high level diversity within subspecies. The average pairwise genetic similarity coefficients of the nine subspecies ranged from 0.355 (between D. glomerata subsp. lusitanica and D. glomerata subsp. himalayensis) to 0.491 (between D. glomerata subsp. himalayensis and D. glomerata subsp. glomerata).
The results of AMOVA analysis (Table 4) revealed that 19.1% and 80.9% of the variation is included among and within subspecies, respectively, indicating that there is high variation within subspecies. The AMOVA analysis of accessions from different countries revealed high variation within countries for some subspecies, consistent with the above results.

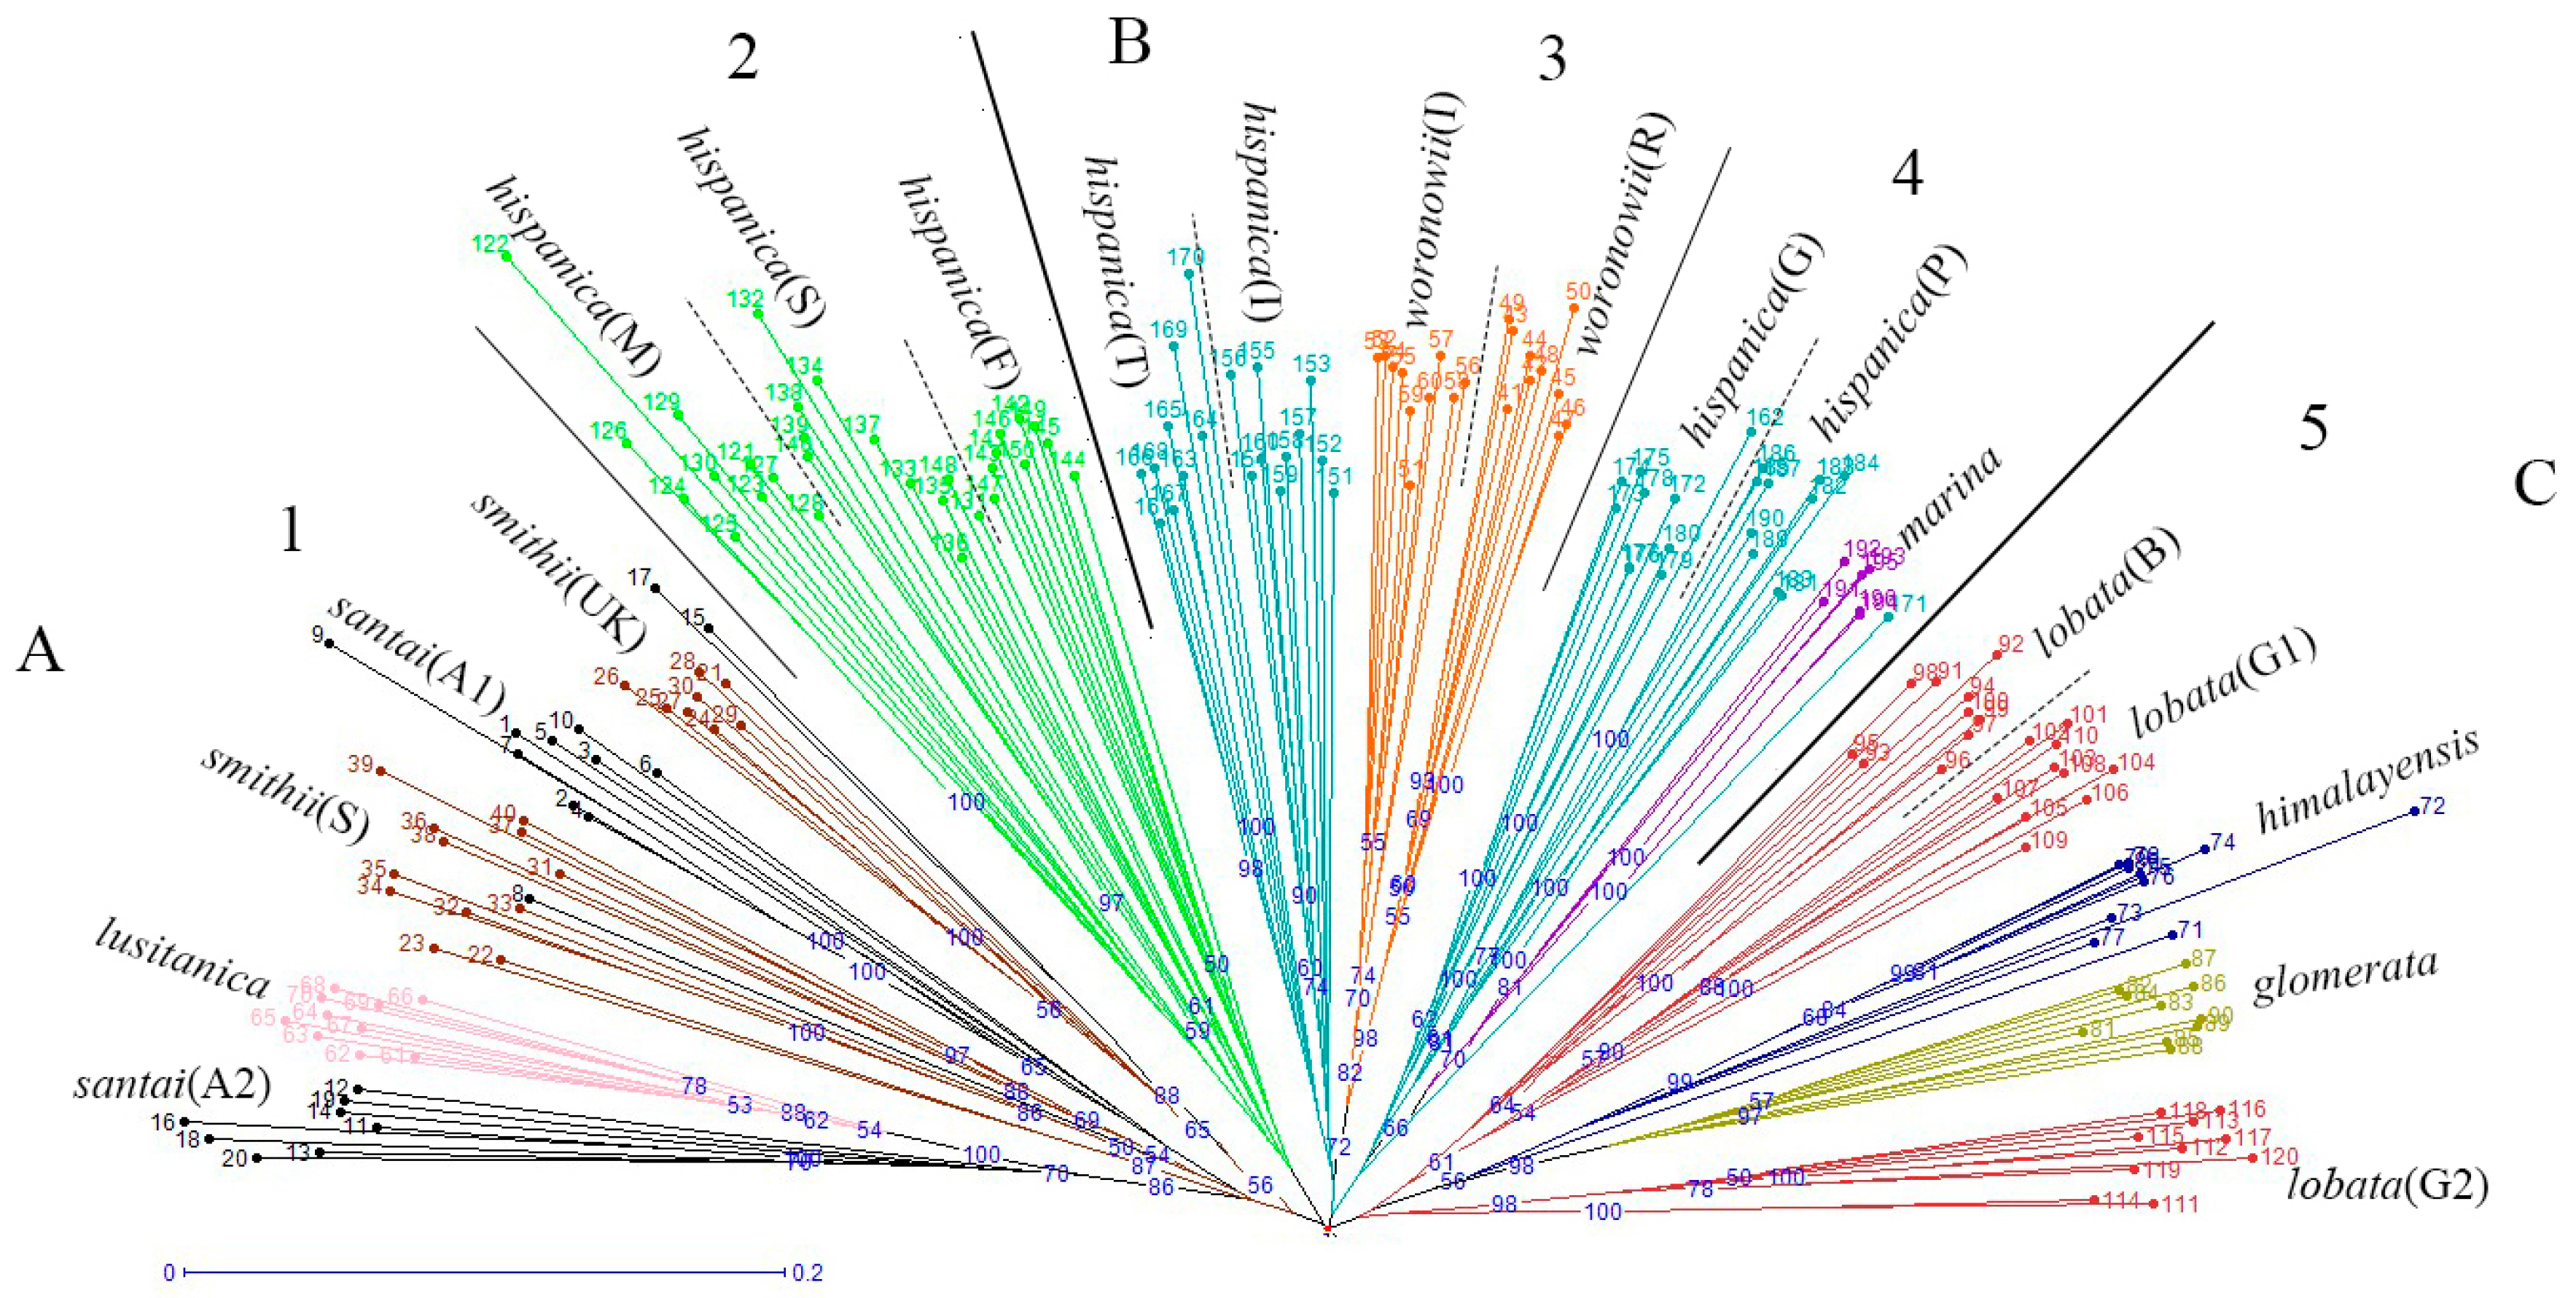
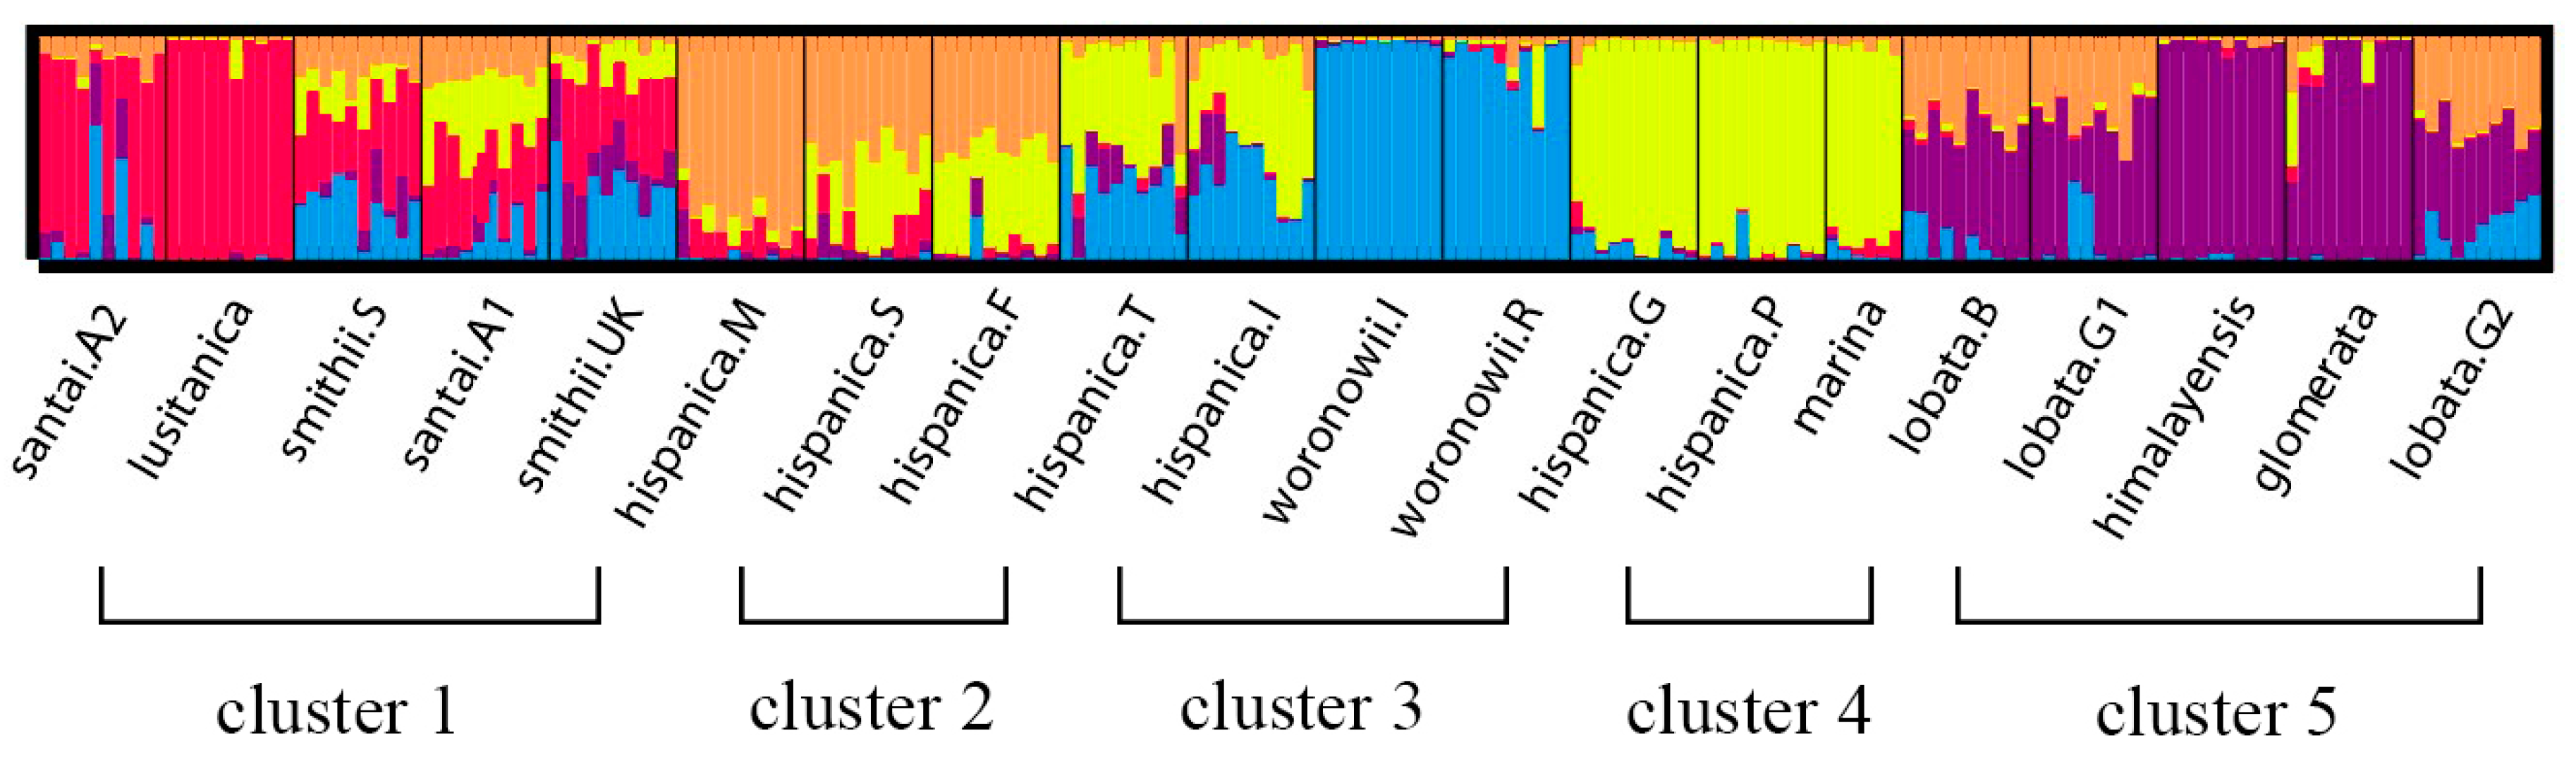
2.3. Phylogenetic Analysis

The neighbor joining unweighted tree (Figure 1) revealed that the individuals of the same accession could also be clustered into the same branch, and mostly the same subspecies could be clustered into the same group. The 20 accessions could clearly be divided into three groups (A, B, and C), and they could further be separated into five clusters which is similar to the structure analysis result (Figure 2) for K = 5. The results of the cluster analyses had a relationship with distribution ranges and climate distribution. The samples of Group A originated in Africa and Europe, and contained four D. glomerata subspecies, santai, lusitanica, smithii, and hispanica. Santai and lusitanica were climatically distributed in the Mediterranean, smithii was subtopical and all three subspecies could also be clustered into Cluster 1. Additionally, the three accessions of hispanica were also from the Mediterranean, formed Cluster 2. The samples of Group B originated in Europe or Asia-Temperate, and contained three D. glomerata subspecies, hispanica, marina, and woronowii, all of which originated in the Mediterranean. Furthermore, the two accessions of hispanica combined with woronowii could be assigned to Cluster 3, and the remaining two accessions of hispanica and the subspecies marina formed Cluster 4. The samples of Group C or Cluster 5 originated in Europe, and contained three D. glomerata subspecies, lobata, himalyensis, and glomerata. They originated in a Temperate climate type.

3. Discussion

3.1. Marker Efficiency Analysis

In this study, we compared the efficiencies of two genetic markers using a marker index (MI) to estimate the utility and efficiency of each marker [39]. To our knowledge, this is the first report of a comparison of the efficiencies of the SSR and IT-ISJ genetic marker systems. The MI value for SSRs was higher than that for IT-ISJs, indicating that SSRs are more efficient and useful. The EMR component contributed highly to MI; while the Ibav values of the two marker types were similar, a higher EMR value for SSRs resulted in a higher MI value. A previous study by Powell et al. [40] compared the efficiency of SSRs with those of RFLPs (restriction fragment length polymorphism), RAPDs (random amplified polymorphic DNA), and AFLPs (amplified fragment length polymorphism). Results indicated that SSRs exhibited higher MI values than the other three genetic marker systems. Likely due to the high polymorphism rates and efficiency of the SSR marker system, it has been widely used for genetic mapping [25,41,42], phylogenetic analysis [32,43], and evaluating genetic diversity [44,45]. Although the MI for IT-ISJ was lower than that of SSR, it reached 3.54, indicating that both types of genetic markers could contribute reliable information for analyzing relationships among the nine Dactylis subspecies.

3.2. Genetic Diversity Analysis

According to Vaiman et al. [46], loci polymorphisms can be divided into three levels based on their information contents: high (PIC > 0.5), medium (0.5 > PIC > 0.25), and low (PIC < 0.25). Among the 20 accessions, all of the SSR and IT-ISJ markers exhibited PIC values > 0.5, with average PIC values of 0.909 and 0.780 for SSR and IT-ISJ markers, respectively. This indicates that both of these types of genetic markers exhibited high polymorphic information contents in our study. This result also confirms that the polymorphism content of IT-ISJ markers is similar to that of SSR markers [37]. Meanwhile, the Nei’s gene diversity index value and Shannon’s diversity index value of the total accession were 0.283 and 0.448, respectively. These values as well as the PIC values reveal that the nine Dactylis subspecies contain abundant genetic diversity [7,47]. Dactylis is a widespread genus, inhabiting many different geographical regions with different environments. In order to adapt to the environments of different geographical regions, Dactylis has been subject to long-term natural selection. Moreover, natural mutation and artificial selection have introduced high variation and abundant diversity in the genus.

3.3. Phylogenetic Analysis

The phylogenetic analysis of the 20 accessions revealed that certain phylogenetic clades are correlated with distribution range and climate type. For the most part, the subspecies of different climate type clustered into different phylogenetic branches, with the exception of a single subspecies, smithii, belonging to the subtropical area, while it was clustered into Group A, together with some samples belonging to Mediterranean. All three groups contained samples from Europe, indicating they have a high level of genetic diversity and variation, and this result also indicated Europe to be one of the diversity differentiation centers of Dactylis [48]. Generally, the origin of our samples which located in the western Mediterranean could be clustered into Group A, and those located in the eastern Mediterranean could be clustered into Group B. Several countries in the western Mediterranean are subject to Holocene climate change [49], resulting in different climates between the western Mediterranean and eastern Mediterranean. Therefore, we suspect that climate change and glaciation events may have caused genetic variation of Dactylis subspecies.
The two subspecies santai and smithii were clustered into Cluster 1 in Group A, showing that the two subspecies appeared closely related, which is consistent with the study of Stewart and Ellison [8], in which these two subspecies were found in the same (European and North African) clade. Subspecies lobata, a synonym of D. glomerata subsp. aschersoniana [22], were also in this clade (European and North African), which was slightly different from our result, clustering lobata together with himalayensis and glomerata and forming Cluster 5 or Group C. However, it has been reported that subspecies lobata and himalayensis have both been found in cool temperate forests at relatively high altitudes in continental climates and thus have been assigned to the same group [10]. They have similar habitats and share similar isozyme allelic patterns, flavone phytochemistries, DNA contents, and morphologies [22], indicating a close relationship between the two. Additionally, according to our study, the genetic similarity between himalayensis and glomerata was maximal at 0.491, which was also supported by the structure analysis result. The two subspecies had a very similarity genetic background, indicating that subspecies glomerata may have affinities with himalayensis, which were consistent with our phylogenetic analysis. Moreover, Stebbins and Zohary [5] suggested that subspecies glomerata may have evolved from the hybridization of lobata (aschersoniana) and woronowii and that some glomerata in the Alps may have evolved from the hybridization of rechenbachii and lobata (aschersoniana). Therefore, these three may have a very close relationship. In Group B and Cluster 4, two accessions of subspecies hispanica were closely related to marina, and structure analysis revealed them to have a very similar genetic background, which may reflect their similar distribution range and climate type. Moreover, according to the study reported by Martin Borrill et al. [9], hispanica is the principal subspecies found in regions with a Mediterranean climate, and marina Borrill can be found in Mediterranean coastal regions. Marina was separated from hispanica due to its epidermal papillae [19], but the two subspecies in Mediterranean exhibit many similar features [22]. Therefore, these two subspecies may derive from a recent common ancestor.

4. Materials and Methods

4.1. Plant Materials

We selected 20 plant introduction (PI) accessions from 14 countries, including nine D. glomerata subspecies (Table 5). Origin and distributional range information were from U.S. National Plant Germplasm System (https://npgsweb.ars-grin.gov), and the climate type were listed in accordance with previous report [50]. US National Plant Germplasm System (US NPGS) generously provide all the materials.

4.2. DNA Extraction

Each accession was represented by 6–10 plants, and fresh leaf tissues were collected from each plant and preserved in silica gel desiccant. Genomic DNA was extracted using a modified CTAB method [51]. The quality and concentration of each DNA sample were assessed by NanoVue Plus spectrophotometry (General Electric Company, England, UK) and electrophoresis on 1% agarose gel. Isolated genomic DNA was diluted to 10 ng/L and stored at −20 °C for use.

4.3. Primer Selection and PCR Amplification

According to previous reports [52,53], a total of 100 Dactylis SSR primers have been described and 21 primers amplifying relatively more numbers and clear diversity bands were selected in our study (Table 6). PCR reactions were carried out in a volume of 15 μL containing 40 ng genomic DNA, 0.4 U Taq polymerase, 0.6 μM each primer (forward and reverse), and 7.5 μL Golden easy PCR mix (Tiangen Biotech, Beijing, China). PCR cycling parameters were carried out as described by Xie et al. [54].
Based on preliminary tests, 15 pairs of IT-ISJ primers were selected from among 204 combinations of 6 forward and 34 reverse primers (Table 7) published in Zheng et al. [37] PCR reactions were carried out in a volume of 15 μL containing 40 ng genomic DNA, 0.5 U Taq polymerase, 0.75 μM each primer, and 7.5 μL Golden easy PCR mix. PCR cycling parameters were carried out as described by Zheng et al. [37], with a slight adjustment as follows: initial denaturation at 94 °C for 5 min, 40 cycles of denaturing at 94 °C for 45 s, annealing at 50–55 °C for 45 s, and elongation at 72 °C for 1 min, a final elongation at 72 °C for 10 min, followed by preservation at 4 °C.
Amplified fragments were separated on 6% denatured polyacrylamide gels, with D2000 as a size marker. After electrophoresis, the gel was stained with AgNO3 solution and photographed by digital camera.

4.4. Data Analysis

All analyses were conducted by grouping SSR and IT-ISJ marker data together. Unambiguous amplified bands of each SSR and IT-ISJ marker were scored as 1 for presence and 0 for absence. The total number of bands (TNB), number of polymorphic bands (NPB), and percentage of polymorphic bands (PPB) were obtained from the gels. The polymorphism information content (PIC) of each SSR and IT-ISJ locus was estimated using the method of Nei [55] according to the formula: PICi = 1 − ∑Pij2, where Pij is the frequency of the jth allele for ith locus, summed across all alleles of the locus. The average PIC of each primer pair was determined by PICa = ∑PICi/N, where N is the number of polymorphic bands per primer. Meanwhile, the efficiencies of SSR and IT-ISJ markers were assessed by marker index (MI), which includes the average band informativeness (Ibav) for the polymorphic markers and the effective multiplex ratio (EMR) [40]. Ibav was calculated with the formula: Ibav = 1/n∑1 − (2 × |0.5 − pi|), where “n” is the total number of amplification sites and pi represents the proportion of the ith amplification site. EMR is the average number of polymorphic bands [56].
Population genetic parameters including Nei’s gene diversity index (He) [55] and Shannon’s diversity index (I) [57] for each accession were estimated using POPGENE v.1.3.2 (University of Alberta, Edmonton, CA, USA) with a model for dominant markers and diploid individuals. Meanwhile, an analysis of molecular variance (AMOVA) was performed to determine the variance within and among the nine subspecies by AMOVA version 1.55 (University of Geneva, Geneva, Switzerland). For subspecies that included accessions from different countries, AMOVA was also performed to determine the variance within and among countries. Data input files for POPGENE and AMOVA were managed by the DCFA1.1 program written by Zhang [58]. Genetic similarities were calculated between pairs of plants using Dice coefficients [59] with the NTSYS-pc2.10 software package [60], and the average genetic similarities between pairs of plants in two species were regarded as genetic similarities between these two subspecies. We obtained the average genetic similarities between each pair of accession. A neighbor joining unweighted phylogenetic tree was constructed based on the Dice dissimilarity matrix between 196 individuals and 1000 bootstrap replicates were performed using the Darwin software package v5.0148 [61]. Population structure was also analyzed using STRUTURE software v.2.3.4 [62]. The analyses were performed under the admixture model and 10 independent runs for K values ranging from 1 to 20 were performed with a burn-in 50,000 and 100,000 iterations of Markov chain convergence. Furthermore, the most probable value of K was determined in accordance with Haidong Yan et al. [47].

5. Conclusions

In this study, we compared the efficiencies of SSR and IT-ISJ markers, revealing that SSRs exhibit higher efficiency. The 20 accessions of 9 subspecies from various countries were included in our study, exhibiting a high level of genetic diversity. Furthermore, the result of cluster analysis had a certain relationship with distribution ranges. Phylogenetic analysis and structure analysis indicated that genetic relationships among Dactylis subspecies may also be associated with their climate types. The materials from the Temperate type could be divided into individual Group C or Cluster 5, and the materials from the subtropical type together with some materials from the Mediterranean type formed one group (A), while the remaining materials of the Mediterranean were gathered into a different group (B). Furthermore, according to the origin of our materials, the materials from western and eastern Mediterranean could be divided into different groups (A and B).

Supplementary Materials

Supplementary materials can be accessed at: https://www.mdpi.com/1420-3049/21/11/1459/s1.

Acknowledgments

This study was funded by the earmarked fund for Modern Agro-industry Technology Research System (No. CARS-35-05), the National Natural Science Foundation of China (No. NSFC31372363), and the National Basic Research Program (973 program) in China (No. 2014CB138705).

Author Contributions

X.Z. designed and conceived the experiments. D.Y. and X.Z. performed the experiments. D.Y., X.Z., Y.C., X.M., L.H., and X.Z. analyzed the data; D.Y. and L.H. wrote the paper.

Conflicts of Interest

The authors declare no conflict of interest.

References

  1. Watson, L.; Clifford, H.T.; Dallwitz, M.J. The classification of Poaceae: Subfamilies and supertribes. Aust. J. Bot. 1985, 33, 433–484. [Google Scholar] [CrossRef]
  2. Watson, L.; Dallwitz, M.J.; Johnston, C. Grass genera of the world: 728 detailed descriptions from an automated database. Aust. J. Bot. 1986, 34, 223–230. [Google Scholar] [CrossRef]
  3. Sanada, Y.; Gras M, C.; van Santen, E. Cocksfoot. In Fodder Crops and Amenity Grasses, 1st ed.; Boller, B., Posselt, U.K., Veronesi, F., Eds.; Springer: New York, NY, USA, 2010; pp. 317–328. [Google Scholar]
  4. Stewart, A.V.; Ellison, N.W. A molecular phylogenetic framework for cocksfoot (Dactylis glomerata L.) improvement. Crop Pasture Sci. 2014, 65, 780. [Google Scholar] [CrossRef]
  5. Stebbins, G.L.; Zohary, D. Cytogenetic and Evolutionary Studies in the Genus Dactylis: I: Morphology, Distribution, and Interrelationships of the Diploid Subspecies; University of California Press: Oakland, CA, USA, 1959. [Google Scholar]
  6. Beddows, A.R. Dactylis glomerata L. J. Ecol. 1959, 47, 223–239. [Google Scholar] [CrossRef]
  7. Xie, W.-G.; Zhang, X.-Q.; Cai, H.-W.; Liu, W.; Peng, Y. Genetic diversity analysis and transferability of cereal EST-SSR markers to orchardgrass (Dactylis glomerata L.). Biochem. Syst. Ecol. 2010, 38, 740–749. [Google Scholar] [CrossRef]
  8. Stewart, A.V.; Ellison, N. Origins of Diploid Dactylis from China as Determined by ITS Sequences. In Molecular Breeding of Forage and Turf, 1st ed.; Budak, H., Spangenberg, G., Eds.; Springer: Cham, Switzerland, 2015; pp. 165–171. [Google Scholar]
  9. Borrill, M.; Carroll, C. A chromosome atlas of the genus Dactylis (Part two). Cytologia 1969, 34, 6–17. [Google Scholar] [CrossRef]
  10. Lumaret, R.; Borrill, M. sCytology, genetics, and evolution in the genus Dactylis. Crit. Rev. Plant Sci. 1988, 7, 55–91. [Google Scholar] [CrossRef]
  11. Borrill, M. The pattern of morphological variation in diploid and tetraploid Dactylis. J. Linn. Soc. Lond. Bot. 1961, 56, 441–452. [Google Scholar] [CrossRef]
  12. Jones, K.; Borrill, M. Chromosomal status, gene exchange and evolution in Dactylis. Genetica 1962, 32, 296–322. [Google Scholar] [CrossRef]
  13. Jones, K.; Carroll, C.P.; Borrill, M. A chromosome atlas of the genus Dactylis L. Cytologia 1961, 26, 333–343. [Google Scholar] [CrossRef]
  14. Borrill, M.; Jones, K. Hexaploid Dactylis. Nature 1961, 190, 469–470. [Google Scholar] [CrossRef]
  15. Levan, A.V. Beitrag zur Kenntnis der Chromosomen in der Gattung Dactylis L. Bot. Not. 1930, 1930, 95–104. [Google Scholar]
  16. Kattermann, G. Chromosomenuntersuchungen bei Gramineen. Planta 1930, 12, 19–37. [Google Scholar] [CrossRef]
  17. Müntzing, A. Quadrivalent formation and aneuploidy in Dactylis glomerata. Bot Not. 1933, 84, 198–205. [Google Scholar]
  18. Müntzing, A. The effects of chromosomal variation in Dactylis. Hereditas 1937, 23, 113–235. [Google Scholar] [CrossRef]
  19. Borrill, M. Dactylis marina, Borrill, sp. nov. a natural group of related tetraploid forms. J. Linn. Soc. Lond. Bot. 1961, 56, 431–439. [Google Scholar] [CrossRef]
  20. Borrill, M. Chromosomal status, gene exchange and evolution in Dactylis. Genetica 1962, 32, 94–117. [Google Scholar] [CrossRef]
  21. Fiasson, J.; Ardouin, P.; Jay, M. A Phylogenetic Groundplan the Specific Complex Dactylis glomerara. Biochem. Syst. Ecol. 1987, 15, 225–229. [Google Scholar] [CrossRef]
  22. Stewart, A.V.; Ellison, N.W.  Dactylis. In Wild Crop Relatives: Genomic and Breeding Resources, 1st ed.; Kole, C., Ed.; Springer: Berlin/Heidelberg, Germany, 2011; pp. 73–87. [Google Scholar]
  23. Hamada, H.; Petrino, M.G.; Kakunaga, T. A novel repeated element with Z-DNA-forming potential is widely found in evolutionarily diverse eukaryotic genomes. Proc. Natl. Acad. Sci. USA 1982, 79, 6465–6469. [Google Scholar] [CrossRef] [PubMed]
  24. Bowcock, A.; Ruiz-Linares, A.; Tomfohrde, J.; Minch, E.; Kidd, J.; Cavalli-Sforza, L.L. High resolution of human evolutionary trees with polymorphic microsatellites. Nature 1994, 368, 455–457. [Google Scholar] [CrossRef] [PubMed]
  25. Wu, K.-S.; Tanksley, S.D. Abundance, polymorphism and genetic mapping of microsatellites in rice. Mol. Gen. Genet. 1993, 241, 225–235. [Google Scholar] [CrossRef] [PubMed]
  26. Panaud, O.; Chen, X.; McCouch, S. Development of microsatellite markers and characterization of simple sequence length polymorphism (SSLP) in rice (Oryza sativa L.). Mol. Gen. Genet. 1996, 252, 597–607. [Google Scholar] [CrossRef] [PubMed]
  27. Beckmann, J.; Soller, M. Toward a unified approach to genetic mapping of eukaryotes based on sequence tagged microsatellite sites. Biotechnology 1990, 8, 930–932. [Google Scholar] [CrossRef] [PubMed]
  28. Brown, S.M.; Hopkins, M.S.; Mitchell, S.E.; Senior, M.L.; Wang, T.Y.; Duncan, R.R.; Gonzalez-Candelas, F.; Kresovich, S. Multiple methods for the identification of polymorphic simple sequence repeats (SSRs) in sorghum [Sorghum bicolor (L.) Moench]. Theor. Appl. Genet. 1996, 93, 190–198. [Google Scholar] [CrossRef] [PubMed]
  29. Che, Y.; Yang, Y.; Yang, X.; Li, X.; Li, L. Phylogenetic relationship and diversity among Agropyron Gaertn. germplasm using SSRs markers. Plant Syst. Evol. 2015, 301, 163–170. [Google Scholar] [CrossRef]
  30. Nishikawa, T.; Vaughan, D.A.; Kadowaki, K.-I. Phylogenetic analysis of Oryza species, based on simple sequence repeats and their flanking nucleotide sequences from the mitochondrial and chloroplast genomes. Theor. Appl. Genet. 2005, 110, 696–705. [Google Scholar] [CrossRef] [PubMed]
  31. Zhan, Q.; Zhang, T.; Wang, B.; Li, J. Diversity comparison and phylogenetic relationships of S. bicolor and S. sundanense as revealed by SSR markers. Plant Sci. 2008, 174, 9–16. [Google Scholar] [CrossRef]
  32. Wu, X.; He, C.; Chen, S.; Zhuang, B.; Wang, K.; Wang, X. [Phylogenetic analysis of interspecies in genus Glycine through SSR markers]. Yi Chuan Xue Bao 2000, 28, 359–366. [Google Scholar]
  33. Sethy, N.K.; Choudhary, S.; Shokeen, B.; Bhatia, S. Identification of microsatellite markers from Cicer reticulatum: Molecular variation and phylogenetic analysis. Theor. Appl. Genet. 2006, 112, 347–357. [Google Scholar] [CrossRef] [PubMed]
  34. Zhao, X.; Huang, L.; Zhang, X.; Wang, J.; Yan, D.; Ji, L.; Tang, L.; Li, X.; Shi, T. Construction of high-density genetic linkage map and identification of flowering-time QTLs in orchardgrass using SSRs and SLAF-seq. Sci. Rep. 2016, 6. [Google Scholar] [CrossRef] [PubMed]
  35. Xie, W.; Lu, X.; Zhang, X.; Huang, L.; Cheng, L. Genetic variation and comparison of orchardgrass (Dactylis glomerata L.) cultivars and wild accessions as revealed by SSR markers. Genet. Mol. Res. 2012, 11, 425–433. [Google Scholar] [CrossRef] [PubMed]
  36. Xie, W.G.; Zhang, X.Q.; Cheng, Y.X. Identification and genetic variation analysis of orchardgrass hybrids (Dactylis glomerata) by SSR molecular markers. Acta Prataculturae Sin. 2010, 19, 212–217. [Google Scholar]
  37. Zheng, J.; Zhang, Z.; Chen, L.; Wan, Q.; Hu, M.; Wang, W.; Zhang, K.; Liu, D.; Chen, X.; Wei, X. Intron-targeted intron-exon splice conjunction (IT-ISJ) marker and its application in construction of upland cotton linkage map. Agric. Sci. Chin. 2008, 7, 1172–1180. [Google Scholar] [CrossRef]
  38. Weining, S.; Langridge, P. Identification and mapping of polymorphisms in cereals based on the polymerase chain reaction. Theor. Appl. Genet. 1991, 82, 209–216. [Google Scholar] [CrossRef] [PubMed]
  39. Varshney, R.K.; Chabane, K.; Hendre, P.S.; Aggarwal, R.K.; Graner, A. Comparative assessment of EST-SSR, EST-SNP and AFLP markers for evaluation of genetic diversity and conservation of genetic resources using wild, cultivated and elite barleys. Plant Sci. 2007, 173, 638–649. [Google Scholar] [CrossRef]
  40. Powell, W.; Morgante, M.; Andre, C.; Hanafey, M.; Vogel, J.; Tingey, S.; Rafalki, A. The comparison of RFLP, RAPD, AFLP and SSR (microsatellite) markers for germplasm analysis. Mol. Breed. 1996, 2, 225–238. [Google Scholar] [CrossRef]
  41. Gupta, P.; Balyan, H.; Edwards, K.; Isaac, P.; Korzun, V.; Röder, M.; Gautier, M.-F.; Joudrier, P.; Schlatter, A.; Dubcovsky, J.; et al. Genetic mapping of 66 new microsatellite (SSR) loci in bread wheat. Theor. Appl. Genet. 2002, 105, 413–422. [Google Scholar] [PubMed]
  42. Song, Q.; Marek, L.; Shoemaker, R.; Lark, K.; Concibido, V.; Delannay, X.; Specht, J.; Cregan, P. A new integrated genetic linkage map of the soybean. Theor. Appl. Genet. 2004, 109, 122–128. [Google Scholar] [CrossRef] [PubMed]
  43. Agrama, H.; Tuinstra, M. Phylogenetic diversity and relationships among sorghum accessions using SSRs and RAPDs. Afr. J. Biotechnol. 2004, 2, 334–340. [Google Scholar] [CrossRef]
  44. Hokanson, S.; Szewc-McFadden, A.; Lamboy, W.; McFerson, J. Microsatellite (SSR) markers reveal genetic identities, genetic diversity and relationships in a Malus × domestica Borkh. core subset collection. Theor. Appl. Genet. 1998, 97, 671–683. [Google Scholar] [CrossRef]
  45. Yamamoto, T.; Kimura, T.; Sawamura, Y.; Kotobuki, K.; Ban, Y.; Hayashi, T.; Matsuta, N. SSRs isolated from apple can identify polymorphism and genetic diversity in pear. Theor. Appl. Genet. 2001, 102, 865–870. [Google Scholar] [CrossRef]
  46. Vaiman, D.; Mercier, D.; Moazami-Goudarzi, K.; Eggen, A.; Ciampolini, R.; Lépingle, A.; Velmala, R.; Kaukinen, J.; Varvio, S.; Martin, P.; et al. A set of 99 cattle microsatellites: Characterization, synteny mapping, and polymorphism. Mamm. Genome 1994, 5, 288–297. [Google Scholar] [CrossRef] [PubMed]
  47. Yan, H.; Zhang, Y.; Zeng, B.; Yin, G.; Zhang, X.; Ji, Y.; Huang, L.; Jiang, X.; Liu, X.; Peng, Y.; Zeng, B. Genetic Diversity and Association of EST-SSR and SCoT Markers with Rust Traits in Orchardgrass (Dactylis glomerata L.). Molecules 2016, 21, 66. [Google Scholar] [CrossRef] [PubMed]
  48. Nevo, E. Genetic diversity inn wild cereals: Regional and local studies and their bearing on conservation in situ. Genet. Resour. Crop Evol. 1998, 45, 355–370. [Google Scholar] [CrossRef]
  49. Jalut, G.; Amat, A.E.; Bonnet, L.; Gauquenlin, T.; Fontugne, M. Holocene climatic changes in the Western Mediterranean, from south-east France to south-east Spain. Palaeogeogr. Palaeoclimatol. Palaeoecol. 2000, 160, 255–290. [Google Scholar] [CrossRef]
  50. Amirouche, N.; Misset M, T. Morphological variation and distribution of cytotypes in the diploid-tetraploid complex of the genus Dactylis L. (Poaceae) from Algeria. Plant Syst. Evol. 2007, 264, 157–174. [Google Scholar] [CrossRef]
  51. Doyle, J. DNA protocols for plants. In Molecular Techniques in Taxonomy; Godfrey, M., Andrew, W.B., Young, J., Perter, W., Eds.; Springer: Berlin/Heidelberg, Germany, 1991; pp. 283–293. [Google Scholar]
  52. Huang, L.; Yan, H.; Zhao, X.; Zhang, X.; Wang, J.; Frazier, T.; Yin, G.; Huang, X.; Yan, D.; Zhang, W.; et al. Identifying differentially expressed genes under heat stress and developing molecular markers in orchardgrass (Dactylis glomerata L.) through transcriptome analysis. Mol. Ecol. Res. 2015, 15, 1497–1509. [Google Scholar] [CrossRef] [PubMed]
  53. Song, Y.; Liu, F.; Zhu, Z.; Tan, L.; Fu, Y.; Sun, C.; Cai, H. Construction of a simple sequence repeat marker-based genetic linkage map in the autotetraploid forage grass Dactylis glomerata L. Grassl. Sci. 2011, 57, 158–167. [Google Scholar] [CrossRef]
  54. Xie, W.-G.; Zhang, X.-Q.; Ma, X.; Cai, H.-W.; Huang, L.-K.; Peng, Y.; Zeng, B. Diversity comparison and phylogenetic relationships of cocksfoot (Dactylis glomerata L.) germplasm as revealed by SSR markers. Can. J. Plant Sci. 2010, 90, 13–21. [Google Scholar] [CrossRef]
  55. Nei, M. Analysis of gene diversity in subdivided populations. Proc. Natl. Acad. Sci. USA 1973, 70, 3321–3323. [Google Scholar] [CrossRef] [PubMed]
  56. Archak, S.; Gaikwad, A.B.; Gautam, D.; Rao, E.V.; Swamy, K.R.; Karihaloo, J.L. Comparative assessment of DNA fingerprinting techniques (RAPD, ISSR, AFLP) for genetic analysis of cashew (Anacardium occidentale L.) accessions of India. Genome 2003, 46, 362–369. [Google Scholar] [CrossRef] [PubMed]
  57. Lewontin, R.C. Testing the theory of natural selection. Nature 1972, 236, 181–182. [Google Scholar]
  58. Zhang, F. DCFA 1.1, a Program Companied with AMOVA to Compute the Matrix of Distance; Laboratory of Systematic and Evolutionary Botany, Institute of Botany, Chinese Academy of Science: Beijing, China, 2001. [Google Scholar]
  59. Dice, L.R. Measures of the amount of ecologic association between species. Ecology 1945, 26, 297–302. [Google Scholar] [CrossRef]
  60. Rohlf, F.J. NTSYS-pc: Numerical taxonomy and multivariate analysis system. Applied Biostatistics, 1992. [Google Scholar]
  61. Perrier, X.; Jacquemoud-Collet, J.P. DARwin Software. Available online: http://darwin.cirad.fr/ (accessed on 27 October 2016).
  62. Pritchard, J.K.; Stephens, M.; Rosenberg N, A.; Donnelly, P. Association mapping in structured populations. Am. J. Hum. Genet. 2000, 67, 170–181. [Google Scholar] [CrossRef] [PubMed]
  • Sample Availability: Not available.
Figure 1. Neighbor-jioning dendrogram of 196 individuals of 20 accessions (nine D. glomerata subspecies), created with Darwin V5.0148. A, B and C mean the 20 accessions could be divided into three groups, and the number 1−5 indicate five clusters in accordance with the STRUCTURE analysis results when K = 5.
Molecules 21 01459 g001
Figure 2. Flow chart of the STRUCTURE analysis of 196 individuals of 20 accessions (nine D. glomerata subspecies) at optimum K value (K = 5). The five different colors (red, orange, yellow, blue and purple) represent five genetic background, and we divided these 20 accessions into five clusters (1–5).
Molecules 21 01459 g002
Table 1. Amplification results from SSR and IT-ISJ primer combinations.
Primer CodeTNBNPBPPB (%)PICPrimer CodeTNBNPBPPB (%)PIC
FOG21511111000.916IT-ISJ01F03R881000.616
FOG238991000.768IT-ISJ01F04R881000.874
FOG25813131000.909IT-ISJ01F05R551000.957
FOG296661000.869IT-ISJ01F08R661000.710
FOG36210101000.962IT-ISJ03F41R991000.833
FOG402881000.861IT-ISJ03F47R771000.741
FOG51411111000.959IT-ISJ03F59R10101000.728
FOG51510101000.940IT-ISJ04F04R661000.626
FOG537771000.938IT-ISJ05F20R771000.835
FOG59110101000.916IT-ISJ05F36R331000.924
FOG634991000.928IT-ISJ06F50R331000.911
FOG655881000.910IT-ISJ07F05R771000.814
FOG707881000.956IT-ISJ07F11R771000.727
FOG11210101000.905IT-ISJ07F12R881000.852
FOG393881000.948IT-ISJ07F15R551000.545
FOG45510101000.872Total99
FOG598881000.920Mean6.600 0.780
FOG624991000.871
FOG824991000.875
FOG83113131000.952
DGSSR14primer12991000.914
Total196
Mean9.333 0.909
TNB = total number of bands; NPB = number of polymorphic bands; PPB = percentage of polymorphic bands; PIC = polymorphism information content.
Table 2. Efficiency parameters of SSR and IT-ISJ markers.
ItemsSSRIT-ISJ
No. of primers2115
No. of total loci19699
No. of average loci per primer9.336.6
Percentage of polymorphic bands (PPB)100100
Average band informativeness (Ibav)0.490.54
Effective multiplex ratio (EMR)9.336.60
Marker index (MI)4.583.54
Table 3. Genetic variation statistics and Shannon’s diversity estimation for all subspecies.
SubspeciesNaNeHeIDistribution of Genetic Diversity
D. glomerata subsp. santai1.8981.4090.2570.401It0.448
D. glomerata subsp. smithii1.8711.3720.2350.370Is0.321
D. glomerata subsp. woronowii1.8071.3440.2170.340Is/It0.717
D. glomerata subsp. lusitanica1.4711.2130.1350.211S'0.283
D. glomerata subsp. himalayensis1.5561.2550.1590.248
D. glomerata. subsp. glomerata1.5361.2640.1620.251
D. glomerata subsp. lobata1.8811.3680.2320.366
D. glomerata subsp. hispanica1.9931.4200.2690.425
D. glomerata subsp. marina1.5191.3070.1840.276
Mean1.7261.3280.2050.321
Total2.0001.4330.2830.448
Na = observed number of alleles; Ne = effective number of alleles; He = expected heterozygosity or Nei’s gene diversity; I = Shannon’s diversity index; It = total diversity; Is = intra-subspecies diversity; Is/It = proportion of intra-subspecies diversity; S' = proportion of inter-subspecies diversity.
Table 4. AMOVA of 20 subspecies and across countries where applicable.
Source of VariationSum of SquaresVariance ComponentTotal Variation (%)Degree of Freedomsp-Values
20 accessions
Variance among accessions2132.57110.8920.19119<0.001
Variance within accessions8661.51046.0720.809176<0.001
D. glomerata subsp. hispanica
Variance among countries1384.83711.4340.1086<0.001
Variance within countries6139.53394.4540.89263<0.001
D. glomerata subsp. lobata
Variance among countries165.0508.9700.1652<0.001
Variance within countries1272.75045.4550.83527<0.001
D. glomerata subsp. smithii
Variance among countries144.80010.3400.2002<0.001
Variance within countries745.20041.4000.80017<0.001
D. glomerata subsp. woronowii
Variance among countries141.30010.5080.2252<0.001
Variance within countries652.00036.2220.77517<0.001
Table 5. Accession numbers, origin, distributional range, and climate type of materials.
CodeNameTaxonOrigin and LocalityDistribution RangeClimate Type
1PI237605D. glomerata subsp. santaiMountain Tessala, near Sidi Abbes, AlgeriaUnknownMediterranean
2PI368880D. glomerata subsp. santaiMountain Tessala, north of Sidi Abbes, AlgeriaUnknownMediterranean
3PI441034D. glomerata subsp. smithiiUnited Kingdom (Portugal-madeira Islands; spain-Canary Islands)AfricaSubtropical
4PI237607D. glomerata subsp. smithiiTenerife, Canary Islands, SpainAfricaSubtropical
5PI538922D. glomerata subsp. woronowiiRussian Federation, LeningradAsia-TemperateMediterranean
6PI237610D. glomerata subsp. woronowiiTehran, IranAsia-TemperateMediterranean
7PI237602D. glomerata subsp. lusitanicaNear Sintra, Algueirao, PortugalEuropeMediterranean
8PI295271D. glomerata subsp. himalayensisIndiaAsia-TropicalTemperate
9PI538920D. glomerata subsp. glomerataRussian FederationUnknownTemperate
10PI316209D. glomerata subsp. lobataBulgariaEuropeTemperate
11PI372621D. glomerata subsp. lobataBremen, GermanyEuropeTemperate
12PI283242D. glomerata subsp. lobataGermanyEuropeTemperate
13PI231517D. glomerata subsp. hispanicaMidelt, MoroccoAfricaMediterranean
14PI265568D. glomerata subsp. hispanicaSpainEurope (Canry Islands) Africa (Baleares)Mediterranean
15PI265567D. glomerata subsp. hispanicaFranceEuropeMediterranean
16PI224599D. glomerata subsp. hispanicaRuhama, IsraelUnknownMediterranean
17PI277836D. glomerata subsp. hispanicaTurkeyAsia-TemperateMediterranean
18PI231550D. glomerata subsp. hispanicaAgrinion, GreeceEuropeMediterranean
19PI231541D. glomerata subsp. hispanicaNazare, PortugalEuropeMediterranean
20PI577065D. glomerata subsp. marinaSao Vivent, PortugalEuropeMediterranean
Table 6. SSR primer sequences.
Primer NameForward Primer (5′→3′)Reverse Primer (5′→3′)
FOG215CAGTGACTACCGTCGTTACTCTTGCTGCAAGGAAAATTC
FOG238GTCACCTAAGCCATAGCAAGACTTCTGTGTTGGTACCGAC
FOG258GCAGTATGGTGCTCTCTCTTCACTCGTTCAGATCGTCC
FOG296ATGGAAGTTTCCTGGAATGGAAGCAGAGTAGAGCCCAC
FOG362ATTGCATGGTTCTGCACT GTGAGTATGCGTGTTTGCTA
FOG402TCCTTATGAAATGAATGAATGAAAGAACTGGACATATACTTGGG
FOG514CTGATTCGATATGAATGCTTC ACATGATTGAGAAACGGAAC
FOG515GATGAAGGAACTGCTGGATACACCAGACCCTAAACAGC
FOG537TAAATCTTGCACTTATCTGTGCAACTGTACTCTCTCACACCCTC
FOG591CTCATGCAAGATATGGCACAAGATCAGGTTTGAACCTCTC
FOG634GTGCGTCTTTTAAATGGTATGGAGCCTCCCTAACCCTAGTA
FOG655GAGATGAGCCATGATTCATT GTGCTTGCTTGATTCACC
FOG707CGCTAGAACCTCCCTACACCAAAAGATCTTCAACGCTG
FOG112TAAGAATCGATCCTCCCGACCTTCTTCCACTCCGTC
FOG393GGGGAGGTACCCACTTCTTTACCCAATCTAAGATCTTTGC
FOG455GTGAGGTTGTGGAAAGTGACCAAAACTAACGCCGTTAACT
FOG598GCCAGGTCAGTCACTCAC AGAAAATTCCCCAACAGC
FOG624CATCAGGGTAGTATCCCGTAAGTTCCTTCTCCTCTGCTTT
FOG824TAGTGGAATGTCAAGAAAATGAAAAATGTCCTTGTTCCCAG
FOG831TAAAGCATATGCAACAATGCTGCTAAAGCCTTTTACAGCT
DGSSR14 primer12AGGCCTTCTTGCACTGGTACGAGTTCACTGAGGCCGAGAG
Table 7. IT-ISJ primer sequences.
Primer Name5′→3′ SequencePrimer Name5′→3′ Sequence
Forward primerReverse primer
IT-ISJ01FGCATGCCAGGTAAGTAAA IT-ISJ24RGGAATTCCACCTGCACCT
IT-ISJ03FGCATGCCAGGTAAGTAAGIT-ISJ26RGGAATTCCACCTGCACGC
IT-ISJ04FGCATGCCAGGTAAGTAATIT-ISJ28RGGAATTCCACCTGCACGT
IT-ISJ05FGCATGCCAGGTAAGTACAIT-ISJ29RGGAATTCCACCTGCACTA
IT-ISJ06FGCATGCCAGGTAAGTACCIT-ISJ32R GGAATTCCACCTGCACTT
IT-ISJ07FGCATGCCAGGTAAGTACG IT-ISJ36RGGAATTCCACCTGCAGAT
Reverse primerIT-ISJ38RGGAATTCCACCTGCAGCC
IT-ISJ01RGGAATTCCACCTGCAAAA IT-ISJ40RGGAATTCCACCTGCAGCT
IT-ISJ03RGGAATTCCACCTGCAAAG IT-ISJ41RGGAATTCCACCTGCAGGA
IT-ISJ04RGGAATTCCACCTGCAAAT IT-ISJ42RGGAATTCCACCTGCAGGC
IT-ISJ05RGGAATTCCACCTGCAACAIT-ISJ44RGGAATTCCACCTGCAGGT
IT-ISJ06RGGAATTCCACCTGCAACC IT-ISJ47RGGAATTCCACCTGCAGTG
IT-ISJ07RGGAATTCCACCTGCAACG IT-ISJ50RGGAATTCCACCTGCATAC
IT-ISJ08RGGAATTCCACCTGCAACT IT-ISJ51RGGAATTCCACCTGCATAG
IT-ISJ11RGGAATTCCACCTGCAAGGIT-ISJ52RGGAATTCCACCTGCATAT
IT-ISJ12RGGAATTCCACCTGCAAGTIT-ISJ54RGGAATTCCACCTGCATCC
IT-ISJ13RGGAATTCCACCTGCAATAIT-ISJ58RGGAATTCCACCTGCATGC
IT-ISJ15RGGAATTCCACCTGCAATG IT-ISJ59RGGAATTCCACCTGCATGG
IT-ISJ20RGGAATTCCACCTGCACAT IT-ISJ63RGGAATTCCACCTGCATTG
IT-ISJ22RGGAATTCCACCTGCACCC IT-ISJ64RGGAATTCCACCTGCATTT
IT-ISJ23RGGAATTCCACCTGCACCG

