
Screening a Small Library of Xanthones for Antitumor Activity and Identification of a Hit Compound which Induces Apoptosis

 , , ,
, , ,  , and
, and
Abstract
:1. Introduction
2. Results and Discussion
2.1. Screening of a Small Library of Xanthones for Their Cell Growth Inhibitory Activity in Human Tumor Cell Lines Derived from Solid Tumors: Identification of TXA1 as a Hit Compound


| Thioxanthone Number | R | GI50 (µM) | ||
|---|---|---|---|---|
| MCF-7 | NCI-H460 | A375-C5 | ||
| 1 |  | 6.1 ± 0.4 | 6.0 ± 0.3 | 3.6 ± 1.2 |
| 2 |  | >150 | >150 | >150 |
| 3 |  | >150 | >150 | >150 |
| 4 |  | 15.0 ± 1.0 | 13.3 ± 0.7 | 13.3 ± 0.3 |
| 5 |  | >150 | >150 | >150 |
| 6 |  | 111 ± 11.7 | 73.0 ± 6.6 | 73.0 ± 5.5 |
| 7 |  | 33.0 ± 2.3 | 27.3 ± 2.7 | 33.0 ± 2.7 |
| 8 |  | >150 | >150 | >150 |
| 9 |  | 92.7 ± 2.6 | 89.7 ± 2.4 | 60.3 ± 1.8 |
| 10 |  | >150 | >150 | >150 |
| 11 |  | 85.0 ± 1 | 58.3 ± 7.2 | 81.7 ± 2.9 |
| 12 |  | 48.0 ± 3.1 | 38.7 ± 4.4 | 27.3 ± 5.3 |
| 13 |  | >150 | >150 | >150 |
| 14 |  | 34.0 ± 3.1 | 39.3 ± 6.4 | 24.3 ± 3.3 |
| 15 |  | 65.7 ± 1.5 | 59.3 ± 7.9 | 55.0 ± 1.5 |
| 16 |  | 28.3 ± 2.9 | 22.7 ± 2.5 | 20.0 ± 2.1 |
| 17 |  | >150 | >150 | >150 |
| 18 |  | >150 | >150 | >150 |
| 19 |  | 70.8 ± 6.9 | 61.3 ± 4.1 | 54.8 ± 9.4 |
| 20 |  | 34.3 ± 3.0 | 35.0 ± 5.2 | 34.0 ± 4.0 |
| 21 |  | >150 | >150 | >150 |
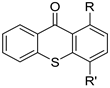 | ||||
| 22 | R = OCH3, R’ = OH | >150 | >150 | >150 |
| 23 | R=OCH3, R’ = OCH2CH2CH3 | >150 | >150 | >150 |
| 24 | R = Cl, R’ = OH | 23.3 ± 1.5 | 21 ± 0.5 | 15.3 ± 0.9 |
| 25 | R = Cl, R’ = OAc | 9.4 ± 0.2 | 8.7 ± 0.2 | 8.2 ± 0.3 |
| 26 |  | 24.3 ± 2.9 | 23.0 ± 2.5 | 34.3 ± 1.9 |
| 27 | R = H, R’ = OH | 39.0 ± 3.6 | 28.7 ± 2.2 | 34.0 ± 6.5 |
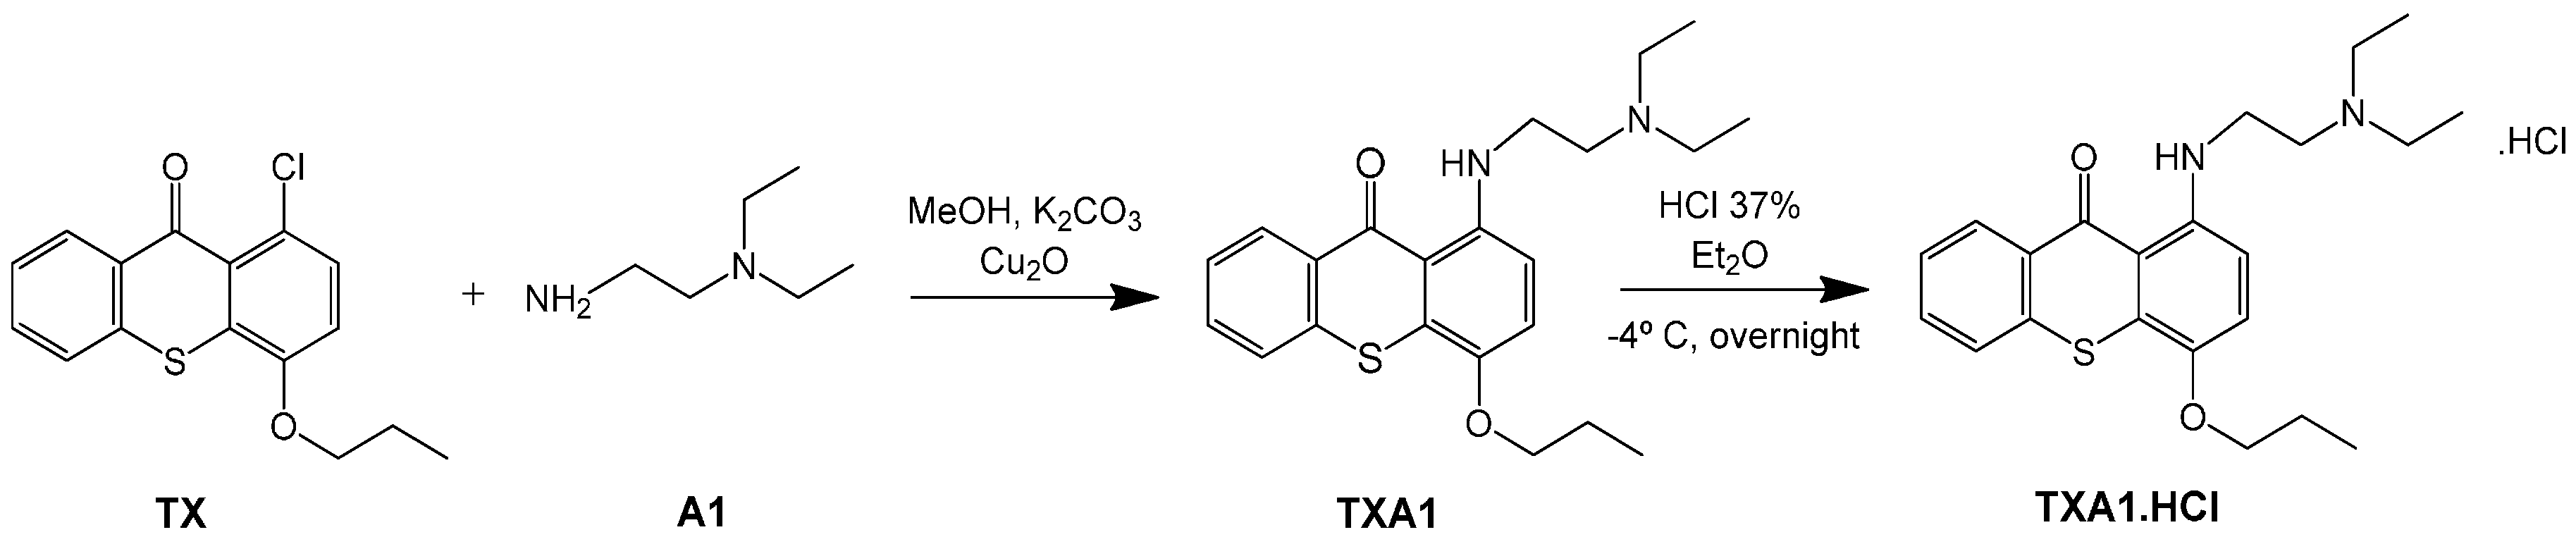
2.2. Synthesis of TXA1·HCl

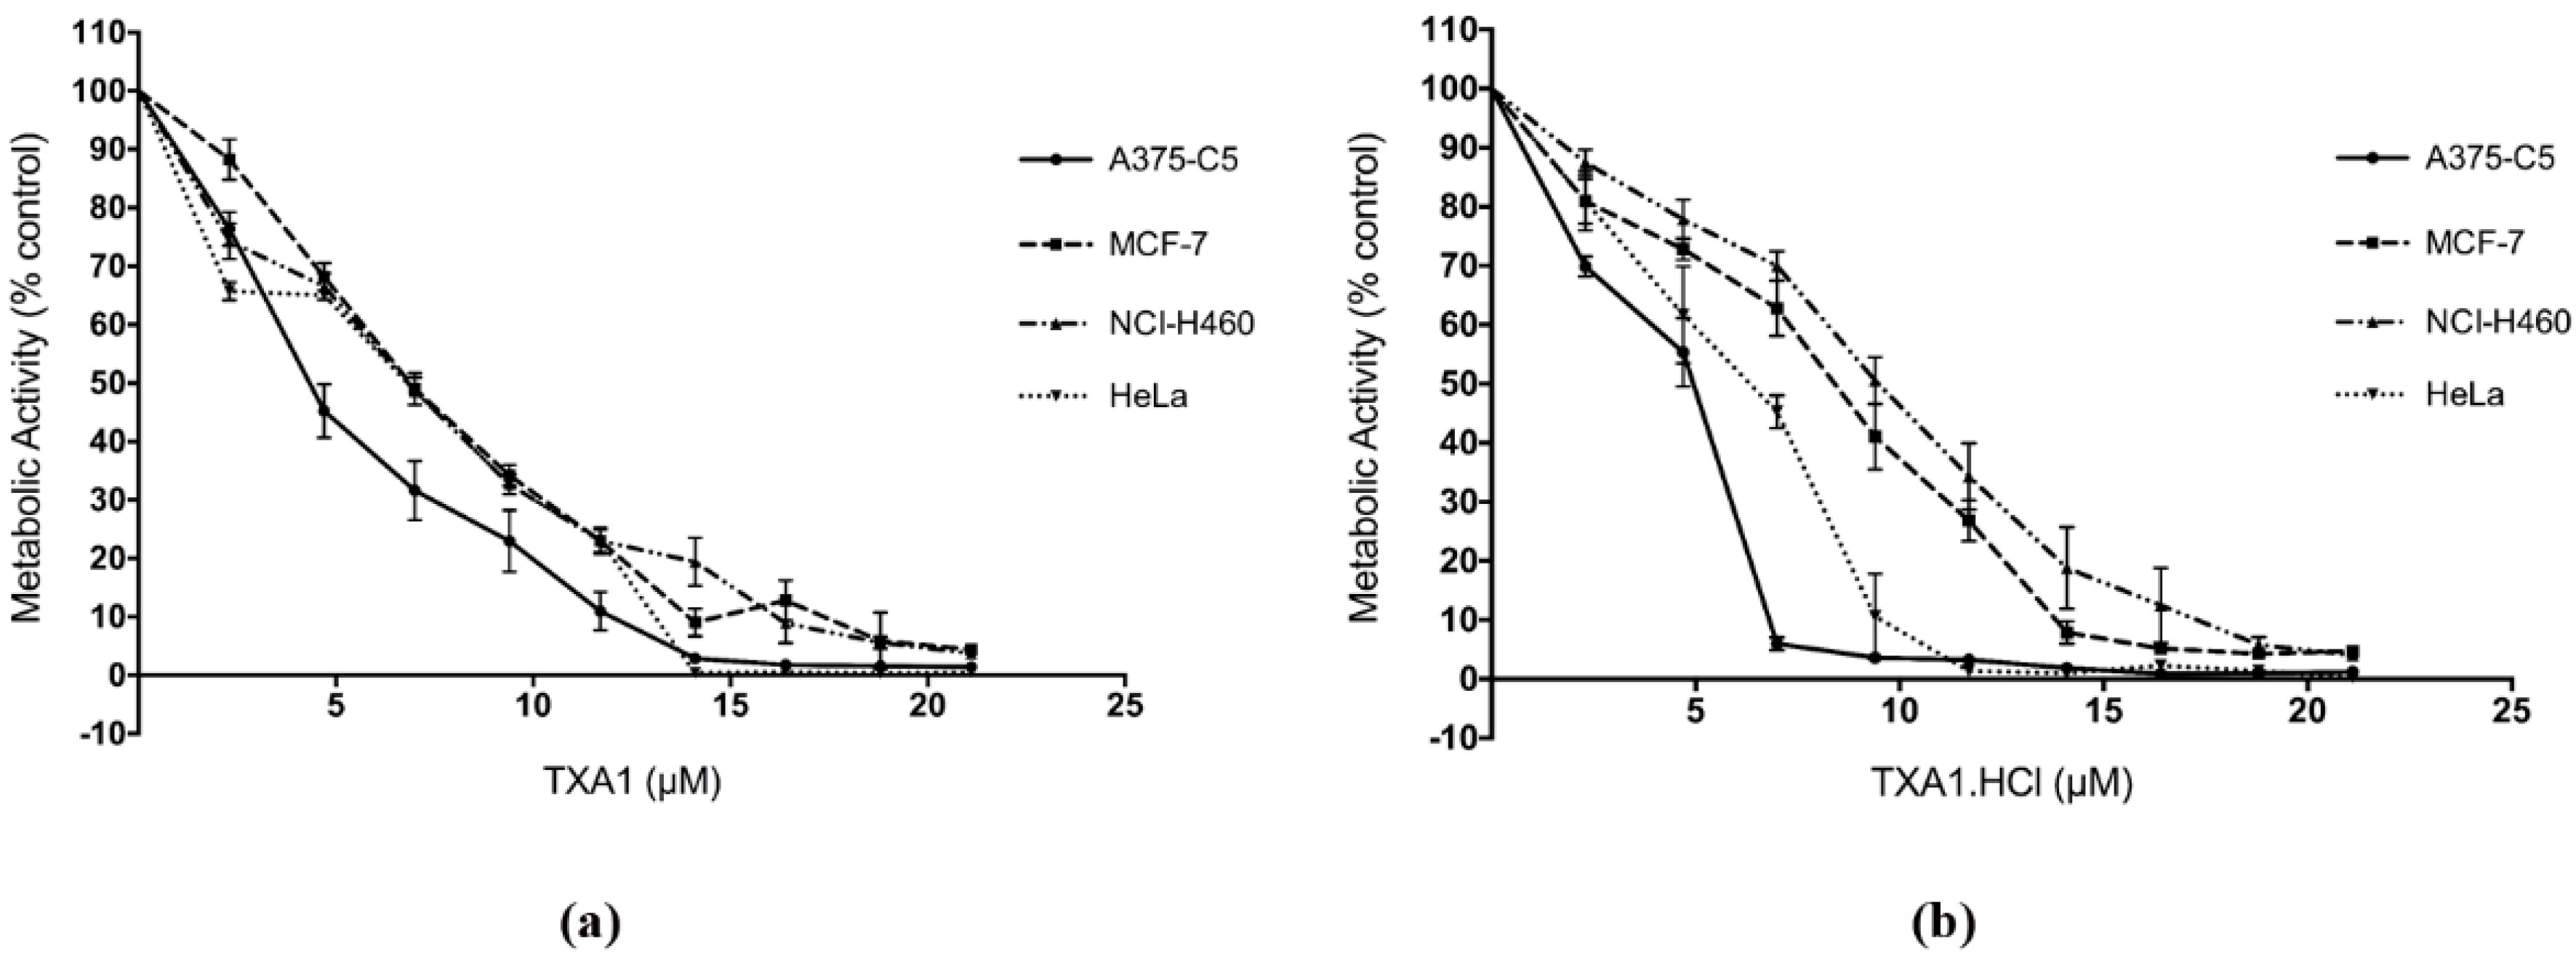
2.3. TXA1 and TXA1·HCl Inhibit Cell Growth of a Larger Panel of Human Tumor Cell Lines Derived from Solid Tumors
| Compound | GI50 (µM) | ||||||
|---|---|---|---|---|---|---|---|
| MCF-7 | NCI-H460 | A375-C5 | HeLa | 786-O | Caki-2 | AGS | |
| TXA1 | 6.1 ± 0.4 # | 6.0 ± 0.3 # | 3.6 ± 1.2 # | 6.8 ± 0.5 | 8.1 ± 1.8 | 11.5 ± 1.8 | 35.3 ± 2.3 |
| TXA1·HCl | 7.8 ± 0.9 | 6.9 ± 1.3 | 3.8 ± 0.8 | 6.4 ± 0.6 | 9.0 ± 1.1 | 9.3 ± 0.8 | 9.7 ± 0.2 |
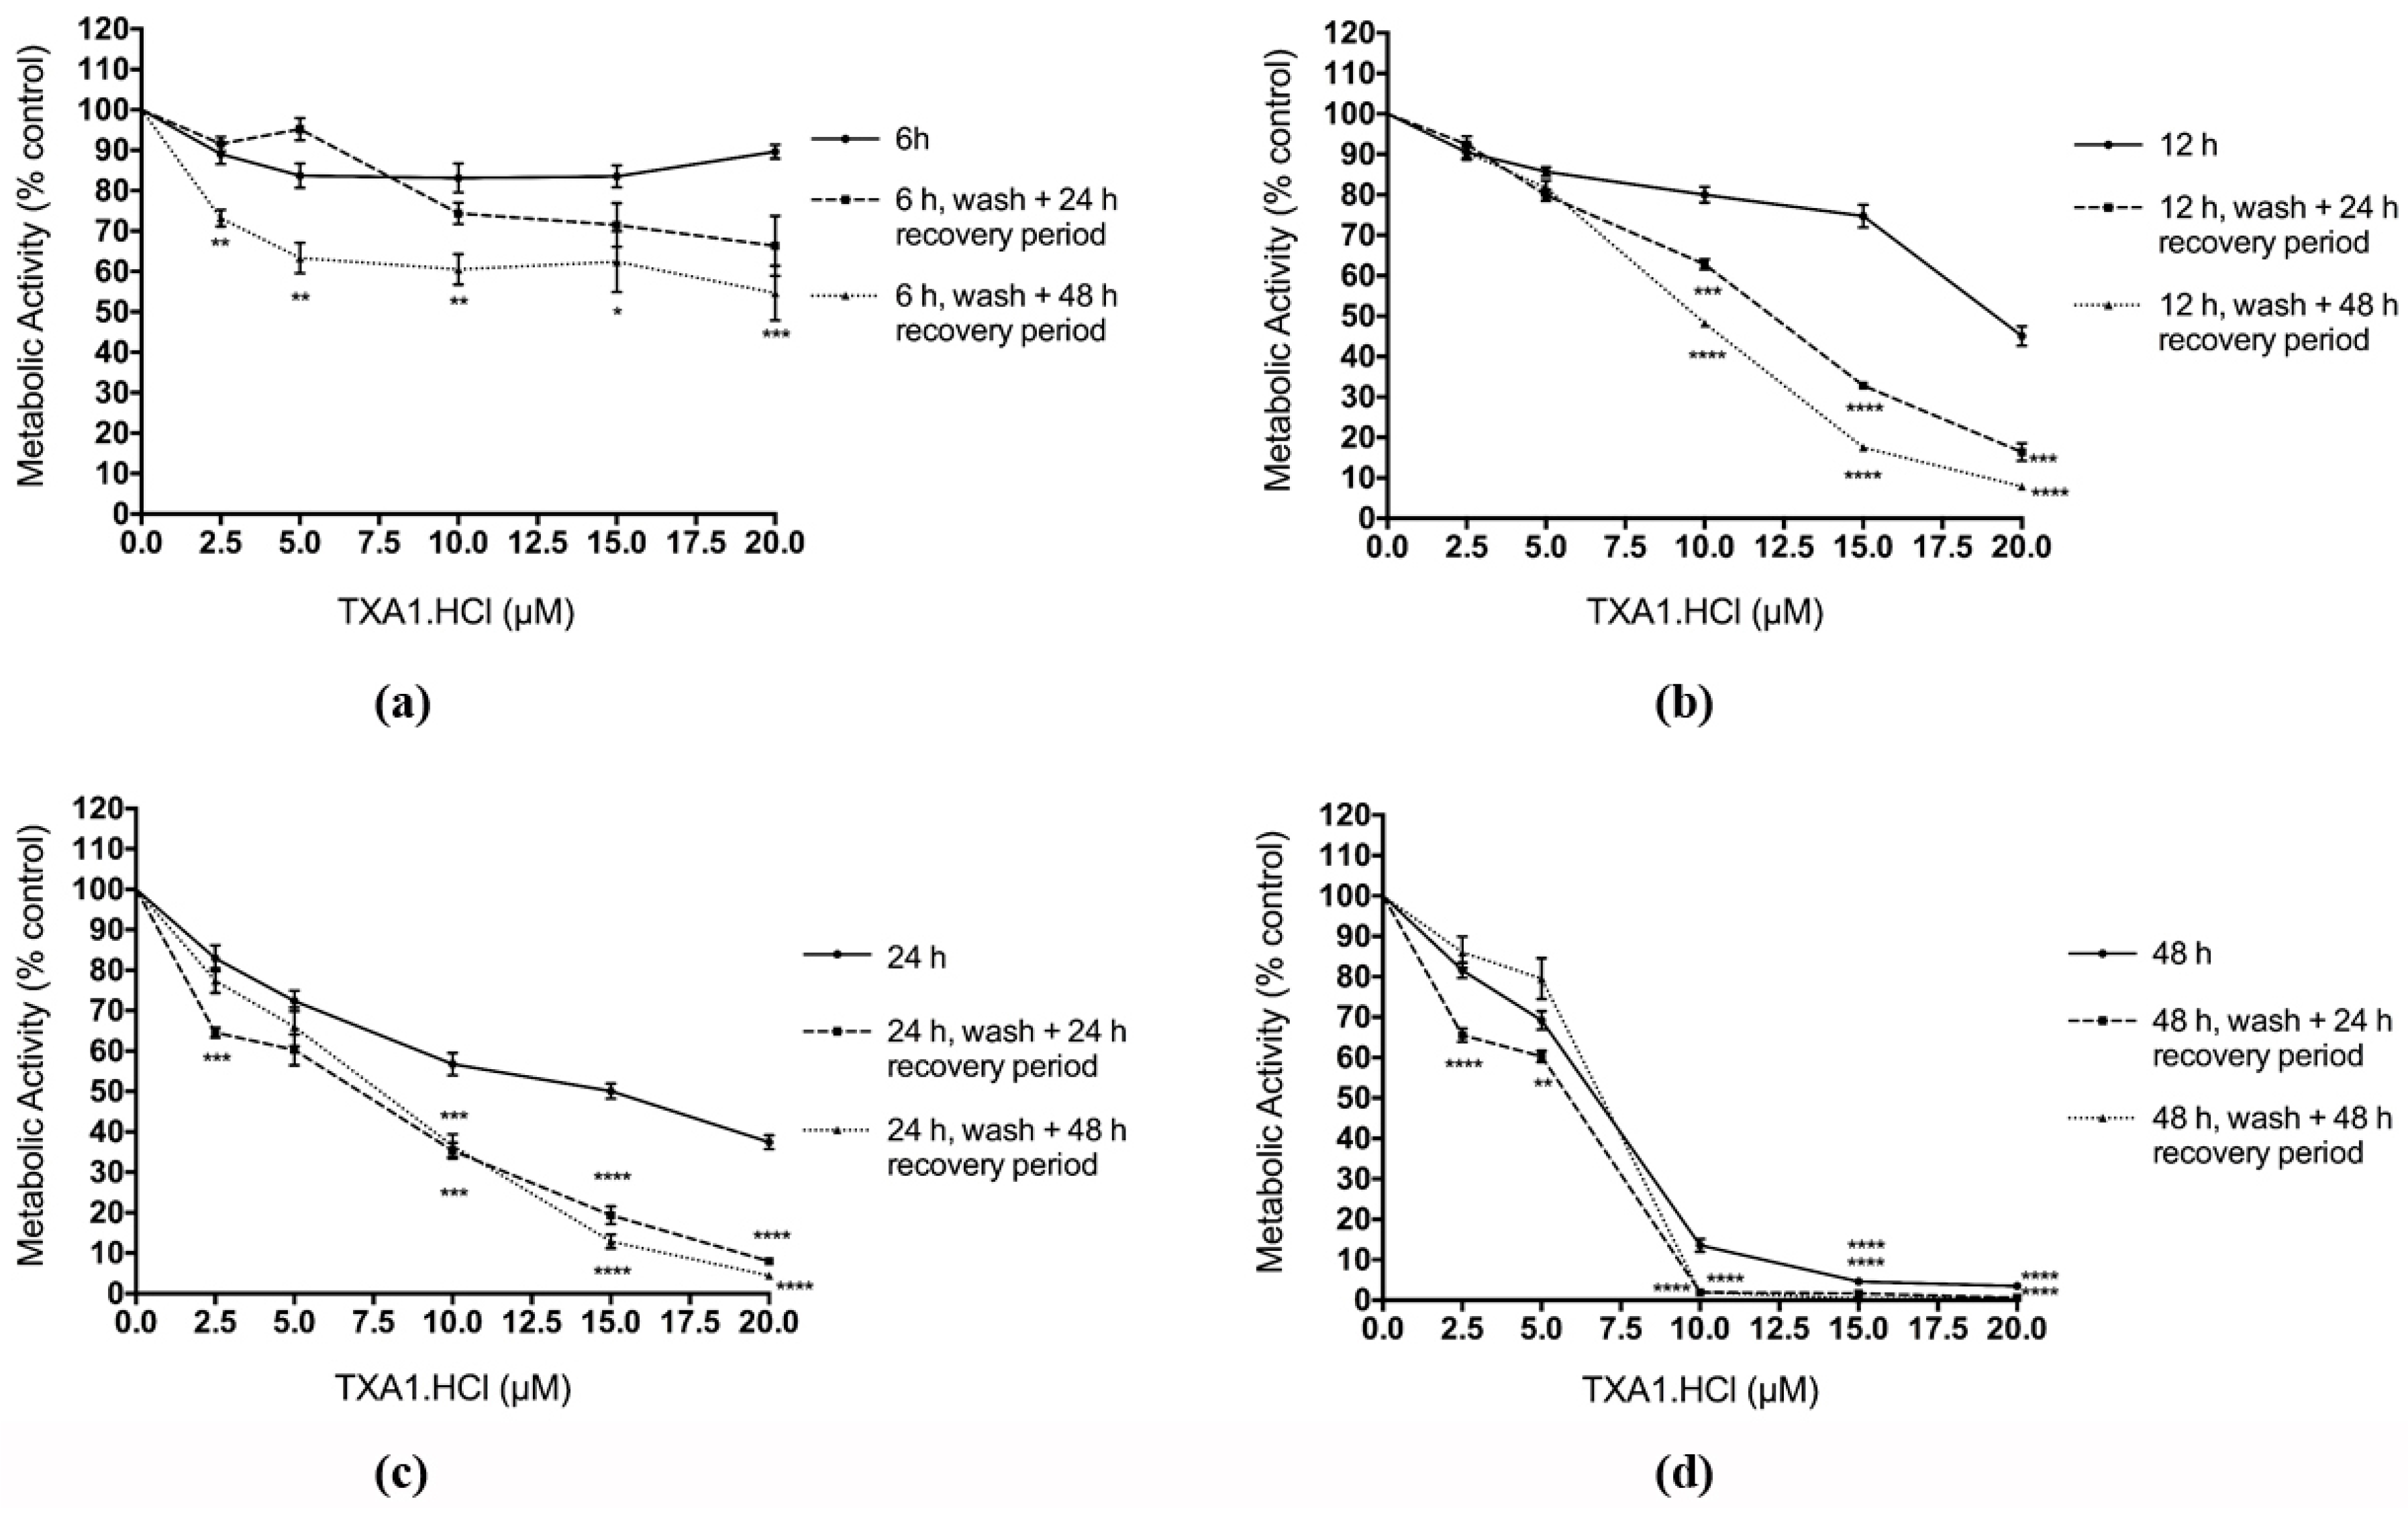
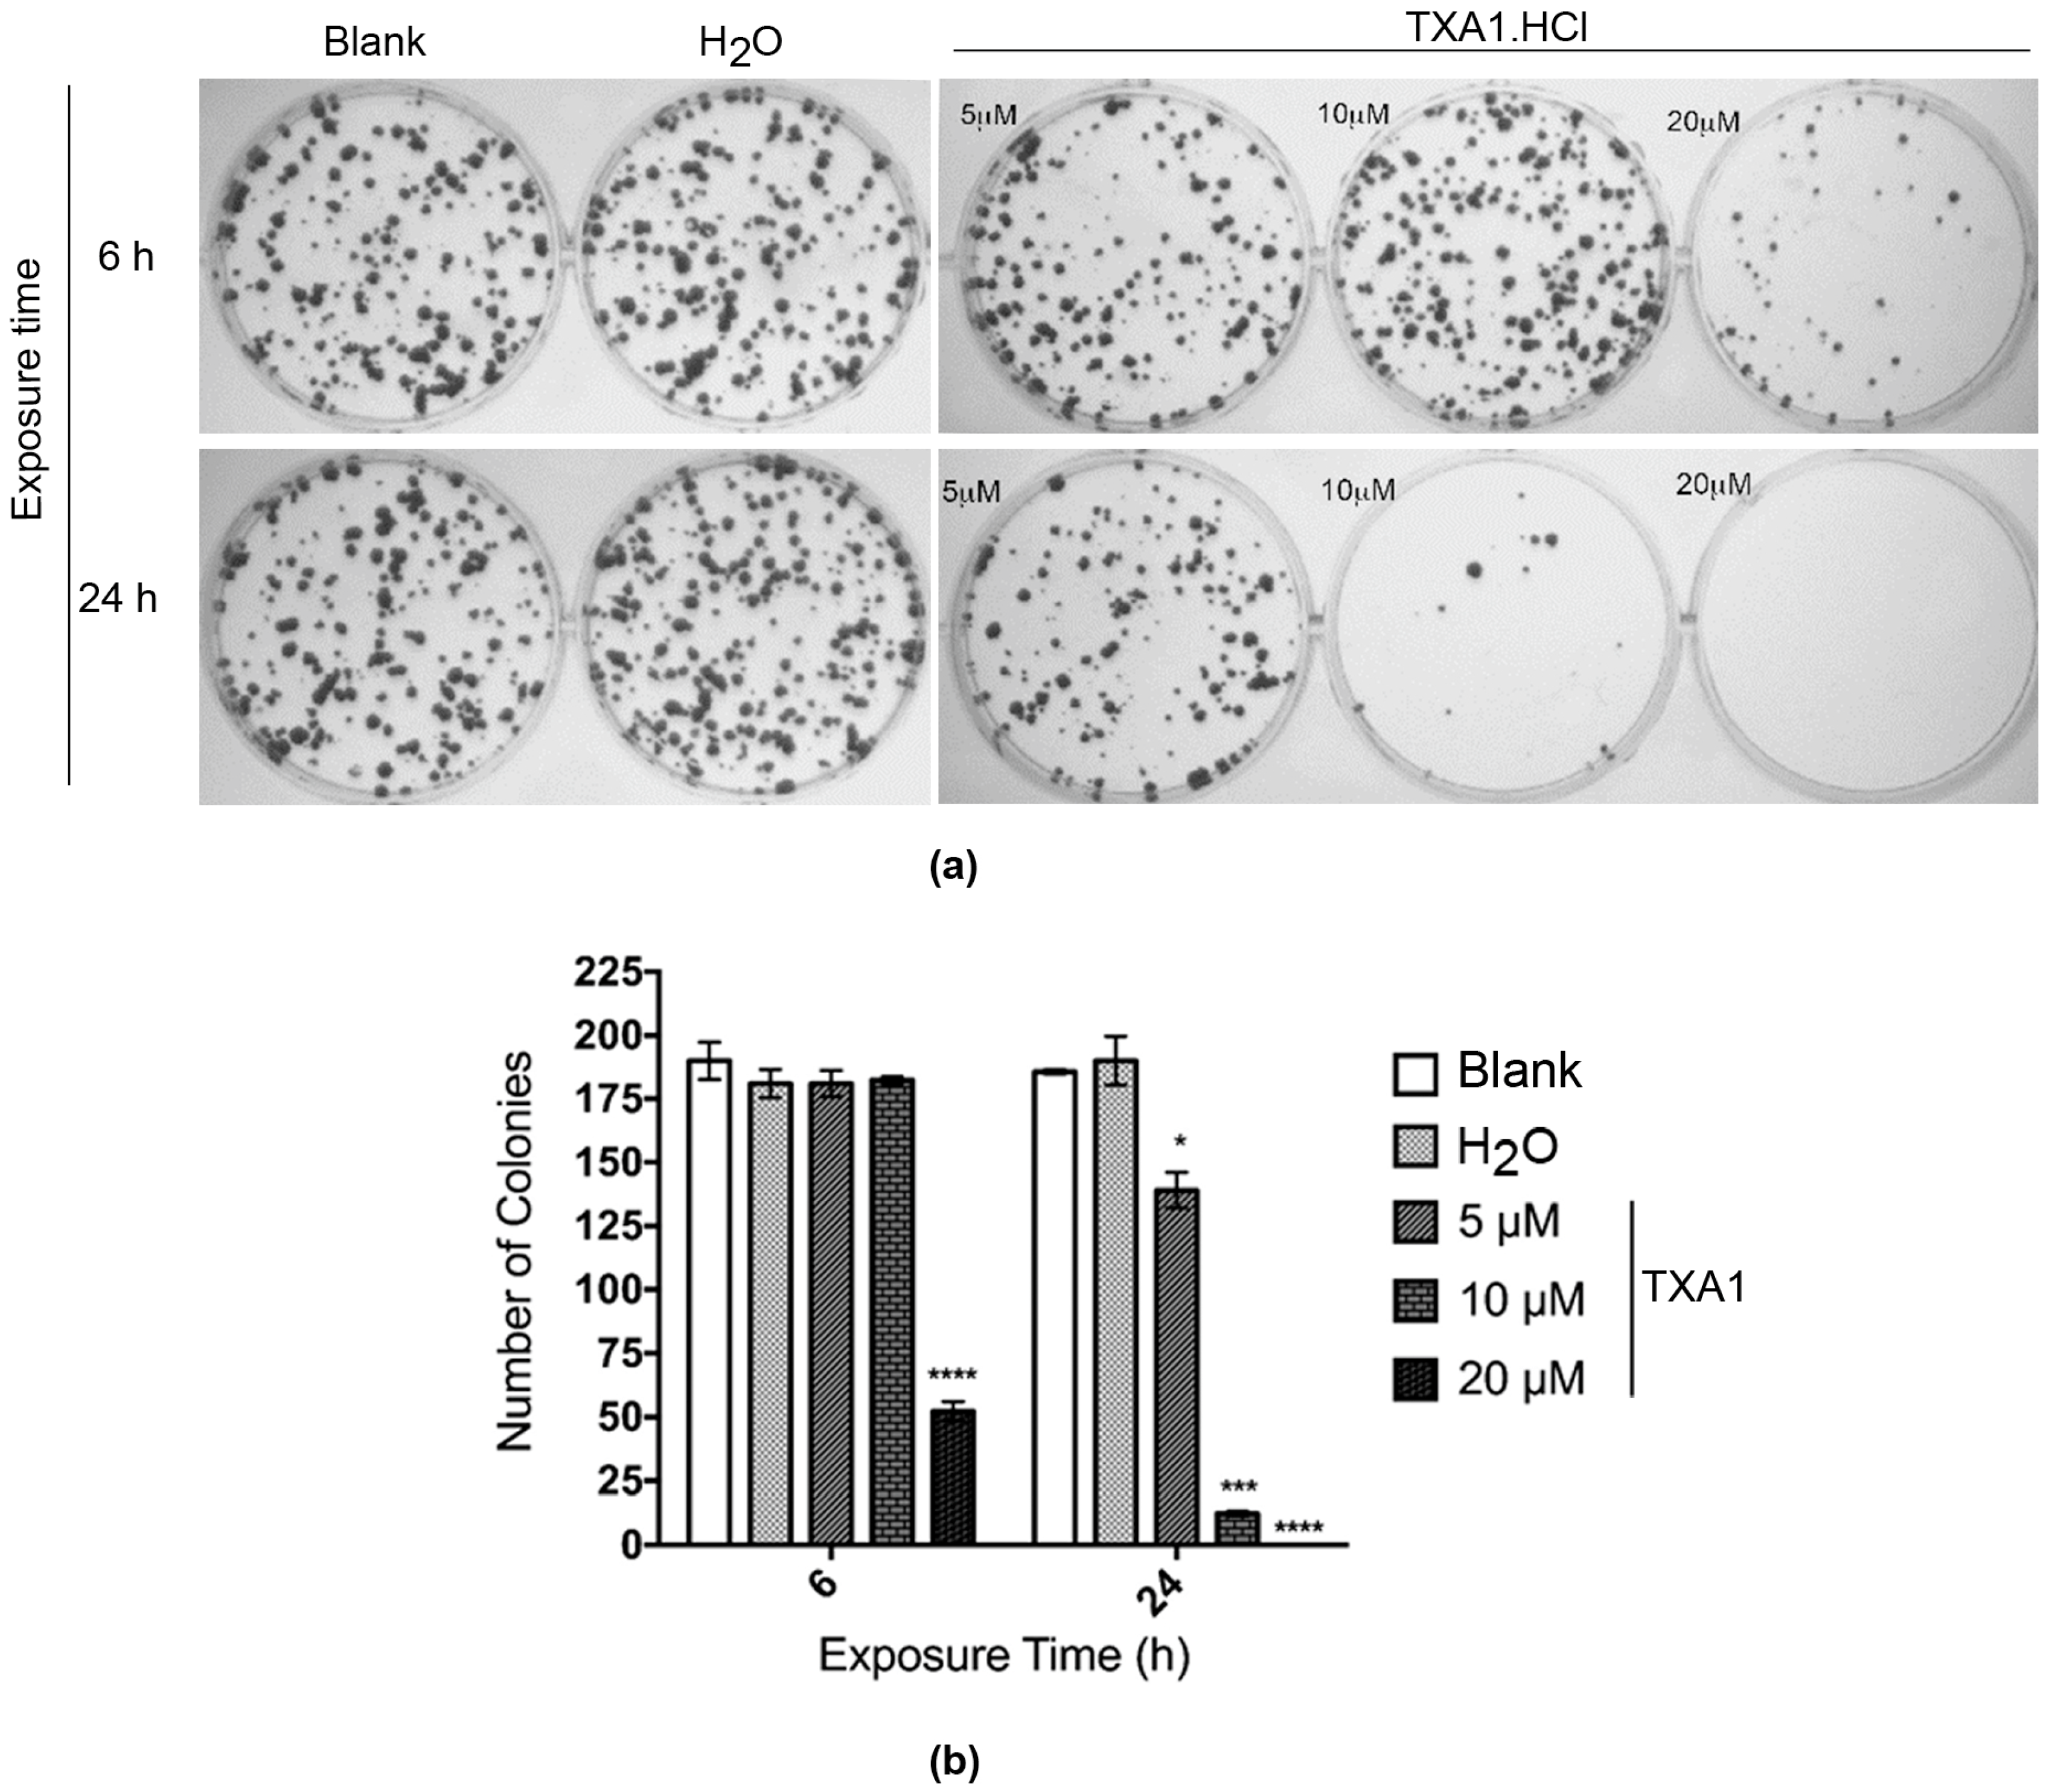
2.4. The Effect of TXA1·HCl in MCF-7 Cells is Irreversible

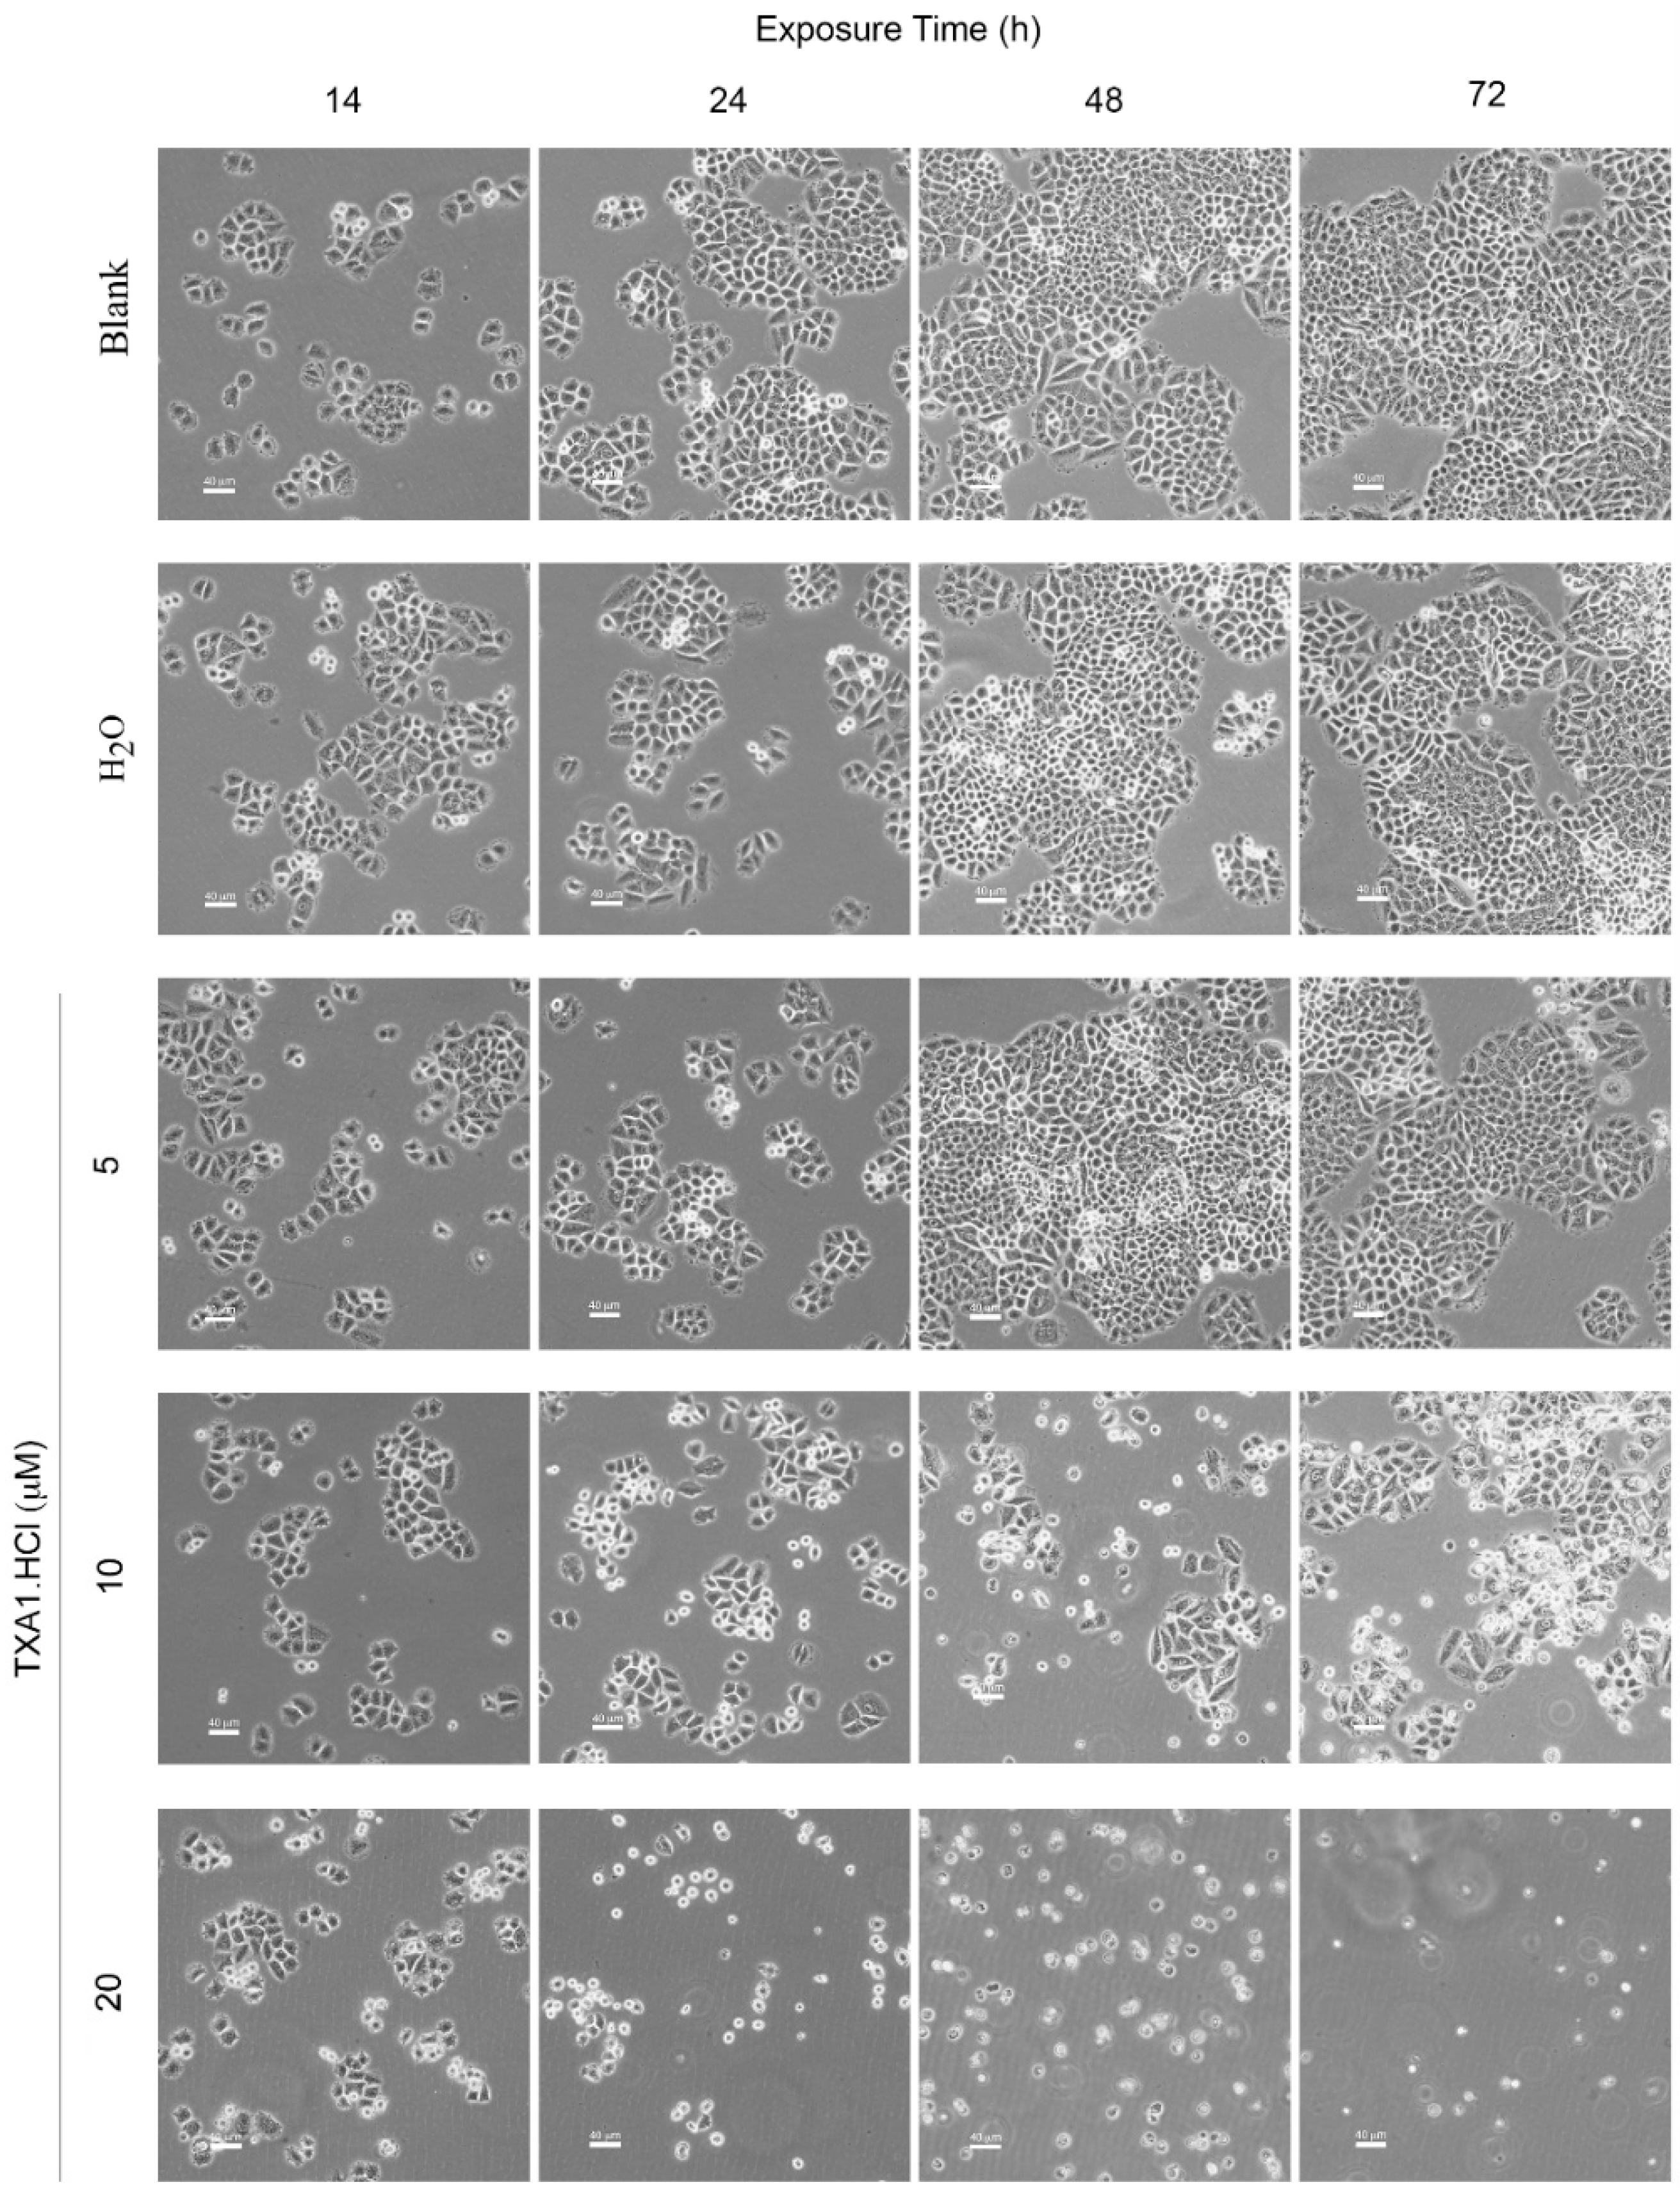
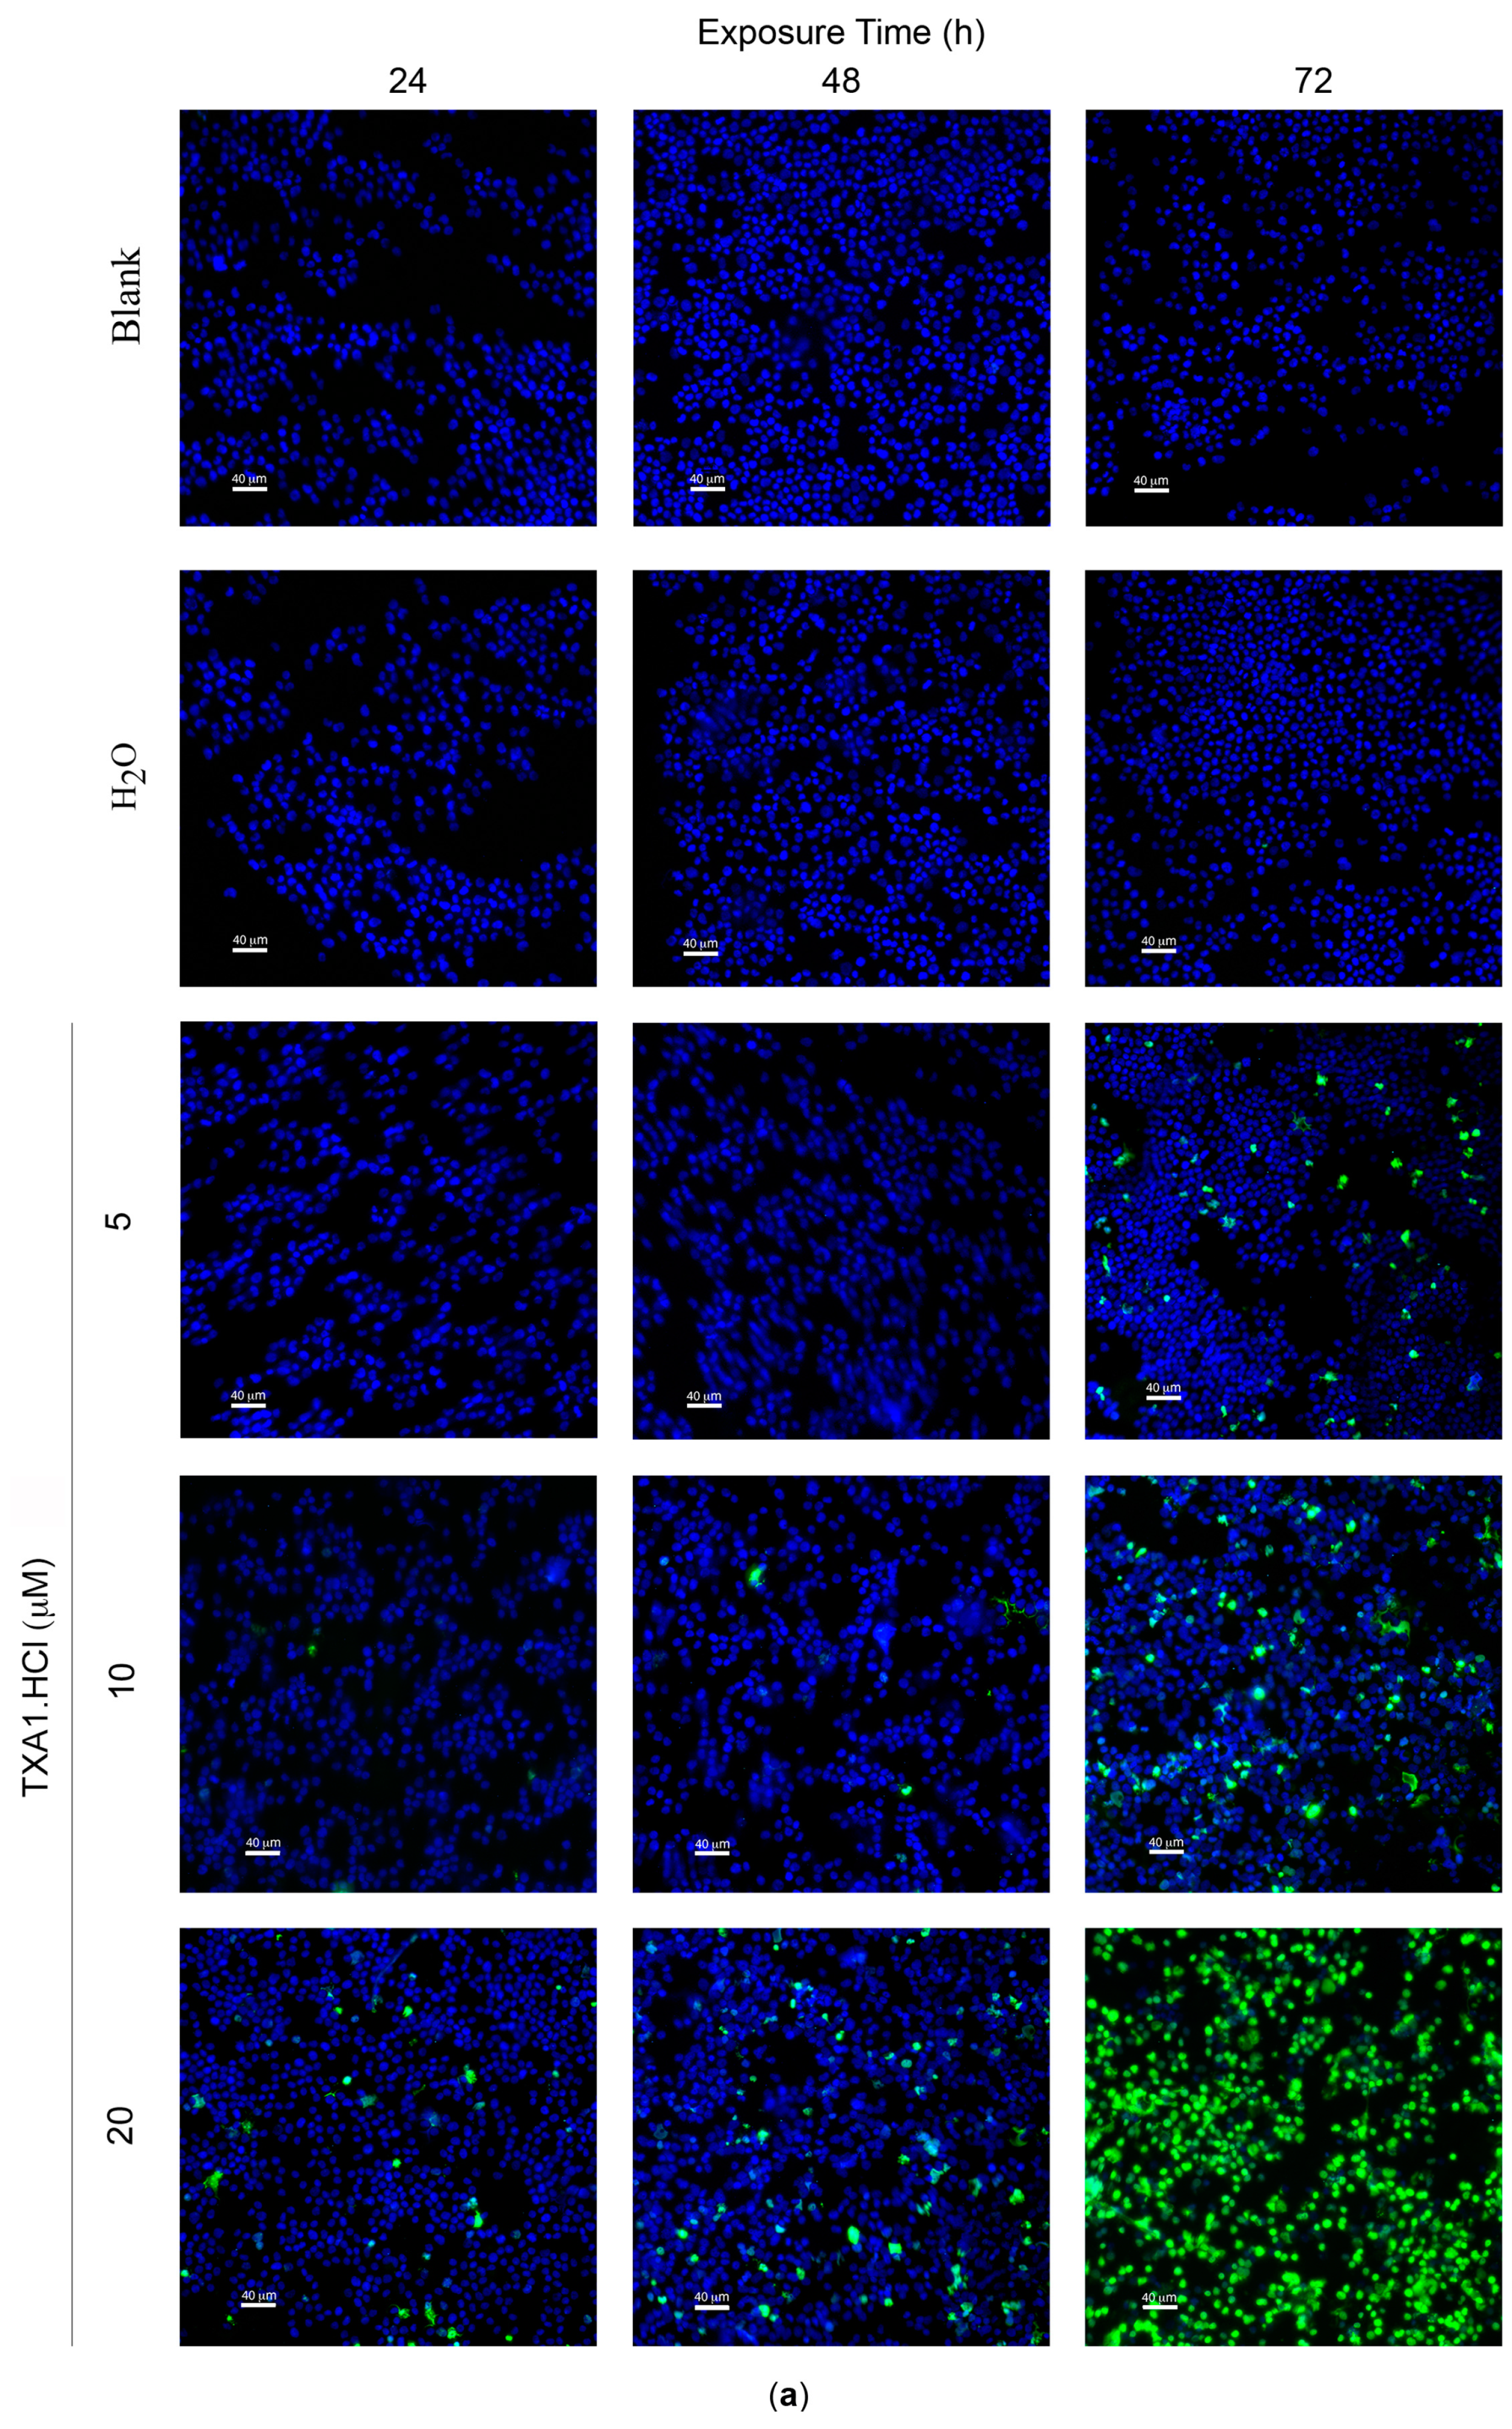
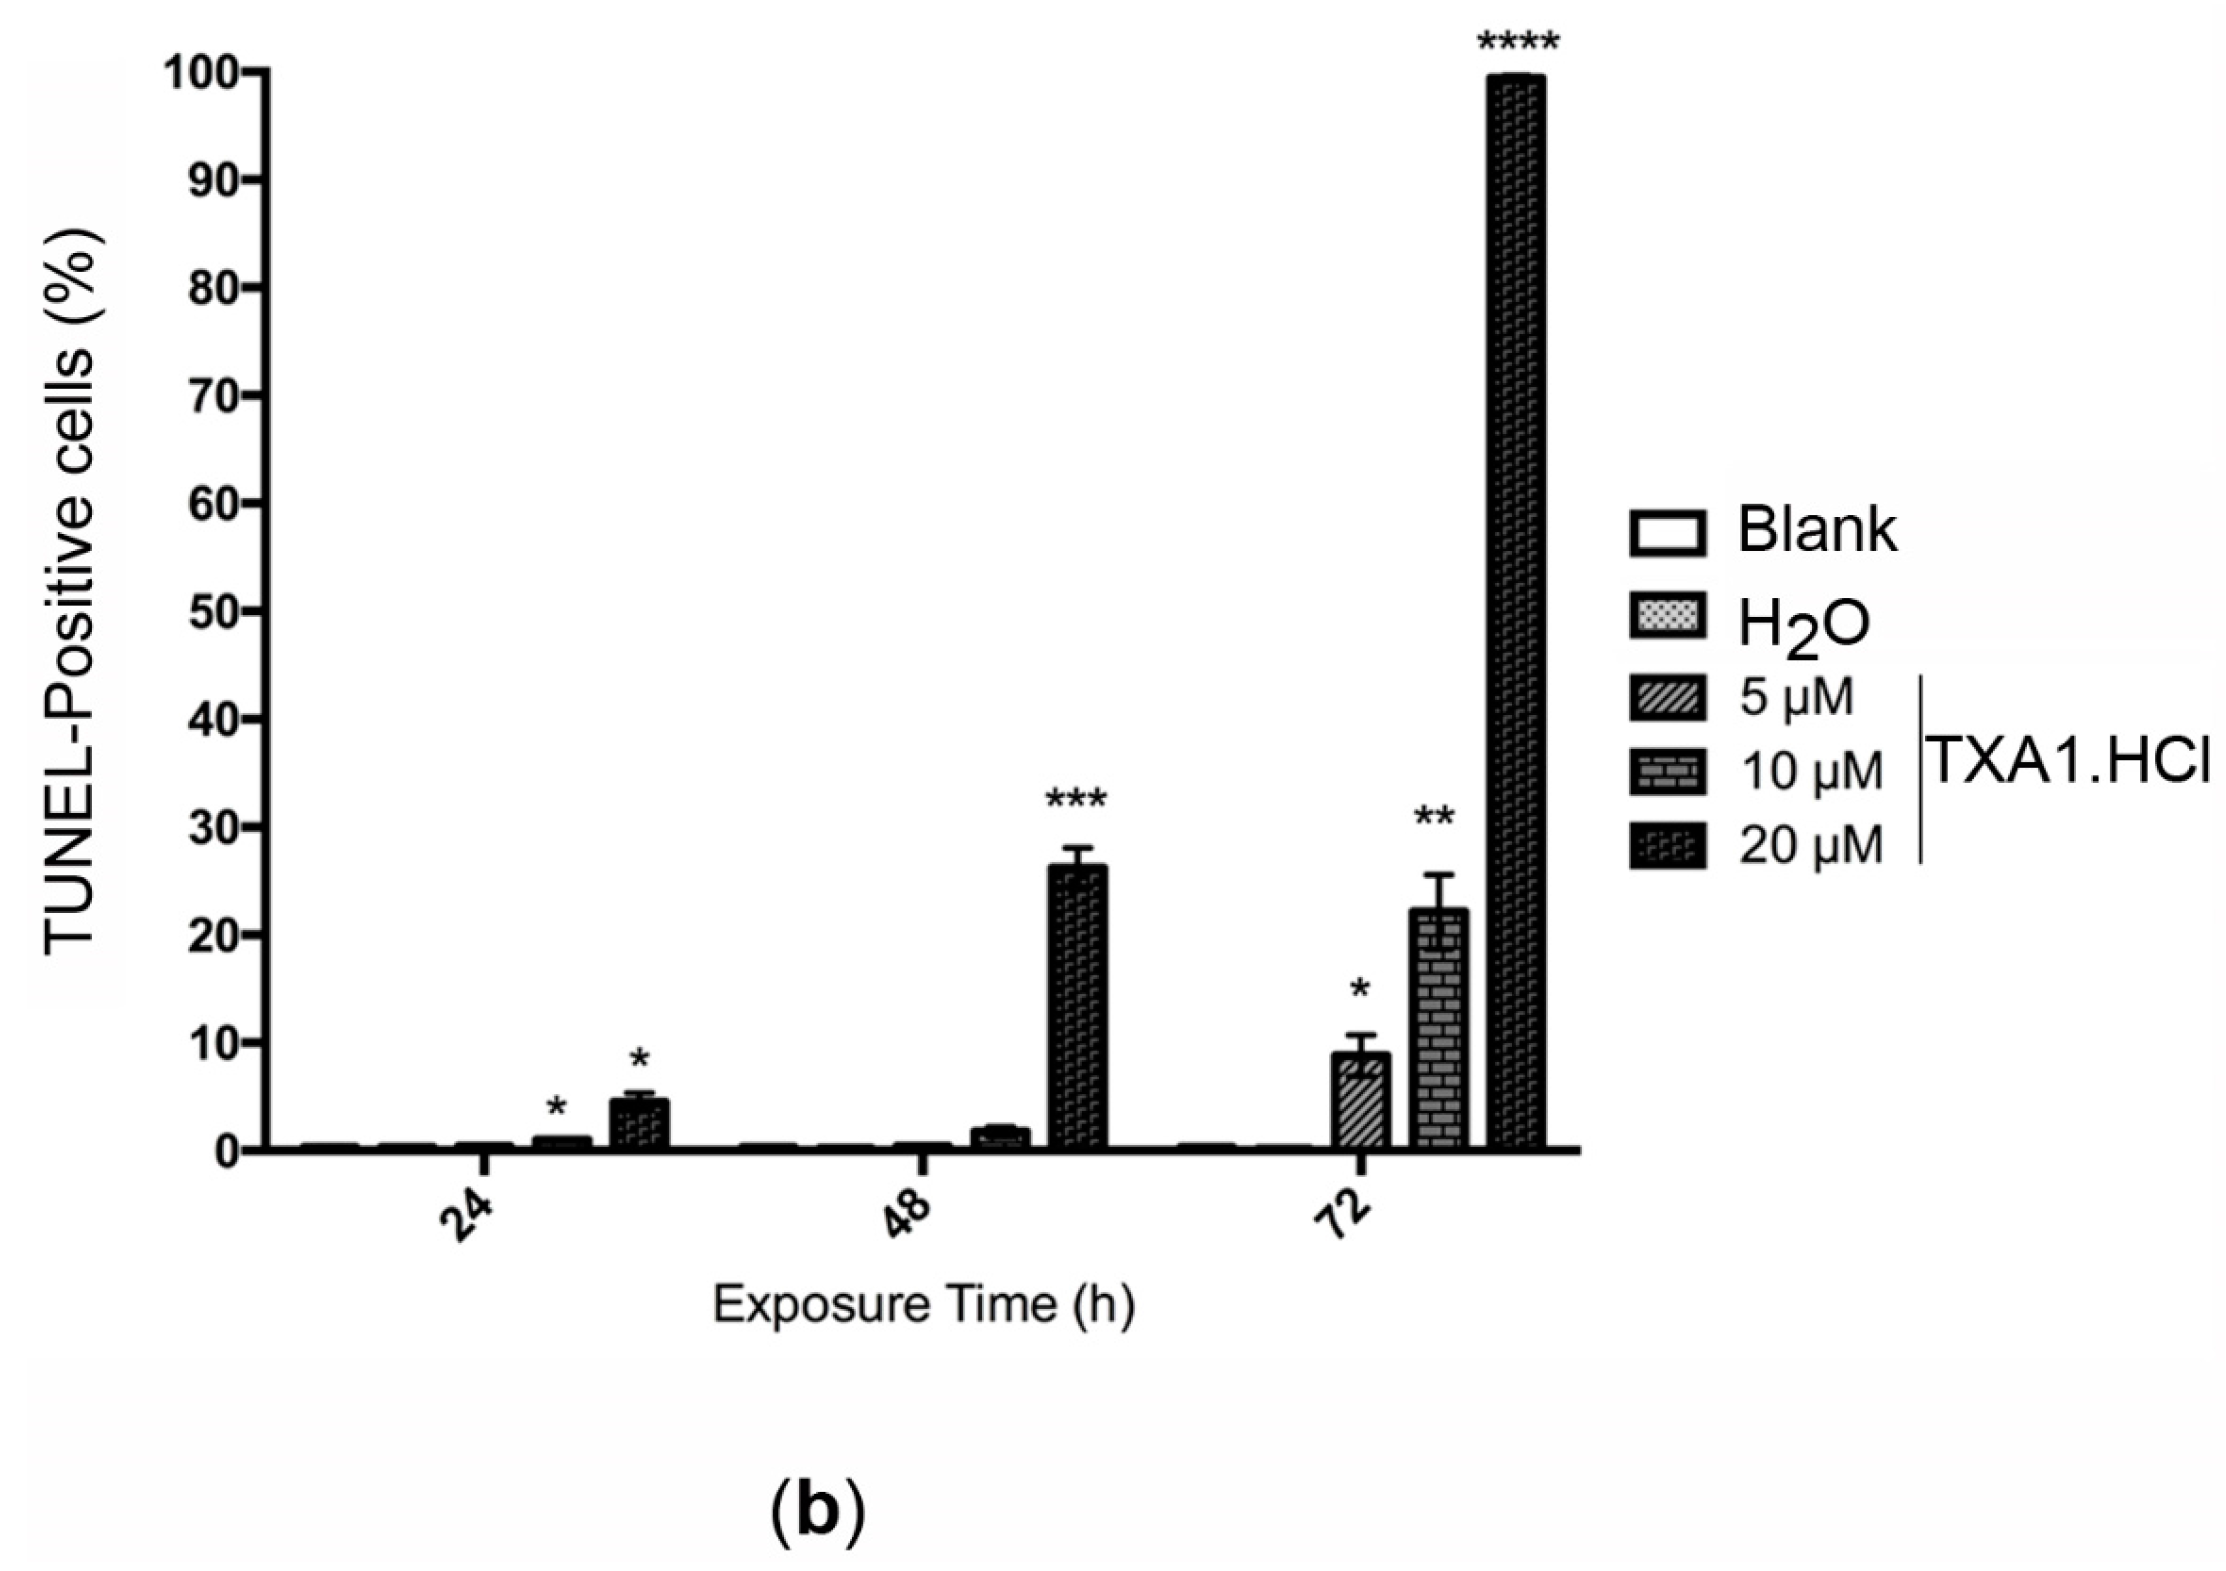
2.5. TXA1·HCl Induces Cell Death in MCF-7 Cells


| Treatment | Apoptotic Cells (%) | |
|---|---|---|
| Blank | 11.0 ± 0.6 | |
| H2O | 10.1 ± 1.4 | |
| TXA1·HCl | 5 μM | 13.7 ± 0.4 |
| 10 μM | 51.5 ± 5.0 * | |
3. Experimental Section
3.1. General Information
3.2. Compound Synthesis
3.3. Multimilligram Synthesis of TXA1
3.4. Synthesis of TXA1 Hydrochloride (TXA1·HCl)
3.5. Cell Culture
3.6. In Vitro Screening for Tumor Cell Growth Inhibition with the Sulforhodamine B Assay
3.7. Confirmation of the Activity of the Hit Compounds (TXA1 and TXA·HCl) with the 3-(4,5-Dimethyl-thiazolyl-2)-2,5-diphenyltetrazolium Bromide (MTT) Assay
3.8. Reversibility Analysis of the Effect of the Hit Compound, with the MTT Assay and the Colony Forming Assay
3.9. Study of the Effect of the Hit Compound on Cell Death
3.10. Statistical Analysis
4. Conclusions
Supplementary Materials
Acknowledgments
Author Contributions
Conflicts of Interest
References
- Hawking, F.; Ross, W.F. Miracil D, its toxicology, absorption, and excretion in animals and human volunteers. Br. J. Pharmacol. Chemother. 1948, 3, 167–173. [Google Scholar] [CrossRef] [PubMed]
- Paiva, A.M.; Pinto, M.M.; Sousa, E. A century of thioxanthones: Through synthesis and biological applications. Curr. Med. Chem. 2013, 20, 2438–2457. [Google Scholar] [CrossRef] [PubMed]
- Naidu, M.D.; Agarwal, R.; Pena, L.A.; Cunha, L.; Mezei, M.; Shen, M.; Wilson, D.M., III; Liu, Y.; Sanchez, Z.; Chaudhary, P.; et al. Lucanthone and its derivative hycanthone inhibit apurinic endonuclease-1 (APE1) by direct protein binding. PLoS ONE 2011, 6, e23679. [Google Scholar] [CrossRef] [PubMed]
- Palmeira, A.; Vasconcelos, M.H.; Paiva, A.; Fernandes, M.X.; Pinto, M.; Sousa, E. Dual inhibitors of P-glycoprotein and tumor cell growth: (Re)discovering thioxanthones. Biochem. Pharmacol. 2012, 83, 57–68. [Google Scholar] [CrossRef] [PubMed]
- LoRusso, P.M.; Foster, B.J.; Wozniak, A.; Heilbrun, L.K.; McCormick, J.I.; Ruble, P.E.; Graham, M.A.; Purvis, J.; Rake, J.; Drozd, M.; et al. Phase I pharmacokinetic study of the novel antitumor agent SR233377. Clin. Cancer Res. 2000, 6, 3088–3094. [Google Scholar] [PubMed]
- Goncalves, P.H.; High, F.; Juniewicz, P.; Shackleton, G.; Li, J.; Boerner, S.; LoRusso, P.M. Phase I dose-escalation study of the thioxanthone SR271425 administered intravenously once every 3 weeks in patients with advanced malignancies. Investig. New Drugs 2008, 26, 347–354. [Google Scholar] [CrossRef] [PubMed]
- Stevenson, J.P.; DeMaria, D.; Reilly, D.; Purvis, J.D.; Graham, M.A.; Lockwood, G.; Drozd, M.; O’Dwyer, P.J. Phase I/pharmacokinetic trial of the novel thioxanthone SR233377 (WIN33377) on a 5-day schedule. Cancer Chemother. Pharmacol. 1999, 44, 228–234. [Google Scholar] [CrossRef] [PubMed]
- Vichai, V.; Kirtikara, K. Sulforhodamine B colorimetric assay for cytotoxicity screening. Nat. Protoc. 2006, 1, 1112–1116. [Google Scholar] [CrossRef] [PubMed]
- Johnson, J.J.; Petiwala, S.M.; Syed, D.N.; Rasmussen, J.T.; Adhami, V.M.; Siddiqui, I.A.; Kohl, A.M.; Mukhtar, H. alpha-Mangostin, a xanthone from mangosteen fruit, promotes cell cycle arrest in prostate cancer and decreases xenograft tumor growth. Carcinogenesis 2012, 33, 413–419. [Google Scholar] [CrossRef] [PubMed]
- Chen, H.B.; Zhou, L.Z.; Mei, L.; Shi, X.J.; Wang, X.S.; Li, Q.L.; Huang, L. Gambogenic acid-induced time- and dose-dependent growth inhibition and apoptosis involving Akt pathway inactivation in U251 glioblastoma cells. J. Nat. Med. 2012, 66, 62–69. [Google Scholar] [CrossRef] [PubMed]
- Chang, H.F.; Yang, L.L. Gamma-mangostin, a micronutrient of mangosteen fruit, induces apoptosis in human colon cancer cells. Molecules 2012, 17, 8010–8021. [Google Scholar] [CrossRef] [PubMed]
- Kurose, H.; Shibata, M.A.; Iinuma, M.; Otsuki, Y. Alterations in cell cycle and induction of apoptotic cell death in breast cancer cells treated with alpha-mangostin extracted from mangosteen pericarp. J. Biomed. Biotechnol. 2012, 2012, 672428. [Google Scholar] [CrossRef] [PubMed]
- Mohan, S.; Abdelwahab, S.I.; Kamalidehghan, B.; Syam, S.; May, K.S.; Harmal, N.S.; Shafifiyaz, N.; Hadi, A.H.; Hashim, N.M.; Rahmani, M.; et al. Involvement of NF-kappaB and Bcl2/Bax signaling pathways in the apoptosis of MCF7 cells induced by a xanthone compound Pyranocycloartobiloxanthone A. Phytomedicine 2012, 19, 1007–1015. [Google Scholar] [CrossRef] [PubMed]
- Fu, W.M.; Zhang, J.F.; Wang, H.; Xi, Z.C.; Wang, W.M.; Zhuang, P.; Zhu, X.; Chen, S.C.; Chan, T.M.; Leung, K.S.; et al. Heat shock protein 27 mediates the effect of 1,3,5-trihydroxy-13,13-dimethyl-2H-pyran[7,6-b]xanthone on mitochondrial apoptosis in hepatocellular carcinoma. J. Proteom. 2012, 75, 4833–4843. [Google Scholar] [CrossRef] [PubMed]
- Elmore, S. Apoptosis: A review of programmed cell death. Toxicol. Pathol. 2007, 35, 495–516. [Google Scholar] [CrossRef] [PubMed]
- Vermes, I.; Haanen, C.; Steffens-Nakken, H.; Reutelingsperger, C. A novel assay for apoptosis. Flow cytometric detection of phosphatidylserine expression on early apoptotic cells using fluorescein labelled Annexin V. J. Immunol. Methods 1995, 184, 39–51. [Google Scholar] [CrossRef]
- Van Engeland, M.; Ramaekers, F.C.; Schutte, B.; Reutelingsperger, C.P. A novel assay to measure loss of plasma membrane asymmetry during apoptosis of adherent cells in culture. Cytometry 1996, 24, 131–139. [Google Scholar] [CrossRef]
- Kylarova, D.; Prochazkova, J.; Mad’arova, J.; Bartos, J.; Lichnovsky, V. Comparison of the TUNEL, lamin B and annexin V methods for the detection of apoptosis by flow cytometry. Acta Histochem. 2002, 104, 367–370. [Google Scholar] [CrossRef] [PubMed]
- Skehan, P.; Storeng, R.; Scudiero, D.; Monks, A.; McMahon, J.; Vistica, D.; Warren, J.T.; Bokesch, H.; Kenney, S.; Boyd, M.R. New colorimetric cytotoxicity assay for anticancer-drug screening. J. Natl. Cancer Inst. 1990, 82, 1107–1112. [Google Scholar] [CrossRef] [PubMed]
- Neves, M.P.; Cidade, H.; Pinto, M.; Silva, A.M.; Gales, L.; Damas, A.M.; Lima, R.T.; Vasconcelos, M.H.; de Sao Jose Nascimento, M. Prenylated derivatives of baicalein and 3,7-dihydroxyflavone: Synthesis and study of their effects on tumor cell lines growth, cell cycle and apoptosis. Eur. J. Med. Chem. 2011, 46, 2562–2574. [Google Scholar] [CrossRef] [PubMed]
- Lima, R.T.; Martins, L.M.; Guimaraes, J.E.; Sambade, C.; Vasconcelos, M.H. Chemosensitization effects of XIAP downregulation in K562 leukemia cells. J. Chemother. 2006, 18, 98–102. [Google Scholar] [CrossRef] [PubMed]
- Queiroz, M.J.; Calhelha, R.C.; Vale-Silva, L.A.; Pinto, E.; Almeida, G.M.; Vasconcelos, M.H. Synthesis and evaluation of tumor cell growth inhibition of methyl 3-amino-6-[(hetero)arylethynyl]thieno[3,2-b]pyridine-2-carboxylates. Structure-activity relationships, effects on the cell cycle and apoptosis. Eur. J. Med. Chem. 2011, 46, 236–240. [Google Scholar] [CrossRef] [PubMed] [Green Version]
- Sample Availability: Samples of the compounds 1–27 and of TXA1·HCl are available from the authors.
© 2016 by the authors. Licensee MDPI, Basel, Switzerland. This article is an open access article distributed under the terms and conditions of the Creative Commons by Attribution (CC-BY) license ( http://creativecommons.org/licenses/by/4.0/).
Share and Cite
Barbosa, J.; Lima, R.T.; Sousa, D.; Gomes, A.S.; Palmeira, A.; Seca, H.; Choosang, K.; Pakkong, P.; Bousbaa, H.; Pinto, M.M.; et al. Screening a Small Library of Xanthones for Antitumor Activity and Identification of a Hit Compound which Induces Apoptosis. Molecules 2016, 21, 81. https://doi.org/10.3390/molecules21010081
Barbosa J, Lima RT, Sousa D, Gomes AS, Palmeira A, Seca H, Choosang K, Pakkong P, Bousbaa H, Pinto MM, et al. Screening a Small Library of Xanthones for Antitumor Activity and Identification of a Hit Compound which Induces Apoptosis. Molecules. 2016; 21(1):81. https://doi.org/10.3390/molecules21010081
Chicago/Turabian StyleBarbosa, João, Raquel T. Lima, Diana Sousa, Ana Sara Gomes, Andreia Palmeira, Hugo Seca, Kantima Choosang, Pannee Pakkong, Hassan Bousbaa, Madalena M. Pinto, and et al. 2016. "Screening a Small Library of Xanthones for Antitumor Activity and Identification of a Hit Compound which Induces Apoptosis" Molecules 21, no. 1: 81. https://doi.org/10.3390/molecules21010081