
Phenolic Compounds from the Roots of Rhodiola crenulata and Their Antioxidant and Inducing IFN-γ Production Activities

 ,
,
Abstract
: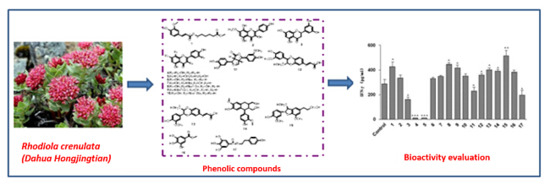
1. Introduction
2. Results and Discussion
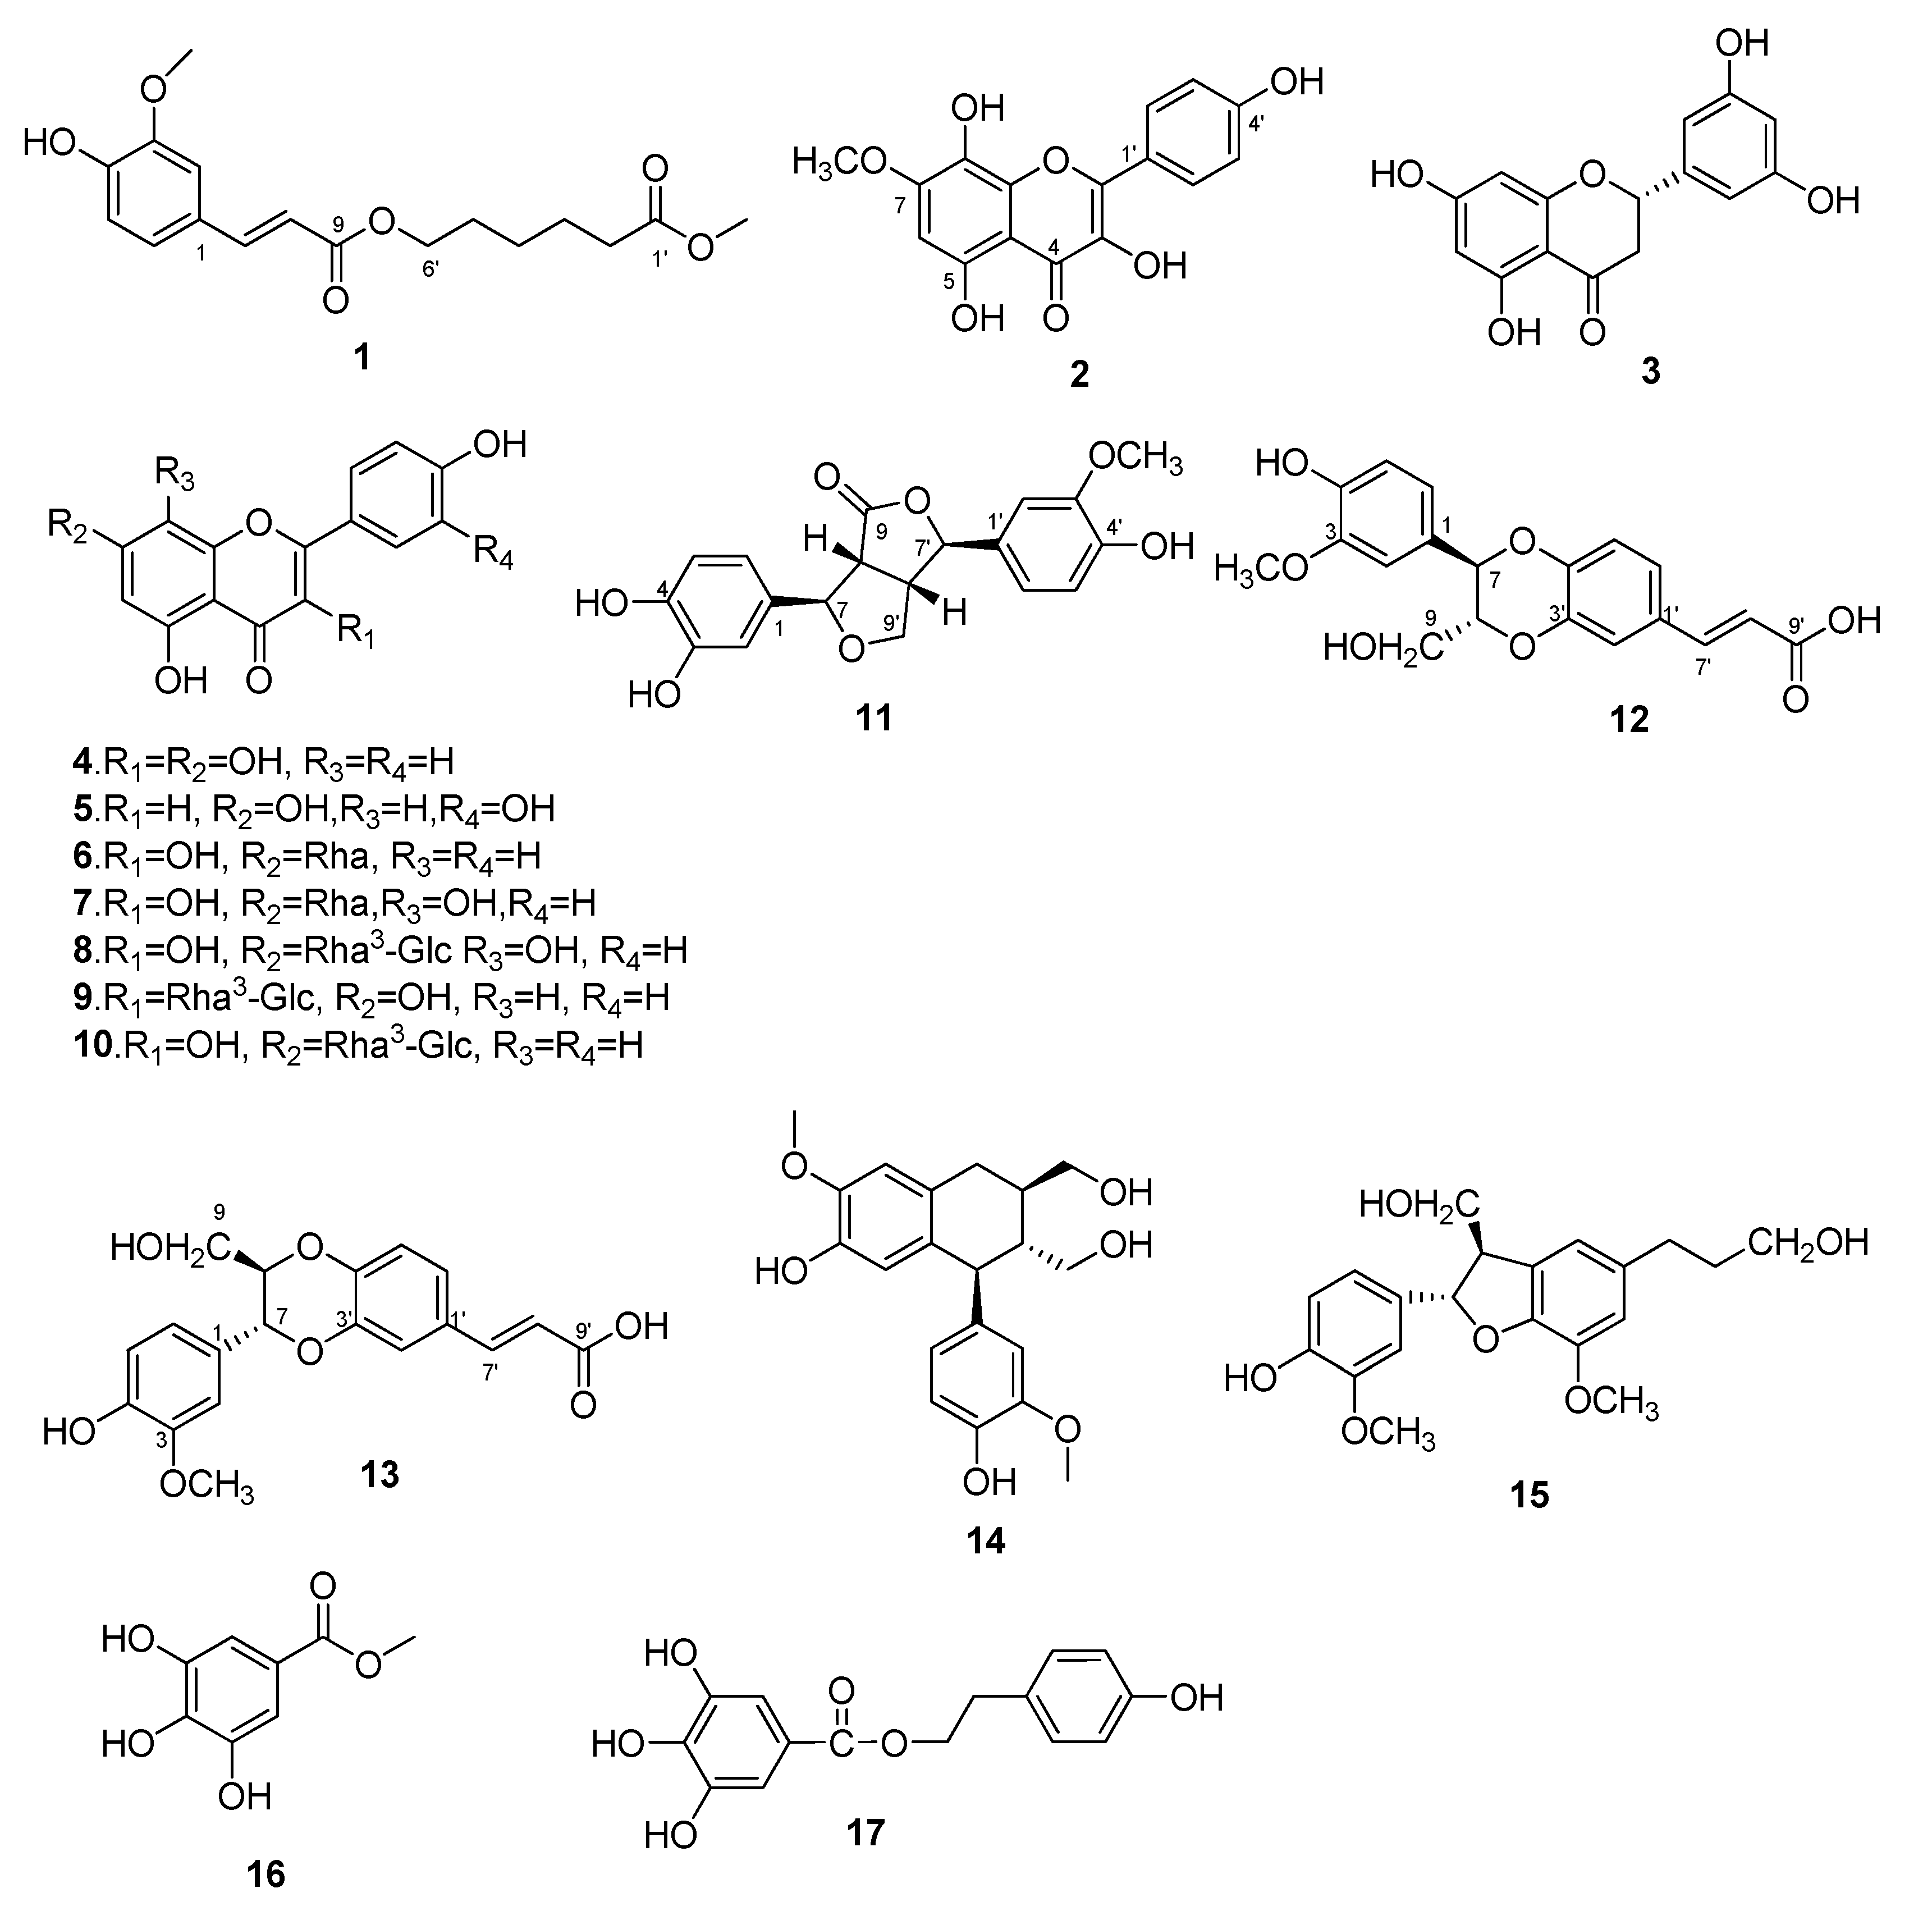
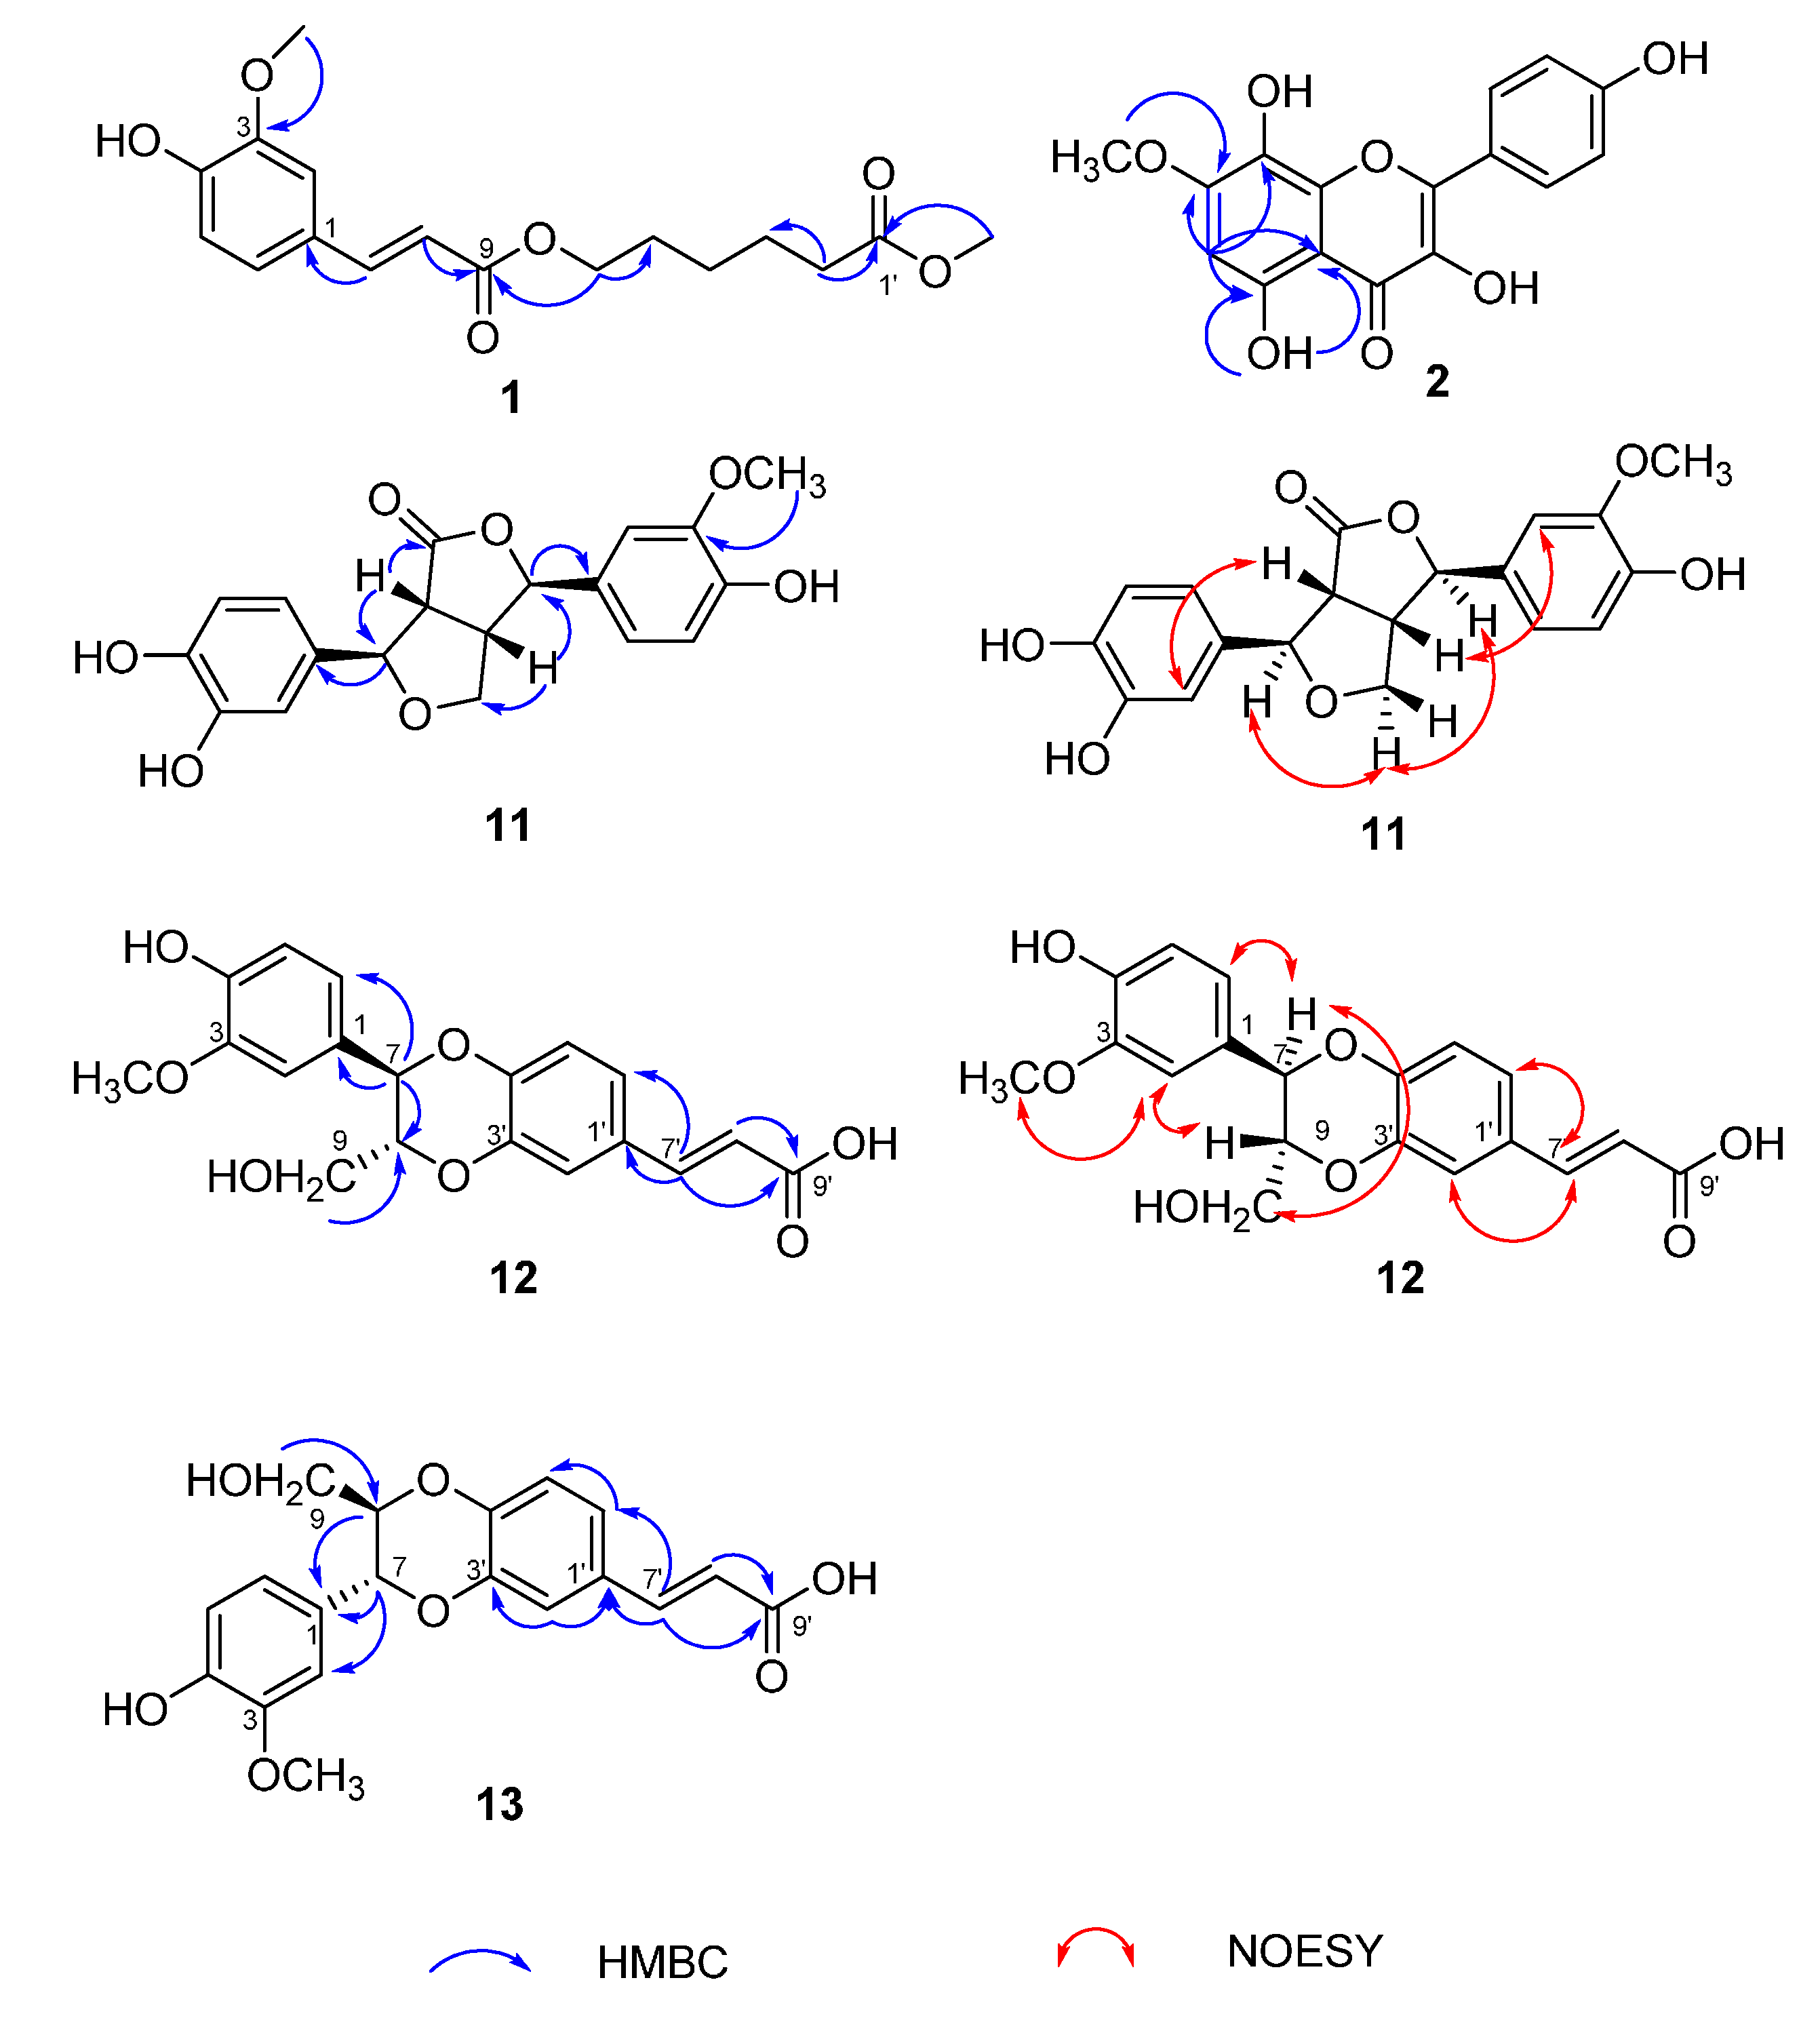
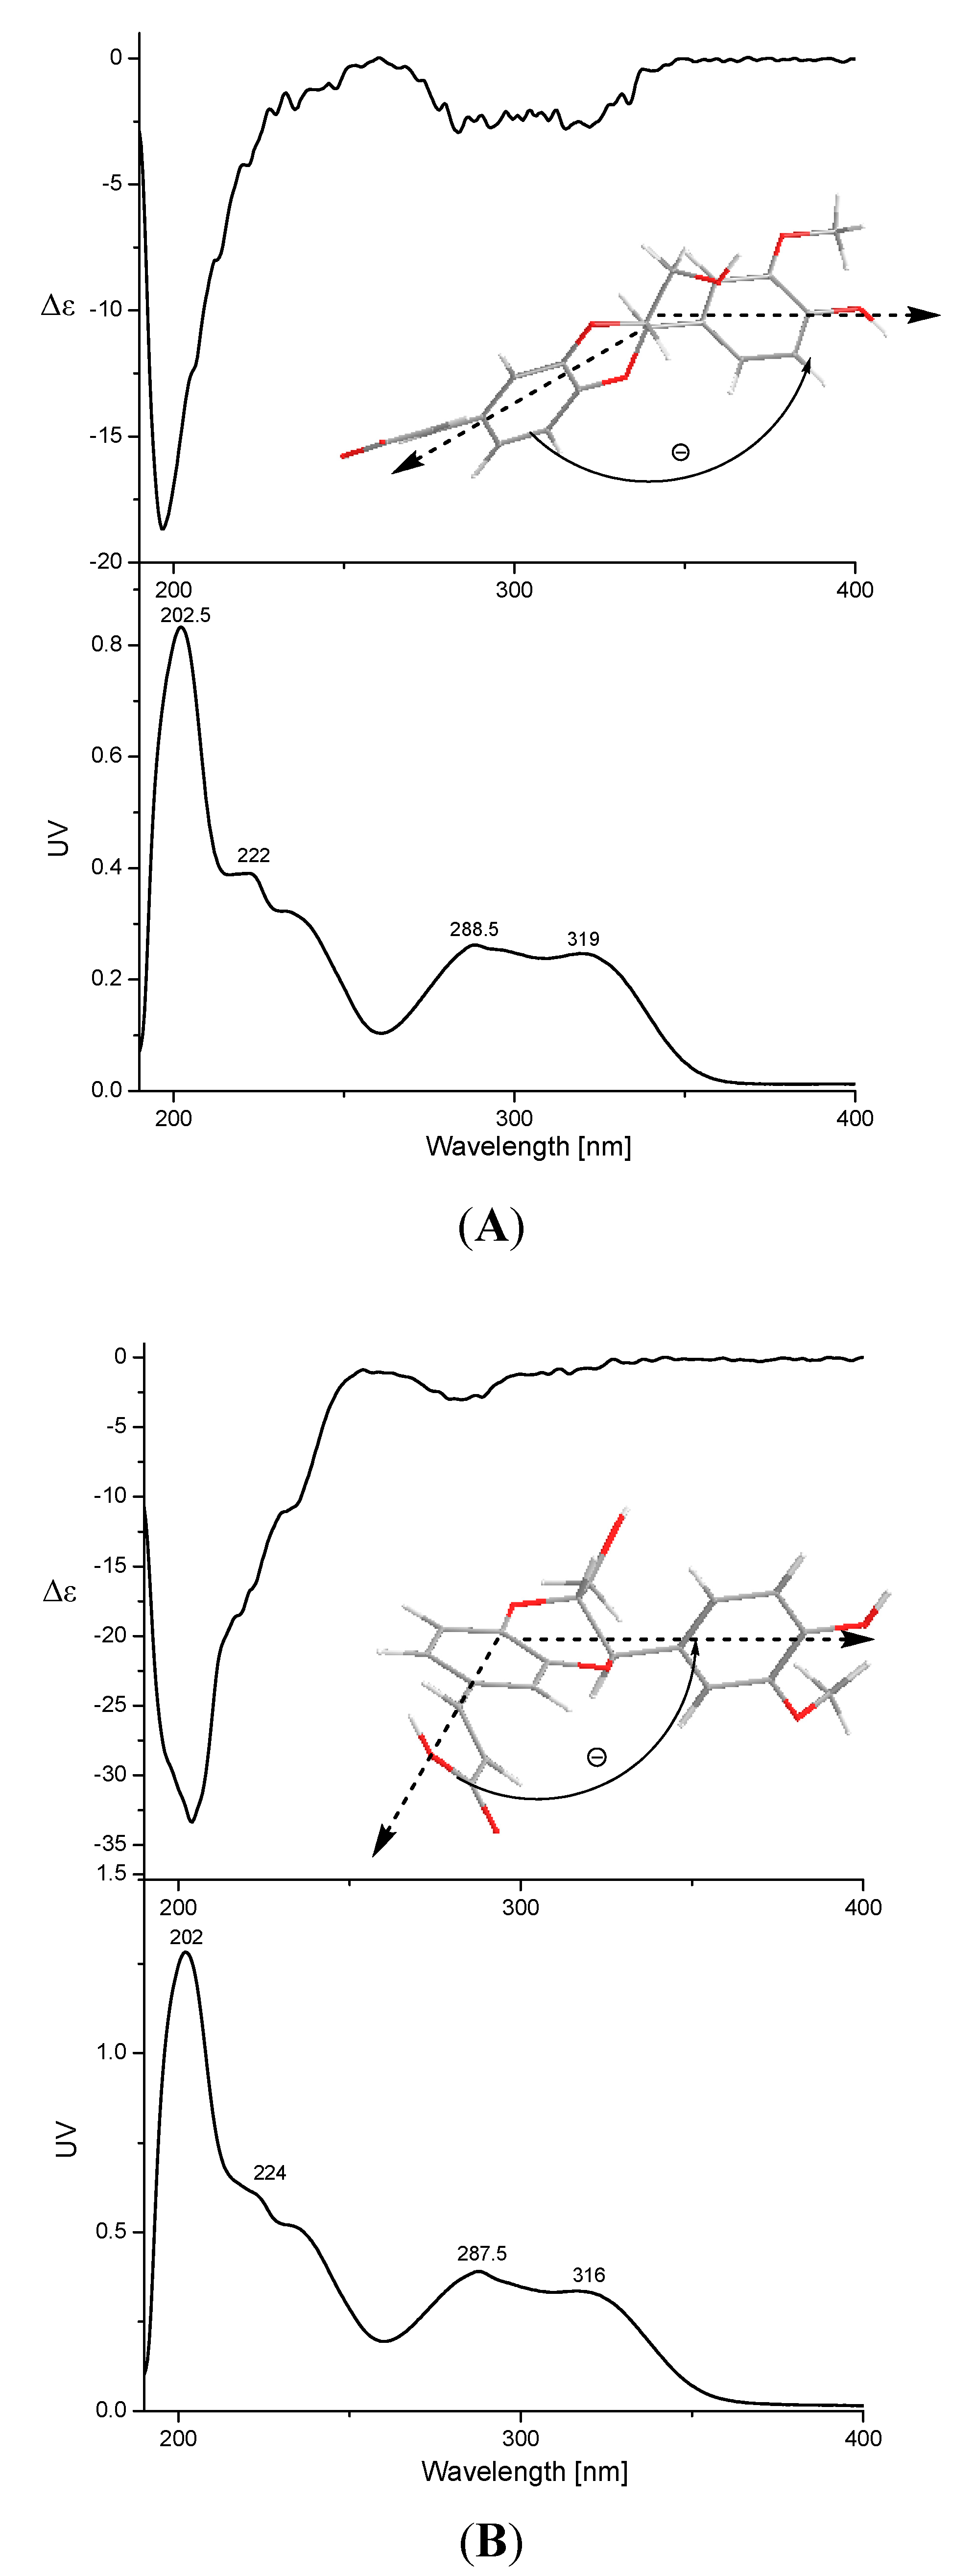
2.1. Identification of Compounds 1–17

| No. | 1 | 2 | 11 | 12 | 13 | |||||
|---|---|---|---|---|---|---|---|---|---|---|
| δH | δC | δH | δC | δH | δC | δH | δC | δH | δC | |
| 1 | 125.5 | 131.8 | 127.7 | 127.6 | ||||||
| 2 | 7.33 (d, 2.0) | 111.2 | 147.6 | 6.79 (d, 1.2) | 114.0 | 7.01 (d, 1.8) | 112.2 | 7.07 (s) | 112.2 | |
| 3 | 149.5 | 135.9 | 147.4 | 148.1 | 148.3 | |||||
| 4 | 148.0 | 176.9 | 145.4 | 147.6 | 147.9 | |||||
| 5 | 6.80 (d, 8.2) | 115.5 | 152.7 | 6.74 a | 115.8 | 6.80 (d, 8.0) | 115.8 | 6.84 a | 115.5 | |
| 6 | 7.12 (dd, 8.2, 2.0) | 123.1 | 6.56 (s) | 95.4 | 6.64 (dd, 8.2, 1.8) | 117.3 | 6.85 (dd, 8.0, 1.8) | 121.0 | 6.85 a | 120.0 |
| 7 | 7.55 (d, 16.0) | 145.0 | 154.0 | 5.07 (d, 3.6) | 83.3 | 4.95 (d, 7.8) | 76.6 | 4.90 (d, 7.8) | 76.5 | |
| 8 | 6.47 (d, 16.0) | 114.4 | 126.4 | 3.70 (dd, 9.2, 3.8) | 53.0 | 4.20 (m) | 78.4 | 4.16 (m) | 78.5 | |
| 9 | 166.7 | 144.2 | 177.7 | 3.55 (d, 11.6) 3.35 a | 60.6 | 3.53 (d, 10.2) 3.35 (dd, 12.0, 4.2) | 60.6 | |||
| 10 | 103.8 | |||||||||
| 1′ | 173.3 | 122.3 | 131.0 | 128.2 | 130.5 | |||||
| 2′ | 2.33 (t, 7.4) | 33.1 | 8.14 (d, 8.8) | 130.2 | 6.99 (d, 1.2) | 111.1 | 7.30 (d, 2.0) | 116.9 | 7.05 (d, 2.0) | 115.9 |
| 3′ | 1.58 (m) | 24.1 | 6.94 (d, 8.8) | 115.9 | 148.2 | 144.3 | 144.4 | |||
| 4′ | 1.37 (m) | 25.0 | 159.8 | 145.7 | 146.1 | 143.8 | ||||
| 5′ | 1.64 (m) | 27.9 | 6.94 (d, 8.8) | 115.9 | 6.81 a | 115.9 | 6.94 (d, 8.0) | 117.6 | 6.87 (d, 8.0) | 117.3 |
| 6′ | 4.12 (t, 6.6) | 63.5 | 8.14 (d, 8.8) | 130.2 | 6.85 (dd, 8.2, 1.8) | 119.5 | 7.21 (dd, 8.0, 2.0) | 122.1 | 7.00 (dd, 8.0, 1.8) | 121.6 |
| 7′ | 5.39 (d, 3.6) | 85.4 | 7.52 (d, 16.0) | 143.9 | 7.12 (d, 15.8) | 136.6 | ||||
| 8′ | 3.28 (m) | 49.3 | 6.38 (d, 16.0) | 117.7 | 6.29 (d, 15.8) | 127.6 | ||||
| 9′ | 4.14 (dd, 9.2, 7.2) 3.95 (dd, 9.2, 4.0) | 72.5 | 168.3 | 171.2 | ||||||
| 3-OCH3 | 3.83 (s) | 55.7 | 3.78 (s) | 56.1 | 3.76 (s) | 56.2 | ||||
| 5-OCH3 | 3.91 (s) | 56.8 | ||||||||
| 1′-OCH3 | 3.59 (s) | 51.2 | ||||||||
| 3′-OCH3 | 3.79 (s) | 56.2 | ||||||||

2.2. Antioxidant Activities
| Compounds | DPPH IC50 (μM) a | ABTS IC50 (μM) a |
|---|---|---|
| 1 | >500 b | >500 |
| 2 | 114.3 ± 4.4 | 87.0 ± 7.9 |
| 3 | 73.8 ± 2.9 | 129.8 ± 12.3 |
| 4 | 91.6 ± 1.4 | 125.4 ± 9.8 |
| 5 | 94.3 ± 2.3 | 123.9 ± 10.4 |
| 6 | 83.0 ± 3.5 | 123.7 ± 12.8 |
| 7 | 104.7 ± 1.8 | 63.7 ± 8.5 |
| 8 | 96.5 ± 2.3 | 53.1 ± 4.8 |
| 9 | 260.5 ± 36.4 | 320.2 ± 22.6 |
| 10 | 64.1 ± 3.3 | 110.8 ± 10.7 |
| 11 | >500 | >500 |
| 12 | >500 | >500 |
| 13 | >500 | >500 |
| 14 | 227.1 ± 33.9 | 160.2 ± 8.8 |
| 15 | >500 | >500 |
| 16 | 52.8 ± 3.3 | 50.0 ± 4.9 |
| 17 | 79.5 ± 1.7 | 65.0 ± 3.9 |
| Ascorbic acid | 88.6 ± 1.9 | 89.8 ± 6.8 |
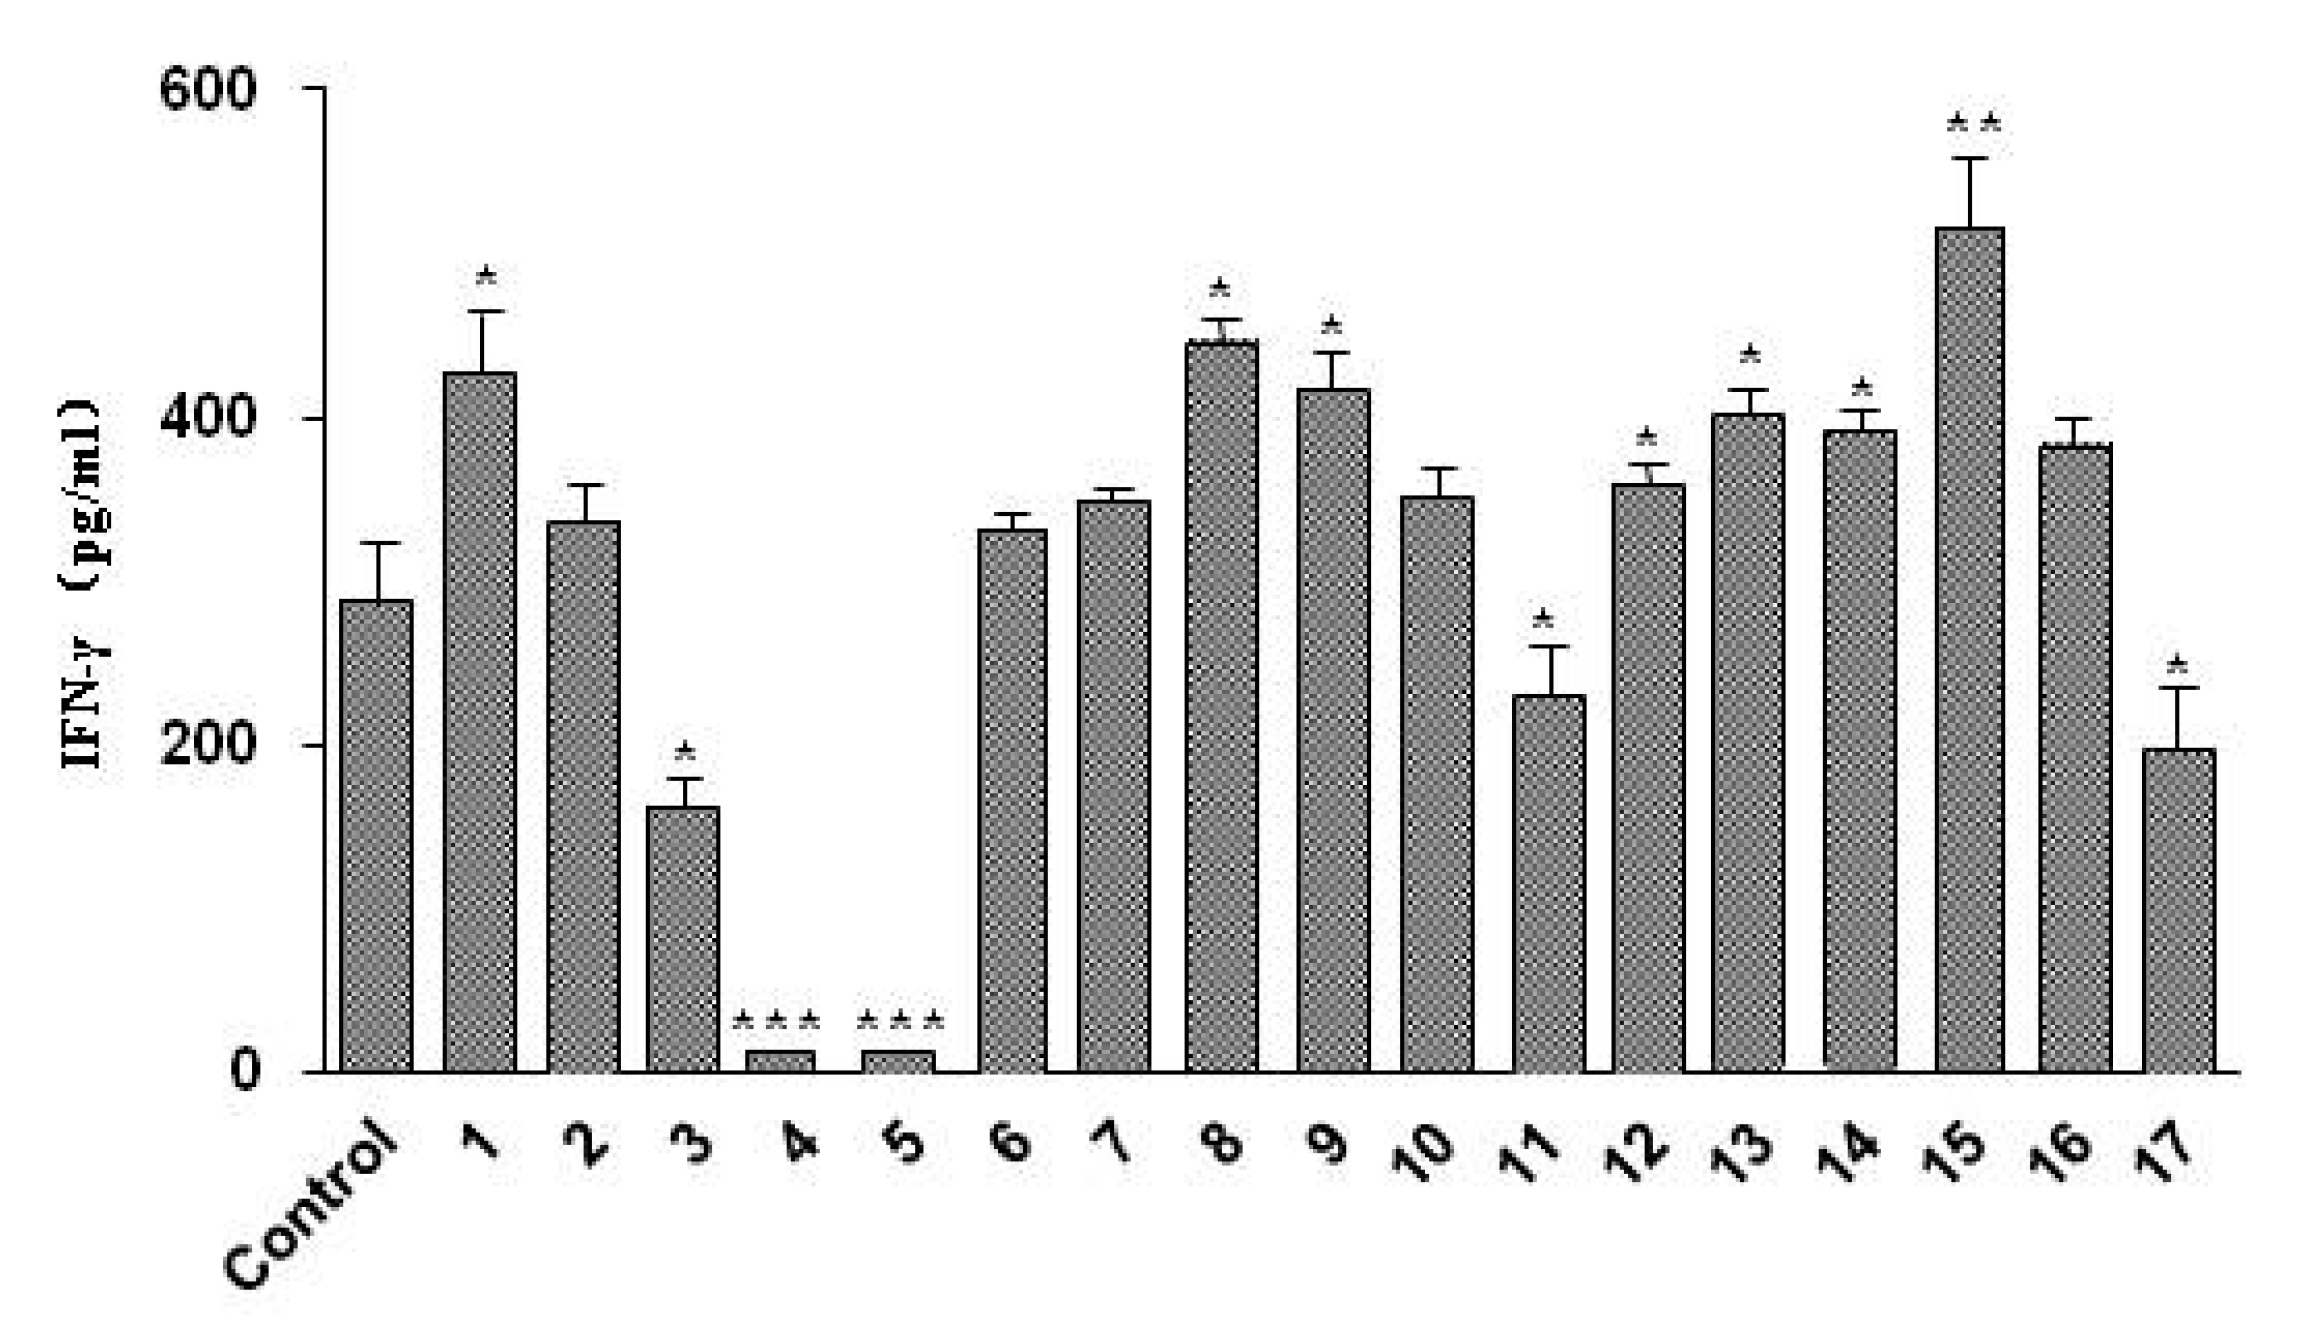
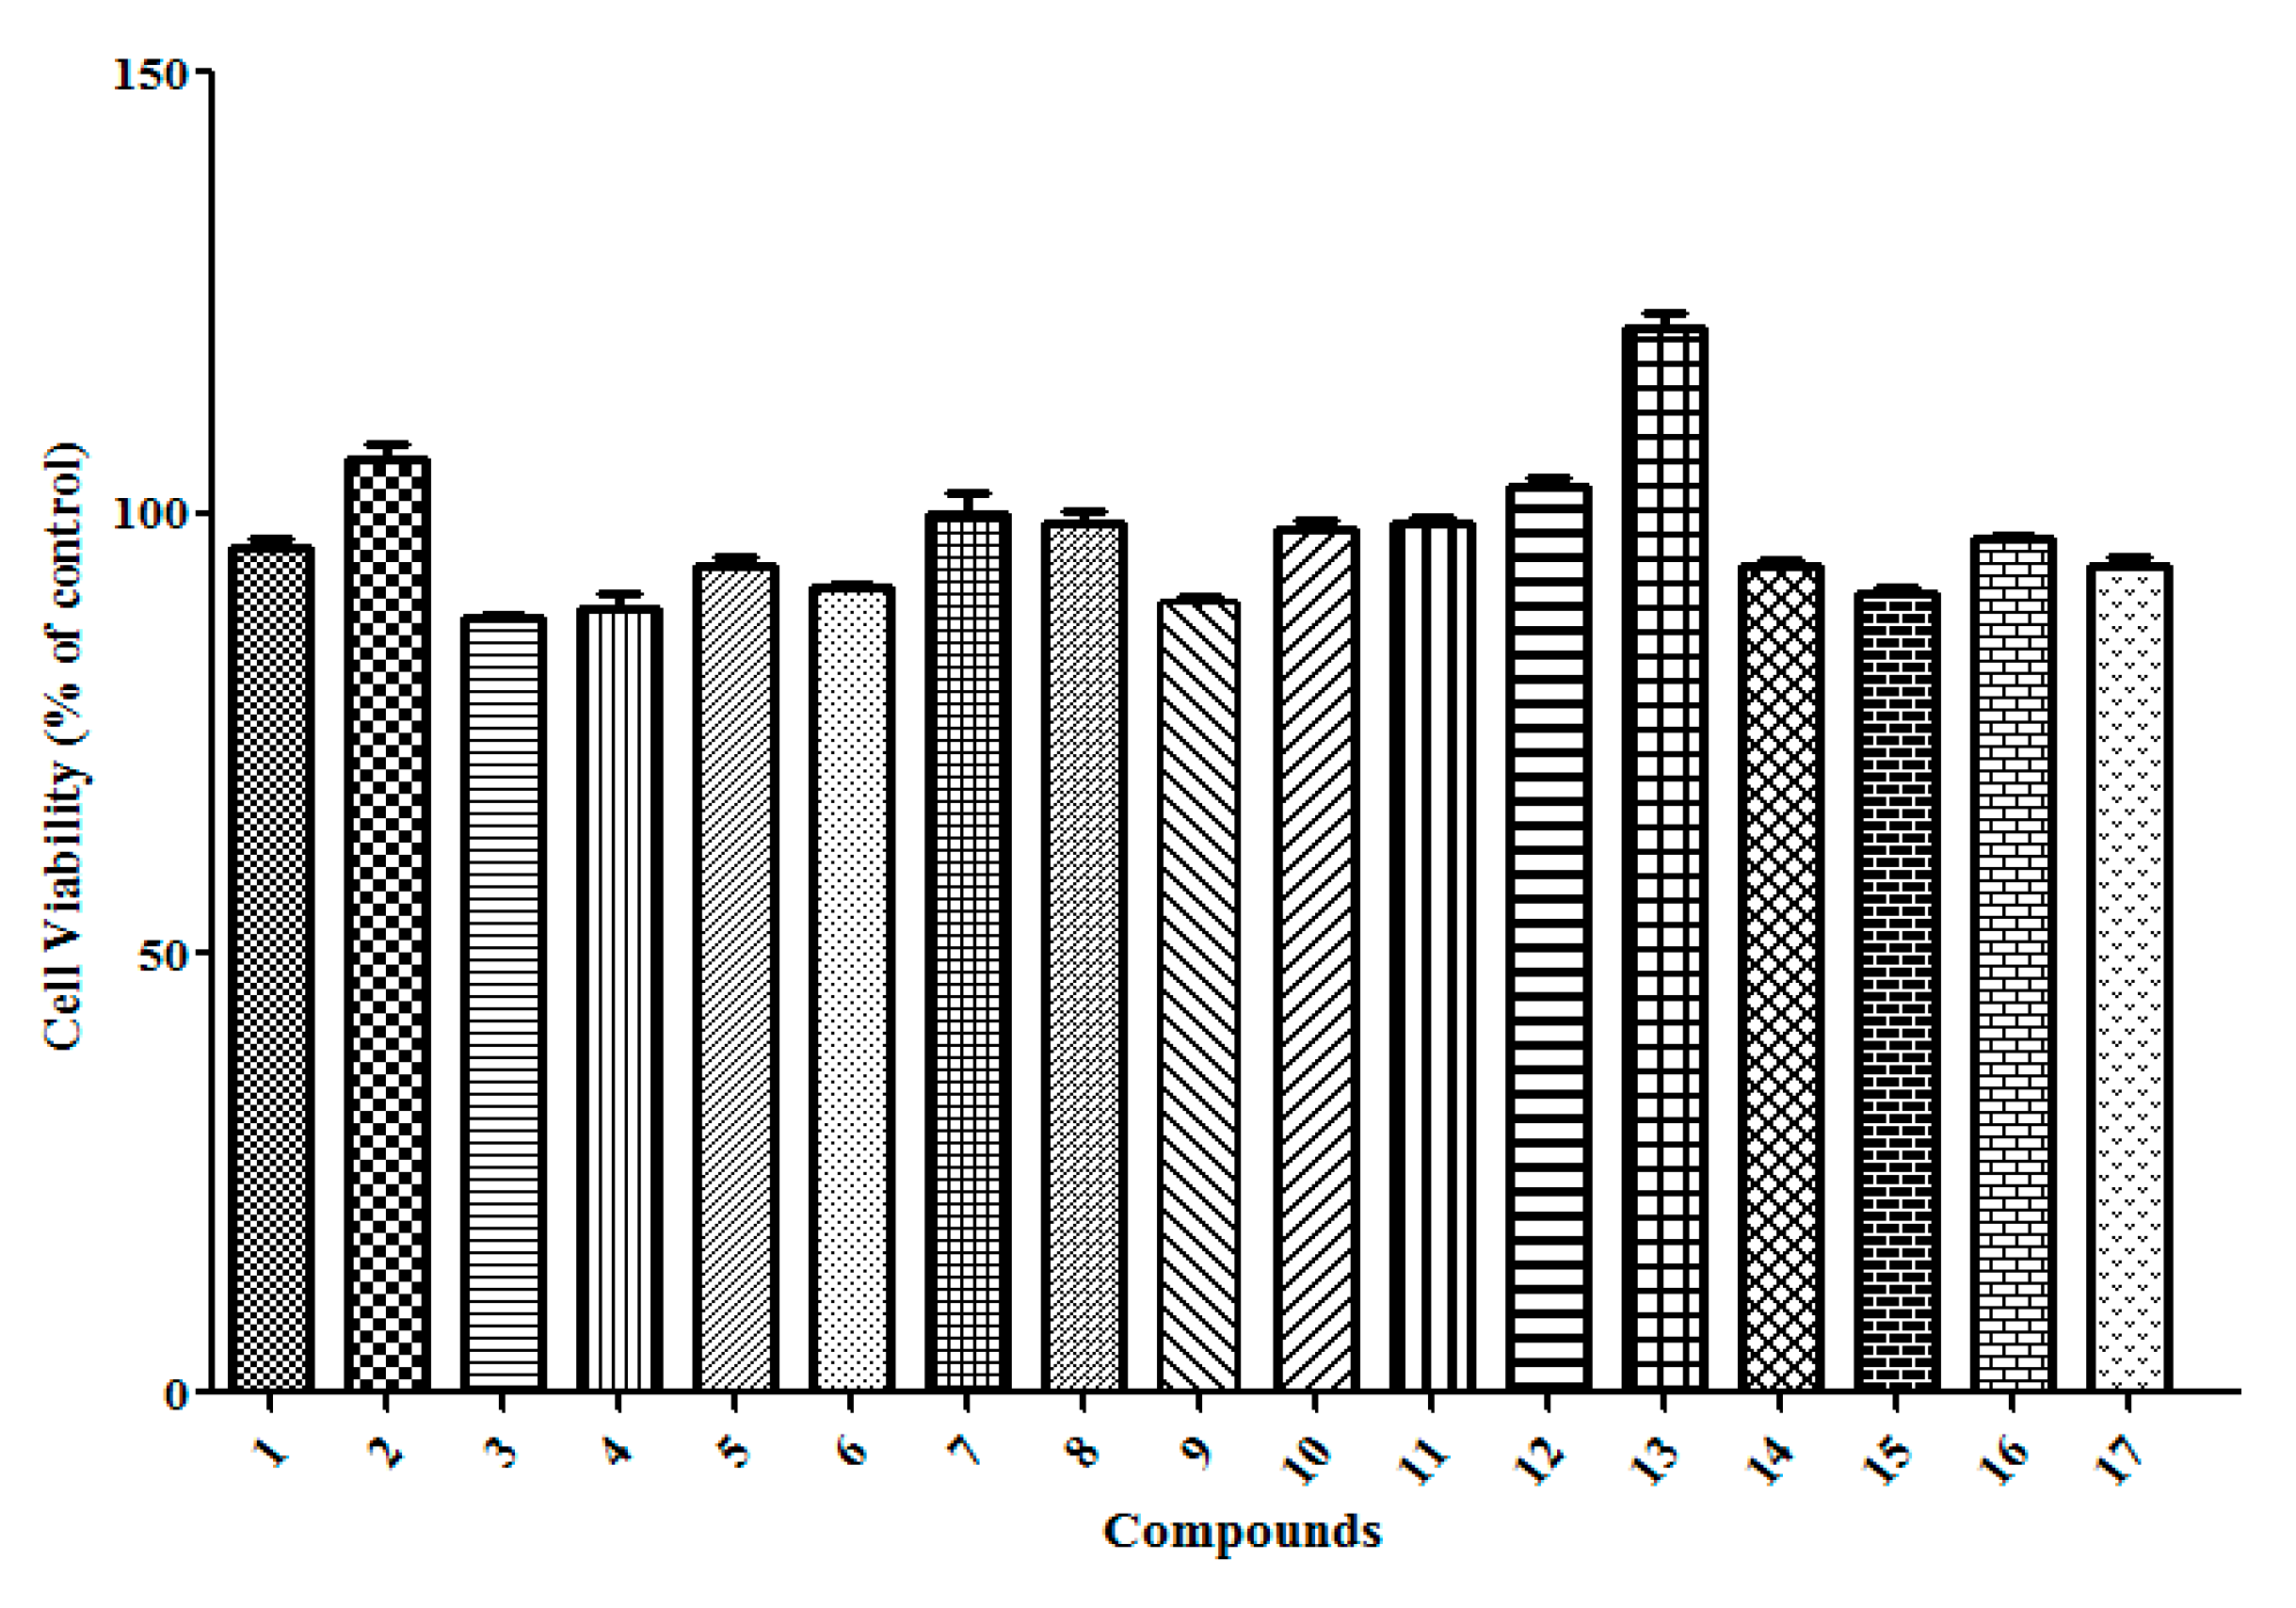
2.3. Compounds Treatment Stimulates IFN-γ Production Activities


3. Experimental Section
3.1. General Procedures
3.2. Plant Materials
3.3. Extraction and Isolation
3.4. Compound Characterization
3.5. Antioxidant Assay
3.6. Cell Culture and Cytokine Assay
3.7. Cell Viability Test
4. Conclusions
Supplementary Materials
Acknowledgments
Author Contributions
Conflicts of Interest
References
- Liu, S.; Wang, P.L.; Hu, Y.J.; Lan, X.Z.; Liao, Z.H.; Chen, M. Study on HPLC fingerprint of Rhodiola crenulata. J. Southwest Univ. Nat. Sci. Ed. 2014, 36, 215–221. [Google Scholar]
- Chiu, T.F.; Chen, L.L.; Su, D.H.; Lo, H.Y.; Chen, C.H.; Wang, S.H.; Chen, W.L. Rhodiola crenulata extract for prevention of acute mountain sickness: A randomized, double-blind, placebo-controlled, crossover trial. BMC Complement. Altern. Med. 2013, 13. [Google Scholar] [CrossRef]
- Chu, Y.H.; Chen, C.J.; Wu, S.H.; Hsieh, J.F. Inhibition of xanthine oxidase by Rhodiola crenulata extracts and their phytochemicals. J. Agric. Food Chem. 2014, 62, 3742–3749. [Google Scholar] [CrossRef] [PubMed]
- Deng, S.G.; Yin, A.W.; Tian, R.; Li, T.F. The anti-aging effects of polysaccharides from Rhodiola crenulata. Chin. J. Gerontol. 2014, 67, 2161–2162. [Google Scholar]
- Chen, D.J.; Fan, J.T.; Wang, P.; Zhu, L.Y.; Jin, Y.; Peng, Y.; Du, S. Isolation, identification and antioxidative capacity of water-soluble phenylpropanoid compounds from Rhodiola crenulata. Food Chem. 2012, 134, 2126–2133. [Google Scholar] [CrossRef] [PubMed]
- Du, M.; Xie, J. Flavonol glycosides from Rhodiola crenulata. Phytochemistry 1995, 38, 809–810. [Google Scholar]
- Jia, W.; Wang, C.; Wang, Y.; Pan, G.; Jiang, M.; Li, Z.; Zhu, Y. Qualitative and quantitative analysis of the major constituents in Chinese medical preparation Lianhua-Qingwen capsule by UPLC-DAD-QTOF-MS. Sci. World J. 2015, 2015. [Google Scholar] [CrossRef] [PubMed]
- Li, T.; Ge, Z.L.; Zhang, H. Study on the chemical constituents of Rhodiola crenulata. West China Med. J. 2012, 27, 367–370. [Google Scholar]
- Nakamura, S.; Li, X.Z.; Matsuda, H.; Yoshikawa, M. Bioactive constituents from Chinese natural medicines. XXVIII. Chemical structures of cyclic alcohol glycosides from the roots of Rhodiola crenulata. Chem. Pharm. Bull. 2008, 56, 536–540. [Google Scholar] [CrossRef] [PubMed]
- Yang, Y.N.; Liu, Z.Z.; Feng, Z.M.; Jiang, J.S.; Zhang, P.C. Lignans from the root of Rhodiola crenulata. J. Agric. Food Chem. 2012, 60, 964–972. [Google Scholar] [CrossRef] [PubMed]
- Cheng, X.F.; Lai, G.X. The immunomodulatory effect of Rhodiola crenulata. Chin. J. Ethnomed. Ethnopharm. 2013, 6, 24–25. [Google Scholar]
- Darbinyan, V.; Kteyan, A.; Panossian, A.; Gabrielian, E.; Wikman, G.; Wagner, H. Rhodiola rosea in stress induced fatigue-a double blind crossover study of a standardized extract SHR-5 with a repeated low-dose regimen on the mental performance of healthy physicians during night duty. Phytomedicine 2000, 7, 365–371. [Google Scholar] [CrossRef]
- Jacob, R.; Nalini, G.; Chidambaranathan, N. Neuroprotective effect of Rhodiola rosea Linn against MPTP induced cognitive impairment and oxidative stress. Ann. Neurosci. 2013, 20, 47–51. [Google Scholar] [CrossRef] [PubMed]
- Pooja; Bawa, A.S.; Khanum, F. Anti-inflammatory activity of Rhodiola rosea—“A second-generation adaptogen”. Phytother. Res. 2009, 23, 1099–1102. [Google Scholar] [CrossRef] [PubMed]
- Panossian, A.; Wikman, G.; Sarris, J. Rosen root (Rhodiola rosea): Traditional use, chemical composition, pharmacology and clinical efficacy. Phytomedicine 2010, 17, 481–493. [Google Scholar] [CrossRef] [PubMed]
- Nabiel, A.M.S.; Salwa, A.M.; Wafaa, M.M.A.; Kenneth, R.M.; Denis, B. Herbacetin and gossypetin 3-glucuronide-8-glucosides from Roemeria hybrid. Phytochemistry 1988, 27, 309–310. [Google Scholar]
- Hussein, S.A.M.; Barakat, H.H.; Nawar, M.A.M.; Willuhn, G. Flavonoids from Ephedra aphylla. Phytochemistry 1997, 45, 1529–1532. [Google Scholar] [CrossRef]
- Na, C.S.; Hong, S.S.; Choi, Y.H.; Lee, Y.H.; Hong, S.H.; Lim, J.Y.; Kang, B.H.; Park, S.Y.; Lee, D. Neuroprotective effects of constituents of Eragrostis ferruginea against Aβ-induced toxicity in PC12 cells. Arch. Pharm. Res. 2010, 33, 999–1003. [Google Scholar] [CrossRef] [PubMed]
- Nguyen, P.H.; Yang, J.L.; Uddin, M.N.; Park, S.L.; Lim, S.I.; Jung, D.W.; Williams, D.R.; Oh, W.K. Protein tyrosine phosphatase 1B (PTP1B) inhibitors from Morinda citrifolia (Noni) and their insulin mimetic activity. J. Nat. Prod. 2013, 76, 2080–2087. [Google Scholar] [CrossRef] [PubMed]
- He, Z.Z.; Yan, J.F.; Song, Z.J.; Ye, F.; Liao, X.; Peng, S.L.; Ding, L.S. Chemical constituents from the aerial parts of Artemisia minor. J. Nat. Prod. 2009, 72, 1198–1201. [Google Scholar] [CrossRef] [PubMed]
- He, Z.Z.; Yan, J.F.; Liao, X.; Zhang, W.Y.; Ji, J.X.; Ding, L.S. A New Lignan and Its Application. Chinese Patent No. CN 200910258342.2.2009-02-17, 17 February 2009. [Google Scholar]
- Wang, X.M.; He, C.H.; Wang, X.L.; Hu, J.P.; Wang, X.Q.; Rena, K. Studies on the chemical constituents of Rhodiola rosea. J. Chin. Med. Mater. 2010, 33, 1252–1253. [Google Scholar]
- Lee, M.W.; Lee, Y.A.; Park, H.M.; Toh, S.H.; Lee, E.J.; Jang, H.D.; Kim, Y.H. Antioxidative phenolic compounds from the roots of Rhodiola sachalinensis A. Bor. Arch. Pharm. Res. 2000, 23, 455–458. [Google Scholar] [CrossRef] [PubMed]
- Zheng, R.R.; Ya, J.; Wang, W.J.; Yang, H.B.; Zhang, Q.W.; Zhang, X.Q.; Ye, W.C. Chemical studies on roots of Ficus hirta. China J. Chin. Mater. Med. 2013, 38, 3696–3701. [Google Scholar]
- Warashina, T.; Umehara, K.; Miyase, T. Flavonoid glycosides from Botrychium ternatum. Chem. Pharm. Bull. 2012, 60, 1561–1573. [Google Scholar] [CrossRef] [PubMed]
- Jutiviboonsuk, A.; Zhang, H.; Tan, G.T.; Ma, C.; van Hung, N.; Cuong, N.M.; Soejarto, D.D.; Bunyapraphatsara, N.; Fong, H.H.S. Bioactive constituents from roots of Bursera tonkinensis. Phytochemistry 2005, 66, 2745–2751. [Google Scholar] [CrossRef] [PubMed]
- Fu, Z.H.; Zhang, Y.M.; Tan, Y.M.; Tan, N.H.; Zhu, H.B.; Ji, C.J. Chemical constituents of Keteleeria evelyniana. Nat. Prod. Res. Dev. 2008, 20, 257–261. [Google Scholar]
- Shang, X.Y.; Li, S.; Wang, Y.H.; Wang, S.J.; Yang, Y.C.; Shi, J.G. Chemical constitutents of Bauhinia aurea. China J. Chin. Mater. Med. 2006, 31, 1953–1955. [Google Scholar]
- Chu, Y.H.; Wu, S.H.; Hsieh, J.F. Isolation and characterization of α-glucosidase inhibitory constituents from Rhodiola crenulata. Food Res. Int. 2014, 57, 8–14. [Google Scholar] [CrossRef]
- Ding, A.H.; Nathan, C.F.; Stuehr, D.J. Release of reactive nitrogen intermediates and reactive oxygen intermediates from mouse peritoneal macrophages. Comparison of activating cytokines and evidence for independent production. J. Immunol. 1988, 141, 2407–2412. [Google Scholar] [PubMed]
- Green, S.J.; Crawford, R.M.; Hockmeyer, J.T.; Meltzer, M.S.; Nacy, C.A. Leishmania major amastigotesinitiate the l-arginine-dependent killing mechanism in IFN-γ-stimulated macrophages by induction of tumor necrosis factor-α. J. Immunol. 1990, 145, 4290–4297. [Google Scholar] [PubMed]
- Sá-Nunes, A.; Faccioli, L.H.; Sforcin, J.M. Propolis: Lymphocyte proliferation and IFN-γ production. J. Ethnopharmacol. 2003, 87, 93–97. [Google Scholar] [CrossRef]
- Sharma, O.P.; Bhat, T.K. DPPH antioxidant assay revisited. Food Chem. 2009, 113, 1202–1205. [Google Scholar] [CrossRef]
- Zhang, X.L.; Guo, Y.S.; Wang, C.H.; Li, G.Q.; Xu, J.J.; Chung, H.Y.; Ye, W.C.; Li, Y.L.; Wang, G.C. Phenolic compounds from Origanum vulgare and their antioxidant and antiviral activities. Food Chem. 2014, 152, 300–306. [Google Scholar] [CrossRef] [PubMed]
- Oliveira, C.M.; Ferreira, A.C.; de Pinho, P.G.; Silva, A.M. New qualitative approach in the characterization of antioxidants in white wines by antioxidant free radical scavenging and NMR techniques. J. Agric. Food Chem. 2008, 56, 10326–10331. [Google Scholar] [CrossRef] [PubMed]
- Sample Availability: Samples of the compounds 1–17 are available from the authors.
© 2015 by the authors. Licensee MDPI, Basel, Switzerland. This article is an open access article distributed under the terms and conditions of the Creative Commons Attribution license ( http://creativecommons.org/licenses/by/4.0/).
Share and Cite
Zhou, J.-T.; Li, C.-Y.; Wang, C.-H.; Wang, Y.-F.; Wang, X.-D.; Wang, H.-T.; Zhu, Y.; Jiang, M.-M.; Gao, X.-M. Phenolic Compounds from the Roots of Rhodiola crenulata and Their Antioxidant and Inducing IFN-γ Production Activities. Molecules 2015, 20, 13725-13739. https://doi.org/10.3390/molecules200813725
Zhou J-T, Li C-Y, Wang C-H, Wang Y-F, Wang X-D, Wang H-T, Zhu Y, Jiang M-M, Gao X-M. Phenolic Compounds from the Roots of Rhodiola crenulata and Their Antioxidant and Inducing IFN-γ Production Activities. Molecules. 2015; 20(8):13725-13739. https://doi.org/10.3390/molecules200813725
Chicago/Turabian StyleZhou, Jiang-Tao, Chen-Yang Li, Chun-Hua Wang, Yue-Fei Wang, Xiao-Dong Wang, Hong-Tao Wang, Yan Zhu, Miao-Miao Jiang, and Xiu-Mei Gao. 2015. "Phenolic Compounds from the Roots of Rhodiola crenulata and Their Antioxidant and Inducing IFN-γ Production Activities" Molecules 20, no. 8: 13725-13739. https://doi.org/10.3390/molecules200813725