
Identification and Expression Analysis of Glucosinolate Biosynthetic Genes and Estimation of Glucosinolate Contents in Edible Organs of Brassica oleracea Subspecies


 ,
,
Abstract
:1. Introduction
2. Experimental Section
2.1. Plant Materials and Growth Conditions

| No. | Common Name | Genotype | Sampling Site/Edible Organ | Scientific Name of the Genotype |
|---|---|---|---|---|
| 1 | Cabbage | White cabbage | Leaf | B. oleracea L. convar capitata (L) Alef. var. alba DC |
| 2 | Cabbage | Cabbage | Leaf | B. oleracea var. capitata alba |
| 3 | Cabbage | Sprouting red cabbage | Leaf | B. oleracea capitata rubra |
| 4 | Kale | Curly kale Halftall | Leaf | B. oleracea acephala |
| 5 | Kale | Curly kale | Leaf | B. oleracea L. convar. acephala |
| 6 | Kale | Curly kale | Leaf | B. oleracea L. convar. acephala |
| 7 | Kohlrabi | Kohlrabi | Stem | B. oleracea var. italica Plenck |
| 8 | Kohlrabi | Kohlrabi | Stem | B. oleracea var. italica Plenck |
| 9 | Kohlrabi | Kohlrabi | Stem | B. oleracea L. convar. acephala (DC) Alef. var. gongyodes |
| 10 | Cauliflower | Cauliflower | Floret | B. oleracea L. convar. botrytis |
| 11 | Cauliflower | Cauliflower | Floret | B. oleracea L. convar. botrytis |
| 12 | Cauliflower | Cauliflower | Floret | B. oleracea L. convar. botrytis |
2.2. In Silico Analysis
2.3. cDNA Synthesis and Reverse-Transcriptase PCR Analysis
| Gene Name | Biosynthesis Pathway | B. rapa | B. oleracea (Bolbase) | Total CDS of Bolbase | B. oleracea (Ensemblplants) | Total CDS of EnsemblPlants | Matching Sequence (%) *** |
|---|---|---|---|---|---|---|---|
| Transcription factors | Aliphatic and indolic GSLs | Bra012961 | Bol007795 (Cun) | 558 | Bo2g161590.1 | 1059 | 554(98.0) |
| MYB28 | Bra035929 | Bol036286 (C09) | 615 | Bo9g014610.1 | 1083 | 476(93.0) | |
| Bra029311 | Bol017019 (C06) | 426 | Bo7g098590.1 ** | 1068 | 426(99.0) | ||
| Bol036743 (C05) | 426 | Bo7g098590.1 ** | 1068 | 426(98.0) | |||
| MYB29 | Bra009245 | Bol008849 (C03) | 513 | Bo3g004500.1 | 993 | 513(94.0) | |
| Bra005949 | |||||||
| MYB34 | Bra013000 | Bol017062 (C06) | 951 | Bo7g098110.1 | 948 | 951(97.0) | |
| Bra035954 | Bol007760 (Cun) | 843 | Bo2g161180.1 | 843 | 843(97.0) | ||
| Bra029349 | Bol036262 (C09) | 294 | Bo9g014380.1 | 882 | 294(100.0) | ||
| Bra029350 | |||||||
| MYB51 | Bra016553 | Bol013207 (C08) | 1002 | Bo8g067910.1 | 1002 | 1002(100.0) | |
| Bra031035 | Bol030761 (C05) | 990 | Bo5g025570.1 | 990 | 990(99.0) | ||
| Bra025666 | |||||||
| MYB122 | Bra015939 | Bol026204 (C07) | 981 | Bo6g118350.1 | 1113 | 981(100.0) | |
| Bra008131 | |||||||
| Dof1.1 | Bra030696 | Bol023400 (C08) | 1005 | Bo8g010700.1 | 1350 | 915(99.0) | |
| Bra031588 | Bol041144 (C05) | 1011 | Bo5g008360.1 | 1011 | 1011(100.0) | ||
| Bol006511 (C08) | 936 | Bo8g112940.1 | 936 | 936(100.0) | |||
| IQD1 | Bra034081 | Bol023096 (C01) | 1656 | Bo1g144340.1 | 1368 | 1260(95.0) | |
| Bra001299 | Bol033935 (Cun) | 1437 | Bo3g061890.1 | 1437 | 1437(99.0) | ||
| TFL2 | Bra023629 | Bol021358 (C02) | 1146 | Bo2g013840.1 | 1152 | 1146(94.0) | |
| Bra013958 | Bol000201 (Cun) ** | 1236 | Bo9g159960.1 ** | 1372 | 1236(99.0) | ||
| Bra006417 | Bol019784 (C09) ** | 1236 | Bo9g159960.1 ** | 1372 | 1236(99.0) | ||
| Bol034455 (C03) | 999 | Bo3g012730.1 | 1248 | 906(95.0) | |||
| BCAT-4 | Aliphatic GSLs | Bra022448 | Bol018130 (C05) | 1083 | Bo5g113720.1 | 1083 | 1083(99.0) |
| Bra001761 | Bol026690 (C03) | 1083 | Bo3g073430.1 | 825 | 825(100.0) | ||
| MAM1/2 | Bra029355 | Bol017071 (C06) | 1236 | Bo7g098000.1 | 1527 | 1243(81.0) | |
| Bra013009 | Bol020647 (C03) | 1518 | Bo2g161100.1 ** | 1518 | 1518(99.0) | ||
| Bra029356 | Bol020646 (C03) | 804 | Bo2g161100.1 ** | 1518 | 760(82.0) | ||
| Bra021947 | Bol037823 (C04) | 1302 | Bo2g102060.1 | 1494 | 880(78.0) | ||
| Bra013011 | Bol017070 (C06) | 1527 | Bo7g098000.1 | 1527 | 1527(99.0) | ||
| MAM3 | Bra018524 | Bol016496 (C02) | 759 | Bo2g102060.1 | 1494 | 759(100.0) | |
| CYP79F1 | Bra026058 | Bol038222 (C05) | 1551 | Bo5g021810.1 | 1623 | 1551(99.0) | |
| CYP83A1 | Bra032734 | Bol040365 (C04) | 1506 | Bo4g130780.1 | 1506 | 1505(99.0) | |
| Bra016908 | Bol005188 (C04) | 570 | Bo4g191120.1 | 1509 | 570(100.0) | ||
| GSTF11 | Bra032010 | Bol000843 (Cun) | 633 | Bo5g150180.1 | 648 | 633(98.0) | |
| GSTU20 | Bra003645 | Bol021558 (C07) | 654 | Bo6g081630.1 | 654 | 654(99.0) | |
| UGT74C1 | Bra021743 | Bol006450 (Cun) | 1371 | Bo4g177530.1 | 657 | 647(99.0) | |
| Bra005641 | Bol014127 (C04) | 1371 | Bo4g049480.1 | 1372 | 1371(98.0) | ||
| STb | Bra015938 | Bol026202 (C07) | 1035 | Bo6g118360.1 | 1035 | 1035(100.0) | |
| Bra015936 | Bol026201 (C07) | 1035 | Bo6g118370.1 | 1035 | 1035(100.0) | ||
| STc | Bra025668 | Bol030757 (C05) | 1014 | Bo5g025610.1 | 1014 | 1014(99.0) | |
| FMOGS-OX2 | Bra027035 | Bol010993 (Cun) | 1386 | Bo9g037180.1 | 1386 | 1386(100.0) | |
| FMOGS-OX5 | Bra016787 | Bol029100 (C08) | 1347 | Bo8g062610.1 | 1347 | 1347(99.0) | |
| Bra026988 | Bol031350 (C08) | 1380 | Bo8g108390.1 | 1380 | 1380(100.0) | ||
| AOP2 | Bra034180 | Bol045938 | ? | Bo9g006240.1 | 1032 | ||
| Bra018521 | Bol045939 | ? | Bo2g102190.1 | 1104 | 1105 **** | ||
| Bra000848 | Bol045940 | ? | Bo3g052110.1 | 948 | 497 **** | ||
| GS-OH | Bra022920 | Bol033373 (C04) ** | 243 | Bo4g173530.1 ** | 1077 | 219(99.0) | |
| Bra021670 | Bol033374 (C04) ** | 243 | Bo4g173530.1 ** | 1077 | 219(99.0) | ||
| CYP79B2 | Indolic GSLs | Bra010644 | Bol032767 (C03) | 1557 | Bo3g152800.1 | 1557 | 1557(100.0) |
| Bra011821 | Bol028852 (C01) | 1623 | Bo1g002970.1 | 1623 | 1623(97.0) | ||
| Bra017871 | Bol018585 (C06) | 1626 | Bo7g118840.1 | 1626 | 1626(100.0) | ||
| CYP79B3 | Bra030246 | Bol031784 (Cun) | 1632 | Bo4g149550.1 | 1632 | 1632(99.0) | |
| CYP83B1 | Bra034941 | Bol033477 (C08) | 1473 | Bo8g024390.1 | 1500 | 1473(100.0) | |
| GSTF9 | Bra021673 | Bol033376 (C04) | 648 | Bo4g173610.1 | 648 | 648(99.0) | |
| Bra022815 | Bol004624 (C03) | 648 | Bo3g024840.1 | 648 | 648(99.0) | ||
| GSTF10 | Bra022816 | Bol004625 (C03) | 648 | Bo3g024850.1 | 648 | 648(99.0) | |
| STa | Bra008132 | Bol039395 (C02) | 1014 | Bo2g080910.1 | 1014 | 1014(100.0) | |
| Bra015935 | Bol026200 (C07) | 1017 | Bo6g118380.1 | 1017 | 1017(100.0) | ||
| CYP81F1 | Bra011762 | Bol028913 (C01) | 1500 | Bo1g003680.1 | 1437 | 882(97.0) | |
| Bra011761 | Bol028914 (C01) | 1497 | Bo1g003710.1 | 1497 | 1497(98.0) | ||
| Bol017375 (C07) | 369 | Bo6g095040.1 ** | 942 | 324(99.0) | |||
| Bol017376 (C07) | 246 | Bo6g095040.1 ** | 942 | 232(97.0) | |||
| CYP81F2 | Bra002747 | Bol012237 (C09) | 933 | Bo9g131960.1 | 1581 | 933(99.0) | |
| Bra020459 | Bol014239 (C02) | 1482 | Bo2g032590.1 | 1482 | 1482(99.0) | ||
| Bra006830 | Bol026044 (C03) | 1482 | Bo3g019420.1 | 1482 | 1482(100.0) | ||
| CYP81F3 | Bra010597 | Bol032711 (C03) | 1491 | Bo3g153480.1 | 1491 | 1491(99.0) | |
| Bra011758 | Bol028919 (C01) | 1500 | Bo1g004740.1 | 1500 | 1500(99.0) | ||
| CYP81F4 | Bra010598 | Bol032712 (C03) | 1506 | Bo01007s020.1 ** | 1506 | 1506(99.0) | |
| Bra011759 | Bol032714 (C03) | 960 | Bo01007s020.1 ** | 1506 | 807(98.0) | ||
| Bol028918 (C01) | 1503 | Bo1g004730.1 | 1506 | 1503(97.0) | |||
| IGMT1 | Bra012270 | Bol007029 (C08) | 1119 | Bo8g070650.1 | 1119 | 1119(100.0) | |
| Bra012269 | Bol020663 (C05) | 342 | Bo09472s010.1 | 312 | 342(100.0) | ||
| IGMT2 | Bra016432 | Bol007030 (C08) | 1125 | Bo8g070660.1 | 1350 | 1120(99.0) | |
| GGP1 * | Both aliphatic and indolic GSLs | Bra024068 | Bol033672 (C06) | 753 | Bo7g114570.1 | 753 | 753(99.0) |
| Bra011201 | Bol018073 (C01) | 753 | Bo1g012070.1 | 753 | 753(100.0) | ||
| Bra010283 | Bol012989 (C03) | 753 | Bo3g175530.1 | 753 | 753(100.0) | ||
| SUR1 * | Bra036490 | Bol038767 (C09) | 1209 | Bo7g003330.1 | 1371 | 1209(99.0) | |
| Bra036703 | Bol038764 (C09) ** | 459 | Bo28705s010.1 ** | 207 | 207(100.0) | ||
| Bol038765 (C09) ** | 459 | Bo28705s010.1 ** | 207 | 207(100.0) | |||
| Bol029775 (Cun) | 1008 | Bo7g003330.1 | 1371 | 991(89.0) | |||
| UGT74B1 * | Bra024634 | Bol005786 (C05) | 1311 | Bo5g041080.1 | 1401 | 1311(99.0) | |
| TGG1 | Breakdown aliphatic and indolic GSLs | Bra039825 | Bol017328 (C07) | 822 | Bo6g095780.1 | 411 | 373(99.0) |
| Bra039824 | |||||||
| Bra039823 | |||||||
| Bra016676 | |||||||
| Bra004012 | |||||||
| TGG2 | Bra036914 | Bol028319 (C08) | 1179 | Bo8g039420.1 | 1638 | 1163(99.0) | |
| Bol025706 (C03) | 663 | Bo2g155820.1 | 714 | 187(98.0) | |||
| TGG4 | |||||||
| TGG5 | Bol031599 (C07) | 1326 | Bo09266s010.1 | 163 | 163(100.0) | ||
| PEN2 | Bra004840 | Bol030092 (C04) | 1299 | Bo4g023800.1 | 3350 | 937(99.0) | |
| Bra004839 |
| Gene Name | Acc. Number | cDNA Size | Forward | Reverse | Product Size (bp) |
|---|---|---|---|---|---|
| Aliphatic GSL Pathway | |||||
| BCAT-4 | Bol018130 | 1083 | TACGCGAATGTGAAGTGGGA | CCCCTTCTTATCCTCGACCC | 987 |
| Bol026690 | 1083 | TACGCGAATGTGAAGTGGGA | CACCGTCCACCCCTTCTTAT | 996 | |
| MAM1/2 | Bol017071 | 1236 | TGTTGCCCAGTGTGGAAAGG | TGAATGATACAGTTGGCTCCA | 970 |
| Bol020647 | 1518 | GTGACGGCGAACAATCTCC | AGCTTTCCAAGAACAATGCCT | 1000 | |
| Bol020646 | 804 | AATGATCCCTACCACCGGTTCAAACA | CTTGCGGCATGTTGATCTCC | 650 | |
| Bol037823 | 1302 | CAAGCTTCCCGACACGAATT | CGTCCGCTAAGCTTTCCAAG | 975 | |
| Bol017070 | 1527 | GCTCTTACTCCACCGCAGAA | CAACCCCAACATCTTCTGGC | 937 | |
| MAM3 | Bol016496 | 759 | CTACCGCCAACACAATCTC | CGTCCGTAATCCTCTTTTTCT | 504 |
| CYP79F1 | Bol038222 | 1551 | GAACCATCGGAGGCAATCAC | AGGTGACGCTCTGGTTTGTA | 970 |
| CYP83A1 | Bol040365 | 1506 | ATGTCAACTTCACGAACCGG | GTTAGGGCCCCACTCTTTCT | 953 |
| Bol005188 | 570 | GGGGTTAACGTTCGTCACTG | GAGCCCAGTCATGACATCCA | 442 | |
| GSTF11 | Bol000843 | 633 | TTGGGCAGATAAAAGCAGGT | GCAGCCATTTCCATAAGTTGC | 610 |
| GSTU20 | Bol021558 | 654 | CTGGCCAAGCATGTTCTGTA | TTCCTAAACTCAGCGGCGTA | 612 |
| UGT74C1 | Bol006450 | 1371 | CACACGAACACCCTCAAACC | AGCCTTCACTCTAACCCCAA | 989 |
| Bol014127 | 1371 | CCCTCACGCCAAGATCAAAG | CGGTCTTCACTCTAACCCCA | 980 | |
| ST5b | Bol026202 | 1035 | CGTACCGAACCAAGACAAGA | ACCATGTTCAAGCAAACCTGT | 1000 |
| Bol026201 | 1035 | GGACCAAACCAGGACGAGA | ACCATGTTCAAGCAAACCTGT | 999 | |
| ST5c | Bol030757 | 1014 | TCCAAATCCGAAAACGACGT | GCAAGAAAGCCAGTTCCTCT | 995 |
| FMOGS-OX2 | Bol010993 | 1386 | AGTCTCTCCGAACCAACCTC | AACCACATTCTTCTGCGACC | 978 |
| FMOGS-OX5 | Bol029100 | 1347 | CATAGTCCACTCCAGCGTCT | ACTTGCTCGGCTATCCAGTT | 993 |
| Bol031350 | 1380 | AACCGTAGTCCACTCTAGCG | CTGACCGACGACACCAAGA | 970 | |
| GSL-OH | Bol033373 | 243 | GATTGTGCAAAAGGCTTGT | AGAGCATTAGGATTAGGAGGA | 188 |
| Bol033374 | same as Bol033374 CDS | ||||
| AOP2 | Bo9g006240.1 | CCAGGAAGTGAGAAGTGGGT | TAGCACCATCACCAGCATCA | 517 | |
| Bo2g102190.1 | GGAACGTGTCTCCAAAACCC | TAGCACCATCACCAGCATCA | 354 | ||
| Bo3g052110.1 | CCAGGAAGTGAGAAGTGGGT | ACCAACATCCGCACCAGTAT | 552 | ||
| Indolic GSL pathway | |||||
| CYP79B2 | Bol032767 | 1557 | GTCAAGTCCTCCTTAGCCGT | CTTGAAGAAGTCTCGCGAGC | 219 |
| Bol028852 | 1623 | ATCACCGTCACATGCCCTAA | CCAGCCCATATCGACTGAGA | 991 | |
| Bol018585 | 1626 | CACTCTTACCTCAAACTCTTC | TTTCTTCCGCTCTCTTCT | 530 | |
| Indolic GSL pathway | |||||
| CYP79B3 | Bol031784 | 1632 | CGTCATTCCAGTCACATGTCC | ACGACCAAGTCCGTAACG | 1000 |
| CYP83B1 | Bol033477 | 1473 | GGACCTCAATTTCACCGCTC | TCCACTCCTTTCTGCTCGTT | 999 |
| GSTF9 | Bol033376 | 648 | TGTACGGACCTCACTTTGCT | TCAAGAGTCTCCTTCCAAGCA | 613 |
| Bol004624 | 648 | TGTACGGACCTCACTTTGCT | AAGAGTCTCCTTCCACGCAG | 611 | |
| GSTF10 | Bol004625 | 648 | TTGGTGAAGTGCTTGACGTG | CCGGCAATGCGTATTTCTCA | 228 |
| ST5a | Bol039395 | 1014 | CGGTCTTCACTCTAACCCCA | TCATGTTCAAGCAAGCCAGT | 983 |
| Bol026200 | 1017 | GATCCCAACTCGAGCTCTCA | TCATGTTGAAGCAAGCCAGT | 985 | |
| CYP81F1 | Bol028913 | 1500 | GAGACCTCCGCAGTAACCTT | GTCCTCCGTCGGTCTTCTAG | 222 |
| Bol028914 | 1497 | ACTTGATCCTCATCCCTCTCC | CATCGGAGTGAGTTGTGTCAC | 483 | |
| Bol017375 | 369 | AAGCAGAGCGGTTCAAGAAG | GCGTGACCATTGTGTTACCA | 204 | |
| Bol017376 | 246 | CCGTCTCCTTCAACGGTTCT | CGACGTATTTACCGGTGAGC | 170 | |
| CYP81F2 | Bol012237 | 933 | CTACGGAGACCAGGTTCACA | GTCATAATGGGACGCTGATGG | 897 |
| Bol014239 | 1482 | CGTGATCTCTTCTTTGCCCC | TCATCCCATAGCTTCGGGTC | 978 | |
| Bol026044 | 1482 | CCAACTCCCTTTCCCATC | TTGCTTTCCCCATCTCTTC | 689 | |
| CYP81F3 | Bol032711 | 1491 | TCTCACCCAAAAACCAAC | CTCCCTCCCAATACTTTC | 637 |
| Bol028919 | 1500 | CCTTACTCTCTCCCCATC | CTCCATAATATCTCTTCCCC | 478 | |
| CYP81F4 | Bol032712 | 1506 | CGTAGTTGTATCGAACCGCC | TTTCTCCTTCTCCTCCACCG | 980 |
| Bol032714 | 960 | GTTTCAACCTCCCTCCCTCT | CTCTGGGTCTTGTTGTTGCA | 818 | |
| Bol028918 | 1503 | CACTCTCTCCCCATTATT | ACCATCTTTATTTCCCCTAC | 687 | |
| IGMT1 | Bol007029 | 1119 | GTGTTCCTCTCACCTTCCGA | GTGTTGAGGAAGACGCTGTC | 260 |
| Bol020663 | 342 | AGATGCCATGATCTTGAAACGT | CCAGCAATGATAAGCCTGACA | 298 | |
| IGMT2 | Bol007030 | 1125 | TAGGTTTGATGGCCGTGAGA | CGAATTTGCAATGGGTGAAGC | 999 |
| Both aliphatic and indolic GSL pathway | |||||
| GGP1 | Bol033672 | 753 | TGTTTCTAGCAACTCCTGATTCA | AGTTCTTGCAAATCGTCTCCA | 699 |
| Bol018073 | 753 | TGTTTCTTGCAACTCCTGATTCA | AAATTCTTGCAAATCGTCTCCAA | 700 | |
| Bol012989 | 753 | TGTTTCTAGCGACTCTTGATTCA | AAATTCTTGCAAATCGTCTCCAA | 700 | |
| SUR1 | Bol038767 | 1209 | TCCGCACCTGTATCGAGG | CTCATCCAGTTCTTCACCCC | 1000 |
| Bol038764 | 459 | CTTCCGTCTATCCTTGCTT | CTGTATCTGTCTTCTTGGT | 360 | |
| Bol038765 | same as Bol038764 CDS | ||||
| Both aliphatic and indolic GSL pathway | |||||
| UGT74B1 | Bol029775 | 1008 | TGGTTCCCGCGTTTAAAACT | AGTGGAAGGGTCAGGAGTTA | 923 |
| Bol005786 | 1311 | AATCCTTCAAGCTCAACGGC | TCAAACACCTCACCACCTCA | 993 | |
| Breakdown of aliphatic and indolic GSLs | |||||
| TGG1 | Bol017328 | 822 | TCTTAACGTGTGGGATGGCT | CCTCCTTTGTTCACTCCCCT | 210 |
| TGG2 | Bol028319 | 1179 | AGATGTGCTGGACGAACTCA | CGGCGTAACAGGTAGGATCA | 401 |
| Bol025706 | 663 | CGTTTGGGATGGCTTCAGTC | TTCCTCGGTGAAGTTGGGAA | 421 | |
| TGG5 | Bol031599 | 1326 | TGCAGCACATAGAGCACTT | CGGTTCCAGAATCTCCTCC | 402 |
| PEN2 | Bol030092 | 1299 | GCATCATCATCCAACAGCGT | ACGCCTTGATCAGTTCTCCA | 207 |
| Transcription factors for aliphatic and indolic GSL pathways | |||||
| MYB28 | Bol007795 | 558 | GAGAGGTTCCTTGAGTTGCAAC | GAGAAATCGTAACCCTGATCCA | 238 |
| Bol036286 | 615 | GAAGGTAGCTTGAATGCTAATAC | TATGAGATGCTTTCCGAGGG | 414 | |
| Bol017019 | 426 | GTTGCGGCTAAGGTCACTTCT | CAGAAGTAGCGTTGATCTCATGC | 223 | |
| Bol036743 | 426 | GGTTTCTTGGGCGCTGCTAC | CCTCGATCATCAACGCTTGTT | 328 | |
| MYB29 | Bol008849 | 513 | CGCCCAAGACTTCTGAGTT | TGATATTGCCCATGGAAGCTG | 234 |
| MYB34 | Bol017062 | 951 | TGAGAACACCATGCTGCAAA | ACGAGCTTACAAACTTCTCCA | 918 |
| Bol007760 | 843 | ACCATGTTGCAAAGAAGAAGGA | CCAAACCATCTTCTTCGTTCCA | 812 | |
| Bol036262 | 294 | GGTTTCTCCGACAACTGTTCT | ACGAACTCACAAACTTCTCCA | 250 | |
| MYB51 | Bol013207 | 1002 | GCTTGTCTCCTACGTCAACC | GTCCTCCTCAAGAAACCTCGA | 850 |
| Bol030761 | 990 | GGACTCCCGAGGAAGATCAG | CCTCGACGTCATTGTTCACA | 537 | |
| MYB122 | Bol026204 | 981 | CCTTAGGGCCATCATCAGCT | ACCAGTTGTCAATCCCTTCAA | 510 |
| Dof1.1 | Bol023400 | 1005 | GACGAAACATAGCAGCTCCG | ACCGGGTTGTTCTTCCATCT | 227 |
| Bol041144 | 1011 | TTGGTCACAGCCTACGAACT | TCGTTAGAAGAAGGACCCGA | 975 | |
| Bol006511 | 936 | CCAATTGGTCACAGCCTACG | AGAAGGACCCGAGAAATCCG | 896 | |
| IQD1 | Bol023096 | 1656 | GGGGTAATTGGAACGACAGC | CTTTCCAACCAGCTCCAACC | 202 |
| Bol033935 | 1437 | CCACAAAACCAGCCGATGAA | AGGATCGTCTTGGTTTGGGT | 273 | |
| TFL2 | Bol021358 | 1146 | ACGATGCTGCTGAGAAGTCT | CCTGGTCCCCTTAACTCGTT | 199 |
| Bol000201 | 1236 | CTCTGCGGTTCAGGAGATGGG | CTCCAACACACCAGGATACTC | 381 | |
| Bol019784 | same as Bol000201 CDS | ||||
| Bol034455 | 999 | CTATCCGTCATAAGCGAGTTC | CGATGTCCAAGTTTGGTGTC | 531 | |
2.4. Extraction of Desulfo-Glucosinolates and HPLC Analysis
2.5. Statistical Analysis
3. Results and Discussion
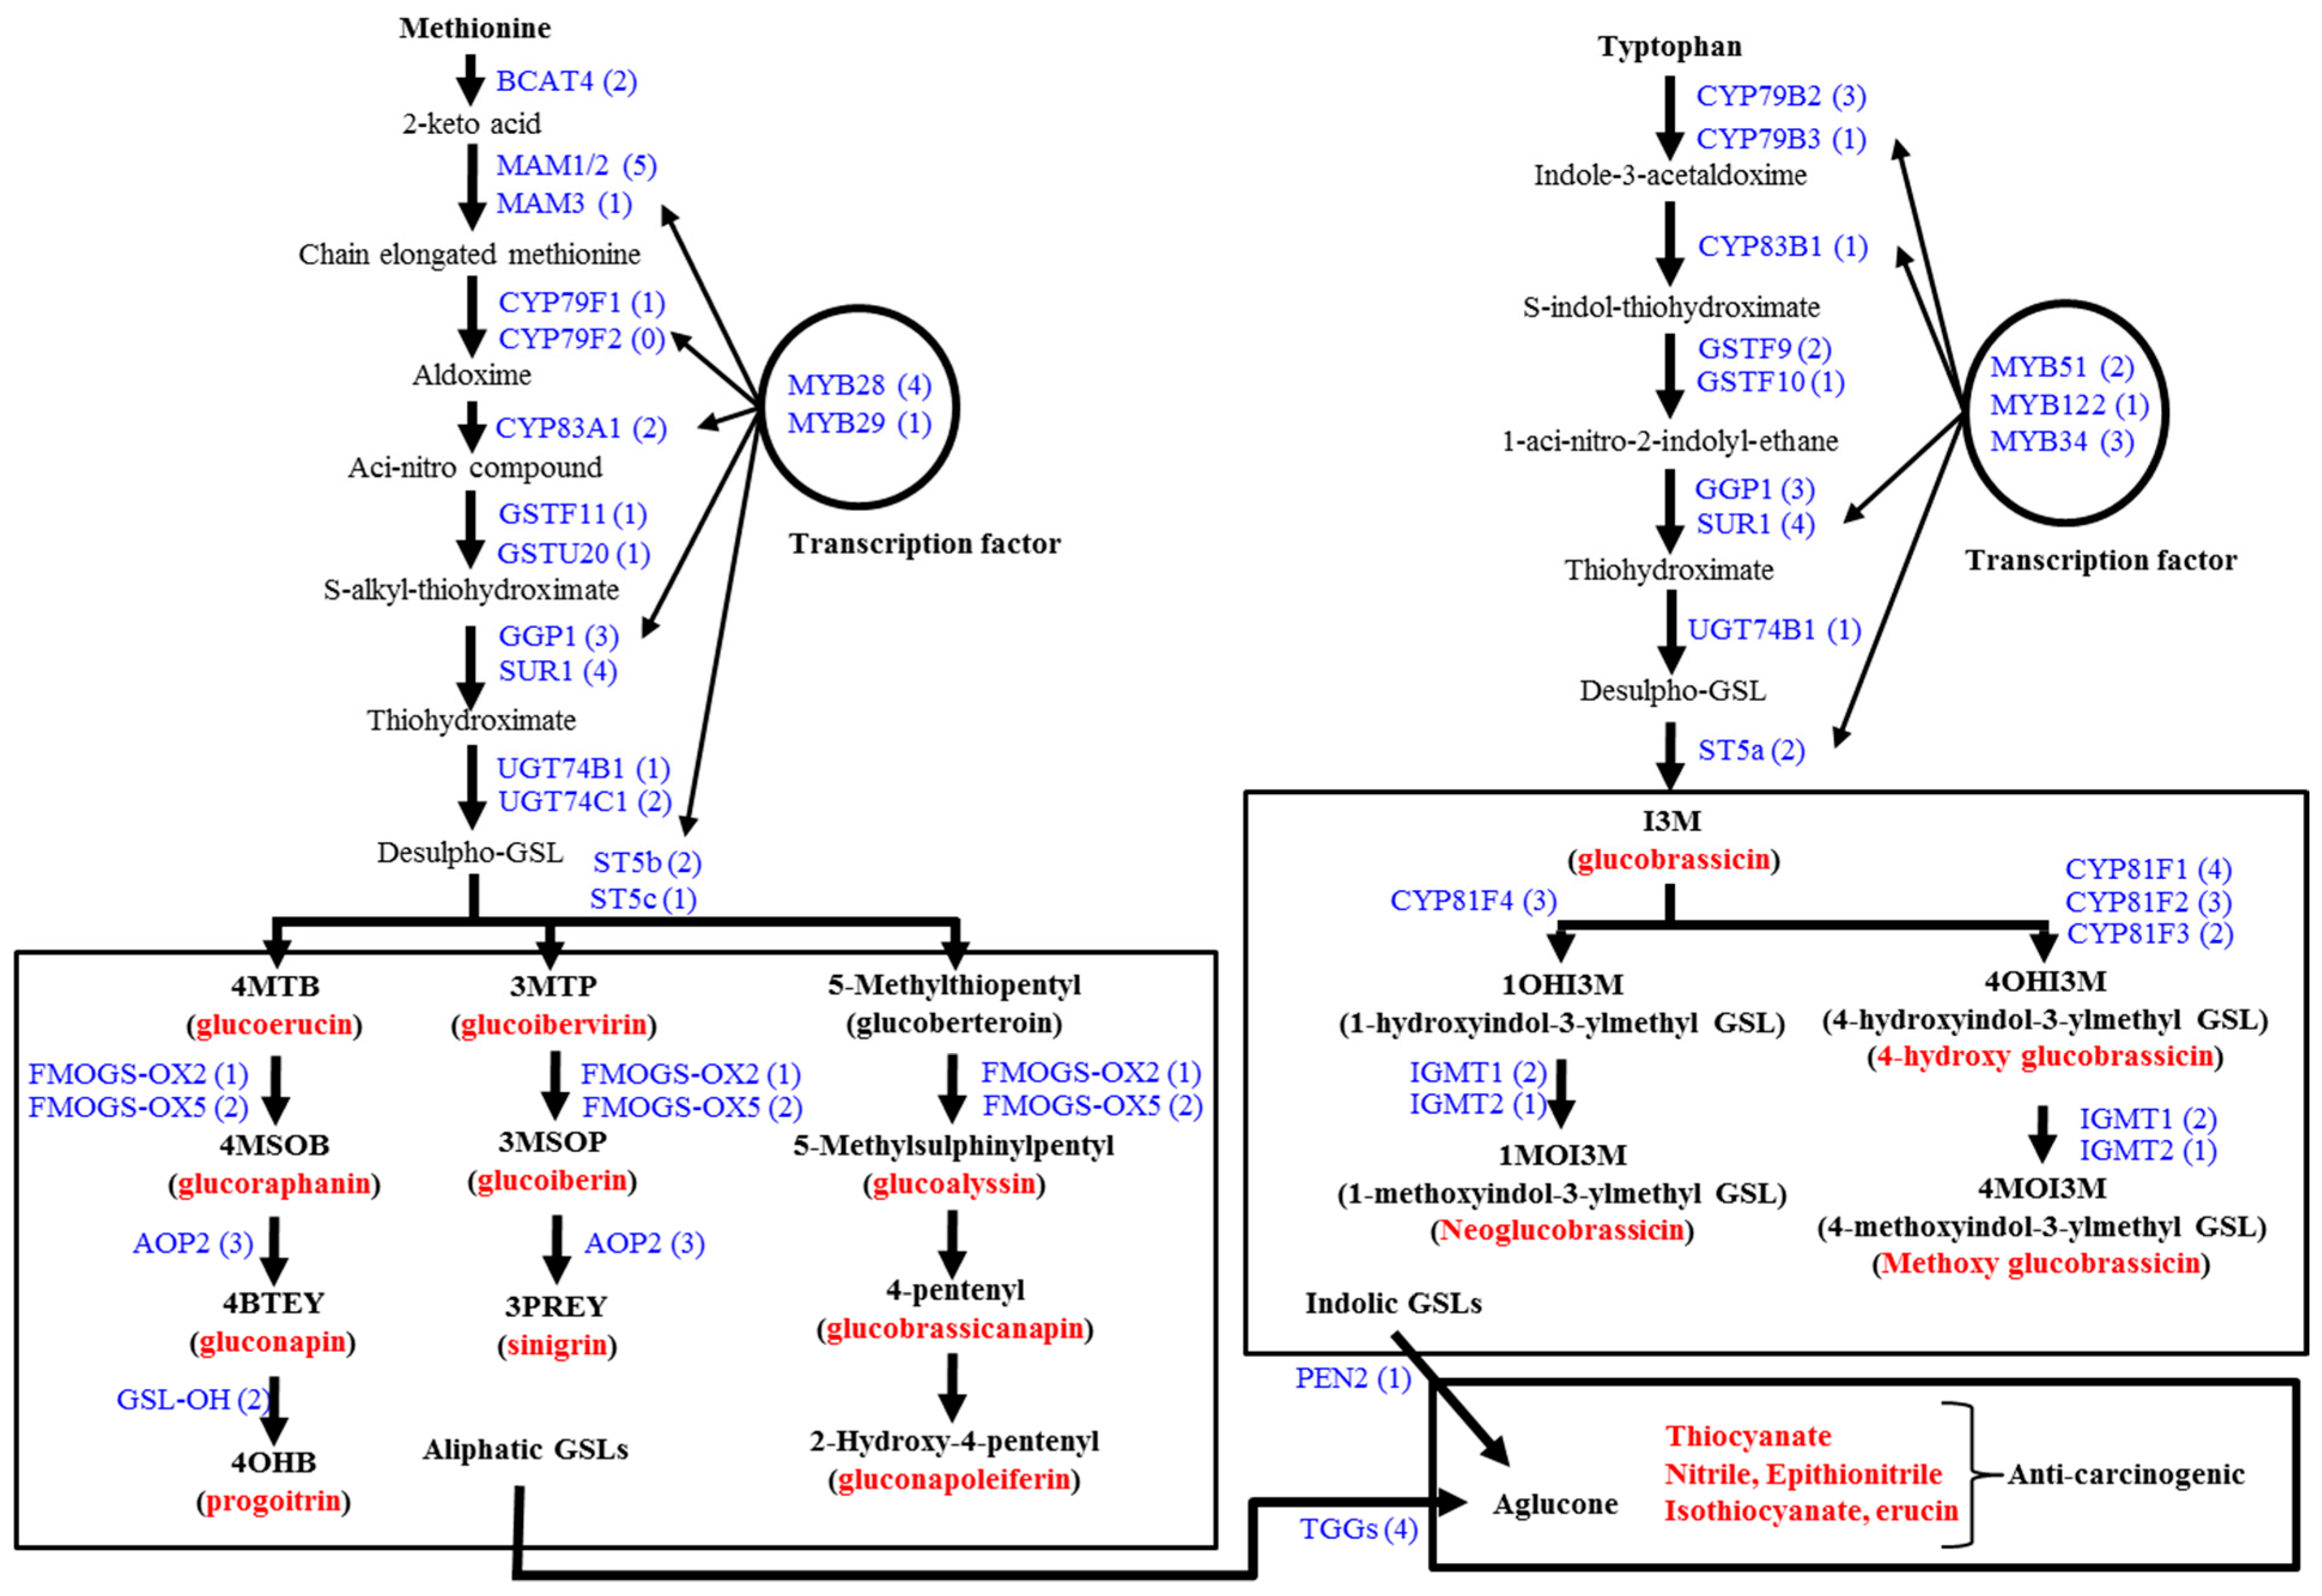
3.1. Genes Related to Glucosinolate Biosynthesis and Breakdown
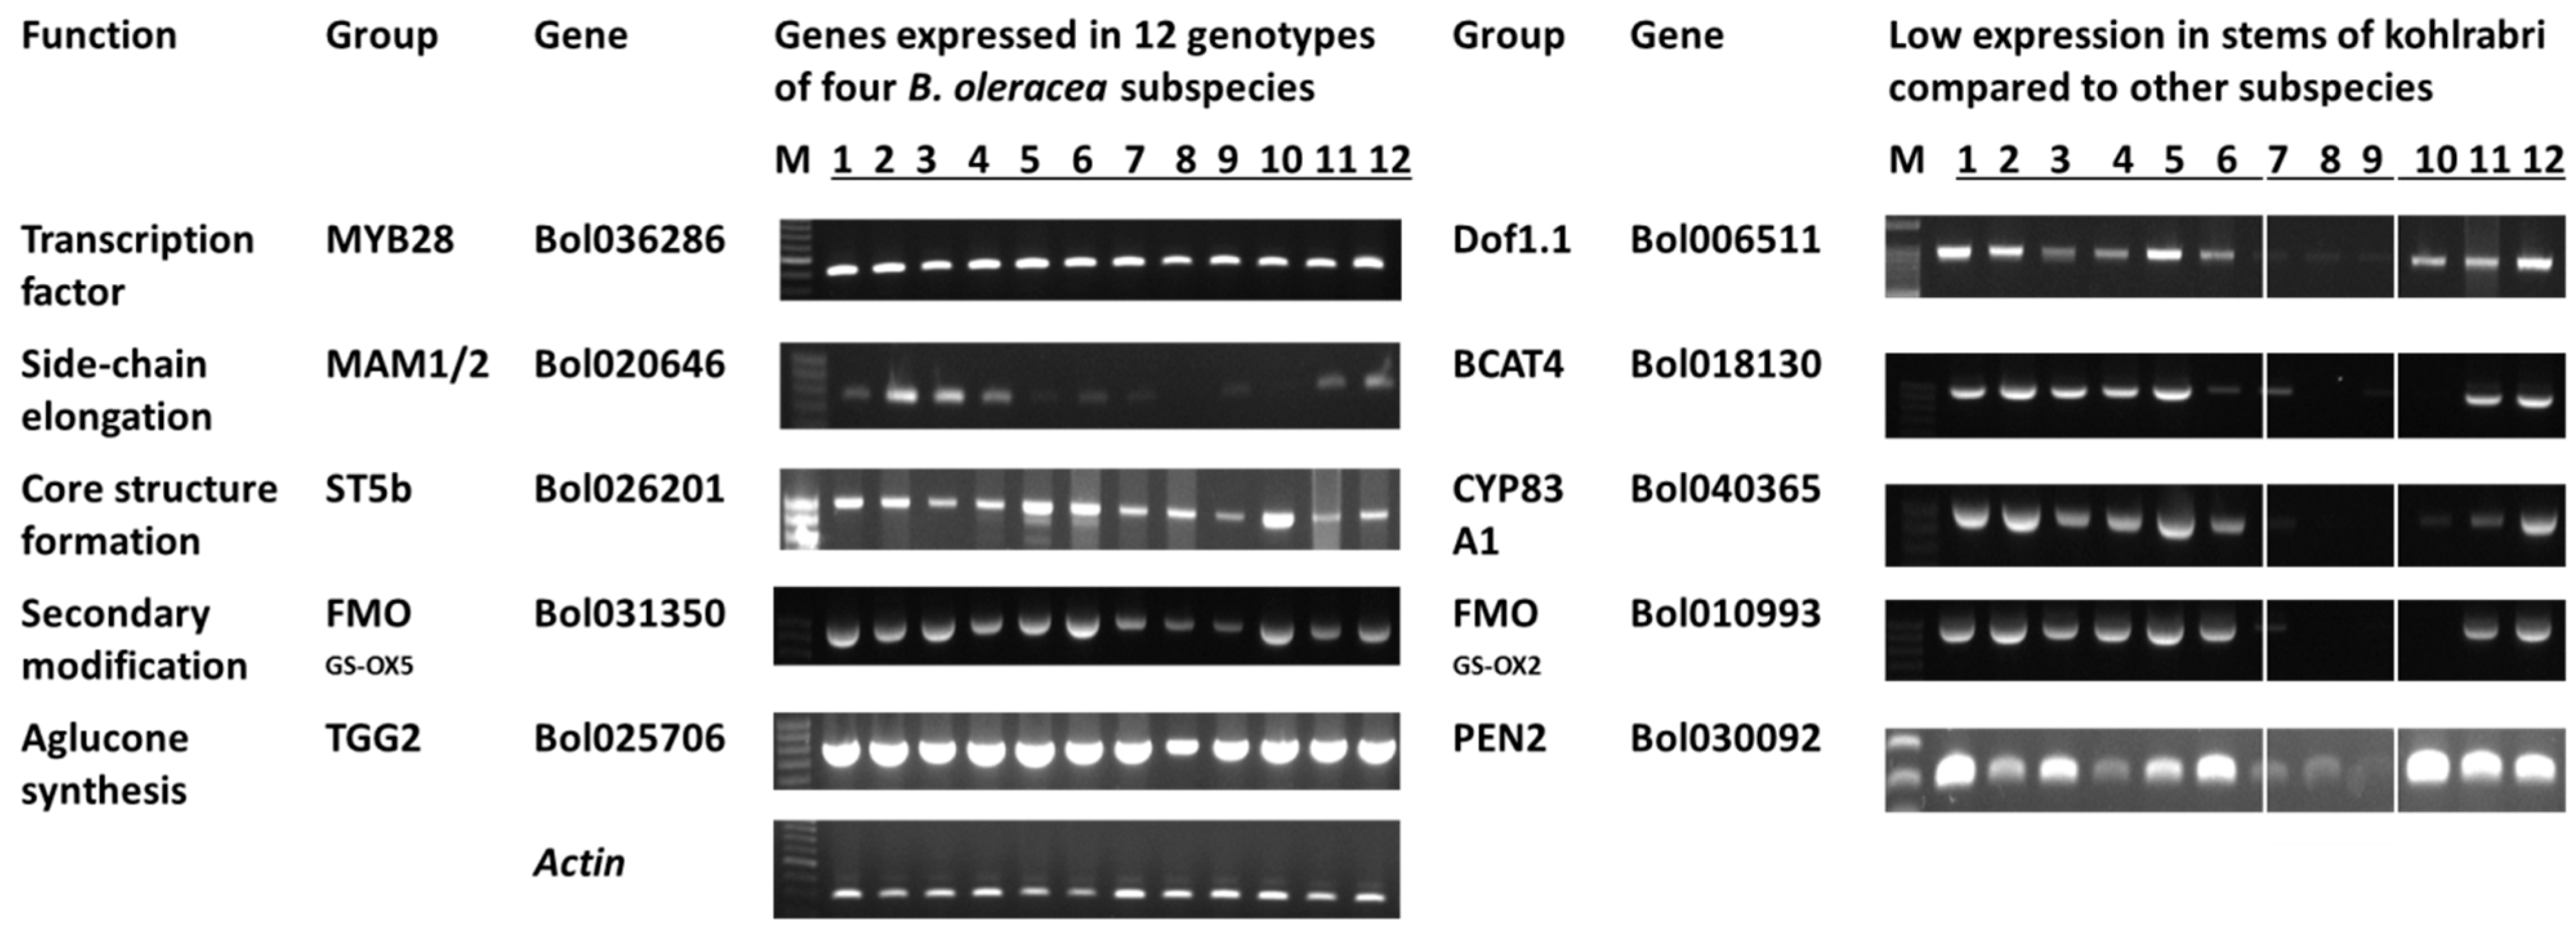
3.2. Glucosinolate-Related Gene Expression in B. oleracea Subspecies
3.3. Glucosinolate Analysis in B. oleracea Subspecies
| Common Name (Edible Organ) | Aliphatic | Indolic | Aromatic | |||||||||||||
|---|---|---|---|---|---|---|---|---|---|---|---|---|---|---|---|---|
| GER | GRA | GNA | PRO | GIV | GIB | SIN | GAL | GBN | GNL | GRE | GBS | 4HGBS | MGBS | NGBS | GST | |
| Cabbage (Leaf) | 0.090 | 1.024 | 0.000b | 0.126 | 0.004b | 1.176 | 0.065 | 0.000 | 0.020ab | 0.000 | 0.851 | 1.906 | 0.000 | 0.078b | 0.105 | 0.141ab |
| Kale (Leaf) | 0.000 | 0.204 | 0.000b | 0.148 | 0.000b | 0.427 | 0.201 | 0.000 | 0.013ab | 0.000 | 0.074 | 1.146 | 0.000 | 0.126b | 0.637 | 0.119ab |
| Kohlrabi (Stem) | 0.000 | 0.303 | 0.000b | 0.333 | 2.115a | 1.247 | 0.601 | 0.000 | 0.071a | 0.000 | 0.079 | 0.434 | 0.000 | 0.046b | 0.120 | 0.006b |
| Cauliflower (Floret) | 0.000 | 0.060 | 0.053a | 0.080 | 0.000b | 0.406 | 0.073 | 0.115 | 0.006b | 0.117 | 0.524 | 0.252 | 0.044 | 1.093a | 0.621 | 1.185a |
| SE | 0.255 | 0.009 | 0.040 | 0.323 | 0.318 | 0.133 | 0.029 | 0.010 | 0.029 | 0.211 | 0.493 | 0.008 | 0.165 | 0.171 | 0.187 | 0.187 |
| p (subspecies) | 0.44 | 0.61 | 0.052 | 0.10 | 0.011 | 0.73 | 0.50 | 0.44 | 0.06 | 0.44 | 0.55 | 0.69 | 0.07 | 0.033 | 0.57 | 0.056 |
3.4. Discussion
4. Conclusions
Supplementary Information
Acknowledgments
Author Contributions
Conflicts of Interest
References
- Rodman, J.E.; Karol, K.G.; Price, R.A.; Sytsma, K.J. Molecules, morphology, and Dahlgren’s expanded order Capparales. Syst. Bot. 1996, 289–307. [Google Scholar] [CrossRef]
- Schonhof, I.; Krumbein, A.; Brückner, B. Genotypic effects on glucosinolates and sensory properties of broccoli and cauliflower. Food Nahr. 2004, 48, 25–33. [Google Scholar] [CrossRef] [PubMed]
- Padilla, G.; Cartea, M.E.; Velasco, P.; de Haro, A.; Ordás, A. Variation of glucosinolates in vegetable crops of Brassica rapa. Phytochemistry 2007, 68, 536–545. [Google Scholar] [CrossRef] [PubMed]
- Hayes, J.D.; Kelleher, M.O.; Eggleston, I.M. The cancer chemopreventive actions of phytochemicals derived from glucosinolates. Eur. J. Nutr. 2008, 47, 73–88. [Google Scholar] [CrossRef] [PubMed]
- Rask, L.; Andréasson, E.; Ekbom, B.; Eriksson, S.; Pontoppidan, B.; Meijer, J. Myrosinase: Gene family evolution and herbivore defense in Brassicaceae. In Plant Molecular Evolution; Springer: Dordrecht, The Netherlands, 2000; pp. 93–113. [Google Scholar]
- Wittstock, U.; Halkier, B.A. Cytochrome P450 CYP79A2 from Arabidopsis thaliana L. catalyzes the conversion of l-phenylalanine to phenylacetaldoxime in the biosynthesis of benzylglucosinolate. J. Biol. Chem. 2000, 275, 14659–14666. [Google Scholar] [CrossRef] [PubMed]
- Bones, A.M.; Rossiter, J.T. The enzymic and chemically induced decomposition of glucosinolates. Phytochemistry 2006, 67, 1053–1067. [Google Scholar] [CrossRef] [PubMed]
- Keck, A.S.; Finley, J.W. Cruciferous vegetables: Cancer protective mechanisms of glucosinolate hydrolysis products and selenium. Integr. Cancer Ther. 2004, 3, 5–12. [Google Scholar] [CrossRef] [PubMed]
- Zhang, Y.; Kensler, T.W.; Cho, C.G.; Posner, G.H.; Talalay, P. Anticarcinogenic activities of sulforaphane and structurally related synthetic norbornyl isothiocyanates. Proc. Natl. Acad. Sci. USA 1994, 91, 3147–3150. [Google Scholar] [CrossRef] [PubMed]
- Choi, H.S.; Cho, M.C.; Lee, H.G.; Yoon, D.Y. Indole-3-carbinol induces apoptosis through p53 and activation of caspase-8 pathway in lung cancer A549 cells. Food Chem. Toxicol. 2010, 48, 883–890. [Google Scholar] [CrossRef] [PubMed]
- Hecht, S.S. Inhibition of carcinogenesis by isothiocyanates 1 *. Drug Metab. Rev. 2000, 32, 395–411. [Google Scholar] [CrossRef] [PubMed]
- Nakajima, M.; Yoshida, R.; Shimada, N.; Yamazaki, H.; Yokoi, T. Inhibition and inactivation of human cytochrome P450 isoforms by phenethyl isothiocyanate. Drug Metab. Dispos. 2001, 29, 1110–1113. [Google Scholar] [PubMed]
- Halkier, B.A.; Gershenzon, J. Biology and biochemistry of glucosinolates. Annu. Rev. Plant Biol. 2006, 57, 303–333. [Google Scholar] [CrossRef] [PubMed]
- Kusznierewicz, B.; Bartoszek, A.; Wolska, L.; Drzewiecki, J.; Gorinstein, S.; Namieśnik, J. Partial characterization of white cabbages (Brassica oleracea var. capitata f. alba) from different regions by glucosinolates, bioactive compounds, total antioxidant activities and proteins. LWT-Food Sci. Technol. 2008, 41, 1–9. [Google Scholar]
- Fahey, J.W.; Haristoy, X.; Dolan, P.M.; Kensler, T.W.; Scholtus, I.; Stephenson, K.K.; Lozniewski, A. Sulforaphane inhibits extracellular, intracellular, and antibiotic-resistant strains of Helicobacter pylori and prevents benzo [a] pyrene-induced stomach tumors. Proc. Natl. Acad. Sci. USA 2002, 99, 7610–7615. [Google Scholar] [CrossRef] [PubMed]
- Liu, Z.; Hirani, A.H.; McVetty, P.B.; Daayf, F.; Quiros, C.F.; Li, G. Reducing progoitrin and enriching glucoraphanin in Braasica napus seeds through silencing of the GSL-ALK gene family. Plant Mol. Biol. 2012, 79, 179–189. [Google Scholar] [CrossRef] [PubMed]
- Mithen, R.F. Glucosinolates and their degradation products. Adv. Bot. Res. 2001, 35, 213–262. [Google Scholar]
- Sønderby, I.E.; Hansen, B.G.; Bjarnholt, N.; Ticconi, C.; Halkier, B.A.; Kliebenstein, D.J. A systems biology approach identifies a R2R3 MYB gene subfamily with distinct and overlapping functions in regulation of aliphatic glucosinolates. PLoS ONE 2007, 2. [Google Scholar] [CrossRef] [PubMed]
- Grubb, C.D.; Abel, S. Glucosinolate metabolism and its control. Trends Plant Sci. 2006, 11, 89–100. [Google Scholar] [CrossRef] [PubMed]
- Sønderby, I.E.; Geu-Flores, F.; Halkier, B.A. Biosynthesis of glucosinolates-gene discovery and beyond. Trends Plant Sci. 2010, 15, 283–290. [Google Scholar] [CrossRef] [PubMed]
- Sørensen, H. Glucosinolates: Structure-properties-function. In Canola and Rapeseed; Springer: New York, NY, USA, 1990; pp. 149–172. [Google Scholar]
- Mikkelsen, M.D.; Petersen, B.L.; Olsen, C.E.; Halkier, B.A. Biosynthesis and metabolic engineering of glucosinolates. Amino Acids 2002, 22, 279–295. [Google Scholar] [CrossRef] [PubMed]
- Kroymann, J.; Textor, S.; Tokuhisa, J.G.; Falk, K.L.; Bartram, S.; Gershenzon, J.; Mitchell-Olds, T. A gene controlling variation in Arabidopsis glucosinolate composition is part of the methionine chain elongation pathway. Plant Physiol. 2001, 127, 1077–1088. [Google Scholar] [CrossRef] [PubMed]
- Textor, S.; de Kraker, J.W.; Hause, B.; Gershenzon, J.; Tokuhisa, J.G. MAM3 catalyzes the formation of all aliphatic glucosinolate chain lengths in Arabidopsis. Plant Physiol. 2007, 144, 60–71. [Google Scholar] [CrossRef] [PubMed]
- Gigolashvili, T.; Yatusevich, R.; Rollwitz, I.; Humphry, M.; Gershenzon, J.; Flügge, U.I. The plastidic bile acid transporter 5 is required for the biosynthesis of methionine-derived glucosinolates in Arabidopsis thaliana. Plant Cell 2009, 21, 1813–1829. [Google Scholar] [CrossRef] [PubMed]
- Sawada, Y.; Toyooka, K.; Kuwahara, A.; Sakata, A.; Nagano, M.; Saito, K.; Hirai, M.Y. Arabidopsis bile acid: Sodium symporter family protein 5 is involved in methionine-derived glucosinolate biosynthesis. Plant Cell Physiol. 2009, 50, 1579–1586. [Google Scholar] [CrossRef] [PubMed]
- Wittstock, U.; Halkier, B.A. Glucosinolate research in the Arabidopsis era. Trends Plant Sci. 2002, 7, 263–270. [Google Scholar] [CrossRef]
- Brader, G.; Mikkelsen, M.D.; Halkier, B.A.; Tapio Palva, E. Altering glucosinolate profiles modulates disease resistance in plants. Plant J. 2006, 46, 758–767. [Google Scholar] [CrossRef] [PubMed]
- Celenza, J.L.; Quiel, J.A.; Smolen, G.A.; Merrikh, H.; Silvestro, A.R.; Normanly, J.; Bender, J. The Arabidopsis ATR1 Myb transcription factor controls indolic glucosinolate homeostasis. Plant Physiol. 2005, 137, 253–262. [Google Scholar] [CrossRef] [PubMed]
- Levy, M.; Wang, Q.; Kaspi, R.; Parrella, M.P.; Abel, S. Arabidopsis IQD1, a novel calmodulin-binding nuclear protein, stimulates glucosinolate accumulation and plant defense. Plant J. 2005, 43, 79–96. [Google Scholar] [CrossRef] [PubMed]
- Skirycz, A.; Reichelt, M.; Burow, M.; Birkemeyer, C.; Rolcik, J.; Kopka, J.; Witt, I. DOF transcription factor AtDof1. 1 (OBP2) is part of a regulatory network controlling glucosinolate biosynthesis in Arabidopsis. Plant J. 2006, 47, 10–24. [Google Scholar] [CrossRef] [PubMed]
- Gigolashvili, T.; Berger, B.; Mock, H.P.; Müller, C.; Weisshaar, B.; Flügge, U.I. The transcription factor HIG1/MYB51 regulates indolic glucosinolate biosynthesis in Arabidopsis thaliana. Plant J. 2007, 50, 886–901. [Google Scholar] [CrossRef] [PubMed]
- Gigolashvili, T.; Yatusevich, R.; Berger, B.; Müller, C.; Flügge, U.I. The R2R3-MYB transcription factor HAG1/MYB28 is a regulator of methionine-derived glucosinolate biosynthesis in Arabidopsis thaliana. Plant J. 2007, 51, 247–261. [Google Scholar] [CrossRef] [PubMed]
- Gigolashvili, T.; Engqvist, M.; Yatusevich, R.; Müller, C.; Flügge, U.I. HAG2/MYB76 and HAG3/MYB29 exert a specific and coordinated control on the regulation of aliphatic glucosinolate biosynthesis in Arabidopsis thaliana. New Phytol. 2008, 177, 627–642. [Google Scholar] [CrossRef] [PubMed]
- Liu, S.; Liu, Y.; Yang, X.; Tong, C.; Edwards, D.; Parkin, I.A.; Waminal, N.E. The Brassica oleracea genome reveals the asymmetrical evolution of polyploid genomes. Nat. Commun. 2014, 5. [Google Scholar] [CrossRef] [PubMed]
- Araki, R.; Hasumi, A.; Nishizawa, O.I.; Sasaki, K.; Kuwahara, A.; Sawada, Y.; Totoki, Y.; Toyoda, A.; Sakaki, Y.; Li, Y.; et al. Novel bioresources for studies of Brassica oleracea: Identification of a kale MYB transcription factor responsible for glucosinolate production. Plant Biotechnol. J. 2013, 11, 1017–1027. [Google Scholar] [CrossRef] [PubMed]
- Maruyama-Nakashita, A.; Nakamura, Y.; Tohge, T.; Saito, K.; Takahashi, H. Arabidopsis SLIM1 is a central transcriptional regulator of plant sulfur response and metabolism. Plant Cell 2006, 18, 3235–3251. [Google Scholar] [CrossRef] [PubMed]
- Hirai, M.Y.; Sugiyama, K.; Sawada, Y.; Tohge, T.; Obayashi, T.; Suzuki, A.; Saito, K. Omics-based identification of Arabidopsis Myb transcription factors regulating aliphatic glucosinolate biosynthesis. Proc. Natl. Acad. Sci. USA 2007, 104, 6478–6483. [Google Scholar] [CrossRef] [PubMed]
- Malitsky, S.; Blum, E.; Less, H.; Venger, I.; Elbaz, M.; Morin, S.; Aharoni, A. The transcript and metabolite networks affected by the two clades of Arabidopsis glucosinolate biosynthesis regulators. Plant Physiol. 2008, 148, 2021–2049. [Google Scholar] [CrossRef] [PubMed]
- Halkier, B.A.; Du, L. The biosynthesis of glucosinolates. Trends Plant Sci. 1997, 2, 425–431. [Google Scholar] [CrossRef]
- Yatusevich, R.; Mugford, S.G.; Matthewman, C.; Gigolashvili, T.; Frerigmann, H.; Delaney, S.; Kopriva, S. Genes of primary sulfate assimilation are part of the glucosinolate biosynthetic network in Arabidopsis thaliana. Plant J. 2010, 62, 1–11. [Google Scholar] [CrossRef] [PubMed]
- Wang, H.; Wu, J.; Sun, S.; Liu, B.; Cheng, F.; Sun, R.; Wang, X. Glucosinolate biosynthetic genes in Brassica rapa. Gene 2011, 487, 135–142. [Google Scholar] [CrossRef] [PubMed]
- Augustine, R.; Majee, M.; Gershenzon, J.; Bisht, N.C. Four genes encoding MYB28, a major transcriptional regulator of the aliphatic glucosinolate pathway, are differentially expressed in the allopolyploid Brassica juncea. J. Exp. Bot. 2013, 64, 4907–4921. [Google Scholar] [CrossRef] [PubMed]
- Kim, Y.B.; Li, X.; Kim, S.J.; Kim, H.H.; Lee, J.; Kim, H.; Park, S.U. MYB transcription factors regulate glucosinolate biosynthesis in different organs of Chinese cabbage (Brassica rapa ssp. pekinensis). Molecules 2013, 18, 8682–8695. [Google Scholar] [CrossRef] [PubMed]
- Manoli, A.; Sturaro, A.; Trevisan, S.; Quaggiotti, S.; Nonis, A. Evaluation of candidate reference genes for qPCR in maize. J. Plant Physiol. 2012, 169, 807–815. [Google Scholar] [CrossRef] [PubMed]
- Han, X.; Lu, M.; Chen, Y.; Zhan, Z.; Cui, Q.; Wang, Y. Selection of reliable reference genes for gene expression studies using real-time PCR in tung tree during seed development. PLoS ONE 2012, 7. [Google Scholar] [CrossRef] [PubMed]
- Choi, S.H.; Park, S.; Lim, Y.P.; Kim, S.J.; Park, J.T.; An, G. Metabolite profiles of glucosinolates in cabbage varieties (Brassica oleracea var. capitata) by season, color, and tissue position. Hortic. Environ. Biotechnol. 2014, 55, 237–247. [Google Scholar]
- Frerigmann, H.; Berger, B.; Gigolashvili, T. bHLH05 is an interaction partner of MYB51 and a novel regulator of glucosinolate biosynthesis in Arabidopsis. Plant Physiol. 2014, 166, 349–369. [Google Scholar] [CrossRef] [PubMed]
- Reintanz, B.; Lehnen, M.; Reichelt, M.; Gershenzon, J.; Kowalczyk, M.; Sandberg, G.; Palme, K. Bus, a bushy Arabidopsis CYP79F1 knockout mutant with abolished synthesis of short-chain aliphatic glucosinolates. Plant Cell 2001, 13, 351–367. [Google Scholar] [CrossRef] [PubMed]
- Douglas Grubb, C.; Zipp, B.J.; Ludwig-Müller, J.; Masuno, M.N.; Molinski, T.F.; Abel, S. Arabidopsis glucosyltransferase UGT74B1 functions in glucosinolate biosynthesis and auxin homeostasis. Plant J. 2004, 40, 893–908. [Google Scholar] [CrossRef] [PubMed]
- Mikkelsen, M.D.; Hansen, C.H.; Wittstock, U.; Halkier, B.A. Cytochrome P450 CYP79B2 from Arabidopsis catalyzes the conversion of tryptophan to indole-3-acetaldoxime, a precursor of indole glucosinolates and indole-3-acetic acid. J. Biol. Chem. 2000, 275, 33712–33717. [Google Scholar] [CrossRef] [PubMed]
- Zang, Y.X.; Kim, H.U.; Kim, J.A.; Lim, M.H.; Jin, M.; Lee, S.C.; Park, B.S. Genome-wide identification of glucosinolate synthesis genes in Brassica rapa. FEBS J. 2009, 276, 3559–3574. [Google Scholar] [CrossRef] [PubMed]
- Kabouw, P.; Biere, A.; van der Putten, W.H.; van Dam, N.M. Intra-specific differences in root and shoot glucosinolate profiles among white cabbage (Brassica oleracea var. capitata) cultivars. J. Agric. Food Chem. 2009, 58, 411–417. [Google Scholar] [CrossRef] [PubMed] [Green Version]
- Velasco, P.; Cartea, M.E.; González, C.; Vilar, M.; Ordás, A. Factors affecting the glucosinolate content of kale (Brassica oleracea acephala group). J. Agric. Food Chem. 2007, 55, 955–962. [Google Scholar] [CrossRef] [PubMed]
- Cartea, M.E.; Velasco, P. Glucosinolates in Brassica foods: Bioavailability in food and significance for human health. Phytochem. Rev. 2008, 7, 213–229. [Google Scholar] [CrossRef]
- Wang, J.; Gu, H.; Yu, H.; Zhao, Z.; Sheng, X.; Zhang, X. Genotypic variation of glucosinolates in broccoli (Brassica oleracea var. italica) florets from China. Food Chem. 2012, 133, 735–741. [Google Scholar]
- Cartea, M.E.; Velasco, P.; Obregón, S.; Padilla, G.; de Haro, A. Seasonal variation in glucosinolate content in Brassica oleracea crops grown in northwestern Spain. Phytochemistry 2008, 69, 403–410. [Google Scholar] [CrossRef] [PubMed]
- Vallejo, F.; Tomás-Barberán, F.A.; Benavente-García, A.G.; García-Viguera, C. Total and individual glucosinolate contents in inflorescences of eight broccoli cultivars grown under various climatic and fertilisation conditions. J. Sci. Food Agric. 2003, 83, 307–313. [Google Scholar] [CrossRef]
- Brown, A.F.; Yousef, G.G.; Jeffery, E.H.; Klein, B.P.; Wallig, M.A.; Kushad, M.M.; Juvik, J.A. Glucosinolate profiles in broccoli: Variation in levels and implications in breeding for cancer chemoprotection. J. Am. Soc. Hortic. Sci. 2002, 127, 807–813. [Google Scholar]
- Farnham, M.W.; Wilson, P.E.; Stephenson, K.K.; Fahey, J.W. Genetic and environmental effects on glucosinolate content and chemoprotective potency of broccoli. Plant Breed. 2004, 123, 60–65. [Google Scholar] [CrossRef]
- Kim, S.J.; Matsuo, T.; Watanabe, M.; Watanabe, Y. Effect of nitrogen and sulphur application on the glucosinolate content in vegetable turnip rape (Brassica rapa L.). Soil Sci. Plant Nutr. 2002, 48, 43–49. [Google Scholar] [CrossRef]
- Rosen, C.J.; Fritz, V.A.; Gardner, G.M.; Hecht, S.S.; Carmella, S.G.; Kenney, P.M. Cabbage yield and glucosinolate concentrations as affected by nitrogen and sulfur fertility. HortScience 2005, 40, 1493–1498. [Google Scholar]
- Tripathi, M.K.; Mishra, A.S. Glucosinolates in animal nutrition: A review. Anim. Feed Sci. Technol. 2007, 132, 1–27. [Google Scholar] [CrossRef]
- Traka, M.; Mithen, R. Glucosinolates, isothiocyanates and human health. Phytochem. Rev. 2009, 8, 269–282. [Google Scholar] [CrossRef]
- Sample Availability: Seeds of the genotypes and cDNA are available from the authors.
© 2015 by the authors. Licensee MDPI, Basel, Switzerland. This article is an open access article distributed under the terms and conditions of the Creative Commons Attribution license ( http://creativecommons.org/licenses/by/4.0/).
Share and Cite
Yi, G.-E.; Robin, A.H.K.; Yang, K.; Park, J.-I.; Kang, J.-G.; Yang, T.-J.; Nou, I.-S. Identification and Expression Analysis of Glucosinolate Biosynthetic Genes and Estimation of Glucosinolate Contents in Edible Organs of Brassica oleracea Subspecies. Molecules 2015, 20, 13089-13111. https://doi.org/10.3390/molecules200713089
Yi G-E, Robin AHK, Yang K, Park J-I, Kang J-G, Yang T-J, Nou I-S. Identification and Expression Analysis of Glucosinolate Biosynthetic Genes and Estimation of Glucosinolate Contents in Edible Organs of Brassica oleracea Subspecies. Molecules. 2015; 20(7):13089-13111. https://doi.org/10.3390/molecules200713089
Chicago/Turabian StyleYi, Go-Eun, Arif Hasan Khan Robin, Kiwoung Yang, Jong-In Park, Jong-Goo Kang, Tae-Jin Yang, and Ill-Sup Nou. 2015. "Identification and Expression Analysis of Glucosinolate Biosynthetic Genes and Estimation of Glucosinolate Contents in Edible Organs of Brassica oleracea Subspecies" Molecules 20, no. 7: 13089-13111. https://doi.org/10.3390/molecules200713089