
Antioxidant Capacities and Analysis of Phenolic Compounds in Three Endemic Nolana Species by HPLC-PDA-ESI-MS


Abstract
:
1. Introduction

2. Results and Discussion
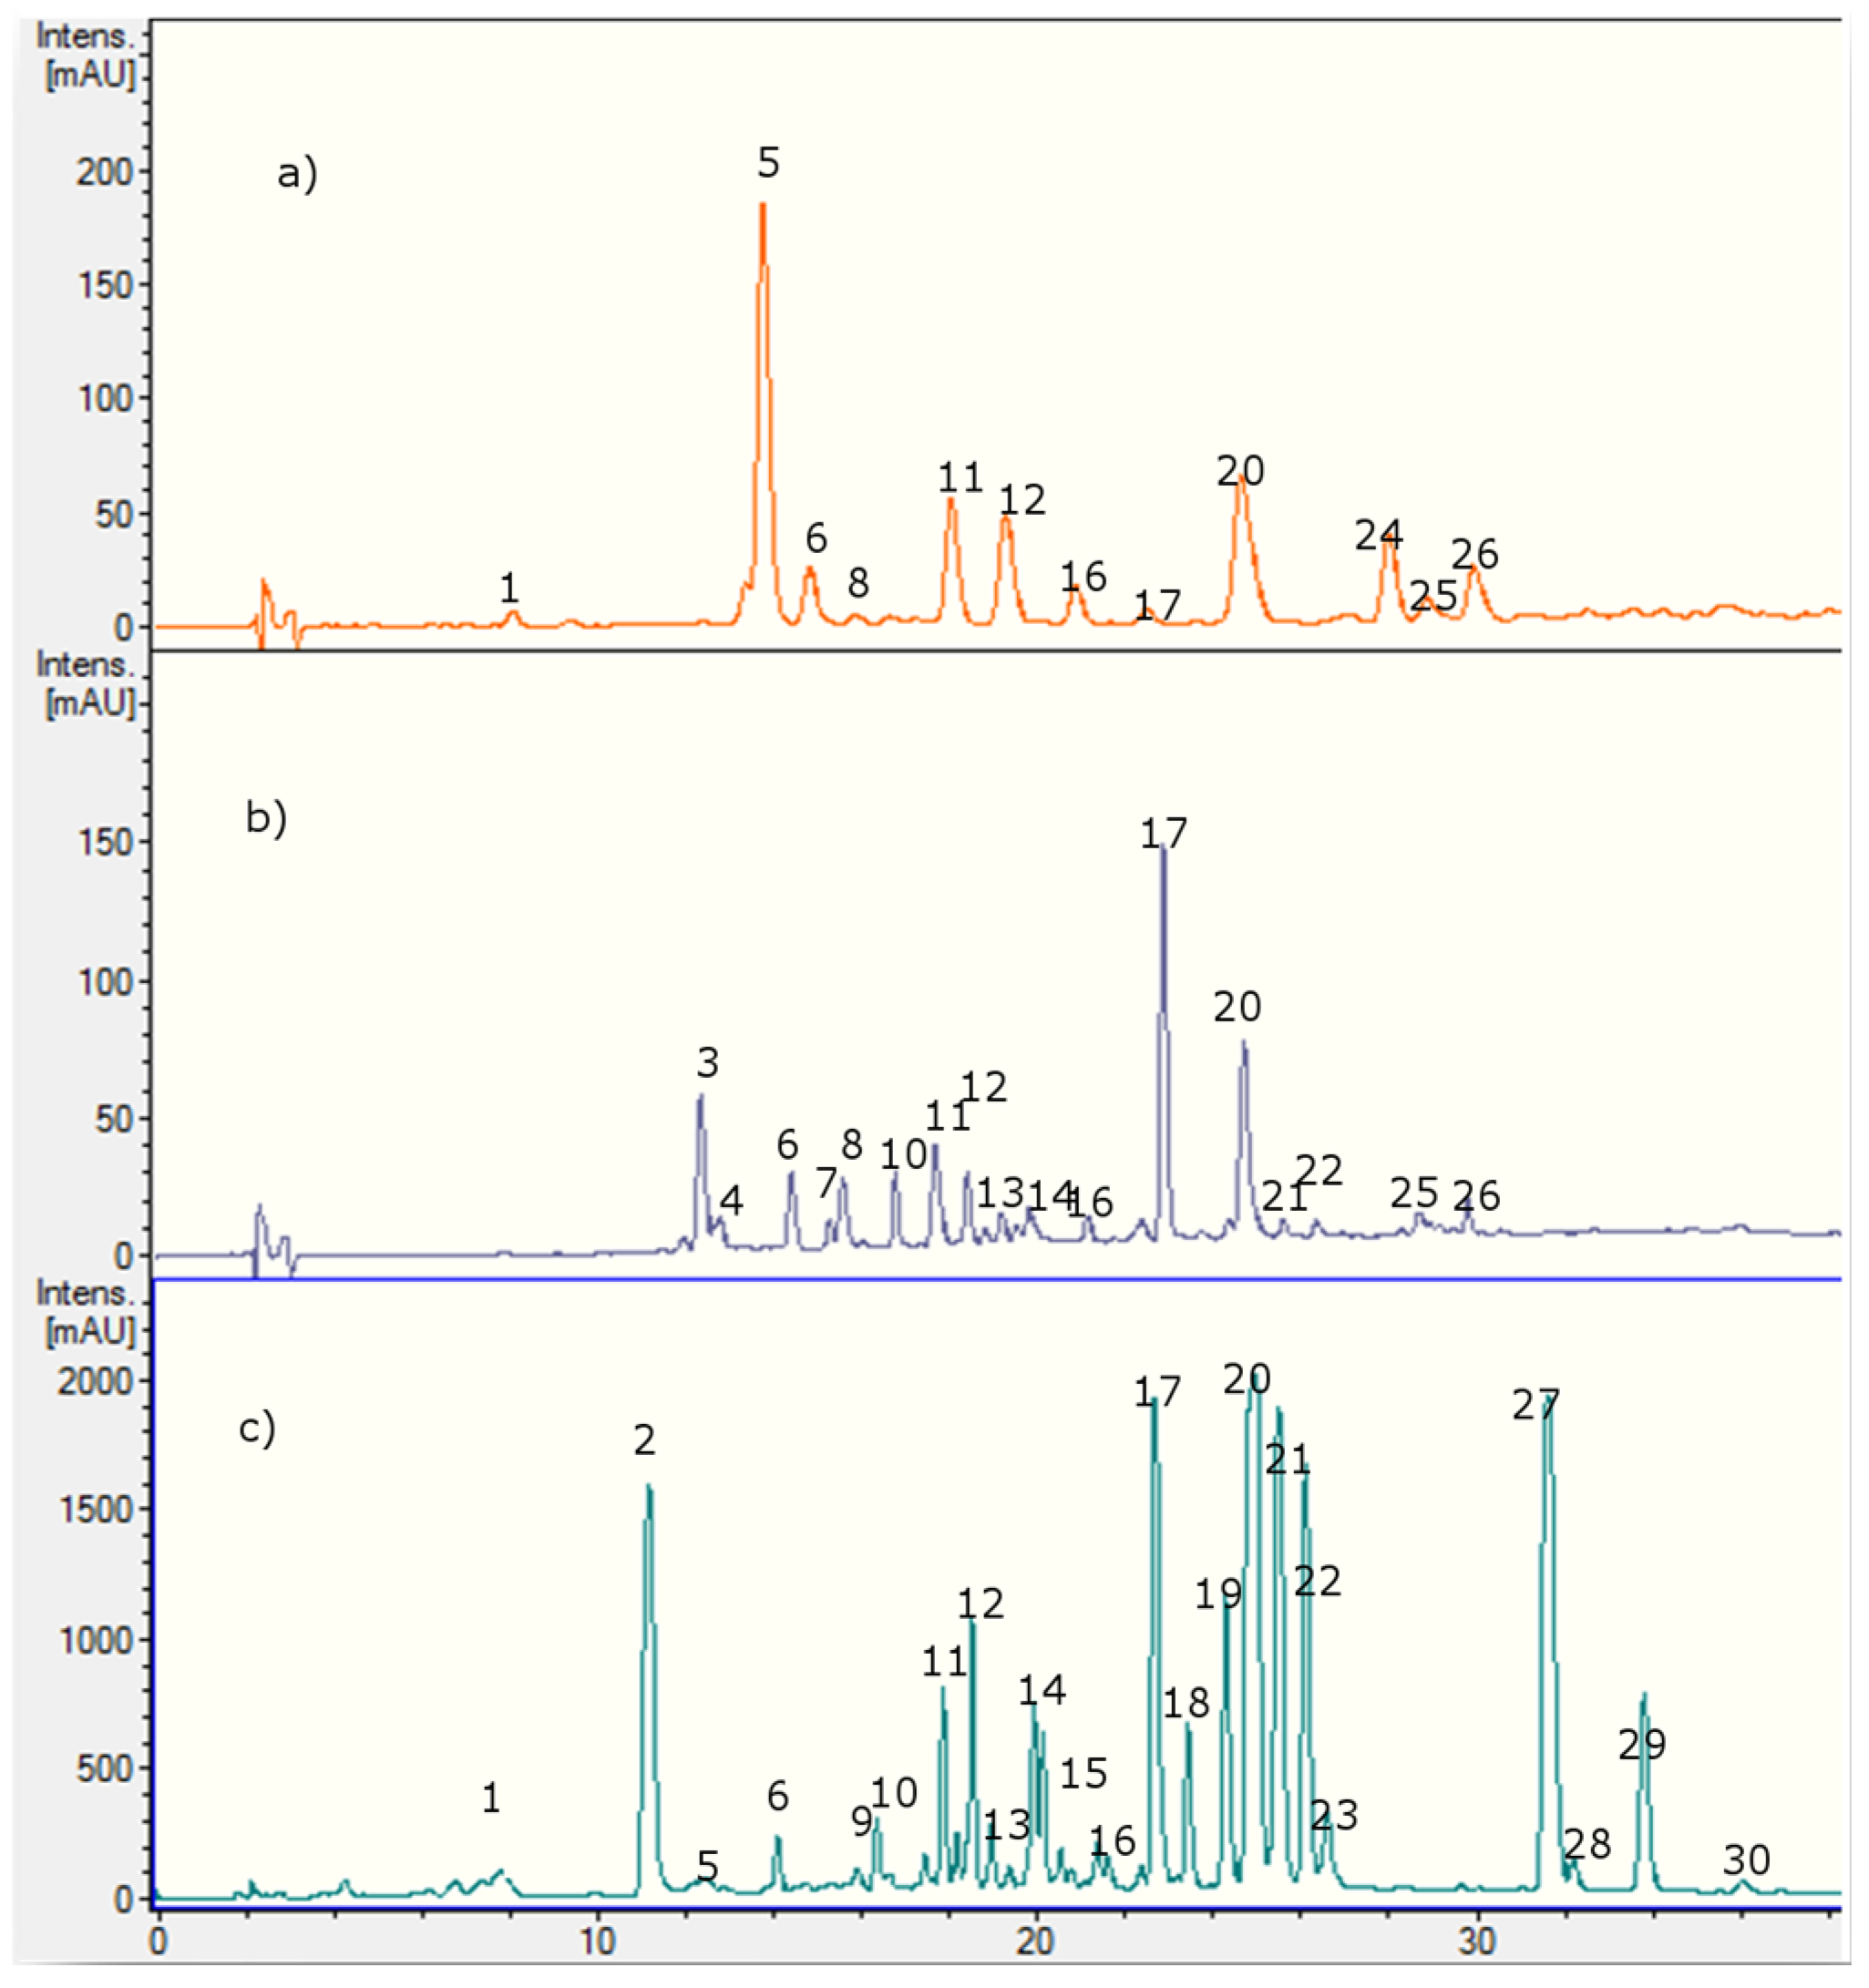
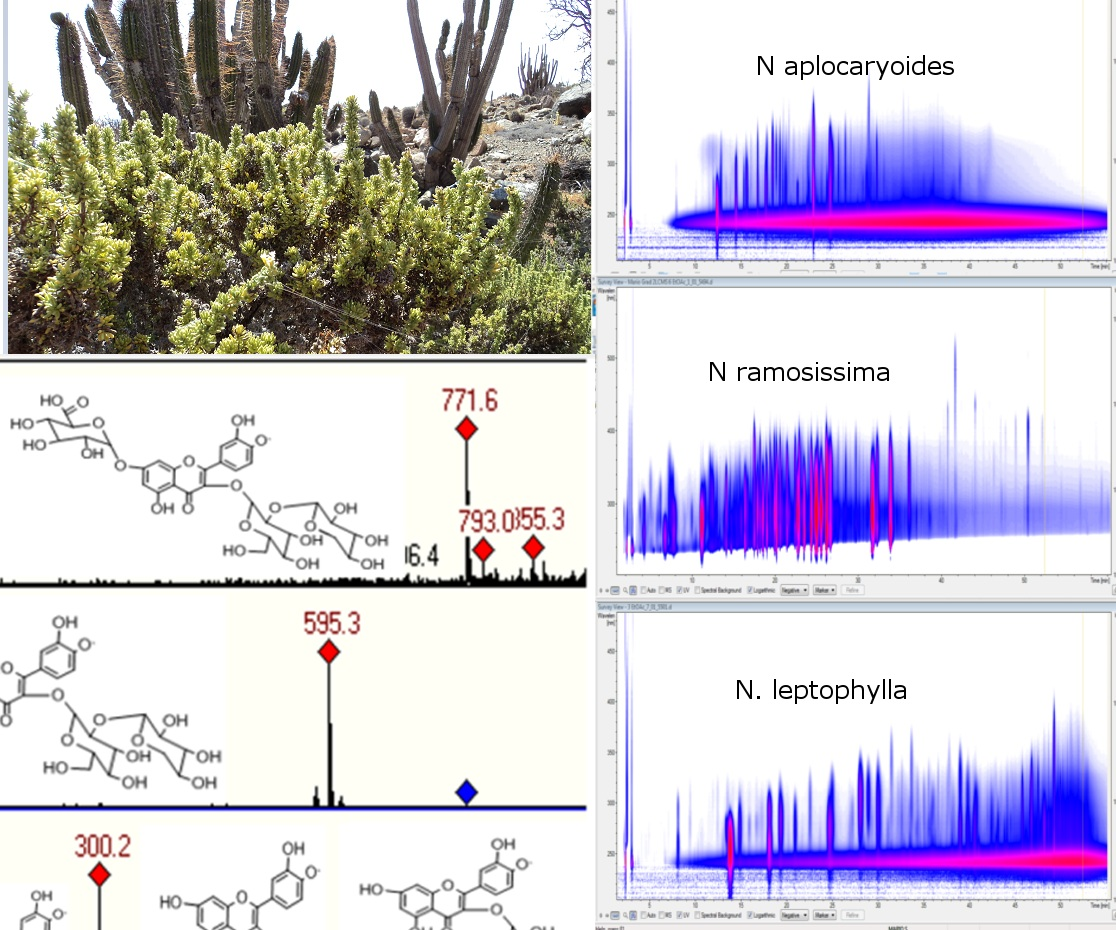
2.1. MS-PDA Identification of Polyphenolics in Three Nolana Species from Northern Chile


| Peak Number | Retention Time (min) | UV Max | M-Ion (ppm) | Other Ions (Aglycon Moiety) | Identification | Plant |
|---|---|---|---|---|---|---|
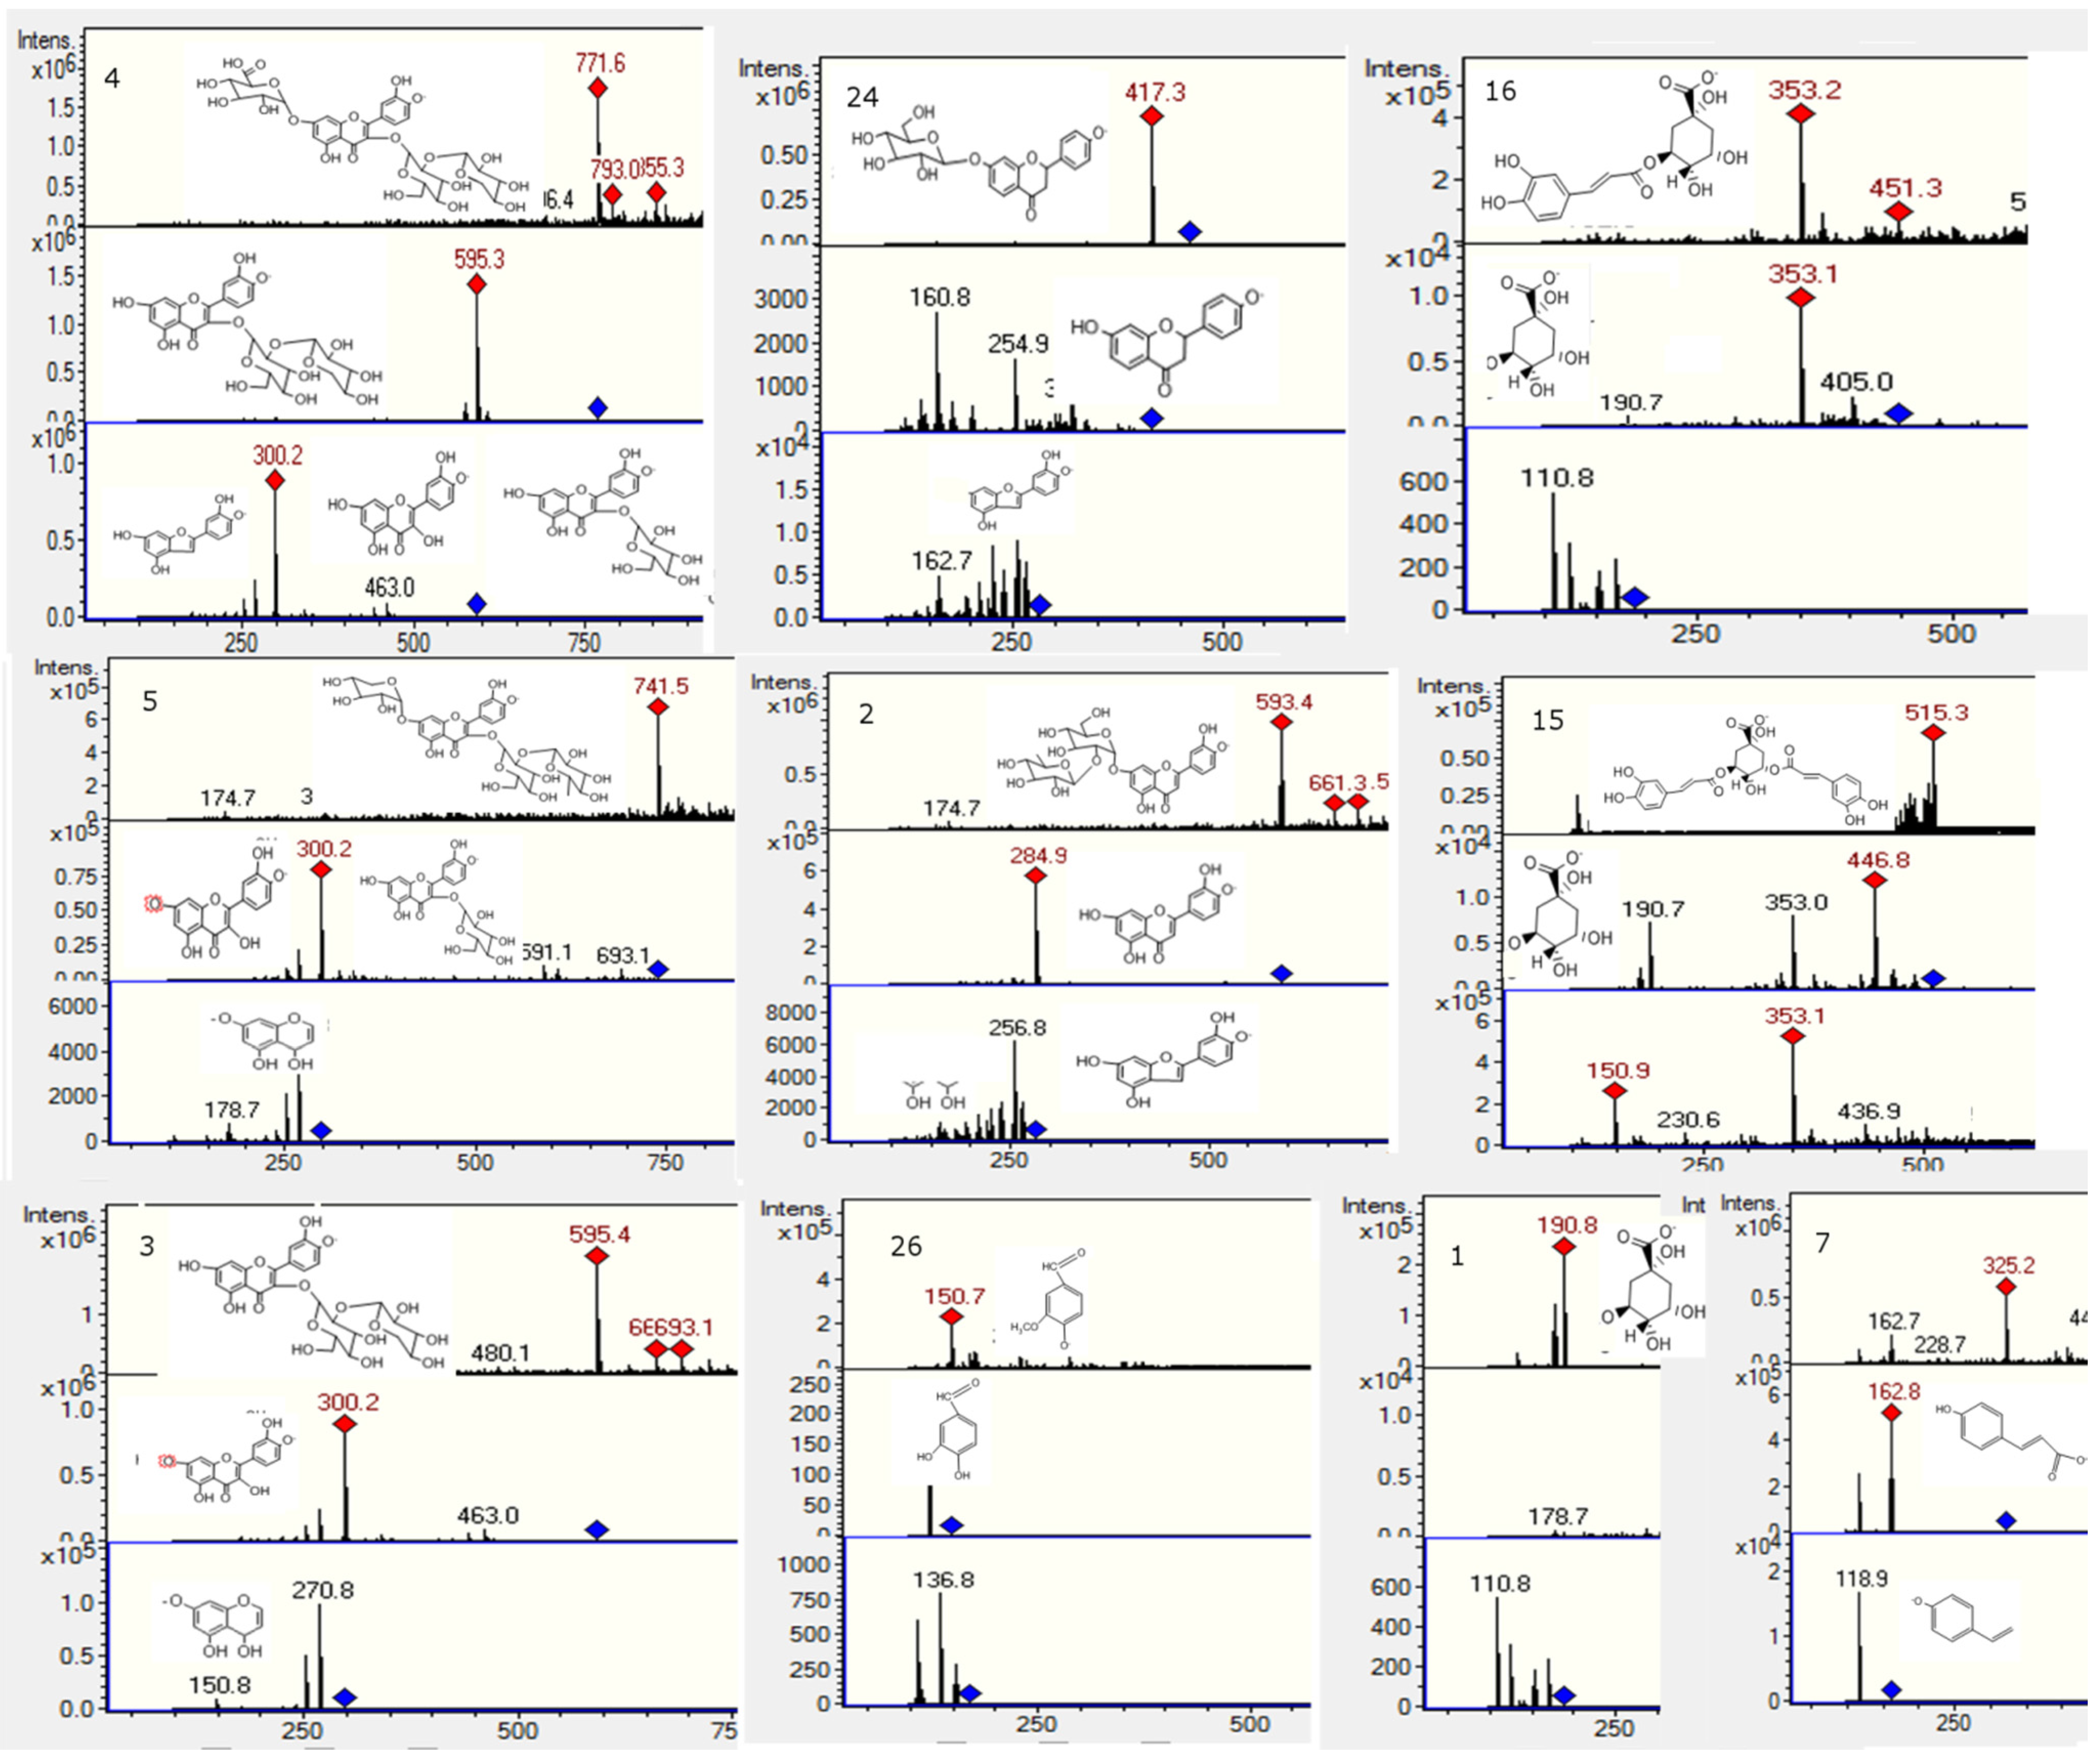
| 1 | 7.9 | 198 | 191 | 178, 173, 148, 110 | Quinic acid | Lepto, ramo |
| 2 | 11.3 | 350, 260 | 593 | 285 [M − H − rutinose]−, 253, 179, 151 | Luteolin-7-O-rutinose | ramo |
| 3 | 12.1 | 350, 254 | 595 | 463 (quercetin 3-O-glucoside), 301(quercetin-1H), 300 (quercetin-2H), 179, 151 | Quercetin-3-O-glucosyl-pentoside | aplo |
| 4 | 12.3 | 350, 254 | 771 | 595 (quercetin-3-O-hexosyl-hexoside), 463 (quercetin 3-O-glucoside), 301 (quercetin), 179, 151 | Quercetin-3-O-glucosyl-pentoside-7-O-glucuronide | aplo |
| 5 | 12.8 | 350, 254 | 741 | 609 ([M − H − xylose]−, 301 [M − H − rutinose − xylose]−,179, 151 | Quercetin-7-O-xyloside-3-O-rutinoside | ramo |
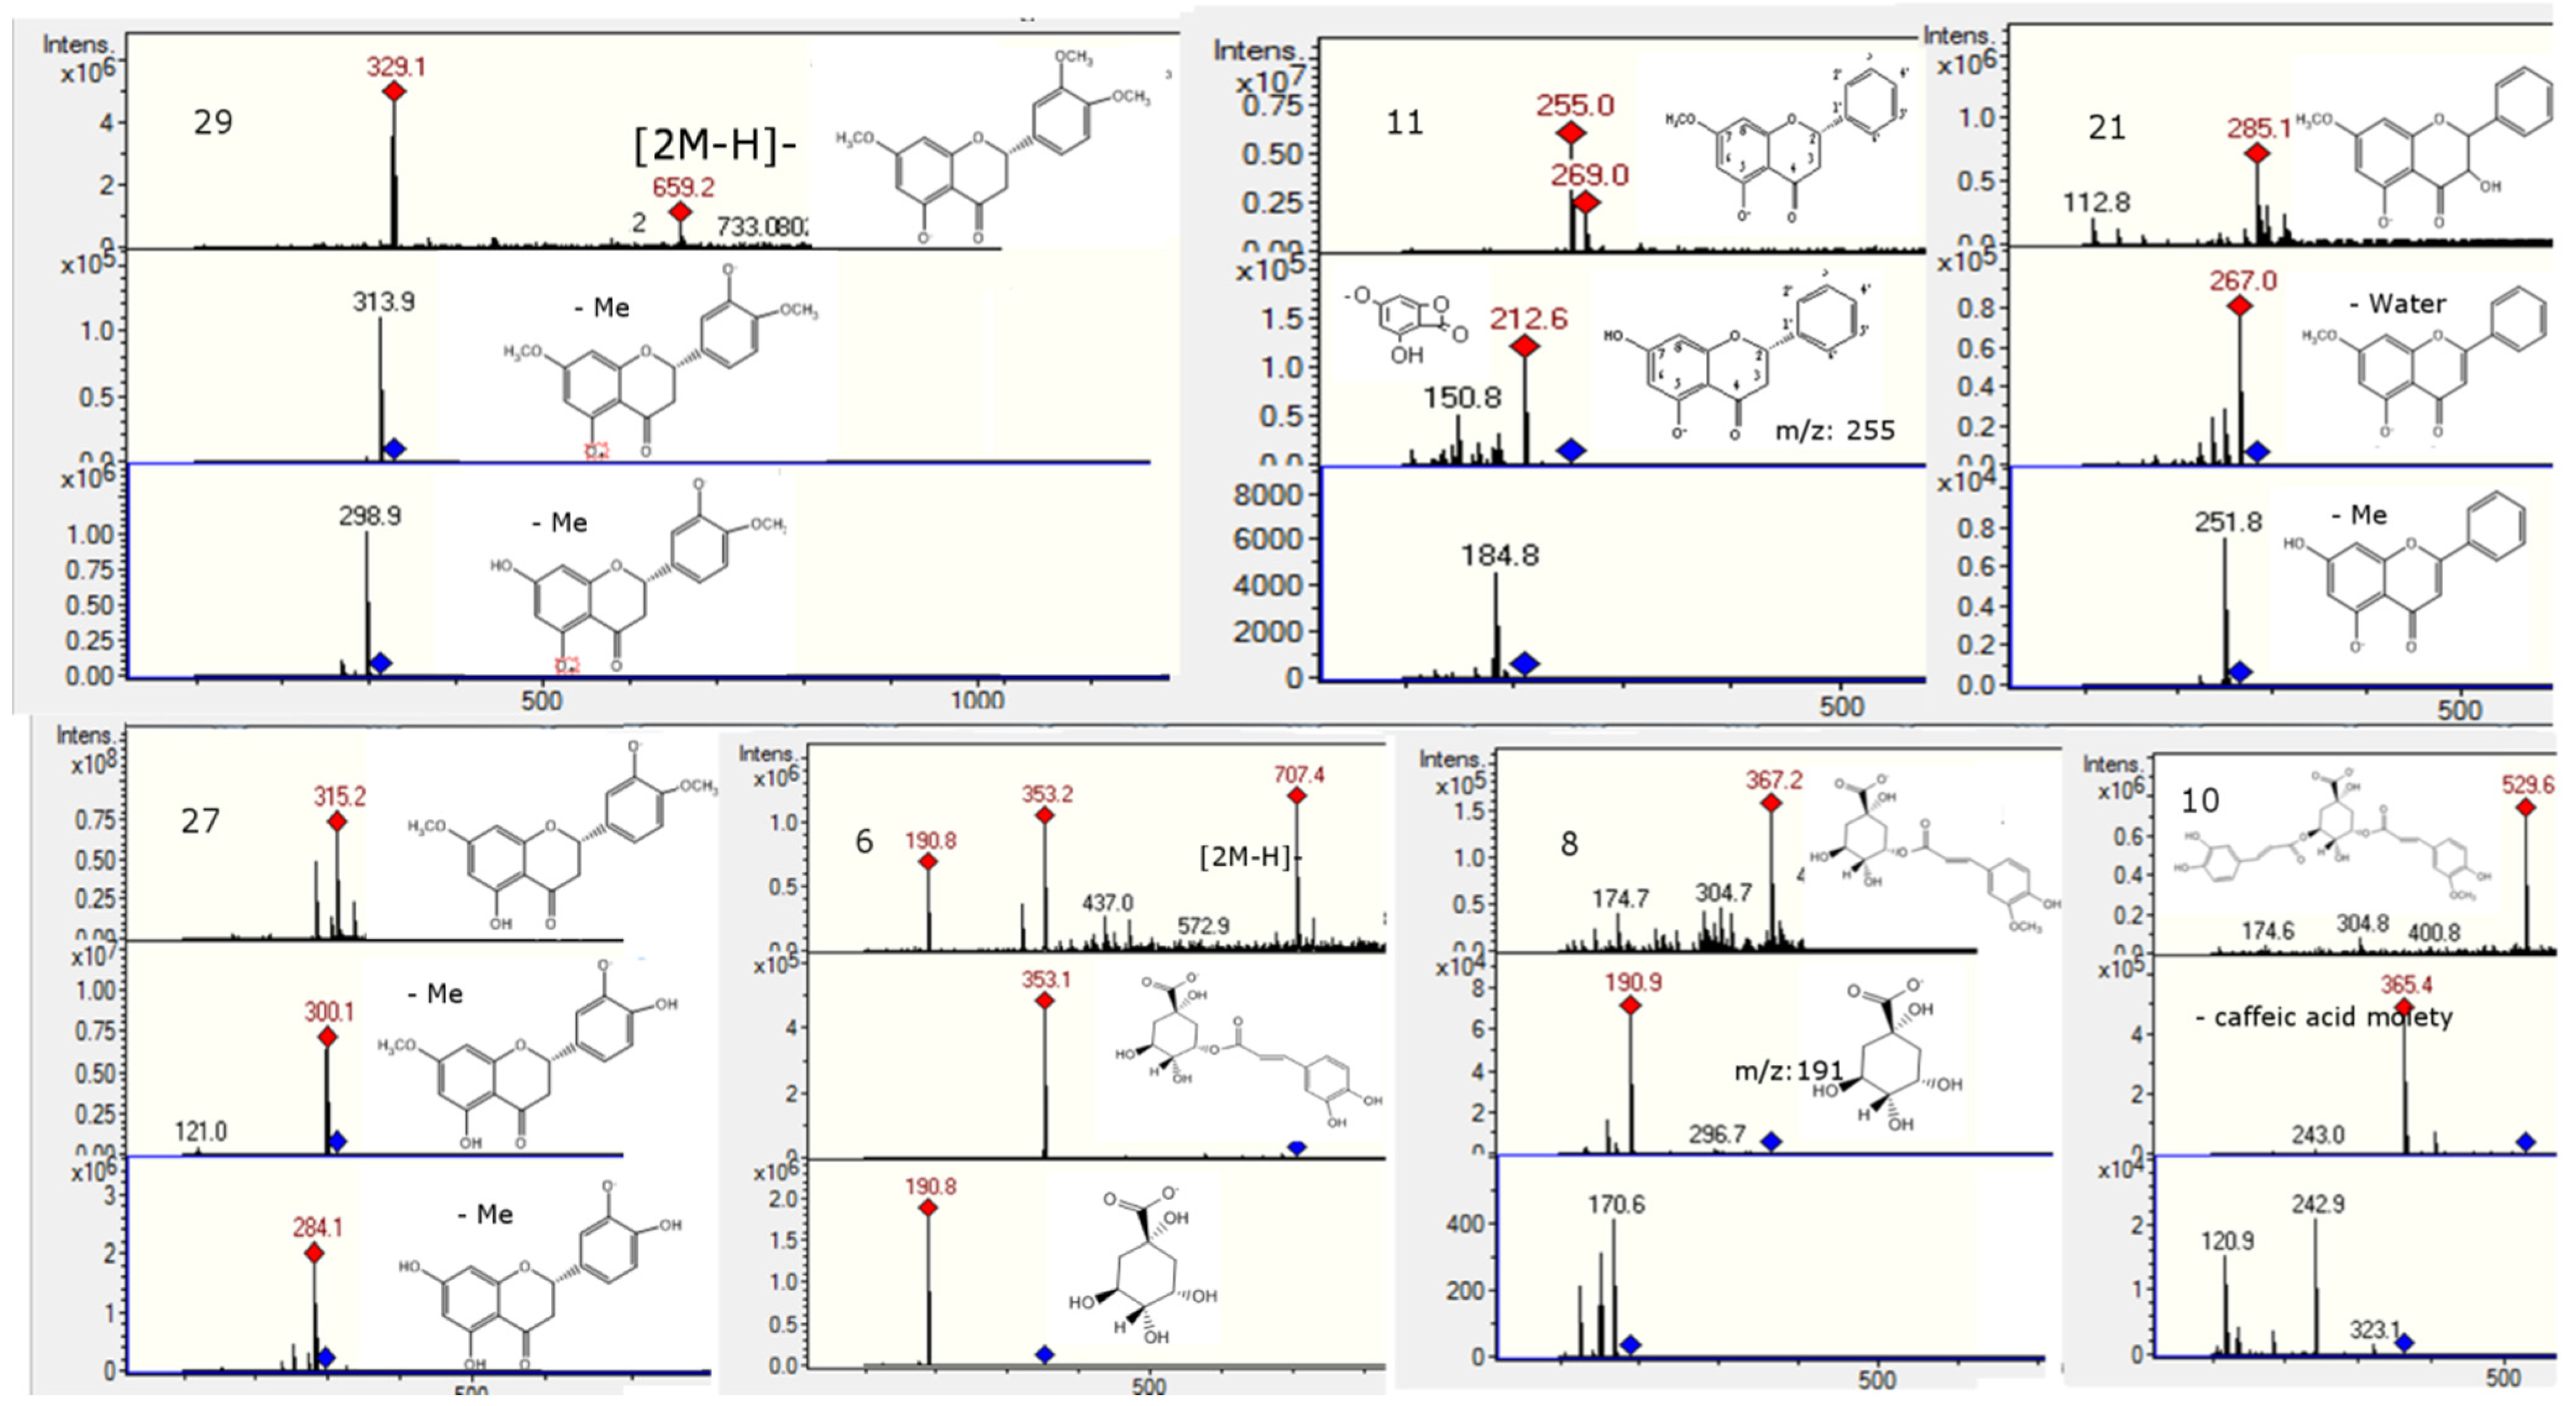
| 6 | 14.0 | 310, 246 | 353 | 707 [2M − H]−, 191 (quinic acid) | Chlorogenic acid * | Lepto, ramo, aplo |
| 7 | 14.7 | 324, 275 | 325 | 651 [2M − H]−, 163 [M − H − glucose]−, 119[M − H − glucose − CO2]− | p-Coumaric acid glucoside | aplo |
| 8 | 15.3 | 310, 247 | 367 | 191 (quinic acid) | Feruloyl-quinic acid | aplo |
| 9 | 16.0 | 350, 254 | 609 | 1219 [2M − H]−, 301 [M − H − rutinose]−, 179, 151 | Rutin * | ramo |
| 10 | 16.3 | 310, 246, | 529 | 367 ([M − H − caffeic acid moiety]− | Feruloyl-caffeoyl-quinic acid | Aplo, ramo |
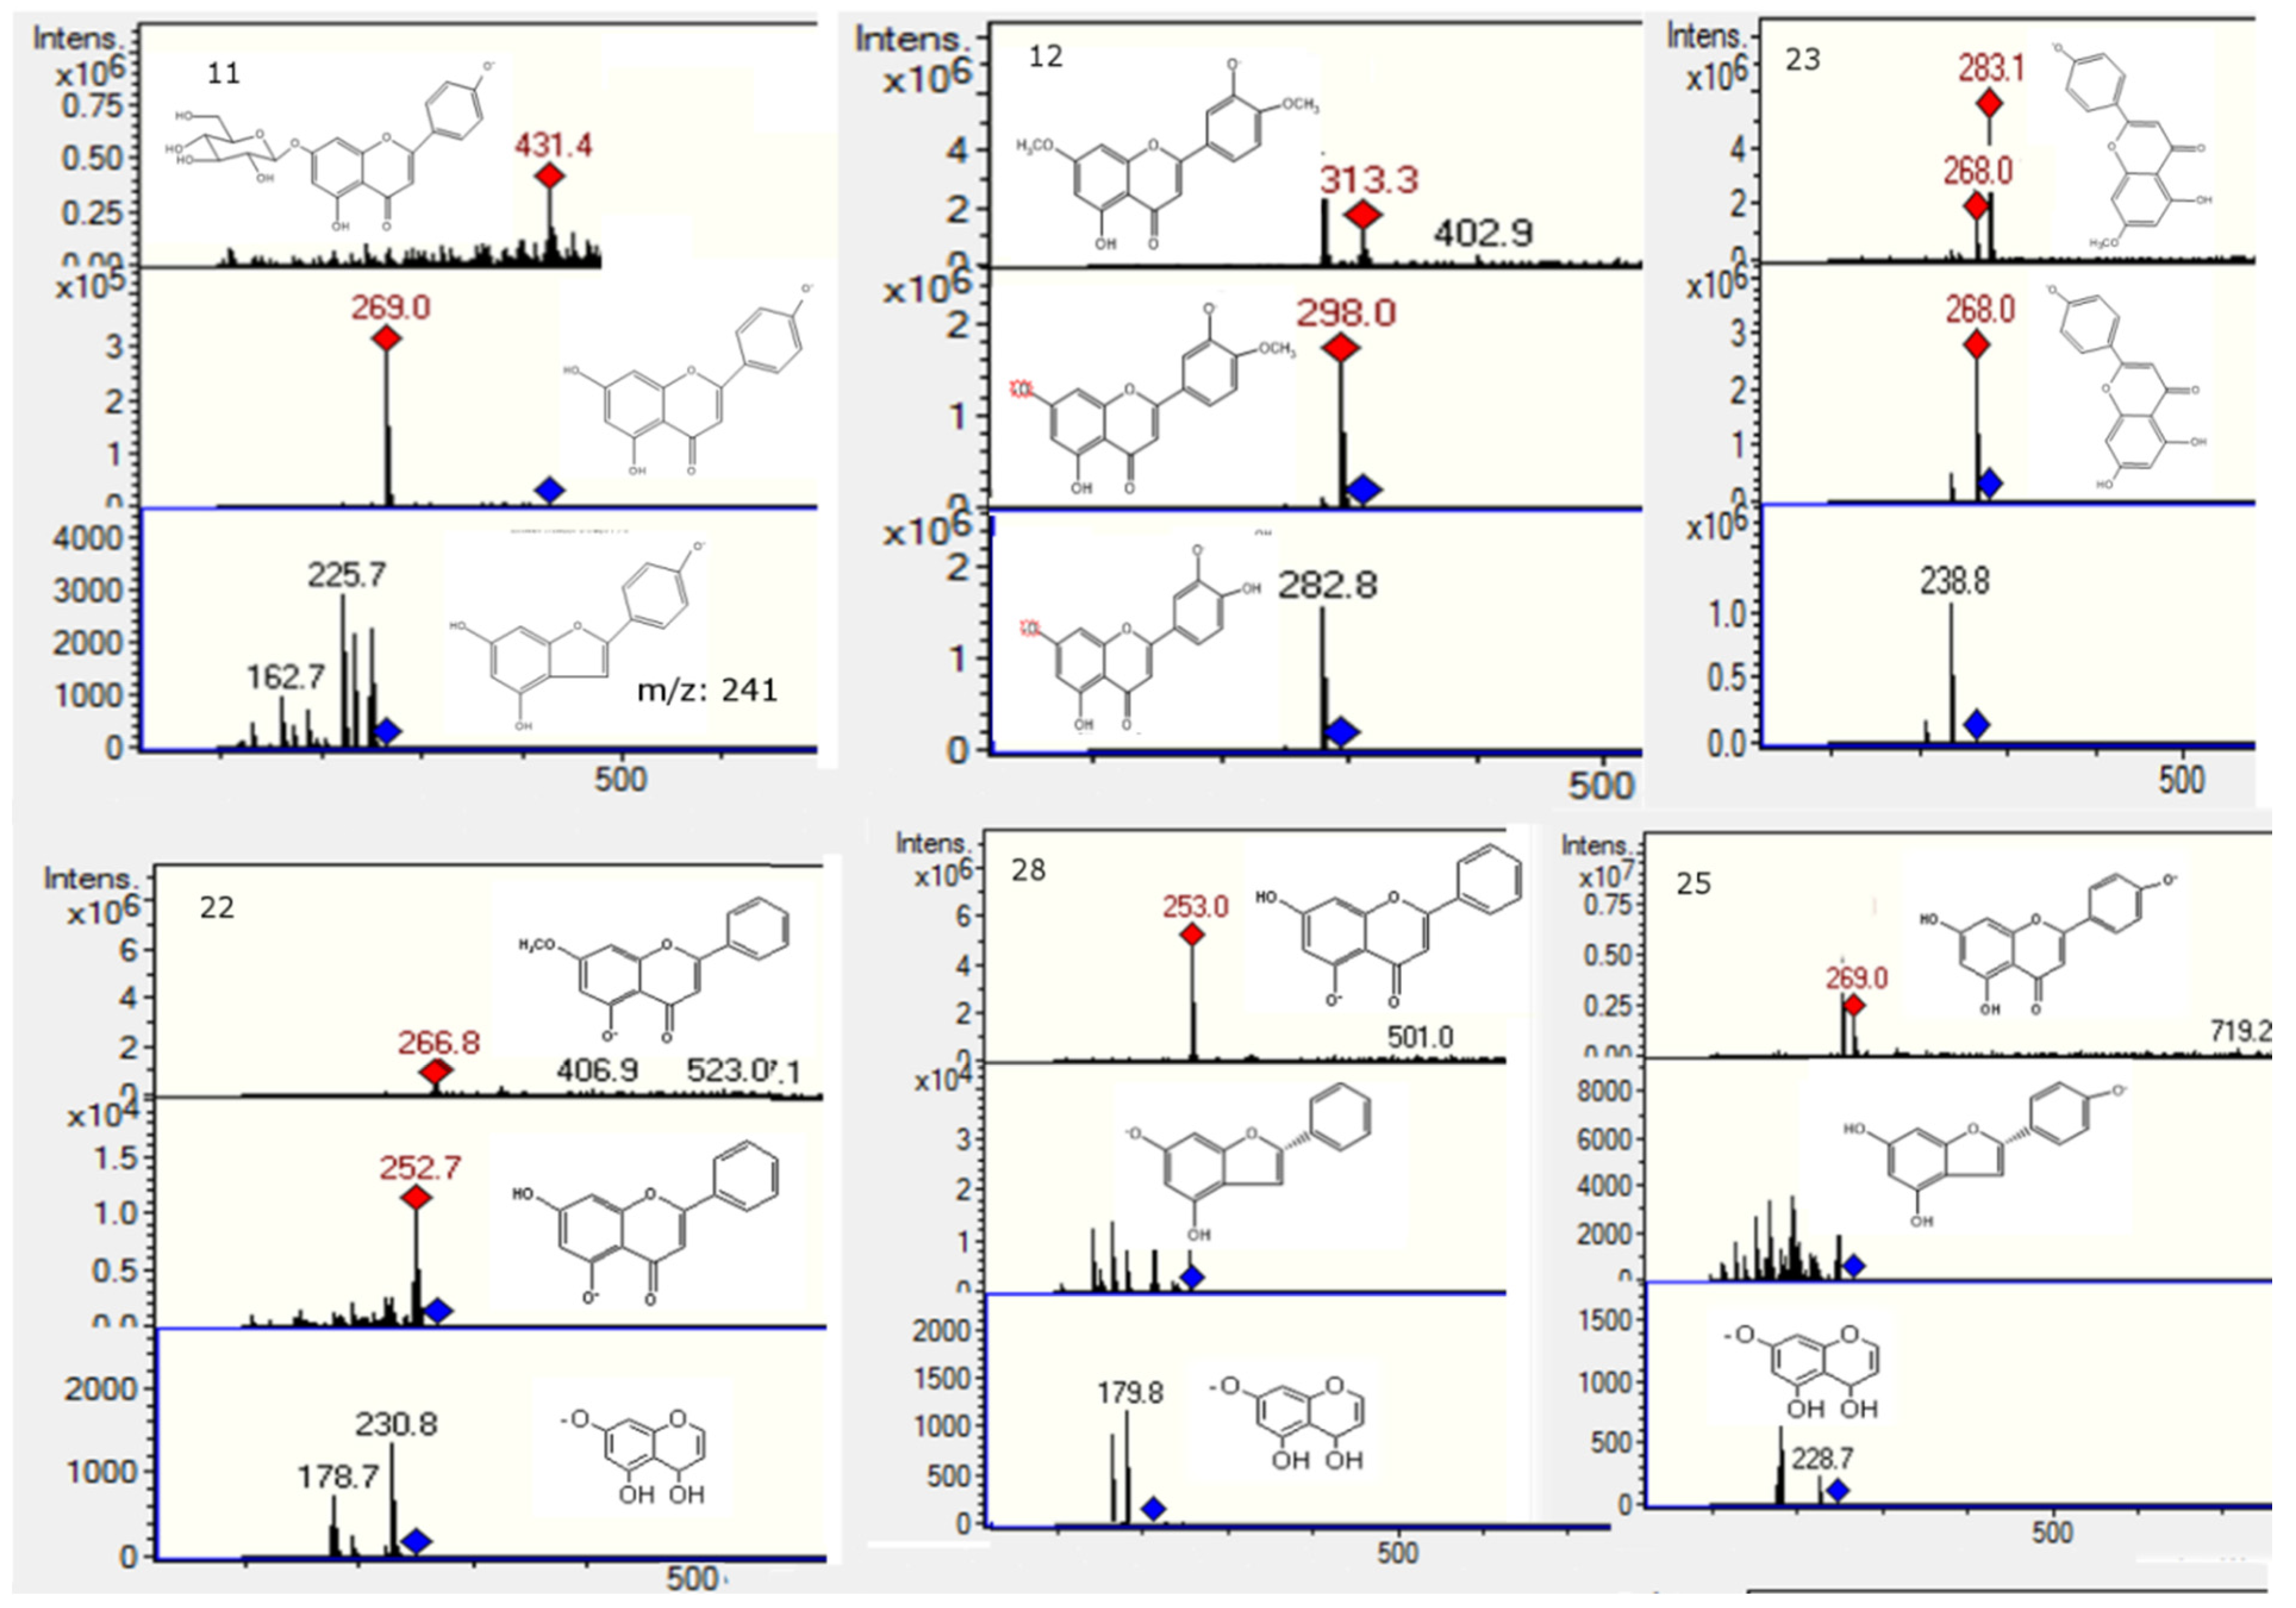
| 11 | 18.0 | 431 | 269 (apigenin) | 7-O-glucosyl-apigenin | Lepto, ramo, aplo | |
| 12 | 18.7 | 350, 260 | 313.3 | 298, 282 | 4′,7′ -dimethoxyluteolin | Lepto, ramo, aplo |
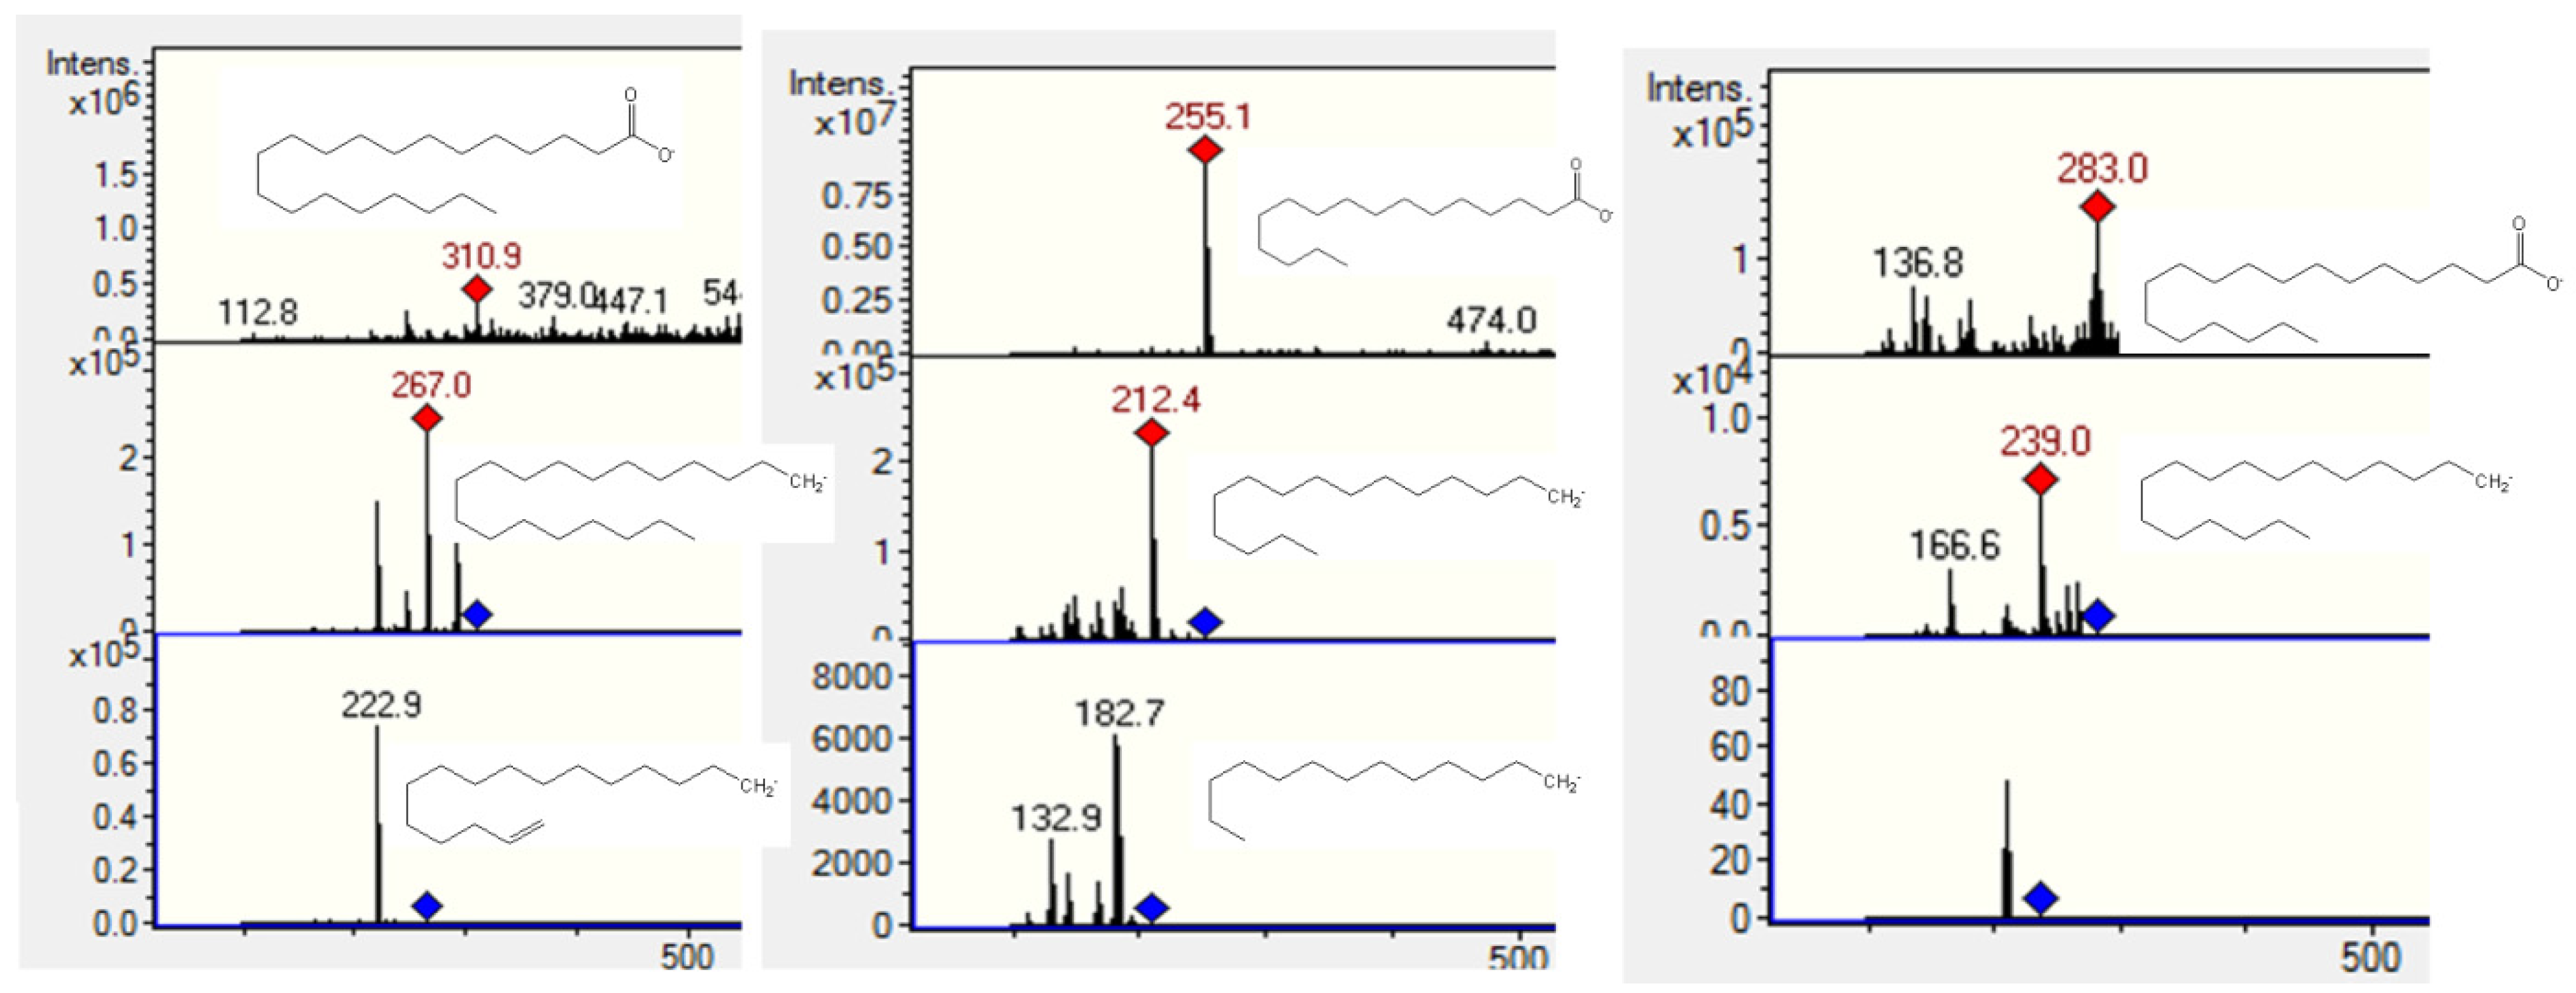
| 13 | 19.0 | 207 | 311 | 267 [M − H − CO2]−, 223 [M − H − CO2 − H2O]− | Arachidic acid * | ramo, aplo |
| 14 | 20.0 | 275 | 441 | 305, 175, 147 (cinnamic acid moiety) | Cinnamic acid derivative | aplo |
| 15 | 20.2 | 310, 240 | 515 | 353, 141 | Dicaffeoyl-quinic acid | ramo |
| 16 | 21.8 | 310, 246 | 451 | 353 [chlorogenic acid − H]−, 191 [quinic acid]− | Chlorogenic acid derivative | Lepto, ramo, aplo |
| 17 | 22.9 | 334, 275 | 327 | 312 [M − H − CH3]−,297 314 [M − H − 2CH3]− | 5-hydroxy-3,4′7 trimethoxy-flavone * | Lepto, ramo, aplo |
| 18 | 23.5 | 207 | 255 | 212 [M − H − CO2]−, 182 [M − H − CO2 − H2O]− | Palmitic acid * | ramo |
| 19 | 24.6 | 292, 330 sh | 255 | 213, 183, 172 | Pinocembrin * | Ramo |
| 20 | 25.2 | 291, 330 sh | 269, 271 | 255[M − CH3]−, 213 | Pinostrobin * | Lepto, ramo, aplo |
| 21 | 25.8 | 292, 330 sh | 285, 287 | 267[M − H2O]−, 251 [M − H2O − CH3]− | 3,5-dihydroxy-7-methoxy-flavanone | ramo, aplo |
| 22 | 26.0 | 334, 270 | 267 | 253 [M − H − CH3]−, 231, 179, 151 | chrysin-7-methyl ether | ramo |
| 23 | 26.9 | 207 | 283 | 239 [M − H − CO2]− | Stearic acid * | ramo |
| 24 | 28.1 | 275, 215 29.1 sh | 417 | 255 [M − H − glucose]− | Liquiritin | lepto |
| 25 | 29.1 | 334, 269 | 269 | 240, 182, 179, 151 | Apigenin * | lepto |
| 26 | 29.6 | 310, 28 sh | 151 | 136 [M − CH3]− | Vanillin * | lepto |
| 27 | 31.9 | 285 | 315 | 300 [M − 2H − CH3]−, 284 [M − 2H − 2CH3]− | Hesperetin 7-O-methyl ester | ramo |
| 28 | 32.1 | 334, 270 | 253 | 179, 151 | Chrysin | ramo |
| 29 | 33.9 | 292, 330 sh | 329 | 659 [2M − H]−, 314 [M − H − CH3]−, 299 [M − H − 2CH3]− | 5-hydroxy-3′4′7 trimethoxy-flavanone * | ramo |
| 30 | 36.0 | 334, 269 | 283, 285 | 268, 238 | Apigenin-7-O-methyl ether | ramo |
2.2. Flavonoids and Derivatives

2.3. Fatty Acids

2.4. Phenolic Acids and Related Compounds
2.5. Unknown Compounds
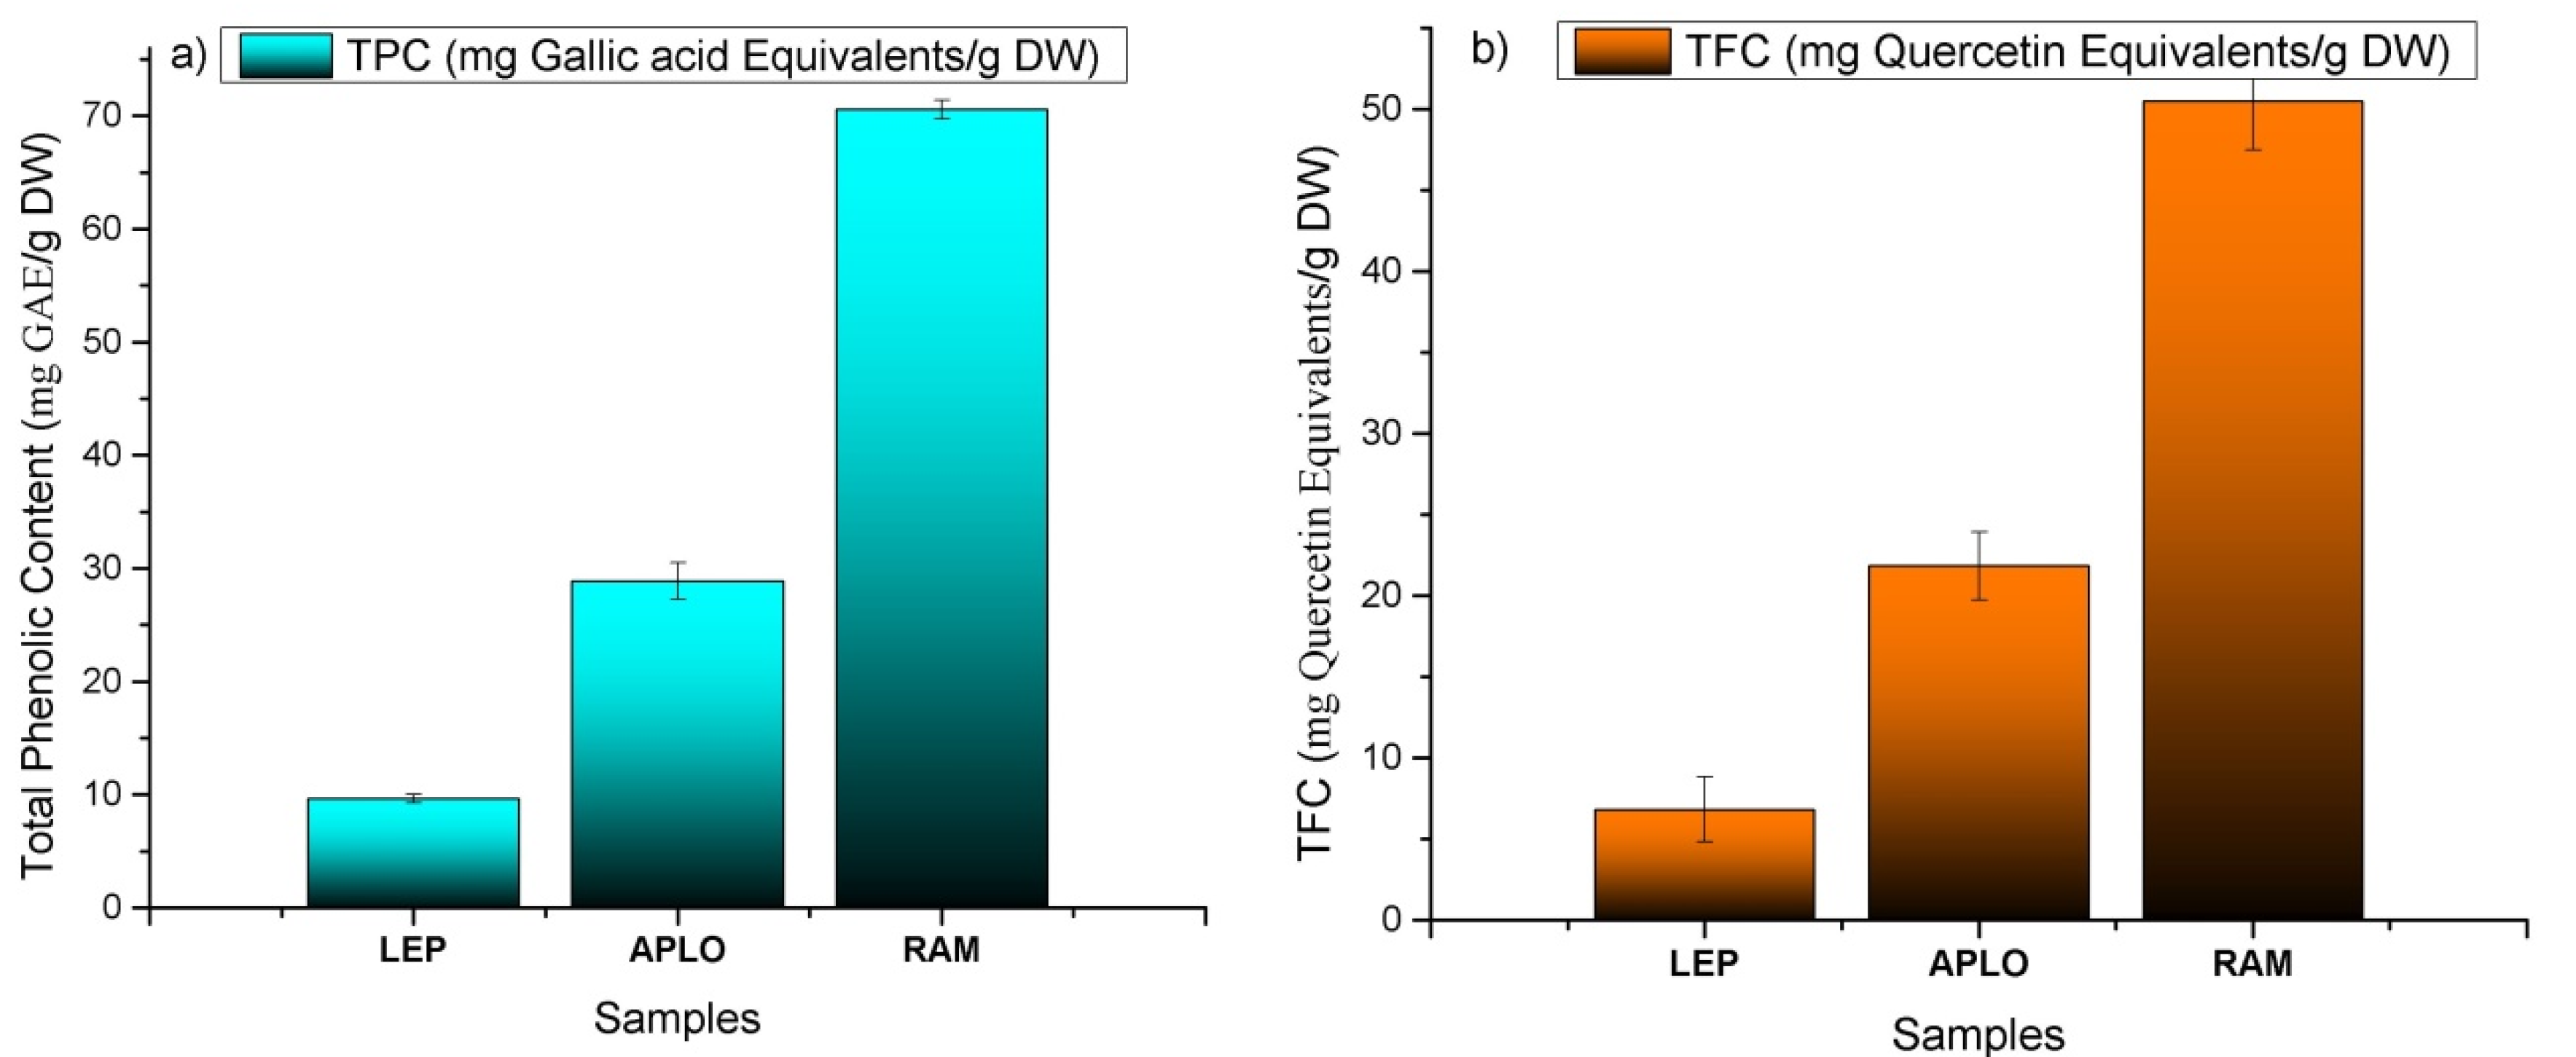
2.6. Total Phenolics and Flavonoids Contents

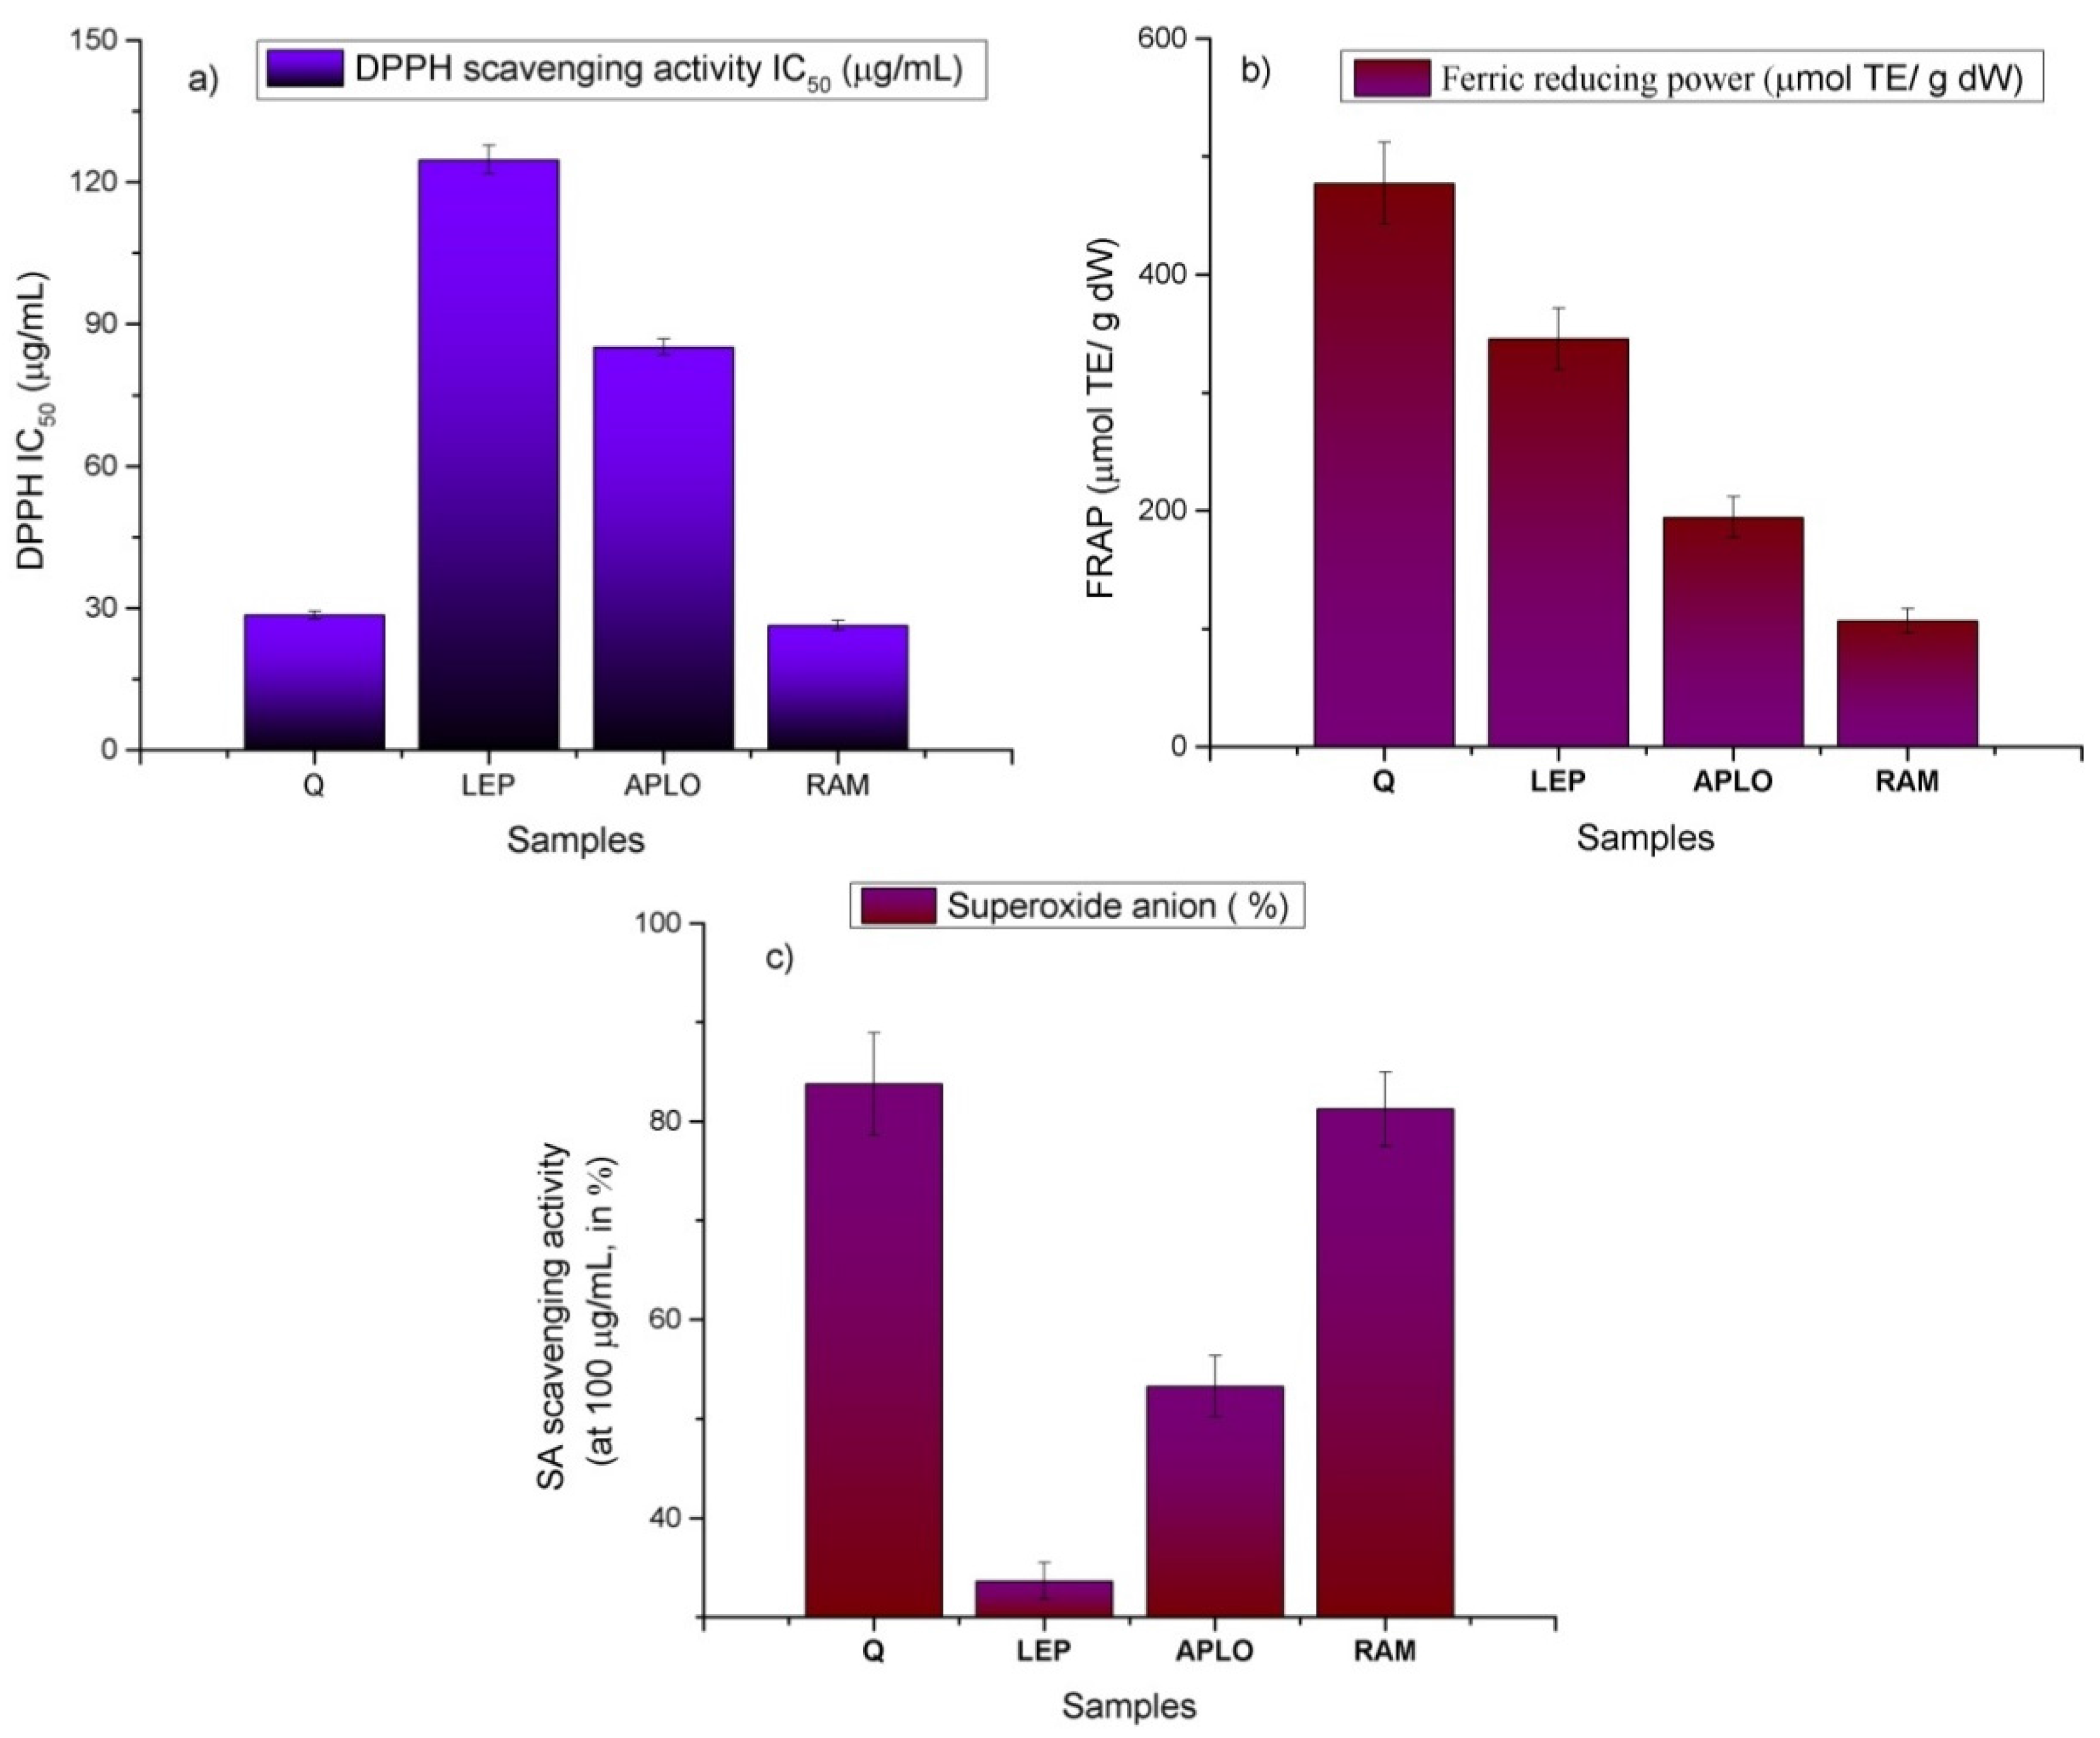
2.7. Antioxidant Features
3. Experimental Section
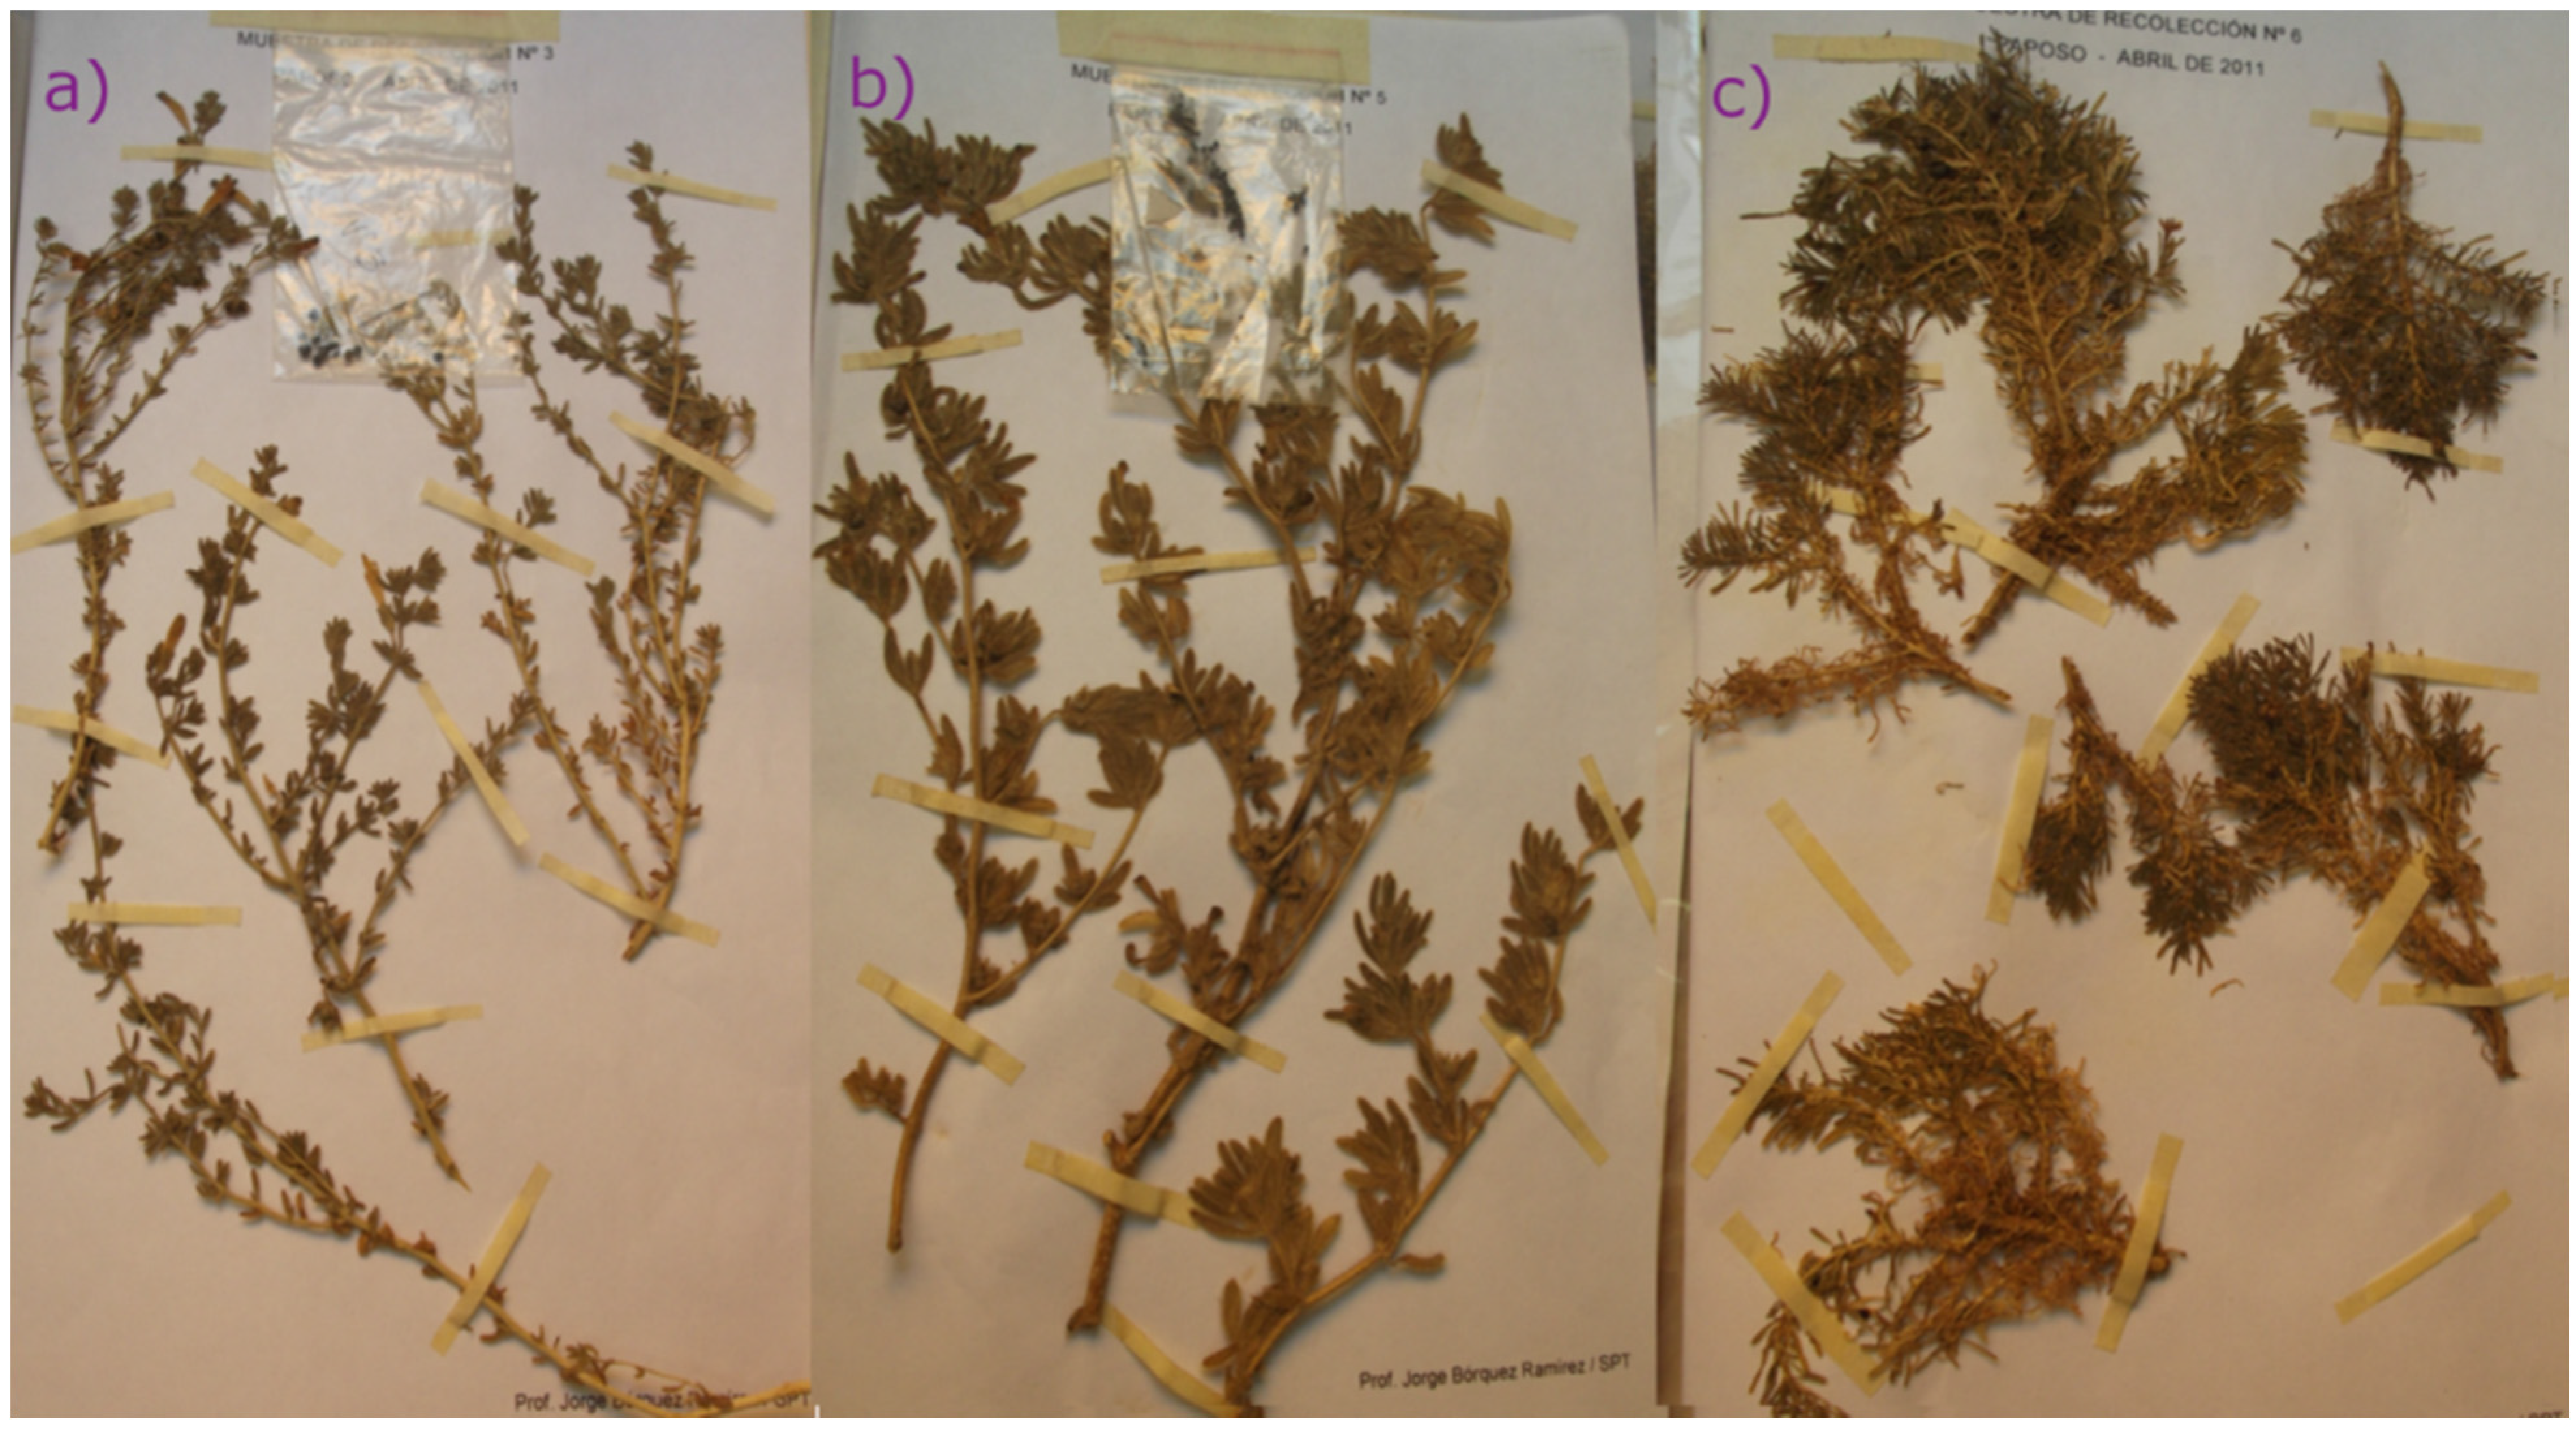
3.1. Chemicals and Plant Material
3.2. Sample Preparation
3.3. Liquid Chromatography Analysis
3.4. Mass Spectrometric Conditions
3.5. Antioxidant Assays
3.5.1. Free Radical Scavenging Capacity
3.5.2. Ferric Reducing Antioxidant Power
3.5.3. Superoxide Anion Scavenging Activity
3.5.4. Polyphenol and Flavonoids Contents
3.6. Statistical Analysis
4. Conclusions
Acknowledgments
Author Contributions
Conflicts of Interest
References and Notes
- Joseph, S.V.; Edirisinghe, I.; Burton-Freeman, B.M. Berries: Anti-inflammatory Effects in Humans. J. Agric. Food Chem. 2014, 62, 3886–3903. [Google Scholar] [CrossRef] [PubMed]
- Urquiaga, I.; Strobel, P.; Perez, D.; Martinez, C.; Cuevas, A.; Castillo, O.; Marshall, G.; Rozowski, J.; Leighton, F. Mediterranean diet and red wine protect against oxidative damage in young volunteers. Atherosclerosis 2010, 211, 694–699. [Google Scholar] [CrossRef] [PubMed]
- Pennington, J.A.T.; Fisher, R.A. Food component profiles for fruit and vegetable subgroups. J. Food Compos. Anal. 2010, 23, 411–418. [Google Scholar] [CrossRef]
- Cavazza, A.; Corradini, C.; Musci, M.; Salvadeo, P. High-performance liquid chromatographic phenolic compound fingerprint for authenticity assessment of honey. J. Sci. Food Agric. 2013, 93, 1169–1175. [Google Scholar] [CrossRef] [PubMed]
- Simirgiotis, M.J.; Borquez, J.; Schmeda-Hirschmann, G. Antioxidant capacity, polyphenolic content and tandem HPLC-DAD-ESI/MS profiling of phenolic compounds from the South American berries Luma apiculata and L. chequen. Food Chem. 2013, 139, 289–299. [Google Scholar] [CrossRef] [PubMed]
- Simirgiotis, M.J.; Caligari, P.D.S.; Schmeda-Hirschmann, G. Identification of phenolic compounds from the fruits of the mountain papaya Vasconcellea pubescens A. DC. grown in Chile by liquid chromatography-UV detection-mass spectrometry. Food Chem. 2009, 115, 775–784. [Google Scholar] [CrossRef]
- Simirgiotis, M.J.; Ramirez, J.E.; Schmeda Hirschmann, G.; Kennelly, E.J. Bioactive coumarins and HPLC-PDA-ESI-ToF-MS metabolic profiling of edible queule fruits (Gomortega keule), an endangered endemic Chilean species. Food Res. Int. 2013, 54, 532–543. [Google Scholar] [CrossRef]
- Simirgiotis, M.J.; Schmeda-Hirschmann, G. Determination of phenolic composition and antioxidant activity in fruits, rhizomes and leaves of the white strawberry (Fragaria chiloensis spp. chiloensis form chiloensis) using HPLC-DAD-ESI-MS and free radical quenching techniques. J. Food Compos. Anal. 2010, 23, 545–553. [Google Scholar] [CrossRef]
- Bórquez, J.; Kennelly, E.J.; Simirgiotis, M.J. Activity guided isolation of isoflavones and hyphenated HPLC-PDA-ESI-ToF-MS metabolome profiling of Azorella madreporica Clos. from northern Chile. Food Res. Int. 2013, 52, 288–297. [Google Scholar] [CrossRef]
- Wu, S.-B.; Wu, J.; Yin, Z.; Zhang, J.; Long, C.; Kennelly, E.J.; Zheng, S. Bioactive and Marker Compounds from Two Edible Dark-Colored Myrciaria Fruits and the Synthesis of Jaboticabin. J. Agric. Food Chem. 2013, 61, 4035–4043. [Google Scholar] [CrossRef] [PubMed]
- Wu, S.-B.; Dastmalchi, K.; Long, C.; Kennelly, E.J. Metabolite Profiling of Jaboticaba (Myrciaria cauliflora) and Other Dark-Colored Fruit Juices. J. Agric. Food Chem. 2012, 60, 7513–7525. [Google Scholar] [CrossRef] [PubMed]
- Ruiz, A.; Hermosín-Gutiérrez, I.; Mardones, C.; Vergara, C.; Herlitz, E.; Vega, M.; Dorau, C.; Winterhalter, P.; von Baer, D. Polyphenols and antioxidant activity of Calafate (Berberis microphylla) fruits and other native berries from Southern Chile. J. Agric. Food Chem. 2010, 58, 6081–6089. [Google Scholar] [CrossRef] [PubMed]
- Verardo, V.; Arráez-Román, D.; Segura-Carretero, A.; Marconi, E.; Fernández-Gutiérrez, A.; Caboni, M.F. Identification of buckwheat phenolic compounds by reverse phase high performance liquid chromatography-electrospray ionization-time of flight-mass spectrometry (RP-HPLC–ESI-TOF-MS). J. Cereal Sci. 2010, 52, 170–176. [Google Scholar] [CrossRef]
- Qiu, J.; Chen, L.; Zhu, Q.; Wang, D.; Wang, W.; Sun, X.; Liu, X.; Du, F. Screening natural antioxidants in peanut shell using DPPH–HPLC–DAD–TOF/MS methods. Food Chem. 2012, 135, 2366–2371. [Google Scholar] [CrossRef] [PubMed]
- Dillon, M.O.; Tu, T.; Xie, L.; Silvestre, V.; Wen, J. Biogeographic diversification in Nolana (Solanaceae), a ubiquitous member of the Atacama and Peruvian Deserts along the western coast of South America. J. Syst. Evol. 2009, 47, 457–476. [Google Scholar] [CrossRef]
- Vio-Michaelis, S.; Apablaza-Hidalgo, G.; Gómez, M.; Peña-Vera, R.; Montenegro, G. Antifungal activity of three Chilean Plant extracts on Botritis cinerea. Bot. Sci. 2012, 90, 179–183. [Google Scholar]
- Chamy, M.C.; Piovano, M.; Garbarino, J.A. Diterpenoids from Nolana elegans. Bol. Soc. Chil. Quim. 2002, 47, 367–370. [Google Scholar] [CrossRef]
- Chamy, M.C.; Garbarino, J.A.; Piovano, E.; López Pérez, J.L.; Nicoletti, M.; Gandolfo, R.; Feliciano, A. 9-epi-labdane diterpenoids from Nolana rostrata var. rostrata. Phytochemistry 1997, 45, 797–800. [Google Scholar] [CrossRef]
- Garbarino, J.A.; Chamy, M.C.; Piovano, M.; Gambaro, V. Labdane diterpenoids from Nolana filifolia. Phytochemistry 1988, 27, 1795–1796. [Google Scholar] [CrossRef]
- Garbarino, J.A.; Chamy, M.C.; Montagna, M.P.; Gambaro, V. Sesquiterpenoids in Nolana coelestis. Phytochemistry 1993, 32, 987–989. [Google Scholar] [CrossRef]
- Zhao, Y.; Li, X.; Zeng, X.; Huang, S.; Hou, S.; Lai, X. Characterization of phenolic constituents in Lithocarpus polystachyus. Anal. Methods. 2014, 6, 1359–1363. [Google Scholar] [CrossRef]
- Dahia, M.; Siracusa, L.; Laouer, H.; Ruberto, G. Constituents of the Polar Extracts from Algerian Pituranthos scoparius. Nat. Prod. Commun. 2009, 12, 1691–1692. [Google Scholar]
- Engels, C.; Gräter, D.; Esquivel, P.; Jiménez, V.M.; Gänzle, M.G.; Schieber, A. Characterization of phenolic compounds in jocote (Spondias purpurea L.) peels by ultra high-performance liquid chromatography/electrospray ionization mass spectrometry. Food Res. Int. 2012, 46, 557–562. [Google Scholar] [CrossRef]
- Markham, K.R. Techniques of Flavonoid Identification; Academic Press: London, UK, 1982. [Google Scholar]
- Brito, I.; Simirgiotis, M.J.; Rodríguez Werner, M.; Bórquez, J.; Winterhalter, P.; Cárdenas, A.; Brito, A. A non-centrosymmetric polymorph of 5-hydroxy-7-methoxy-2-phenylchroman-4-one. J. Chil. Chem. Soc. 2015, 60, 2864–2866. [Google Scholar] [CrossRef]
- Wang, J.; Wang, D.; Yu, J.; Liu, C.; Li, L.; Zhang, Y. Isolation of Liquiritigenin-4′-Apiosyl-Glucoside and Liquiritin from the Root of Glycyrrhiza uralensis by High-Performance Centrifugal Partition Chromatography. J.Chromatogr. Sci. 2014, 52, 310–314. [Google Scholar] [CrossRef] [PubMed]
- Wang, X.; Cheng, C.; Sun, Q.; Li, F.; Liu, J.; Zheng, C. Isolation and purification of four flavonoid constituents from the flowers of Paeonia suffruticosa by high-speed counter-current chromatography. J. Chromatogr. A 2005, 1075, 127–131. [Google Scholar] [CrossRef] [PubMed]
- Villalobos Solis, M.I.; Patel, A.; Orsat, V.; Singh, J.; Lefsrud, M. Fatty acid profiling of the seed oils of some varieties of field peas (Pisum sativum) by RP-LC/ESI-MS/MS: Towards the development of an oilseed pea. Food Chem. 2013, 139, 986–993. [Google Scholar] [CrossRef] [PubMed]
- Ramirez, J.E.; Zambrano, R.; Sepúlveda, B.; Kennelly, E.J.; Simirgiotis, M.J. Anthocyanins and antioxidant capacities of six Chilean berries by HPLC–HR-ESI-ToF-MS. Food Chem. 2015, 176, 106–114. [Google Scholar] [CrossRef] [PubMed]
- Llorent-Martínez, E.J.; Spínola, V.; Gouveia, S.; Castilho, P.C. HPLC-ESI-MSn characterization of phenolic compounds, terpenoid saponins, and other minor compounds in Bituminaria bituminosa. Ind. Crops Prod. 2015, 69, 80–90. [Google Scholar] [CrossRef]
- Barros, L.; Dueñas, M.; Pinela, J.; Carvalho, A.M.; Buelga, C.; Ferreira, I.C.F.R. Characterization and Quantification of Phenolic Compounds in Four Tomato (Lycopersicon esculentum L.) Farmers’ Varieties in Northeastern Portugal Homegardens. Plant Foods Hum. Nutr. 2012, 67, 229–234. [Google Scholar] [CrossRef] [PubMed]
- Jaiswal, R.; Kuhnert, N. Identification and characterization of five new classes of chlorogenic acids in burdock (Arctium lappa L.) roots by liquid chromatography/tandem mass spectrometry. Food Funct. 2011, 2, 63–71. [Google Scholar] [CrossRef] [PubMed]
- Fischer, S.; Berti, M.; Wilckens, R.; Baeza, M.; Pastene, E.; Inostroza, L.; Tramón, C.; Gonzalez, W. Characterization and propagation of some medicinal plants in the central-south region of Chile. Ind. Crops Prod. 2011, 34, 1313–1321. [Google Scholar]
- Žugić, A.; Đorđević, S.; Arsić, I.; Marković, G.; Živković, J.; Jovanović, S.; Tadić, V. Antioxidant activity and phenolic compounds in 10 selected herbs from Vrujci Spa, Serbia. Ind. Crops Prod. 2014, 52, 519–527. [Google Scholar] [CrossRef]
- Fernández-Arroyo, S.; Rodríguez-Medina, I.C.; Beltrán-Debón, R.; Pasini, F.; Joven, J.; Micol, V.; Segura-Carretero, A.; Fernández-Gutiérrez, A. Quantification of the polyphenolic fraction and in vitro antioxidant and in vivo anti-hyperlipemic activities of Hibiscus sabdariffa aqueous extract. Food Res. Int. 2011, 44, 1490–1495. [Google Scholar] [CrossRef]
- Masuoka, N.; Nihei, K.-I.; Maeta, A.; Yamagiwa, Y.; Kubo, I. Inhibitory effects of cardols and related compounds on superoxide anion generation by xanthine oxidase. Food Chem. 2015, 166, 270–274. [Google Scholar] [CrossRef] [PubMed]
- Simirgiotis, M.J.; Schmeda-Hirschmann, G.; Bórquez, J.; Kennelly, E.J. The Passiflora tripartita (Banana Passion) Fruit: A source of bioactive flavonoid C-glycosides isolated by HSCCC and characterized by HPLC-DAD-ESI/MS/MS. Molecules 2013, 18, 1672–1692. [Google Scholar] [CrossRef] [PubMed] [Green Version]
- Benzie, I.F.F.; Strain, J.J. The ferric reducing ability of plasma (FRAP) as a measure of ‘‘Antioxidant Power’’: The FRAP assay. Anal. Biochem. 1996, 239, 70–76. [Google Scholar] [CrossRef] [PubMed]
- Brito, A.; Ramirez, J.E.; Areche, C.; Sepúlveda, B.; Simirgiotis, M.J. HPLC-UV-MS Profiles of Phenolic Compounds and Antioxidant Activity of Fruits From Three Citrus Species Consumed in Northern Chile. Molecules 2014, 19, 17400–17421. [Google Scholar] [CrossRef] [PubMed]
- Simirgiotis, M.J. Antioxidant Capacity and HPLC-DAD-MS Profiling of Chilean Peumo (Cryptocarya alba) Fruits and Comparison with German Peumo (Crataegus monogyna) from Southern Chile. Molecules 2013, 18, 2061–2080. [Google Scholar] [CrossRef] [PubMed]
- Simirgiotis, M.J.; Adachi, S.; To, S.; Yang, H.; Reynertson, K.A.; Weinstein, I.B.; Kennelly, E.J.; Basile, M.J.; Gil, R.R. Cytotoxic chalcones and antioxidants from the fruits of Syzygium samarangense (Wax Jambu). Food Chem. 2008, 107, 813–819. [Google Scholar] [CrossRef] [PubMed]
- Sample Availability: Samples of the plants and extracts are available from authors.
© 2015 by the authors. Licensee MDPI, Basel, Switzerland. This article is an open access article distributed under the terms and conditions of the Creative Commons Attribution license ( http://creativecommons.org/licenses/by/4.0/).
Share and Cite
Simirgiotis, M.J.; Benites, J.; Areche, C.; Sepúlveda, B. Antioxidant Capacities and Analysis of Phenolic Compounds in Three Endemic Nolana Species by HPLC-PDA-ESI-MS. Molecules 2015, 20, 11490-11507. https://doi.org/10.3390/molecules200611490
Simirgiotis MJ, Benites J, Areche C, Sepúlveda B. Antioxidant Capacities and Analysis of Phenolic Compounds in Three Endemic Nolana Species by HPLC-PDA-ESI-MS. Molecules. 2015; 20(6):11490-11507. https://doi.org/10.3390/molecules200611490
Chicago/Turabian StyleSimirgiotis, Mario J., Julio Benites, Carlos Areche, and Beatriz Sepúlveda. 2015. "Antioxidant Capacities and Analysis of Phenolic Compounds in Three Endemic Nolana Species by HPLC-PDA-ESI-MS" Molecules 20, no. 6: 11490-11507. https://doi.org/10.3390/molecules200611490