
Comparison of Fruits of Forsythia suspensa at Two Different Maturation Stages by NMR-Based Metabolomics

Abstract
: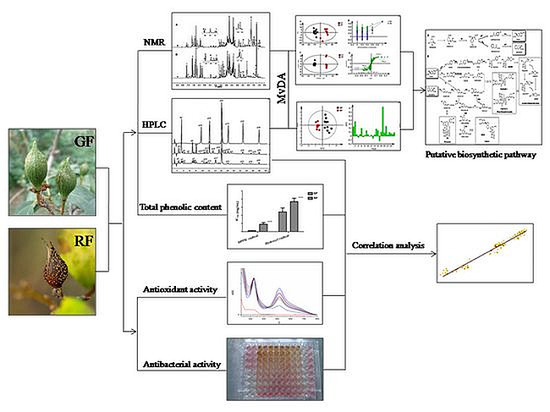
1. Introduction
2. Results
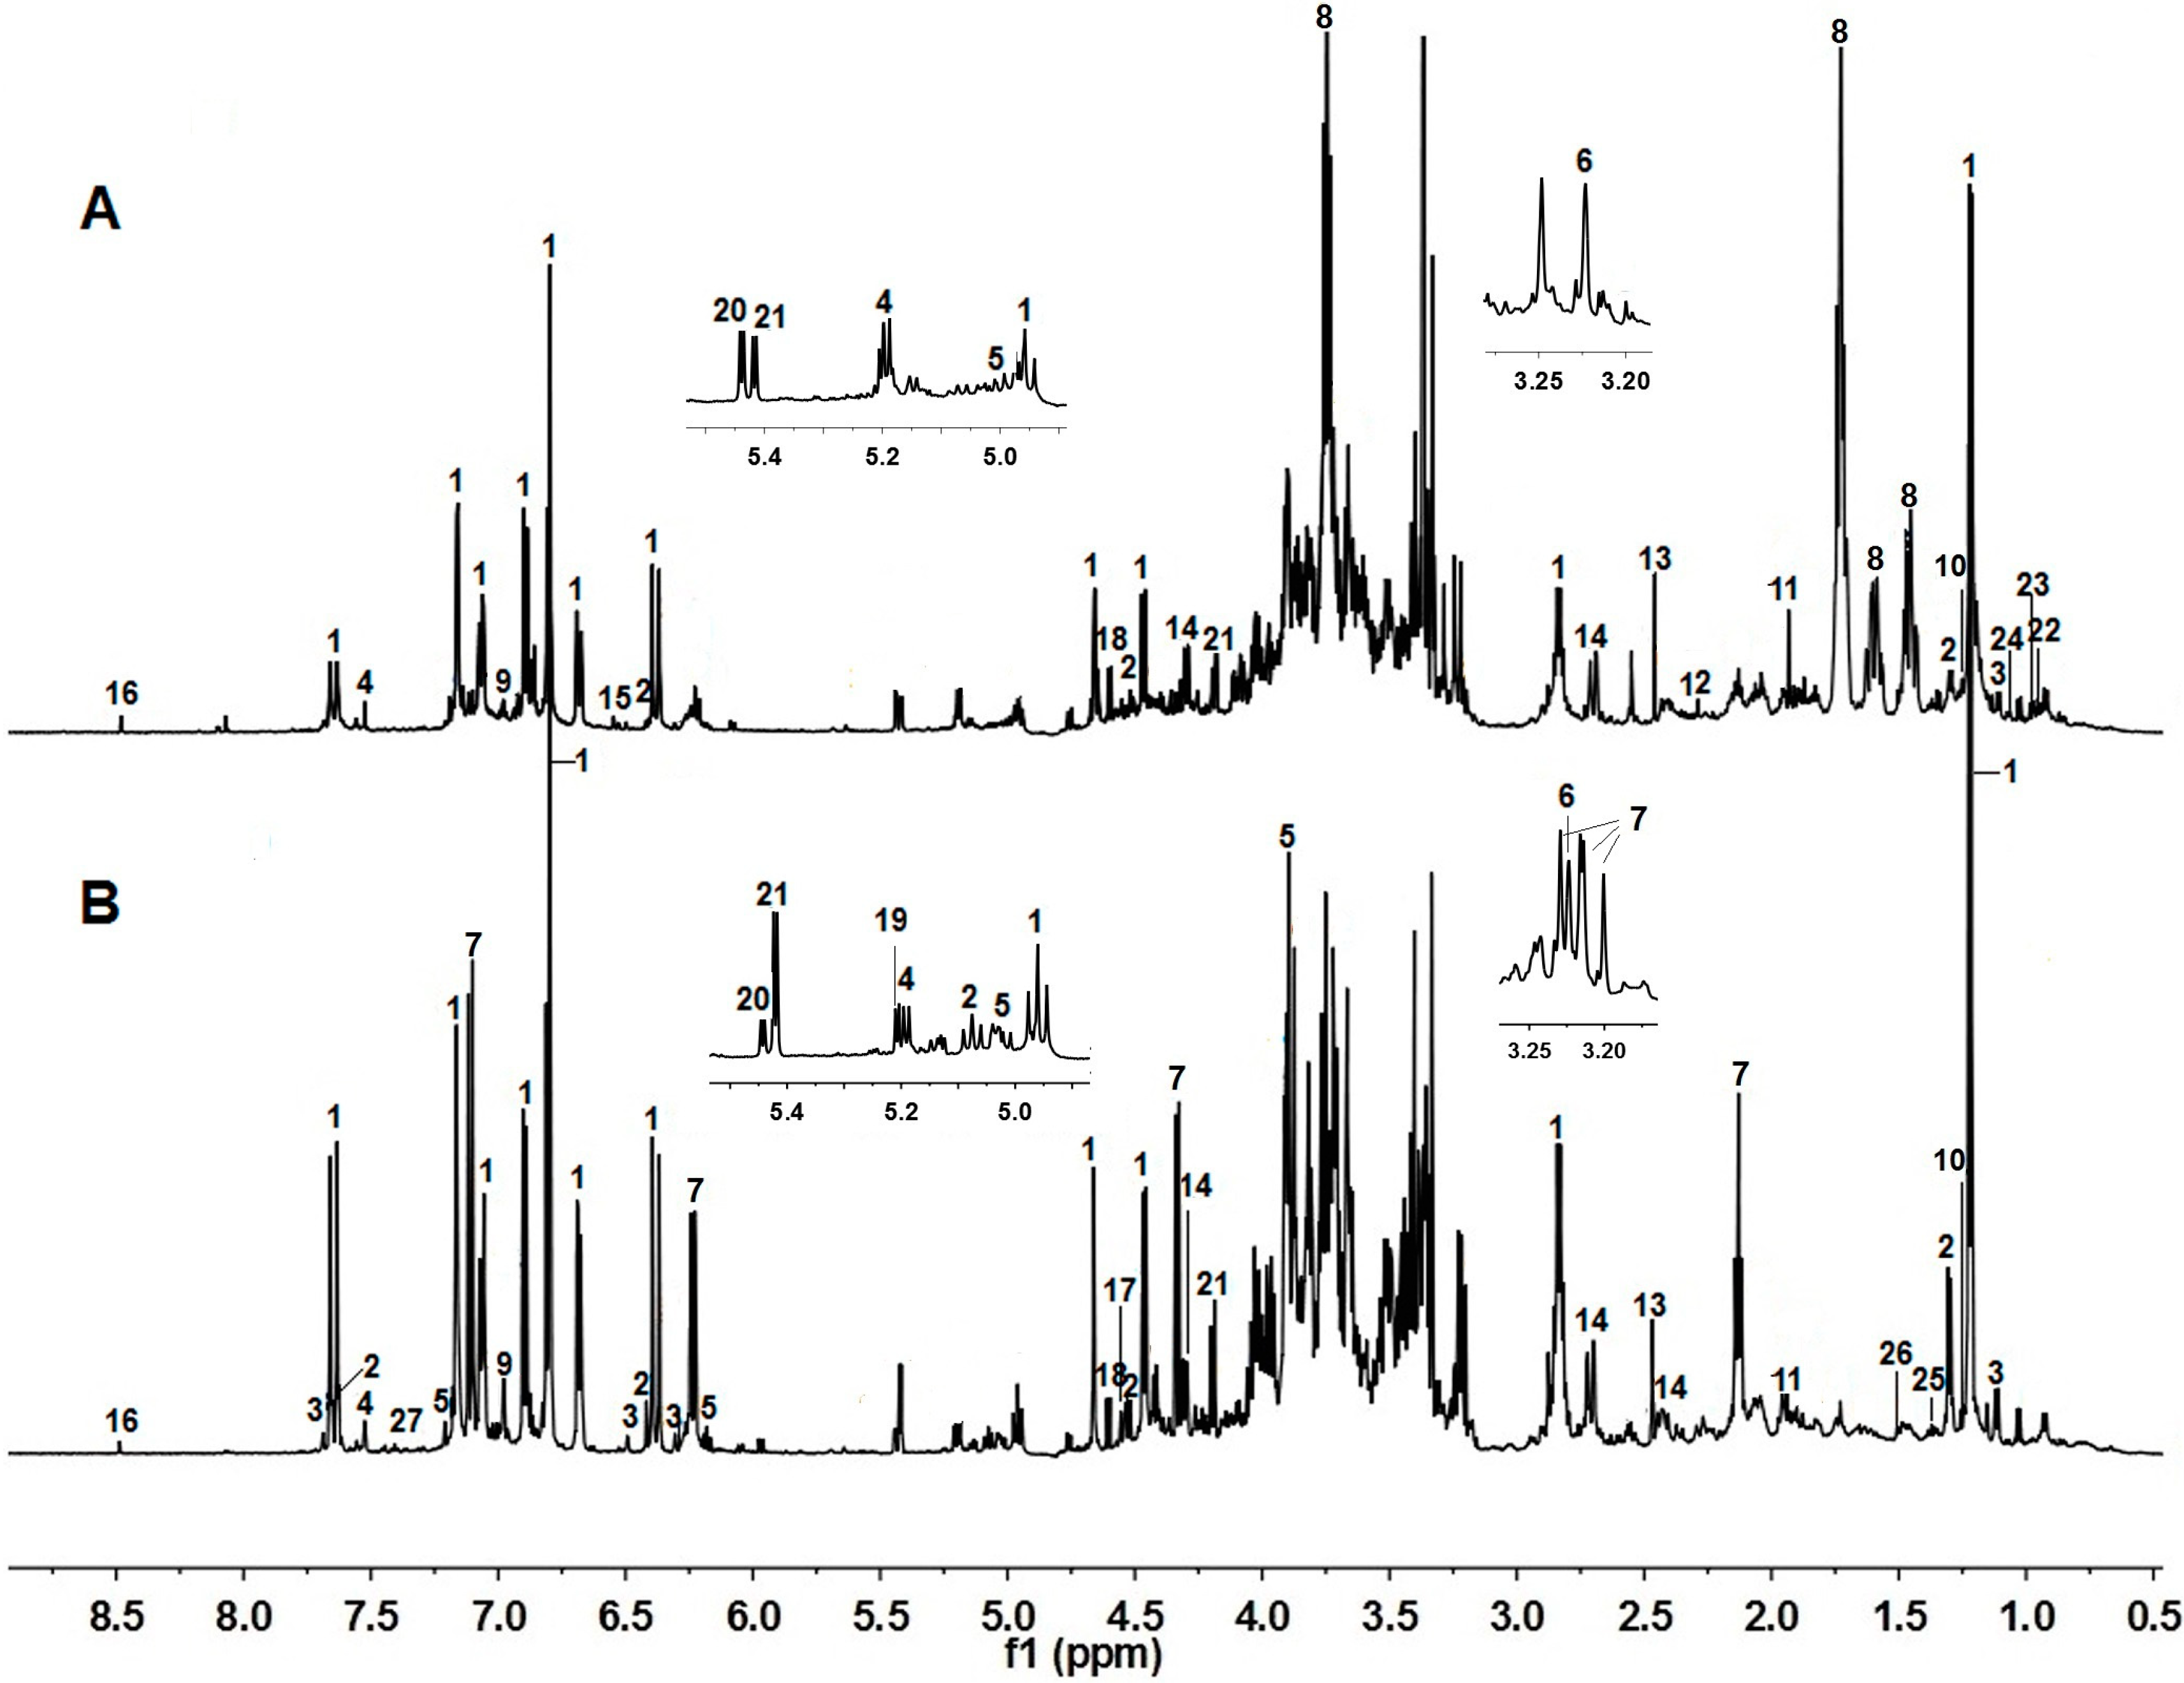
2.1. NMR Metabolic Profiling

| No. | Chemical Shift (δ, ppm), Assignments and Coupling Constants (J, Hz) | Identification Compound | GF/RF (Fold Change) | VIP Value | Reference | ||||||
|---|---|---|---|---|---|---|---|---|---|---|---|
| 1 | δ 7.63 (H-7′, d, 16.2), 7.16 (H-2′, d, 2.0), 7.06 (H-6′, dd, 1.8, 8.4), 6.90 (H-5′, d, 8.4), 6.81 (H-5, d, 8.4), δ 6.80 (H-2, brs), 6.68 (H-6, dd, 1.8, 7.8), 6.37 (H-8′, d, 16.2), 4.66 (H-1, d, 1.2), 4.46 (H-1’’, d, 7.8), 2.84 (H-7, m), 1.22 (H-6′′′, d, 6.0) | Forsythoside A a | 5.07↓ *** | 2.65 | [18,19] | ||||||
| 2 | δ 7.65 (H-7′,d, 15.6), 7.16 (H-2′,d, 1.8), 6.80 (H-5, d, 8.4), 6.68 (H-6, dd, 1.8, 7.8), 6.41 (H-8′,d, 16.2), 4.53 (H-1, d, 8.4), 1.29 (H-6′′′, d, 6.6) | Forsythoside C a | 2.78↓ *** | 1.40 | [1,20] | ||||||
| 3 | δ 7.69 (H-2′, d, 1.8), 6.31 (H-6, d, 2.0), 6.53 (H-8, d, 2.0), 5.01 (H-1′′, d, 7.7), 4.52 (H-1′′′, d, 2.0), 1.12 (H-6′′′, d, 6.1) | Rutin a | 2.62↓ *** | 1.18 | [21] | ||||||
| 4 | δ 7.53 (H-3, brs), 5.16 (H-1, d, 6.0), | Adoxosidic acid a | 0.83↑ | 0.46 | [22] | ||||||
| 5 | δ 7.18 (H-2′, d, 8.4), 7.08 (H-2, d, 1.8), 7.0 (m), 4.57 (H-7, d, 6.6), 4.16 (d, 9.6) | Phillyrin a | 1.35↓ *** | 1.66 | [23] | ||||||
| 6 | δ 3.22 (N (CH3), s) | Choline c | 1.05↓ | 0.20 | [21] | ||||||
| 7 | δ 7.11 (H-2, H-6, d, 10.2), 6.24 (H-3, H-5, dd, 1.8, 10.2), 4.33 (H-8, d, 7.8), 2.13 (H-7, t, 6.6) | Cornoside c | 3.87↓ *** | 2.16 | [24,25] | ||||||
| 8 | δ 3.75 (H-8, t, 7.2), δ1.73 (H-7, t, 7.8), δ 1.60 (H-3, H-5, m), δ 1.46 (H-2, H-6, m) | Rengyol c | 0.10↑ *** | 5.27 | [26,27] | ||||||
| 9 | δ 7.00 (H-2, H-6, s) | Gallic acid a | 1.87↓ *** | 1.73 | [21] | ||||||
| 10 | δ 2.56 (m), 1.25 (γ-CH3, d, 6.6) | 3-Hydroxybutyric acid c | 0.62↑ *** | 0.47 | [28] | ||||||
| 11 | δ 1.94 (CH3, s) | Acetic acid c | 0.83↑ | 0.70 | [16,21] | ||||||
| 12 | δ 2.35 (CH3, s) | Pyruvic acid c | 0.71↑ | 0.38 | [28] | ||||||
| 13 | δ 2.46 (CH2, s) | Succinic acid c | 1.19↓ | 0.67 | [16,21] | ||||||
| 14 | δ 4.30 (α-CH, dd, 9.6, 3.6), 2. 71 (β-CH, dd, 15.6, 3.6), 2.30 (β′-CH dd, 15.0, 9.6) | Malic acid c | 0.69↑ | 0.80 | [16,21] | ||||||
| 15 | δ 6.55 (α-CH, s) | Fumaric acid c | 0.63↑ * | 0.22 | [21] | ||||||
| 16 | δ 8.48(H-COOH, s) | Formic acid c | 0.23↑ ** | 0.06 | [21] | ||||||
| 17 | δ 4.55(H-1, d, 9) | β-Xylose c | 0.91↑ | 0.64 | [16] | ||||||
| 18 | δ 4.60(H-1, d, 7.8) | β-Glucose b,c | 0.61↑ *** | 1.15 | [16,21] | ||||||
| 19 | δ 5.20(H-1, d, 3.8) | α-Glucose b,c | 0.98↑ | 0.46 | [16,21] | ||||||
| 20 | δ 4.97 (H-1, d, 3.6Hz), 5.43 (H-1, d, 4.2 Hz) | Raffinose c | 0.89↑ ** | 0.68 | [16] | ||||||
| 21 | δ 5.42 (Glu-H-1, d, 3.6), 4.19 (Fru-H-1, d, 8.4) | Sucrose b,c | 3.33↓ ** | 0.97 | [21] | ||||||
| 22 | δ 1.03 (γ-CH3, d,7.2 Hz), 0.96 (β-CH3, t, 7.2 Hz) | Isoleucine b,c | 0.74↑ ** | 0.66 | [16,28] | ||||||
| 23 | δ 0.98 (δ-CH3, t, 6 Hz) | Leucine b,c | 0.56↑ ** | 0.59 | [16,28] | ||||||
| 24 | δ 2.27 (m), 1.06 (γ′-CH3, d, 7.2), 1.02 (γ-CH3, d, 7.2) | Valine b,c | 0.75↑ | 0.26 | [21] | ||||||
| 25 | δ 1.33 (CH3, d, 6.6) | Threonine b,c | 0.59↑ ** | 0.80 | [21] | ||||||
| 26 | δ 1.50 (α-CH, d, 7.2) | Alanine b,c | 0.28↑ *** | 0.73 | [16,28] | ||||||
| 27 | δ 7.40 (Ar-CH, m), 7.31 (Ar-CH, d, 6.6) | Phenylalanine b,c | 1.90↓ * | 0.38 | [21] | ||||||

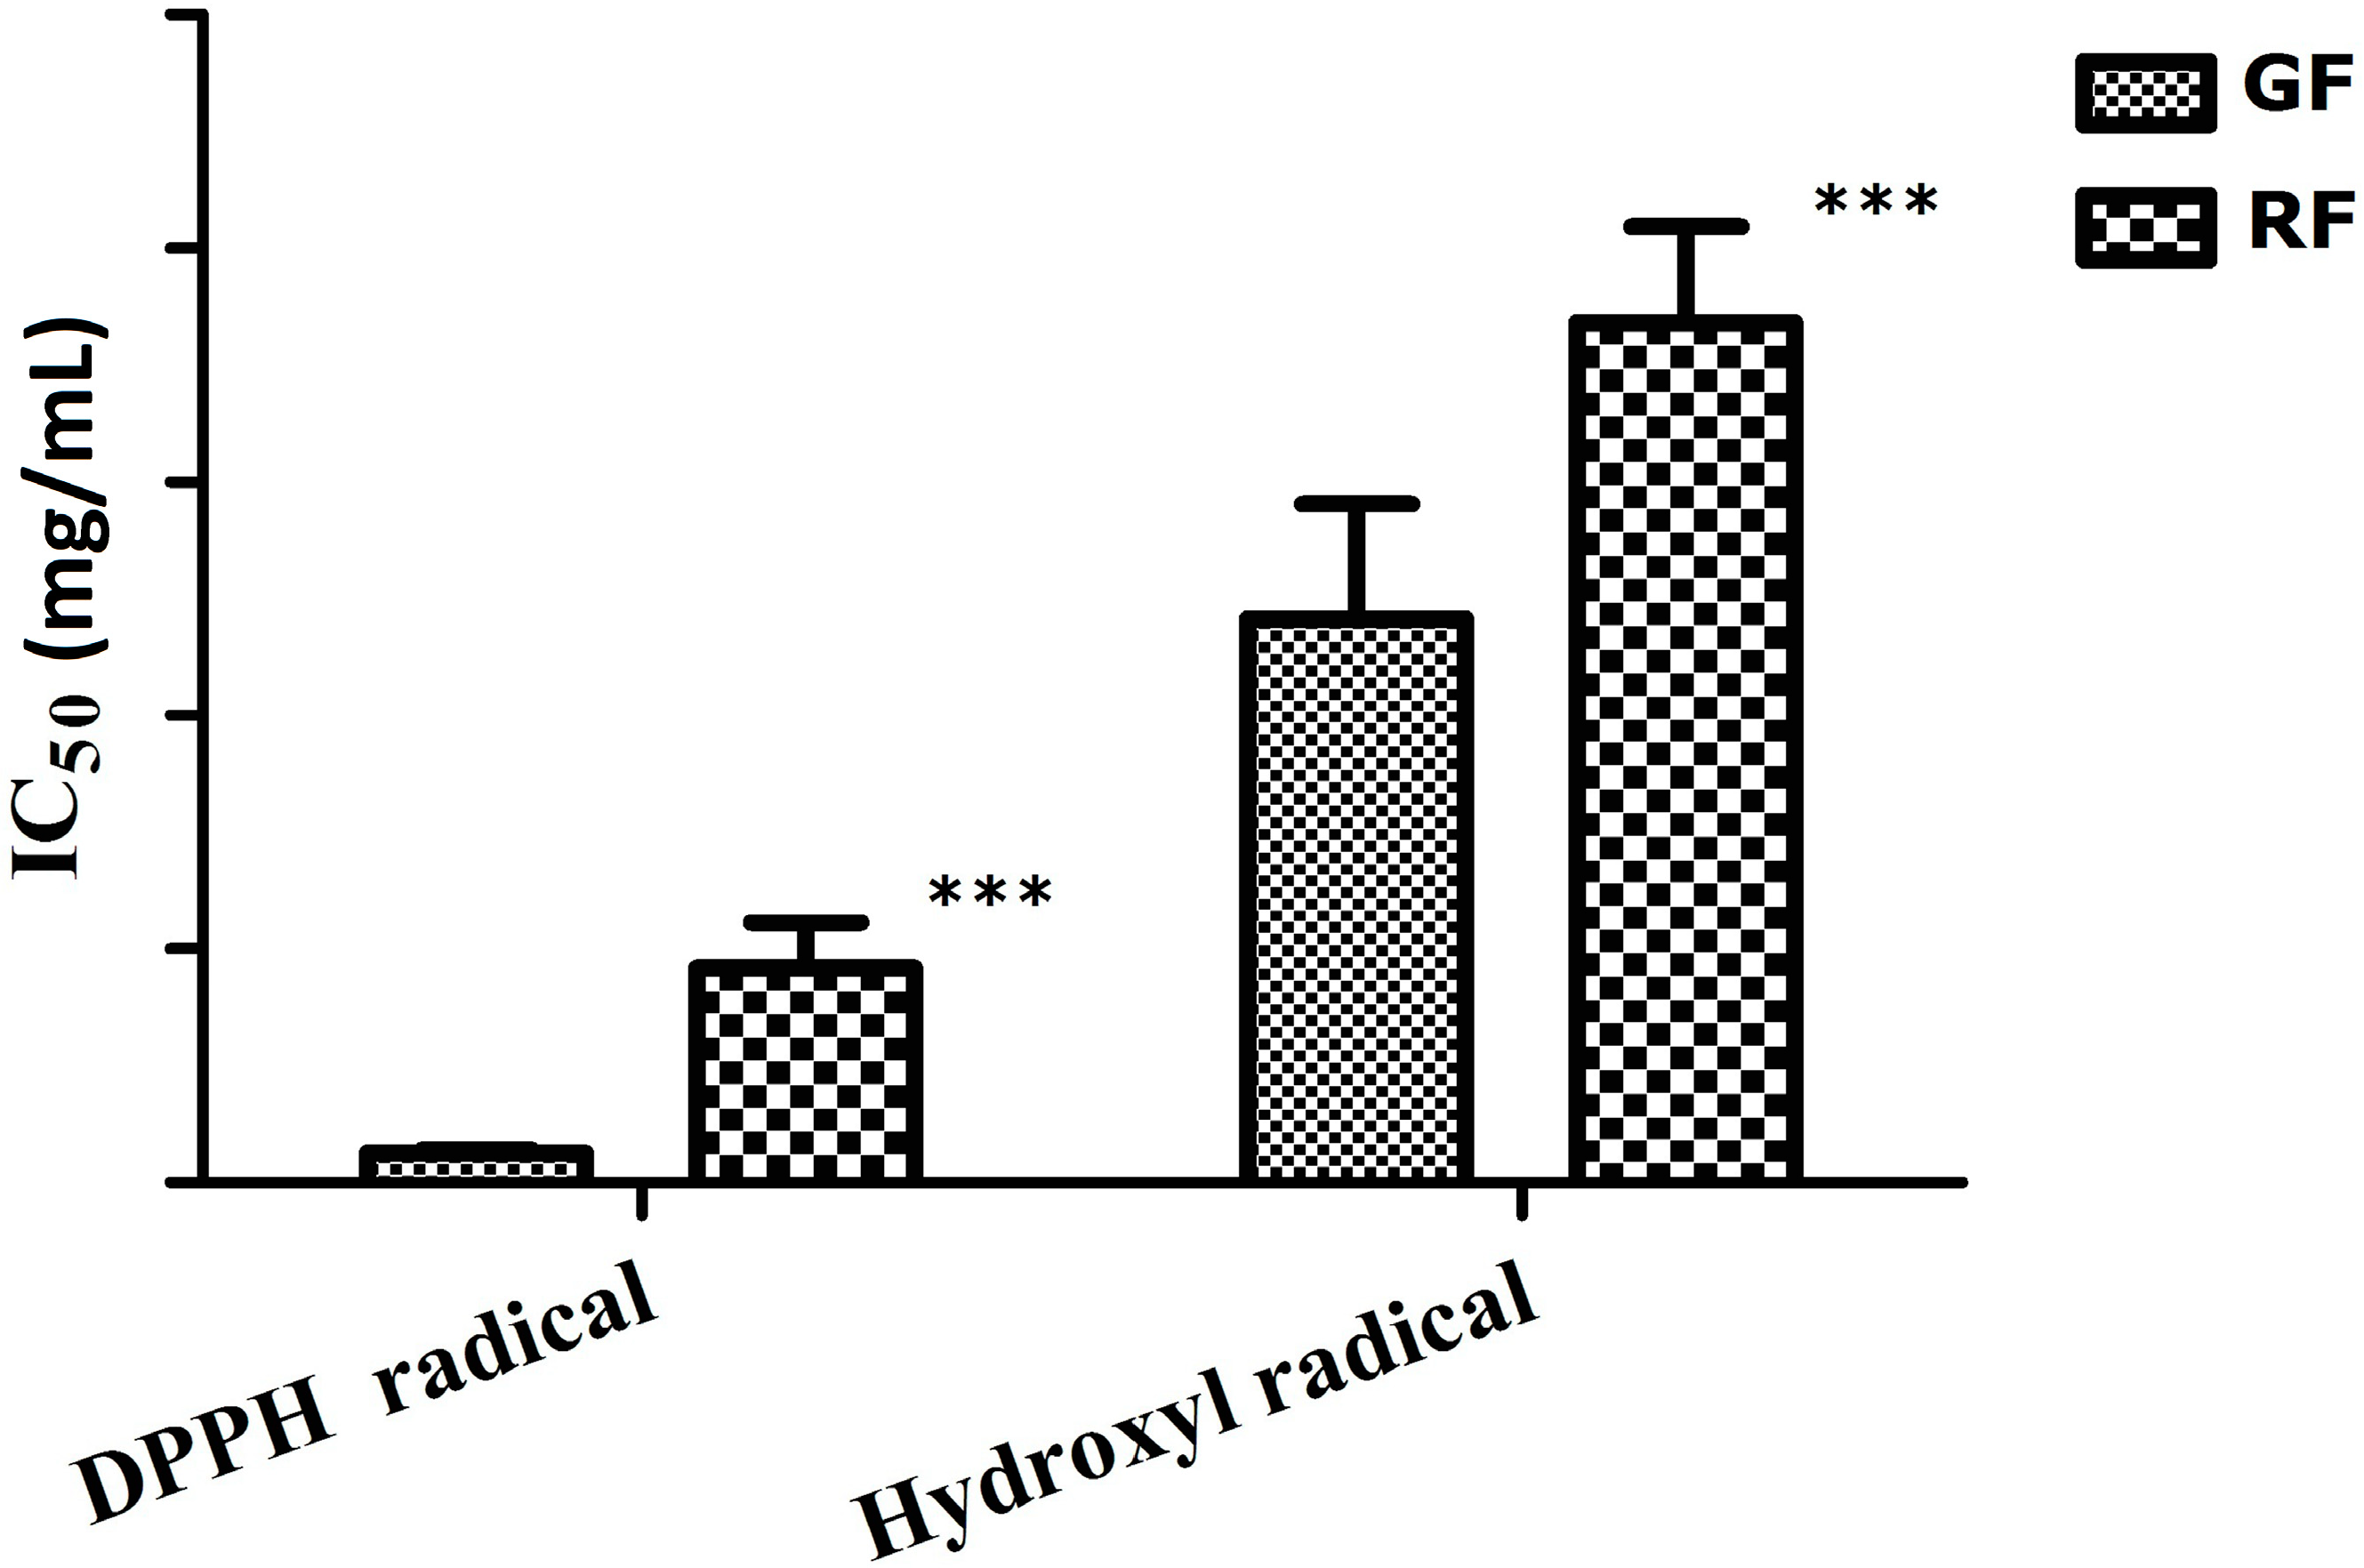
2.2. Antioxidant Activity
2.3. Antibacterial Activity
| Groups | Minimum Inhibitory Concentration (MIC, mg∙mL−1) | |||
|---|---|---|---|---|
| Escherichia coli | Pseudomonas aeruginosa | Staphylococcus aureus | Bacillus subtilis | |
| GF | 11.25 ± 2.63 | 16.25 ± 6.04 | 3.59 ± 1.48 | 8.13 ± 3.02 |
| RF | 9.37 ± 3.29 | 15.00 ± 3.29 | 3.90 ± 1.69 | 8.75 ± 3.23 |
| Streptomycin | 0.097 | 0.049 | 0.39 | 0.049 |
3. Discussions
3.1. Metabolic Profiling of Fruits at Different Maturity Stages of F. suspensa (GF and RF)
3.2. In Vitro Antioxidant and Antibacterial Activities of Fruits in Different Maturation Stages of F. suspensa (GF and RF)
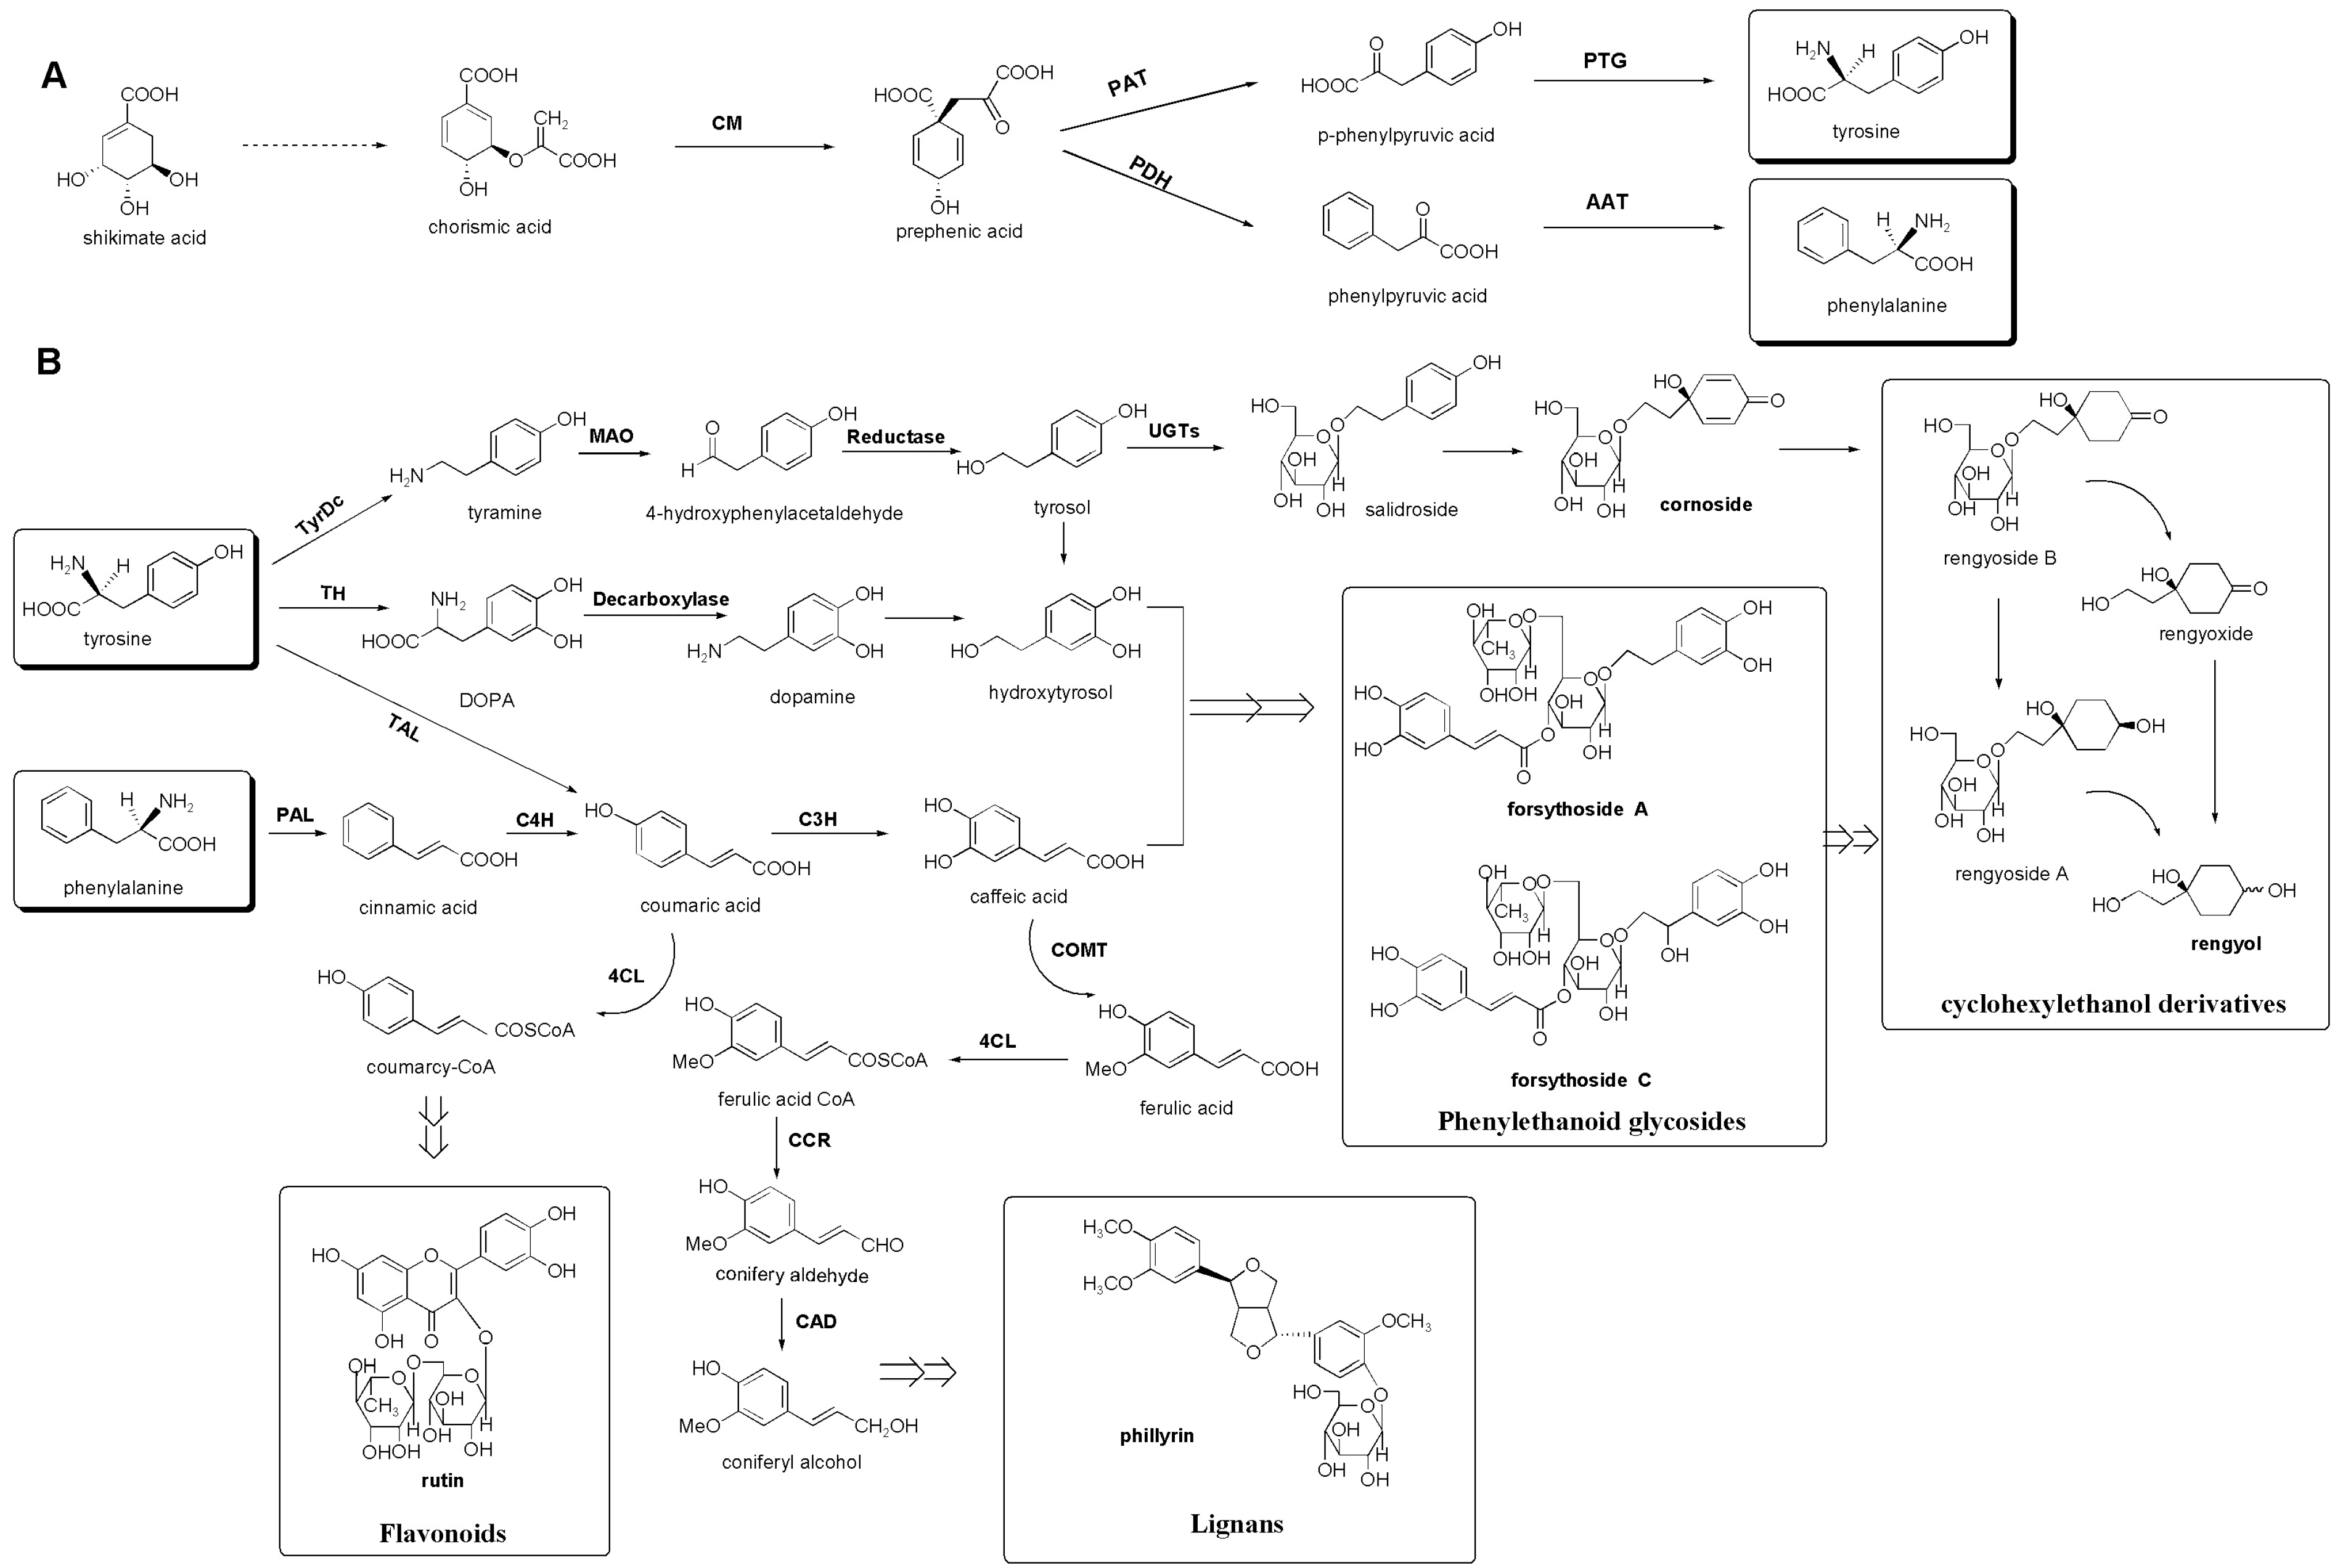
3.3. Putative Biosynthetic Pathways of the Major Secondary Metabolites in F. suspensa

4. Experimental Section
4.1. Chemicals and Reagents
4.2. Plant Materials
| No. | Habitat | Collection Time | Growing Pattern |
|---|---|---|---|
| GF01 | Anze, Shanxi, China | 5 September 2013 | wild |
| GF02 | Guxian, Shanxi, China | 10 September 2013 | wild |
| GF03 | Fushan, Shanxi, China | 7 September 2013 | wild |
| GF04 | Lingchuan, Shanxi, China | 9 September 2013 | wild |
| GF05 | Pingshun, Shanxi, China | 11 September 2013 | wild |
| GF06 | Qinshui, Shanxi, China | 6 September 2013 | wild |
| GF07 | Zhangzi, Shanxi, China | September 13, 2013 | wild |
| GF08 | Tunliu, Shanxi, China | 13 September 2013 | wild |
| GF09 | Zuoquan, Shanxi, China | 12 September 2013 | wild |
| GF10 | Licheng, Shanxi, China | 12 September 2013 | wild |
| RF01 | Anze, Shanxi, China | 9 October 2013 | wild |
| RF02 | Guxian, Shanxi, China | 9 October 2013 | wild |
| RF03 | Fushan, Shanxi, China | 10 October 2013 | wild |
| RF04 | Lingchuan, Shanxi, China | 11 October 2013 | wild |
| RF05 | Pingshun, Shanxi, China | 17 October 2013 | wild |
| RF06 | Qinshui, Shanxi, China | 17 October 2013 | wild |
| RF07 | Zhangzi, Shanxi, China | 15 October 2013 | wild |
| RF08 | Tunliu, Shanxi, China | 21 October 2013 | wild |
| RF09 | Zuoquan, Shanxi, China | 20 October 2013 | wild |
| RF10 | Licheng, Shanxi, China | 20 October 2013 | wild |
4.4. Antioxidant Activity
4.4.1. DPPH Radical Scavenging Assay
4.4.2. Hydroxyl Radical Scavenging Assay
4.5. Antibacterial Activity
4.6. Data Analysis
5. Conclusions
Supplementary Materials
Acknowledgments
Author Contributions
Conflicts of Interest
References
- Nishibe, S.; Okabe, K.; Tsukamoto, H.; Sakushima, A.; Hisada, S.; Baba, H.; Akisada, T. Studies on the Chinese crude drug Forsythiae Fructus VI. The structure and antibacterial activity of suspersaside isolated from Forsythia suspensa. Chem. Pharm. Bull. 1982, 30, 4548–4553. [Google Scholar] [CrossRef] [PubMed]
- Ozaki, Y.; Rui, J.; Tang, Y.; Satake, M. Antiinflammatory effect of Forsythia suspensa Vahl and its active fraction. Biol. Pharm. Bull. 1997, 20, 861–864. [Google Scholar] [CrossRef] [PubMed]
- Zhang, H.Y. Advances in studies on chemical constituents of Forsythia suspensa and their pharmacological activities. J. Chin. Med. Mater. 2000, 23, 657–660. [Google Scholar]
- The State Pharmacopoeia Commission of P. R. China. Pharmacopoeia of the People’s Republic of China, 1st ed.; China Medical Science and Technology Press: Beijing, China, 2010; Volume 1, pp. 159–160. [Google Scholar]
- Xiao, P.G.; Li, D.P.; Yang, S.L. Modern Chinese Material Medica, 1st ed.; Chemical Industry Press: Beijing, China, 2002; Volume 2, pp. 280–289. [Google Scholar]
- Qu, H.H.; Li, B.X.; Li, X.G.; Tu, Z.; Lü, J.; Sun, W.J. Qualitative and quantitative analyses of three bioactive compounds in different parts of Forsythia suspensa by high-performance liquid chromatography-electrospray ionization-mass spectrometry. Microchem J. 2008, 89, 159–164. [Google Scholar] [CrossRef]
- Guo, H.; Liu, A.H.; Ye, M.; Yang, M.; Guo, D.A. Characterization of phenolic compounds in the fruits of Forsythia suspensa by high-performance liquid chromatography coupled with electrospray ionization tandem mass spectrometry. Rapid Commun. Mass Spectrom. 2007, 21, 715–729. [Google Scholar] [CrossRef] [PubMed]
- Xia, Y.G.; Yang, B.Y.; Wang, Q.H.; Liang, J.; Wei, Y.H.; Yu, H.D.; Zhang, Q.B.; Kuang, H.X. Quantitative analysis and chromatographic fingerprinting for the quality evaluation of Forsythia suspensa extract by HPLC coupled with photodiode array detector. J. Sep. Sci. 2009, 32, 4113–4125. [Google Scholar] [CrossRef] [PubMed]
- Guo, H.; Liu, A.H.; Li, L.; Guo, D.A. Simultaneous determination of 12 major constituents in Forsythia suspensa by high performance liquid chromatography-DAD method. J. Pharm. Biomed. Anal. 2007, 43, 1000–1006. [Google Scholar] [CrossRef] [PubMed]
- Wang, D.; Zhou, Y.Y. Study on quality standards for Qingqiao. J. Harbin Univ. Commer. (Nat. Sci. Ed.) 2004, 20, 642–643. (In Chinese) [Google Scholar]
- Kim, H.K.; Choi, Y.H.; Verpoorte, R. NMR-based plant metabolomics: Where do we stand, where do we go? Trends Biotechnol. 2011, 29, 267–275. [Google Scholar] [CrossRef] [PubMed]
- Wolfender, J.L.; Rudaz, S.; Choi, Y.H.; Kim, H.K. Plant metabolomics: From holistic data to relevant biomarkers. Curr. Med. Chem. 2013, 20, 1056–1090. [Google Scholar] [PubMed]
- Fan, G.; Luo, W.Z.; Luo, S.H.; Li, Y.; Meng, X.L.; Zhou, X.D.; Zhang, Y. Metabolic discrimination of Swertia mussotii and Swertia chirayita known as “Zangyinchen” in traditional Tibetan medicine by 1H-NMR-based metabolomics. J. Pharm. Biomed. Anal. 2014, 98, 364–370. [Google Scholar] [CrossRef] [PubMed]
- Zahmanov, G.; Alipieva, K.; Simova, S.; Georgiev, M.I. Metabolic differentiations of dwarf elder by NMR-based metabolomics. Phytochem. Lett. 2015, 11, 404–409. [Google Scholar] [CrossRef]
- Petrakis, E.A.; Cagliani, L.R.; Polissiou, M.G.; Consonni, R. Evaluation of saffron (Crocus sativus L.) adulteration with plant adulterants by 1H-NMR metabolite fingerprinting. Food Chem. 2015, 173, 890–896. [Google Scholar] [CrossRef] [PubMed]
- He, P.; Li, Z.Y.; Xing, J.; Qin, X.M.; Du, G.H. 1H-NMR based metabolic profiling of the processing effect on Rehmanniae Radix. Anal. Methods 2014, 6, 2736–2744. [Google Scholar] [CrossRef]
- Markley, J.L.; Maziuk, D.; Ulrich, E.L.; Wedell, J.; Wenger, R.K.; Yao, H.Y. Biological Magnetic Resonance Data Bank. Available online: http://www.bmrb.wisc.edu/metabolomics/metabolomics_standards.shtml (accessed on 6 February 2015).
- Endo, K.; Takahashi, K.; Abe, T.; Hikino, H. Structure of forsythoside A, an antibacterial Principle of Forsythia suspensa leaves. Heterocycles 1981, 16, 1311–1314. [Google Scholar]
- Nishibe, S.; Okabe, K.; Tsukamoto, H.; Sakushima, A.; Hisada, S. The structure of forsythiaside isolated from Forsythia suspensa. Chem. Pharm. Bull. 1982, 30, 1048–1050. [Google Scholar] [CrossRef]
- Ming, D.S.; Yu, D.Q.; Yu, S.S. Two new caffeyol glycosides from Forsythia suspensa. J. Asian Nat. Prod. Res. 1999, 1, 327–335. [Google Scholar] [CrossRef] [PubMed]
- Zhi, H.J.; Qin, X.M.; Sun, H.F.; Zhang, L.Z.; Guo, X.Q.; Li, Z.Y. Metabolic fingerprinting of Tussilago farfara L. using 1H-NMR spectroscopy and multivariate data analysis. Phytochem. Anal. 2012, 23, 492–501. [Google Scholar]
- Damto, S.; Jensen, S.R.; Nielsen, B.J. 13C- and 1H-NMR spectroscopy as a tool in the configurational analysis of iridoid glucoside. Phytochemistry 1981, 20, 2717–2732. [Google Scholar] [CrossRef]
- Deyama, T.; Ikawa, T.; Kitagawa, S.; Nishibe, S. The constituents of Eucommia ulmoides Oliv. Ⅲ. isolation and structure of a new lignan glycoside. Chem. Pharm. Bull. 1986, 34, 523–527. [Google Scholar] [CrossRef]
- Takeshi, H.; Kawamoto, Y.; Ohtani, K.; Kasai, R.; Yamasaki, K.; Picheansoonthon, C. Cyclohexylethanoids and related glucosides from Millingtonia hortensis. Phytochemistry 1995, 39, 225–241. [Google Scholar]
- Kuwajima, H.; Takai, Y.; Takaishi, K.; Inoue, K. Synthesis of 13C-labeled possible intermediates in the biosynthesis of phenylethanoid derivatives, cornoside and rengyosides. Chem. Pharm. Bull. 1998, 46, 581–586. [Google Scholar] [CrossRef]
- Endo, K.; Hikino, H. Structures of rengyol, rengyoxide and rengyolone, new cyclohexylethane derivatives from Forsythia suspensa fruits. Can. J. Chem. 1984, 62, 2011–2014. [Google Scholar] [CrossRef]
- Kobler, C.; Effenberger, F. Chemo enzymatic synthesis of Rengyol and Isorengyol. Tetrahedron 2006, 62, 4823–4828. [Google Scholar] [CrossRef]
- Kim, H.S.; Park, S.J.; Hyun, S.H.; Yang, S.O.; Lee, J.; Auh, J.H.; Kim, J.H.; Cho, S.M.; Marriott, P.J.; Choi, H.K. Biochemical monitoring of black raspberry (Rubus coreanus Miquel) fruits according to maturation stage by 1H-NMR using multiple solvent systems. Food Res. Int. 2011, 44, 1977–1987. [Google Scholar] [CrossRef]
- Eriksson, L.; Trygg, J.; Wold, S. CV-ANOVA for significance testing of PLS and OPLS models. J. Chemom. 2008, 22, 594–600. [Google Scholar] [CrossRef]
- Yue, X.H.; Xue, H.Q.; Gao, L.; Li, M.; Shang, C.L. Analysis on amino and trace elements of Green Fructus Forsythiae and Grown Fructus Forsythiae from Shanxi Anze. Chin. J. Exp. Tradit. Med. Form. 2014, 20, 81–83. (In Chinese) [Google Scholar]
- Qu, H.H.; Zhang, Y.M.; Wang, Y.; Li, B.X.; Sun, W.J. Antioxidant and antibacterial activity of two compounds (forsythiaside and forsythin) isolated from Forsythia suspensa. J. Pharm. Pharmacol. 2008, 60, 261–266. [Google Scholar] [CrossRef] [PubMed]
- Dewiek, P.M. The shikimate pathway: Aromatic amino acid and phenylpropanoids. In Medicinal Natural Products: A Biosynthetic Approach, 3rd ed.; John Wiley & Sons. Ltd: New York, NY, USA, 2009; pp. 137–165. [Google Scholar]
- Endo, K.; Seya, K.; Hikino, H. Biogenesis-like transformation of salidroside to rengyol and its relate cyclohexyletanoids of Forsythia suspensa. Tetrahedron 1989, 43, 3673–3682. [Google Scholar] [CrossRef]
- Brenda, W.S. Flavonoid biosynthesis. A colorful model for genetics, biochemistry, cell biology, and biotechnology. Plant Physiol. 2001, 126, 485–493. [Google Scholar]
- Humphreys, J.M.; Chapple, C. Rewriting the lignin roadmap. Plant Biol. 2002, 5, 224–229. [Google Scholar] [CrossRef]
- Alipieva, K.; Korkina, L.; Orhan, I.E.; Georgiev, M.I. Verbascoside—A review of its occurrence, (bio)synthesis and pharmacological significance. Biotechnol. Adv. 2014, 32, 1065–1076. [Google Scholar] [CrossRef] [PubMed]
- Saimaru, H.; Orihara, Y. Biosynthesis of acteoside in cultured cells of Olea europaea. J. Nat. Med. 2010, 64, 139–145. [Google Scholar] [CrossRef] [PubMed]
- Hu, G.S.; Jia, J.M.; Kim, D.H. Effect of feeding tyosine and phenylalanine on the accumulation of phenylethanoind glycosides to Cistance deserticola cell suspension culture. Chin. J. Nat. Med. 2014, 12, 0367–0372. [Google Scholar]
- Endo, K.; Seya, K.; Hikino, H. Stereostructure of rengyol and isorengyol, phenylethanoids of Forsythia suspensa. Tetrahedron 1987, 43, 2681–2688. [Google Scholar] [CrossRef]
- Seya, K.; Endo, K.; Hikino, H. Structures of rengyosides A, B and C, three glucosides of Forsythia suspensa fruits. Phytochemistry 1989, 28, 1495–1498. [Google Scholar] [CrossRef]
- Beatriz, G.P.; Lennart, E.; Johan, T. Variable influence on projection (VIP) for orthogonal projections to latent structures (OPLS). J. Chemom. 2014, 28, 623–632. [Google Scholar]
- Zhao, J.; Jung, Y.H.; Jang, C.G.; Chun, K.H.; Kwon, S.W.; Lee, J. Metabolomic identification of biochemical changes induced by fluoxetine and imipramine in a chronic mild stress mouse model of depression. Sci. Rep. 2015, 5, 8890. [Google Scholar] [CrossRef] [PubMed]
- Brand-Williams, W.; Cuvelier, M.E.; Berset, C. Use of a free radical method to evaluate antioxidant activity. Lebensm-Wiss. Technol. 1995, 28, 25–30. [Google Scholar] [CrossRef]
- Qu, H.H.; Zhang, Y.M.; Chai, X.Y.; Sun, W.J. Isoforsythiaside, an antioxidant and antibacterial phenylethanoid glycoside isolated from Forsythia suspensa. Bioorg. Chem. 2012, 40, 87–91. [Google Scholar] [CrossRef] [PubMed]
- Guo, M.L.; Perez, C.; Wei, Y.B.; Rapoza, E.; Sua, G.; Bou-Abdallah, F.; Chasteen, N.D. Iron-binding properties of plant phenolics and cranberry’s bio-effects. Dalton Trans. 2007, 43, 4951–4961. [Google Scholar] [CrossRef] [PubMed]
- Eloff, J.N. A Sensitive and quick microplate method to determine the minimal inhibitory concentration of plant extracts for bacteria. Planta Med. 1998, 64, 711–713. [Google Scholar] [CrossRef] [PubMed]
- Kuo, P.C.; Chen, G.F.; Yang, M.L.; Lin, Y.H.; Peng, C.C. Chemical constituents from the fruits of Forsythia suspensa and their antimicrobial activity. BioMed Res. Int. 2014, 2014, 304830. [Google Scholar] [CrossRef] [PubMed]
- Sample Availability: Samples of the compounds forsythoside A, forsythoside C and adoxosidic acid are available from the authors.
© 2015 by the authors. Licensee MDPI, Basel, Switzerland. This article is an open access article distributed under the terms and conditions of the Creative Commons Attribution license ( http://creativecommons.org/licenses/by/4.0/).
Share and Cite
Jia, J.; Zhang, F.; Li, Z.; Qin, X.; Zhang, L. Comparison of Fruits of Forsythia suspensa at Two Different Maturation Stages by NMR-Based Metabolomics. Molecules 2015, 20, 10065-10081. https://doi.org/10.3390/molecules200610065
Jia J, Zhang F, Li Z, Qin X, Zhang L. Comparison of Fruits of Forsythia suspensa at Two Different Maturation Stages by NMR-Based Metabolomics. Molecules. 2015; 20(6):10065-10081. https://doi.org/10.3390/molecules200610065
Chicago/Turabian StyleJia, Jinping, Fusheng Zhang, Zhenyu Li, Xuemei Qin, and Liwei Zhang. 2015. "Comparison of Fruits of Forsythia suspensa at Two Different Maturation Stages by NMR-Based Metabolomics" Molecules 20, no. 6: 10065-10081. https://doi.org/10.3390/molecules200610065