Article

Structural Analysis of Metabolites of Asiatic Acid and Its Analogue Madecassic Acid in Zebrafish Using LC/IT-MSn

Beijing Laboratory for Biomedical Detection Technology and Instrument, Department of Pharmacology, School of Basic Medical Sciences, Capital Medical University, Beijing 100069, China
*
Author to whom correspondence should be addressed.
Molecules 2015, 20(2), 3001-3019; https://doi.org/10.3390/molecules20023001
Submission received: 1 December 2014 / Revised: 26 January 2015 / Accepted: 4 February 2015 / Published: 12 February 2015
(This article belongs to the Section Metabolites)

Abstract

:
Although zebrafish has become a significant animal model for drug discovery and screening, drug metabolism in zebrafish remains largely unknown. Asiatic acid (AA) and madecassic acid (MA), two natural pentacyclic triterpenoids mainly obtained from Centella asiatica (L.) Urban, have been found to possess many pharmacological effects. This study is to probe the metabolic capability of zebrafish via investigation of the drug metabolism of AA and MA in zebrafish, using a sensitive LC/IT-MSn method. In addition, the main fragmentation pathways of AA and MA were reported for the first time. Nineteen metabolites of AA and MA were firstly identified after zebrafish was exposed to the drug, which all were the phase I metabolites and mainly formed from hydroxylation, dehydrogenation, hydroxylation and dehydrogenation, dihydroxylation and dehydrogenation, and dehydroxylation reaction. The results indicated that zebrafish possessed strong metabolic capacity, and the metabolites of AA and MA were formed via similar metabolic pathways and well matched with the known metabolic rules in vivo and in vitro, which supports the widely use of this system in drug metabolism research. This investigation would also contribute to the novel information on the structural elucidation, in vivo metabolites and metabolic mechanism of pentacyclic triterpenoids.

1. Introduction

Identification of the in vivo metabolites of drug candidates provides very important information for evaluating the efficacy, toxicity and stability, resulting in discovery and development of novel drugs. It is very significant and necessary to study the metabolites and metabolic pathways for the candidates in the early stage of drug development. Centella asiatica (L.) Urban is a well-known traditional Chinese medicine (TCM) used in treatment of many diseases such as jaundice, heatstroke, diarrhea, skin disease, hepatitis and cerebrospinal meningitis in clinical practice [1]. Asiatic acid (AA) and its analogue madecassic acid (MA) are the major active components that isolated and identified from Centella asiatica (L.) Urban, which are the aglycones of ursane-type pentacyclic triterpenoids. Recent studies demonstrated that AA and MA had significant effects in treatment of skin wound [2,3], inflammation [4,5,6,7], anti-oxidant [8,9,10], tumor [11,12,13] and nerve damage [14,15,16]. Despite that the pharmacological activities of AA and MA have been well reported, the mass spectral fragmentation pattern, in vivo metabolites, metabolic pathways and characteristics of AA and MA, especially in the mode animal zebrafish, are absent.
Zebrafish is increasingly used in drug screening and toxicological studies owing to the high-throughput advantages [17]. Since the developmental and physiological processes are highly conserved between zebrafish and mammals, drugs designed to interact with complicated processes of interest in zebrafish usually produce a similar pharmacological effects in human and mammals [18]. Especially, a variety of metabolic enzymes such as cytochrome P450 family, epoxide hydrolase, and conjugation enzymes, are markedly expressed in zebrafish [19,20,21,22,23,24] that are suitable for studying drug metabolism with obvious advantages of low cost and high efficiency.
In order to confirm the metabolic capacity of zebrafish and better understand the mass spectral fragmentation pattern, in vivo metabolic pathways and characterization of AA and MA, a novel and sensitive LC/IT-MSn method was established to study the MS structural characteristics of the metabolites of AA and MA in zebrafish. All of these findings contributed a further understanding of the intermediate processes and metabolism mechanism of these pentacyclic triterpenoids. The in vivo metabolism study of AA and MA might also provide useful and important information for the further studies pharmacological activity of these compounds. Our investigation has provided much novel information on in vivo metabolism of pentacyclic triterpenoids, which would help novel drug development, as well as a better understanding of the safety and efficacy of these compounds.

2. Results and Discussion

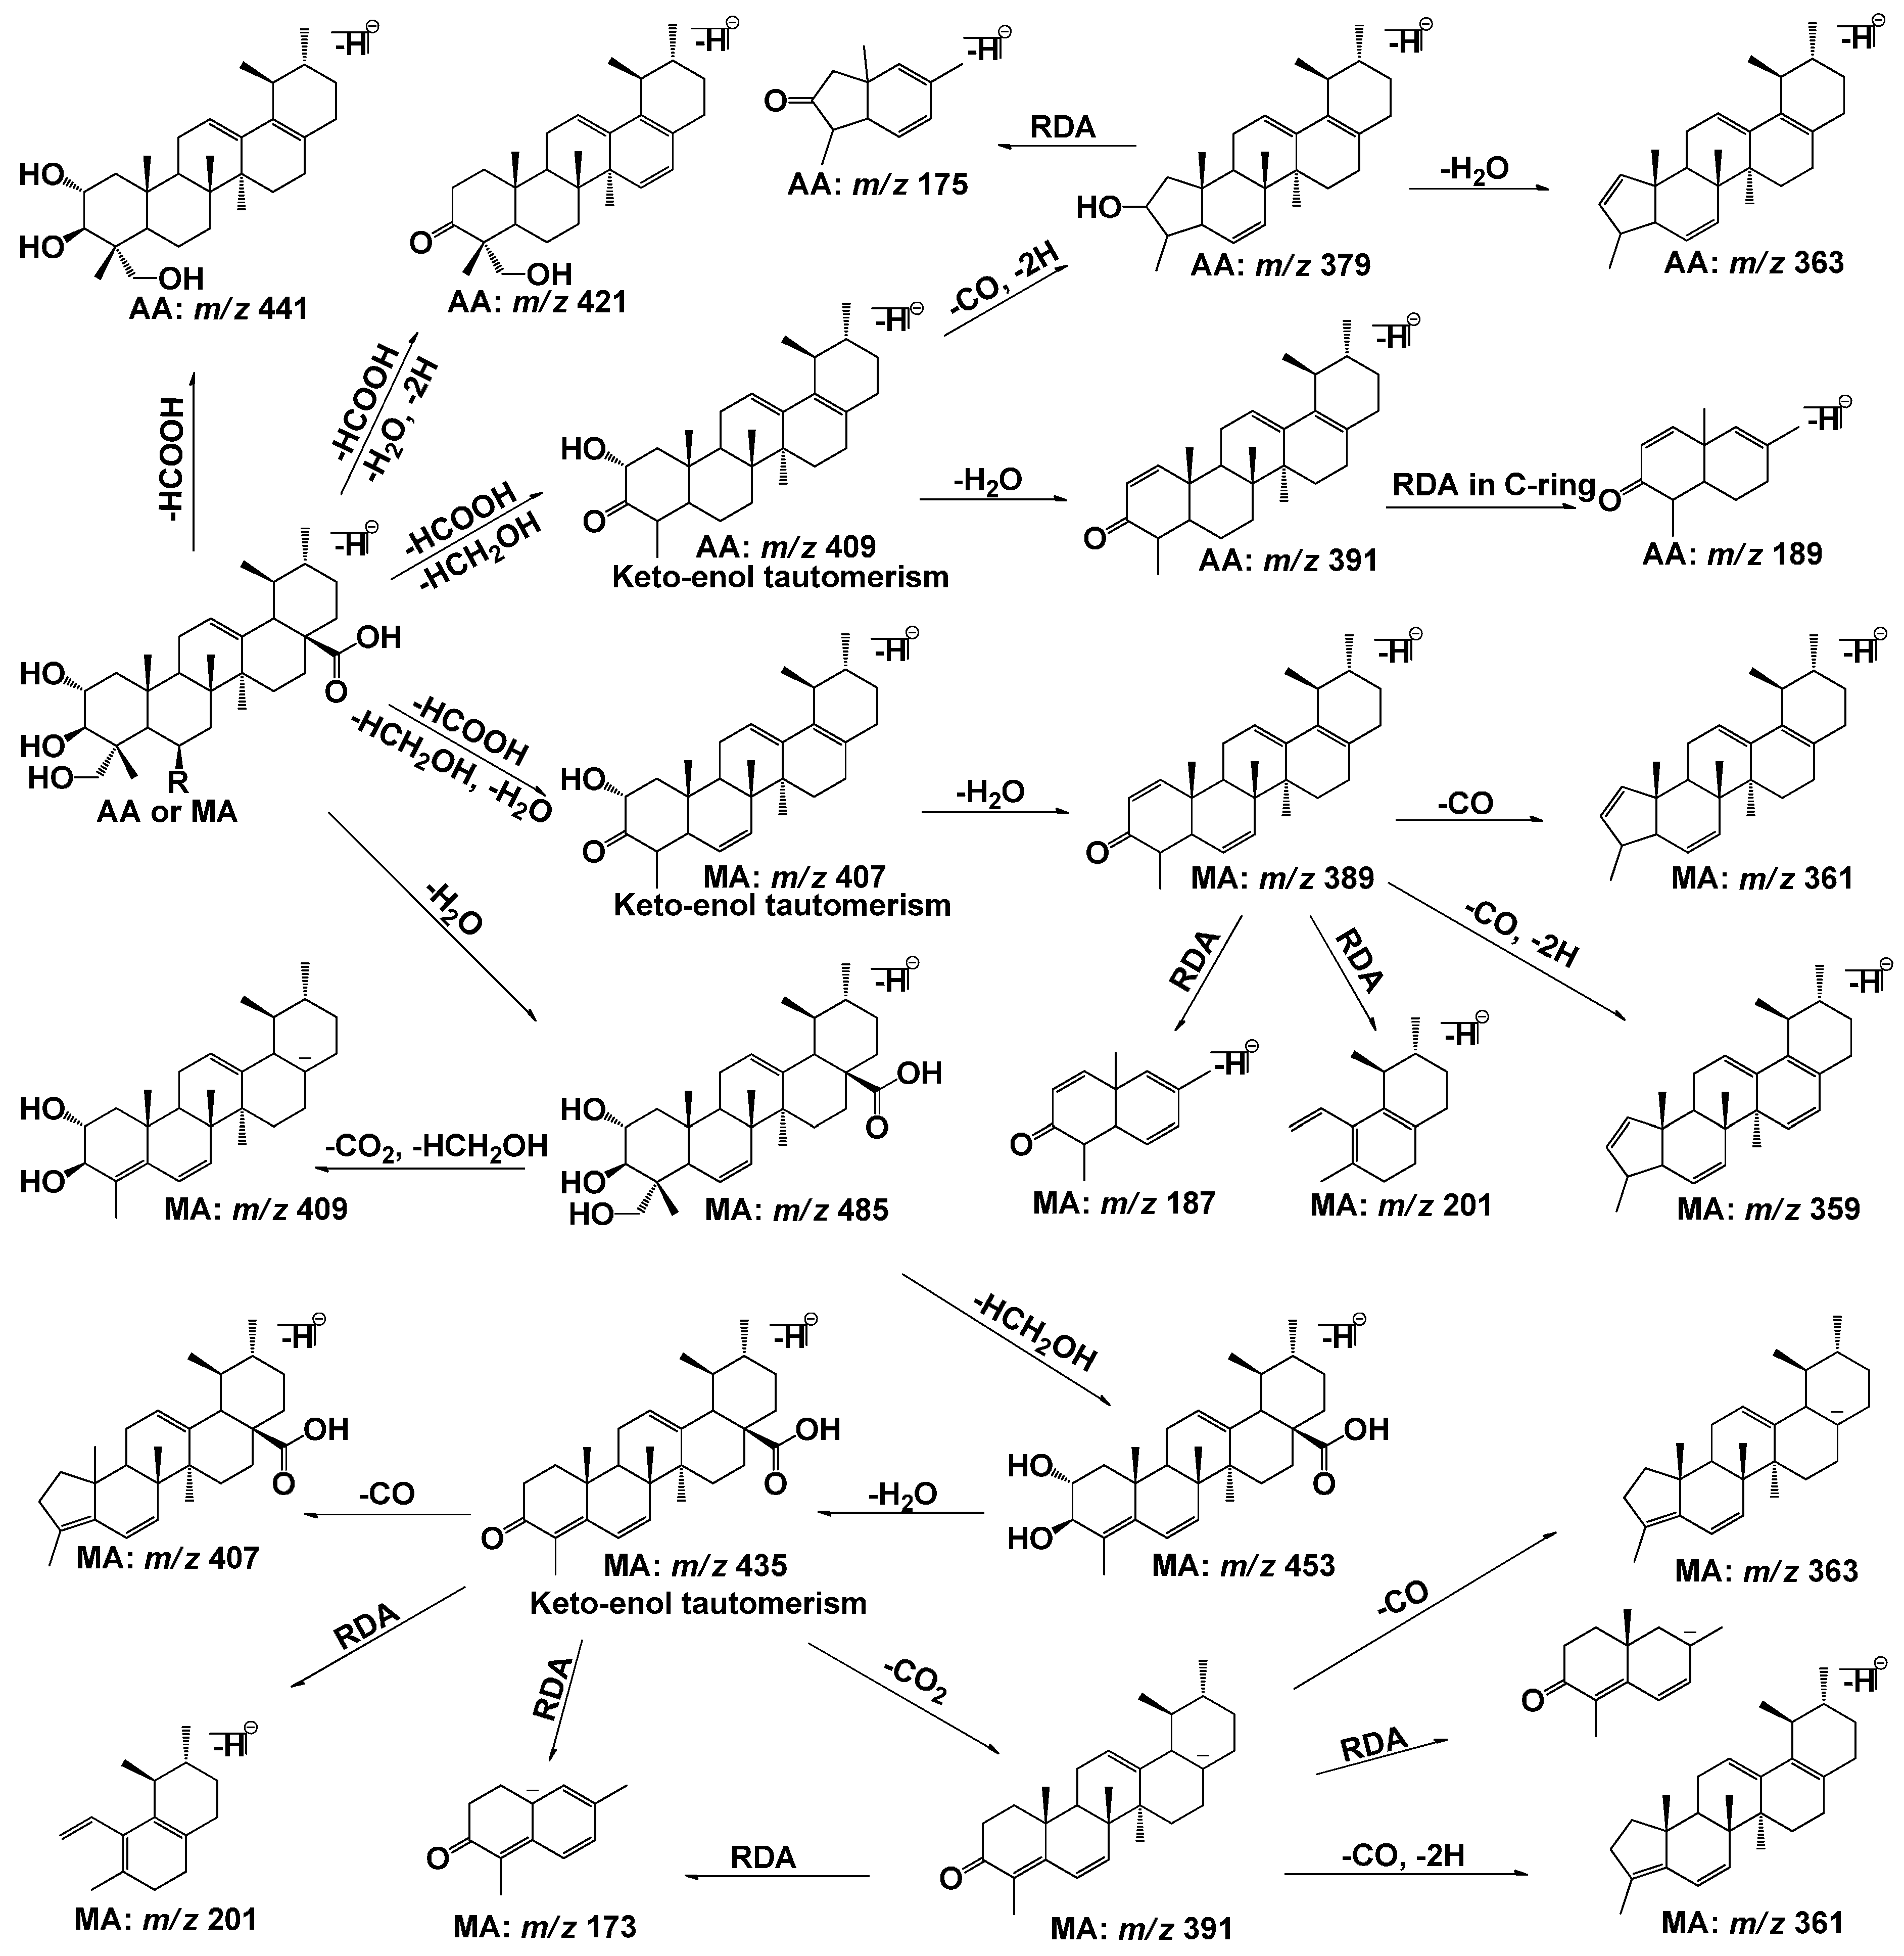
2.1. Fragmentation Pathways of AA and MA

This investigation involved the chromatographic and mass spectral properties of the parent drug. The chromatographic and mass spectrometry conditions were optimized for maximum abundances of the ions of the interests by the automatic tune procedure of the instrument. The first step in our work involved the characterization of chromatographic and mass spectral properties of AA and MA, full scan mass spectral analyses for these two parents showed the deprotonated molecule ions of m/z 487 and 503 from LC/IT-MSn. To ensure sufficient fragment ions, 10 μg/mL of AA or MA prepared in methanol was used for the fragmentation pattern study. The data of MSn spectra of AA and MA are shown in Table 1.
Table 1. Chromatographic retention times, mass spectrometric data of AA and MA.
MetabolitesPrecursor Ion ([M−H])Retention Time (min)Data-Dependent MSn Data (Collision Energy: 36%; Relative Abundance: % Base Peak)
AA48737.57MS2[487]:487(35), 473(4), 443(3), 441(7), 423(4), 421(19), 409(100), 393(8), 391(10), 379(11), 153(<2)
MS3[487→441]:421(20), 409(100), 379(15), 233(8)
MS3[487→409]:391(50), 379(100), 375(10)
MS3[487→391]:391(100), 375(73), 373(49), 347(40), 189(48)
MS3[487→379]:379(8), 377(43), 363(100), 347(21), 225(3), 189(7), 175(13)
MS4[487→441→409]:391(28), 379(100), 226(36)
MS4[487→409→379]:377(16), 363(100), 361(60), 347(10), 225(14), 175(5)
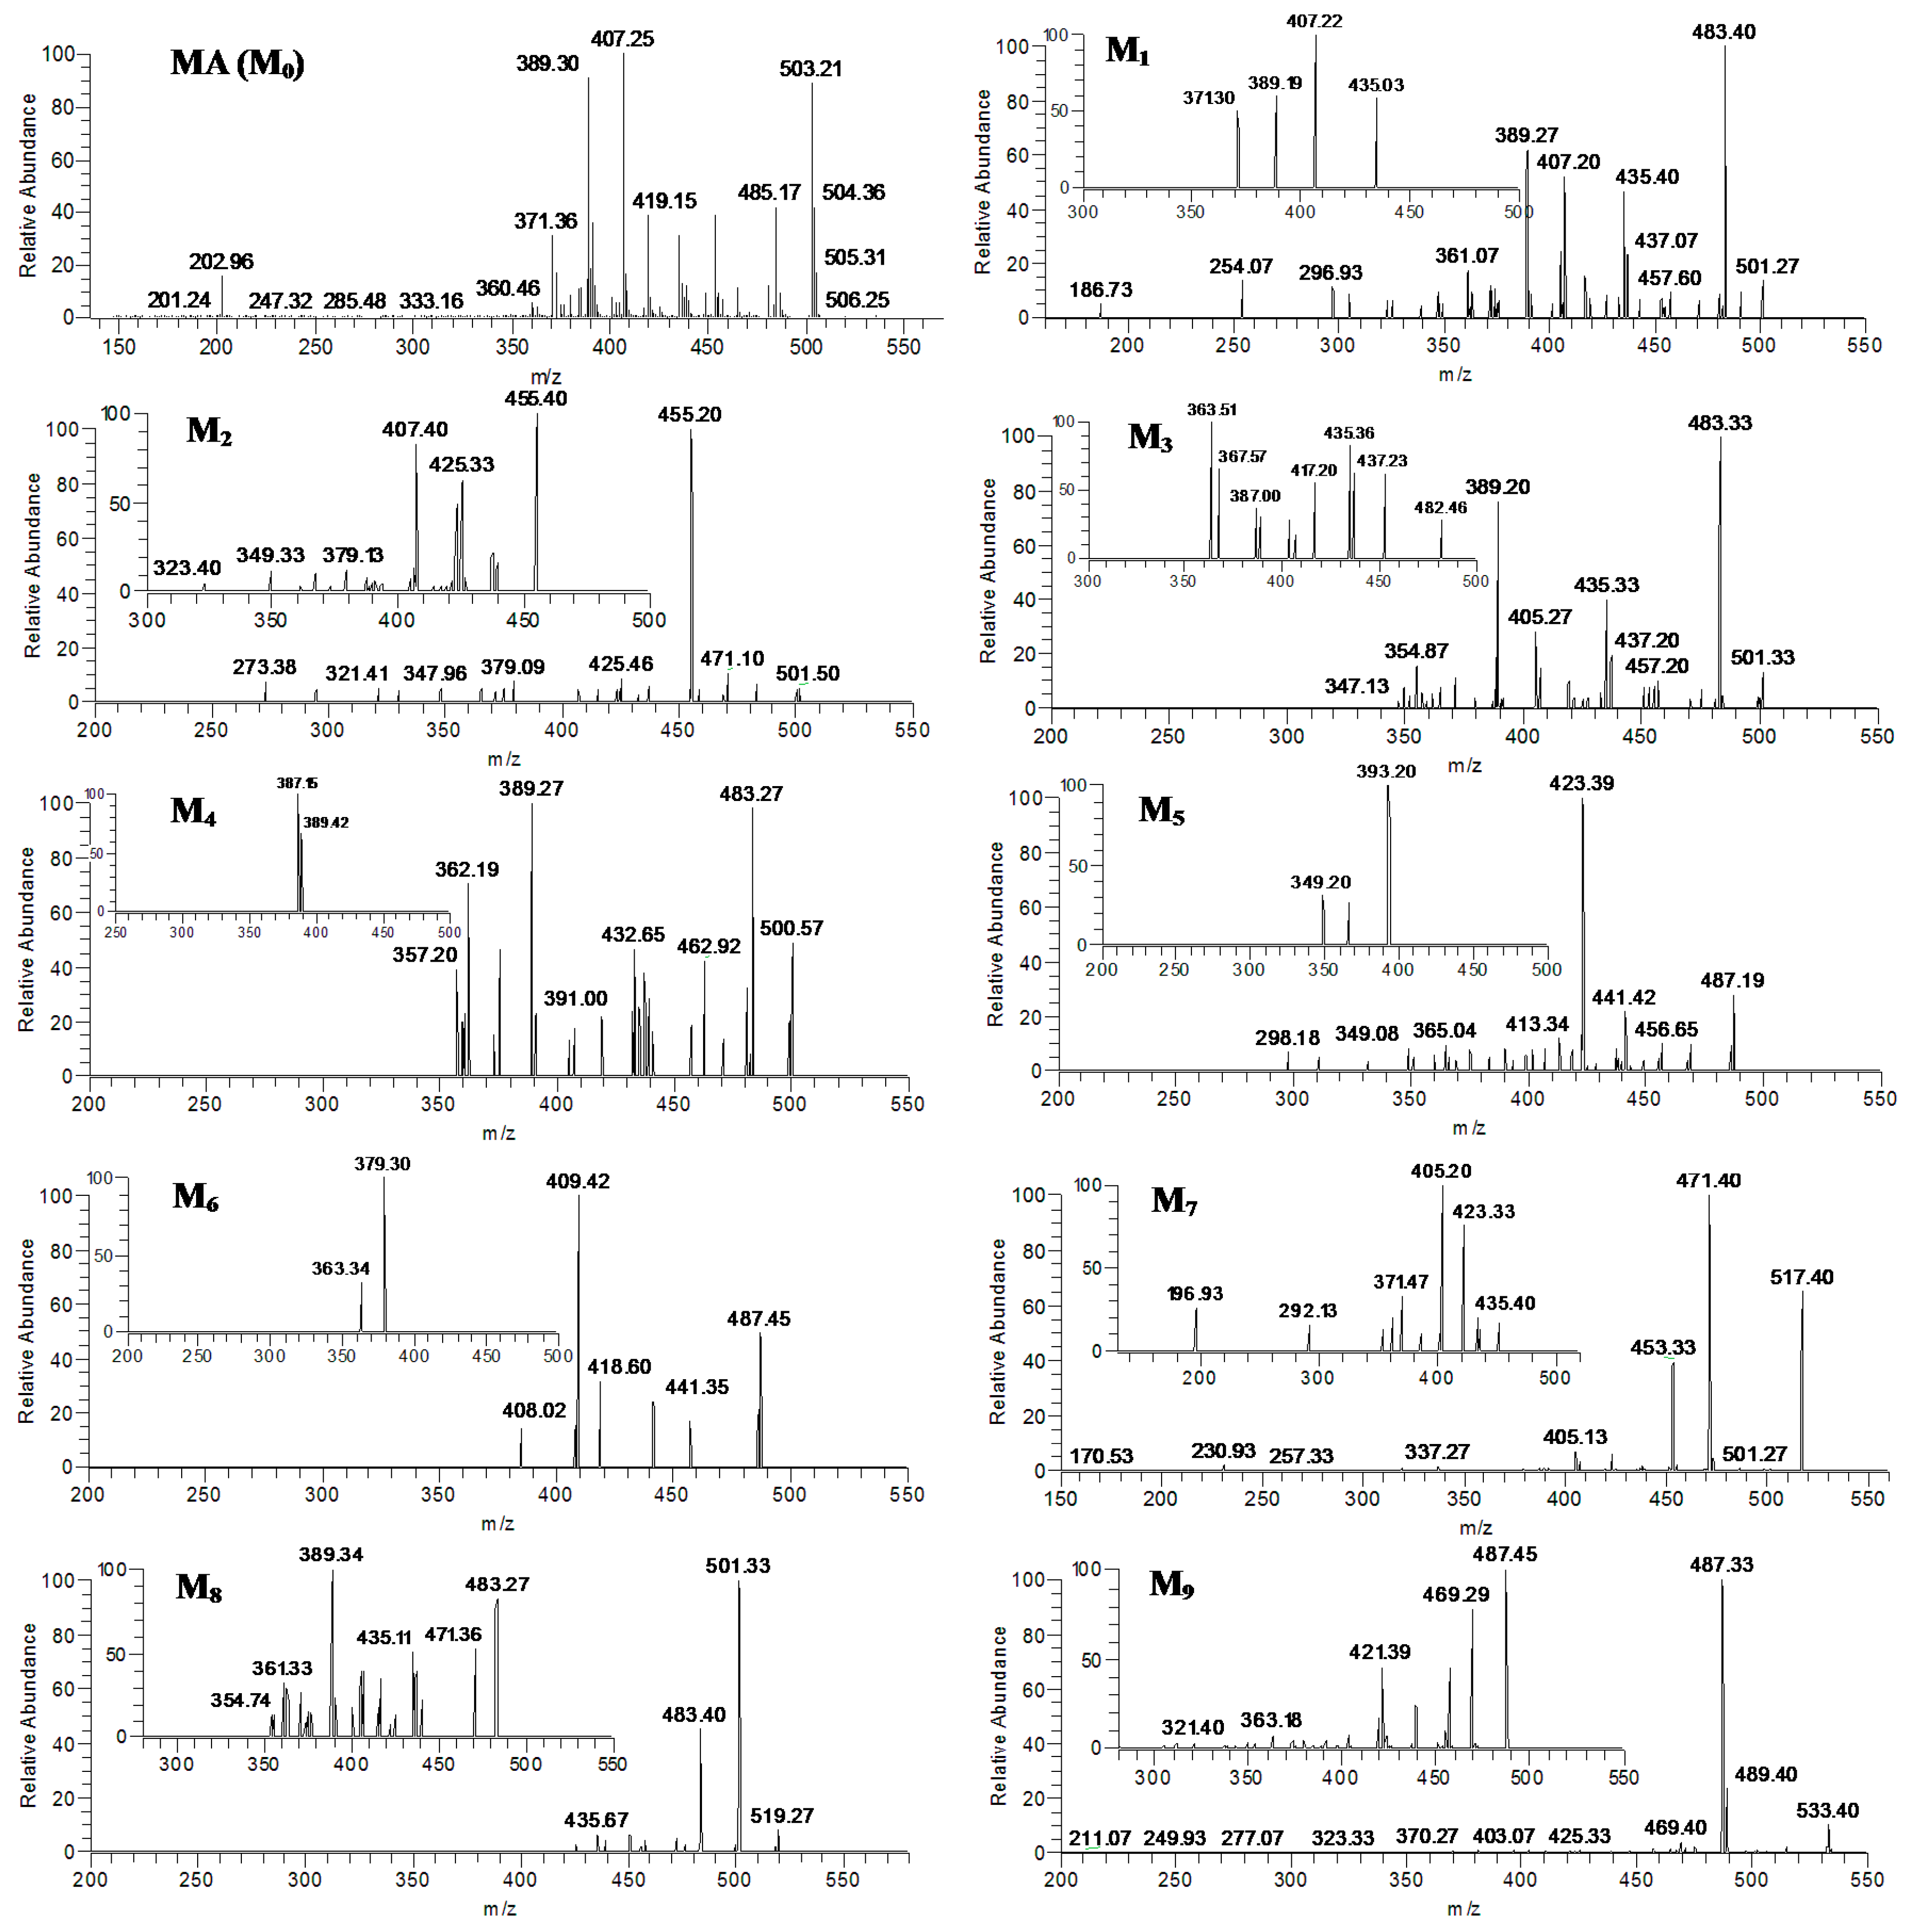
MA50330.51MS2[503]:503(96), 485(43), 465(12), 453(41), 435(33), 419(42), 407(100), 391(37), 389(97), 373(19), 371(33), 363(7), 247(2), 203(17),201(3)
MS3[503→485]:485(2), 465(14), 453(59), 435(100), 409(64), 391(2), 201(2)
MS3[503→407]:407(3), 405(20), 389(100), 371(12), 159(3)
MS3[503→389]:389(85), 387(18), 373(100), 371(26), 361(44), 359(79), 201(36), 187(82)
MS4[503→407→389]:389(2), 373(100)
MS4[503→485→453]:453(60), 451(35), 435(100), 417(5), 391(2), 379(4), 201(10)
MS4[503→485→435]:435(60), 407(100), 391(14), 201(4), 173(26)
MS5[503→485→453→435]:435, 417, 407, 391
MS3[503→391]:391(100), 375(60), 363(33), 361(53), 359(3), 189(34), 187(4), 173(12)
MS4[503→391→375]:375(100), 359(38), 345(2), 189(2), 173(<2)
MS4[503→391→363]:363(100), 347(30), 223(<2), 173(30), 159(10)
The [M−H] ions at m/z 487 and m/z 503 were observed as the quasi-molecular ion of AA and MA, respectively. The MS/MS spectrum of the [M−H] ion of AA exhibited a neutral loss of carboxyl and hydroxylmethyl group, leading to form the base peak ion at m/z 409 [25]. The MS/MS spectrum of the [M−H] ion of MA exhibited the neutral losses of HCOOH, HCH2OH, and H2O, leading to the formation of the base peak ion at m/z 407. The main fragment ions and fragmentation pathways of AA and MA were illustrated in Figure 1. Based on the above mass spectrum profiles of AA and MA, the neutral losses of CO2 (44 Da), HCOOH (46 Da), HCH2OH (32 Da), H2O (18 Da) and CO (28 Da) [26] occurred at these two compounds, and the retro-Diels–Alder (RDA) cleavage were regarded to be the characteristic fragmentation pathways for AA and MA or their analogues [26,27]. The findings help to identify and elucidate the in vivo metabolites of AA and MA.
Figure 1. Main fragment ions and fragmentation pathways of the [M−H] ions of AA and MA (AA: R = H, MA: R = OH).
Molecules 20 03001 g001

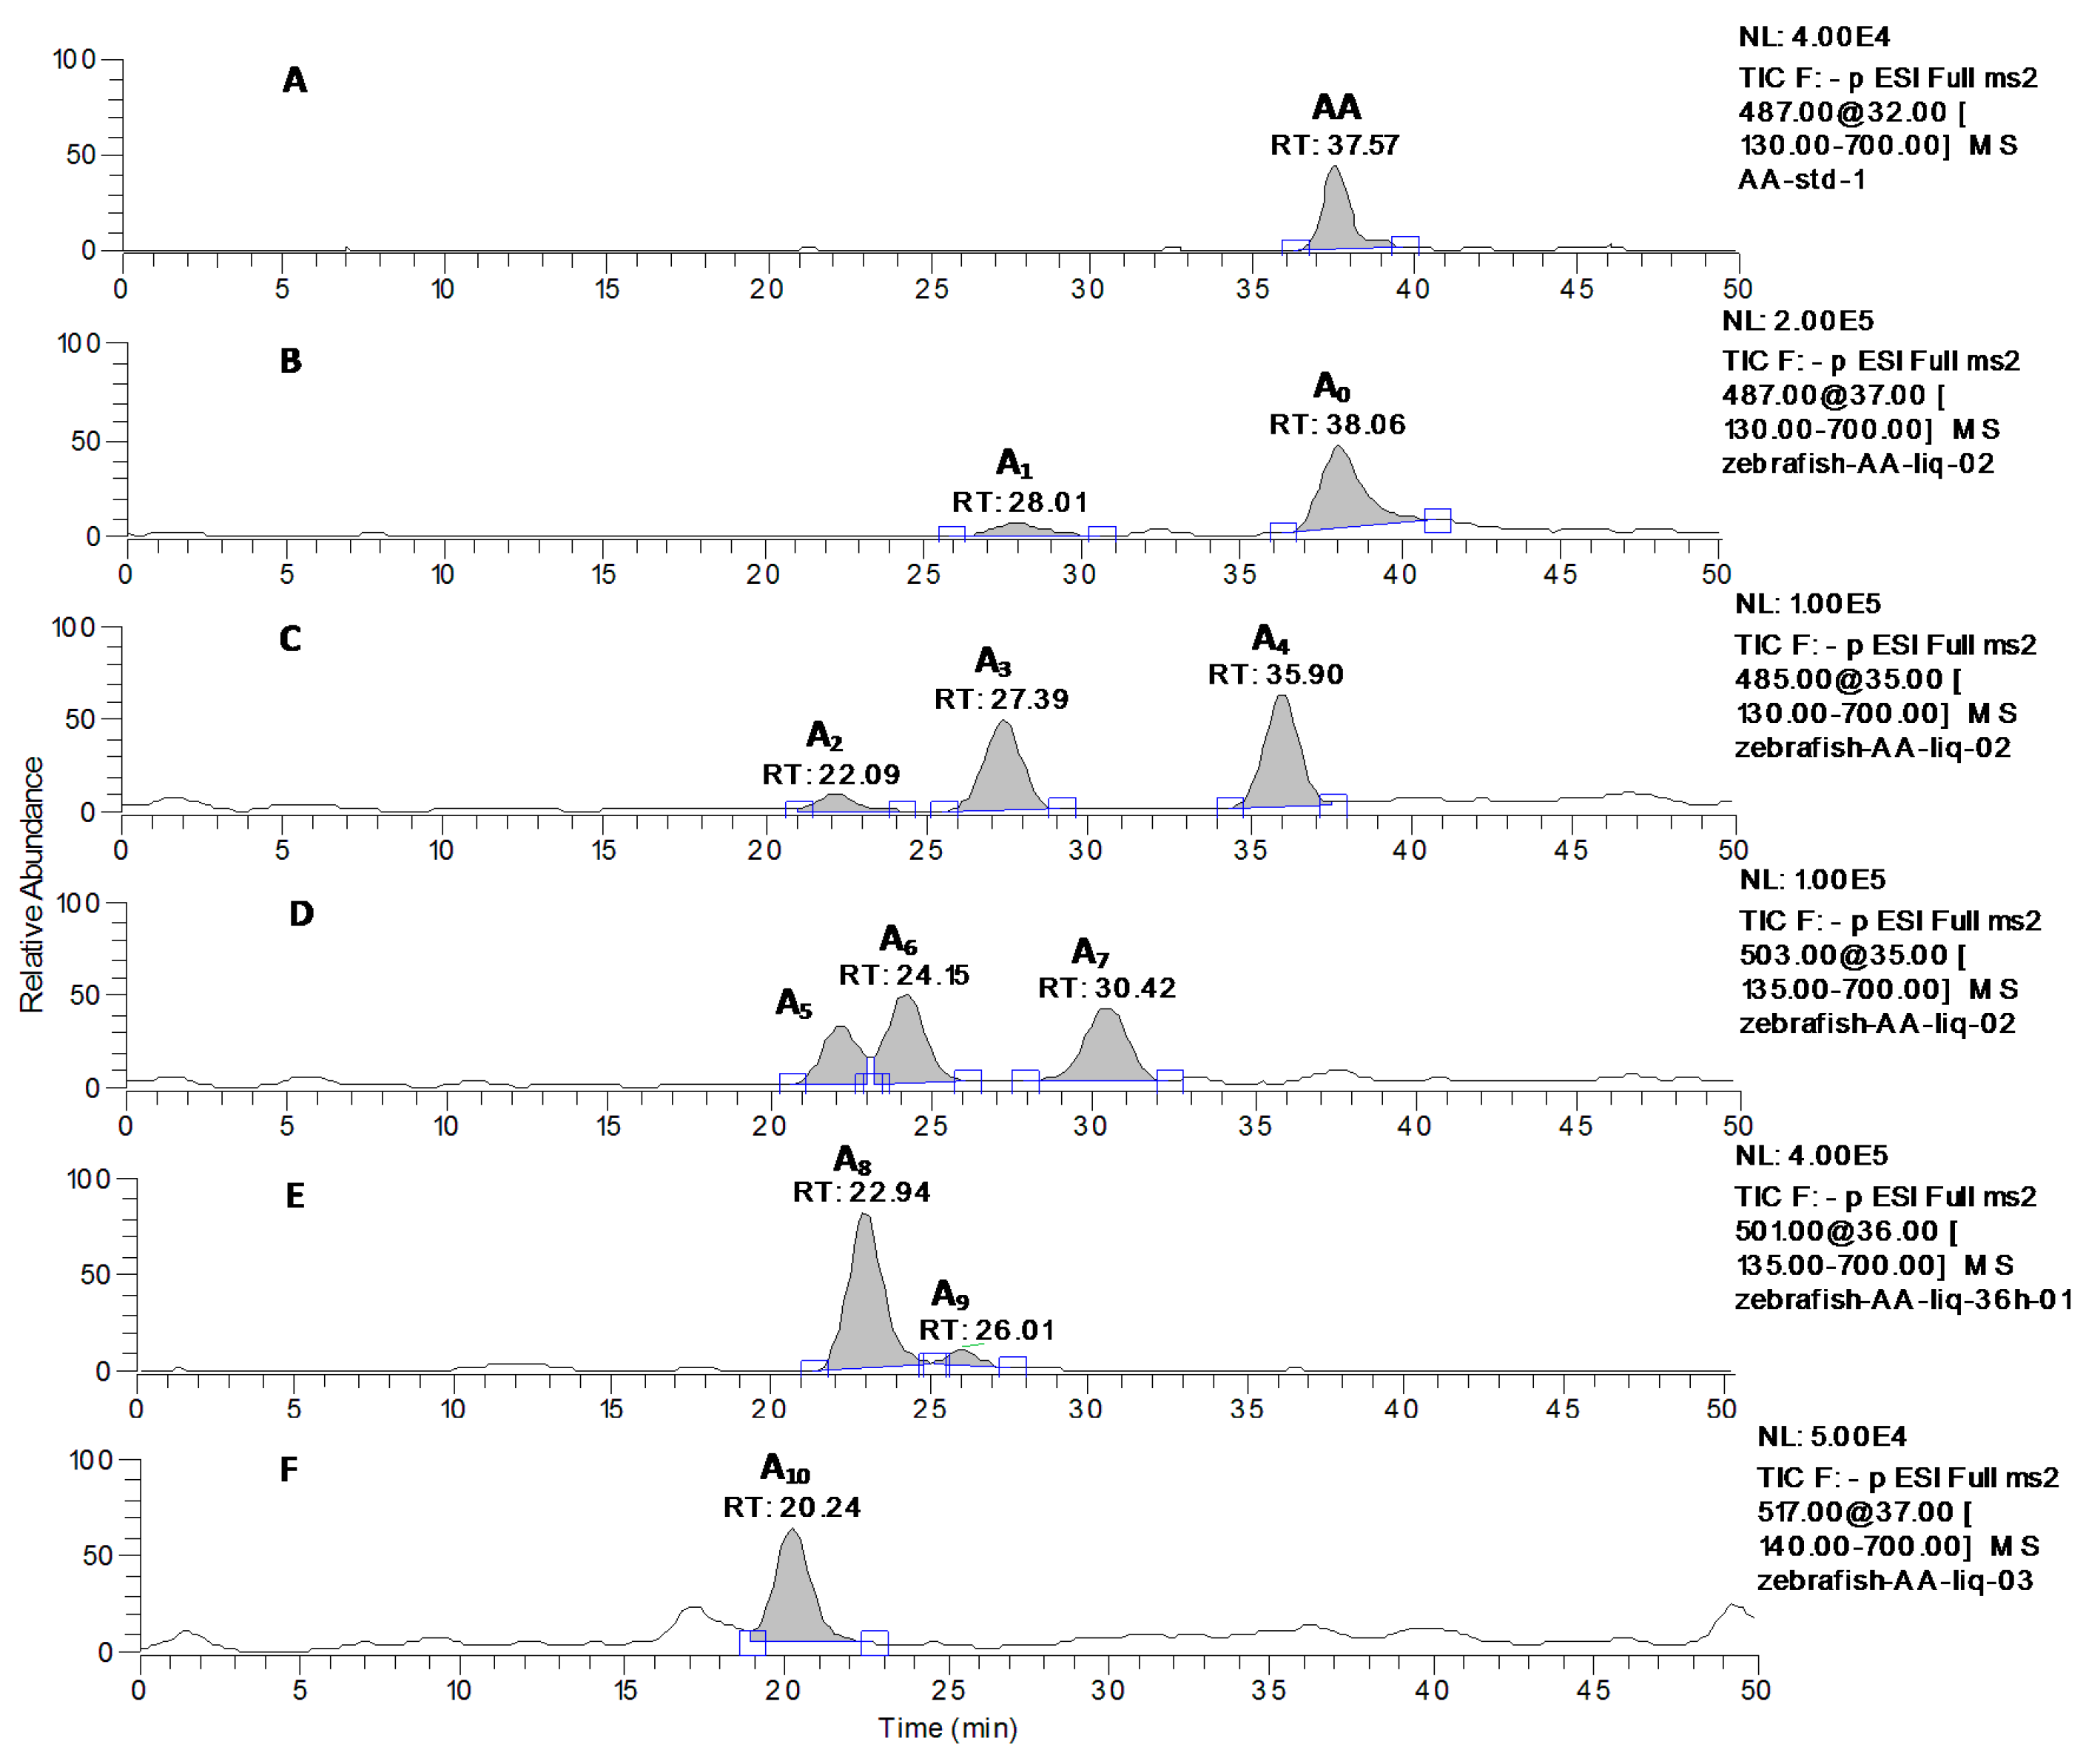
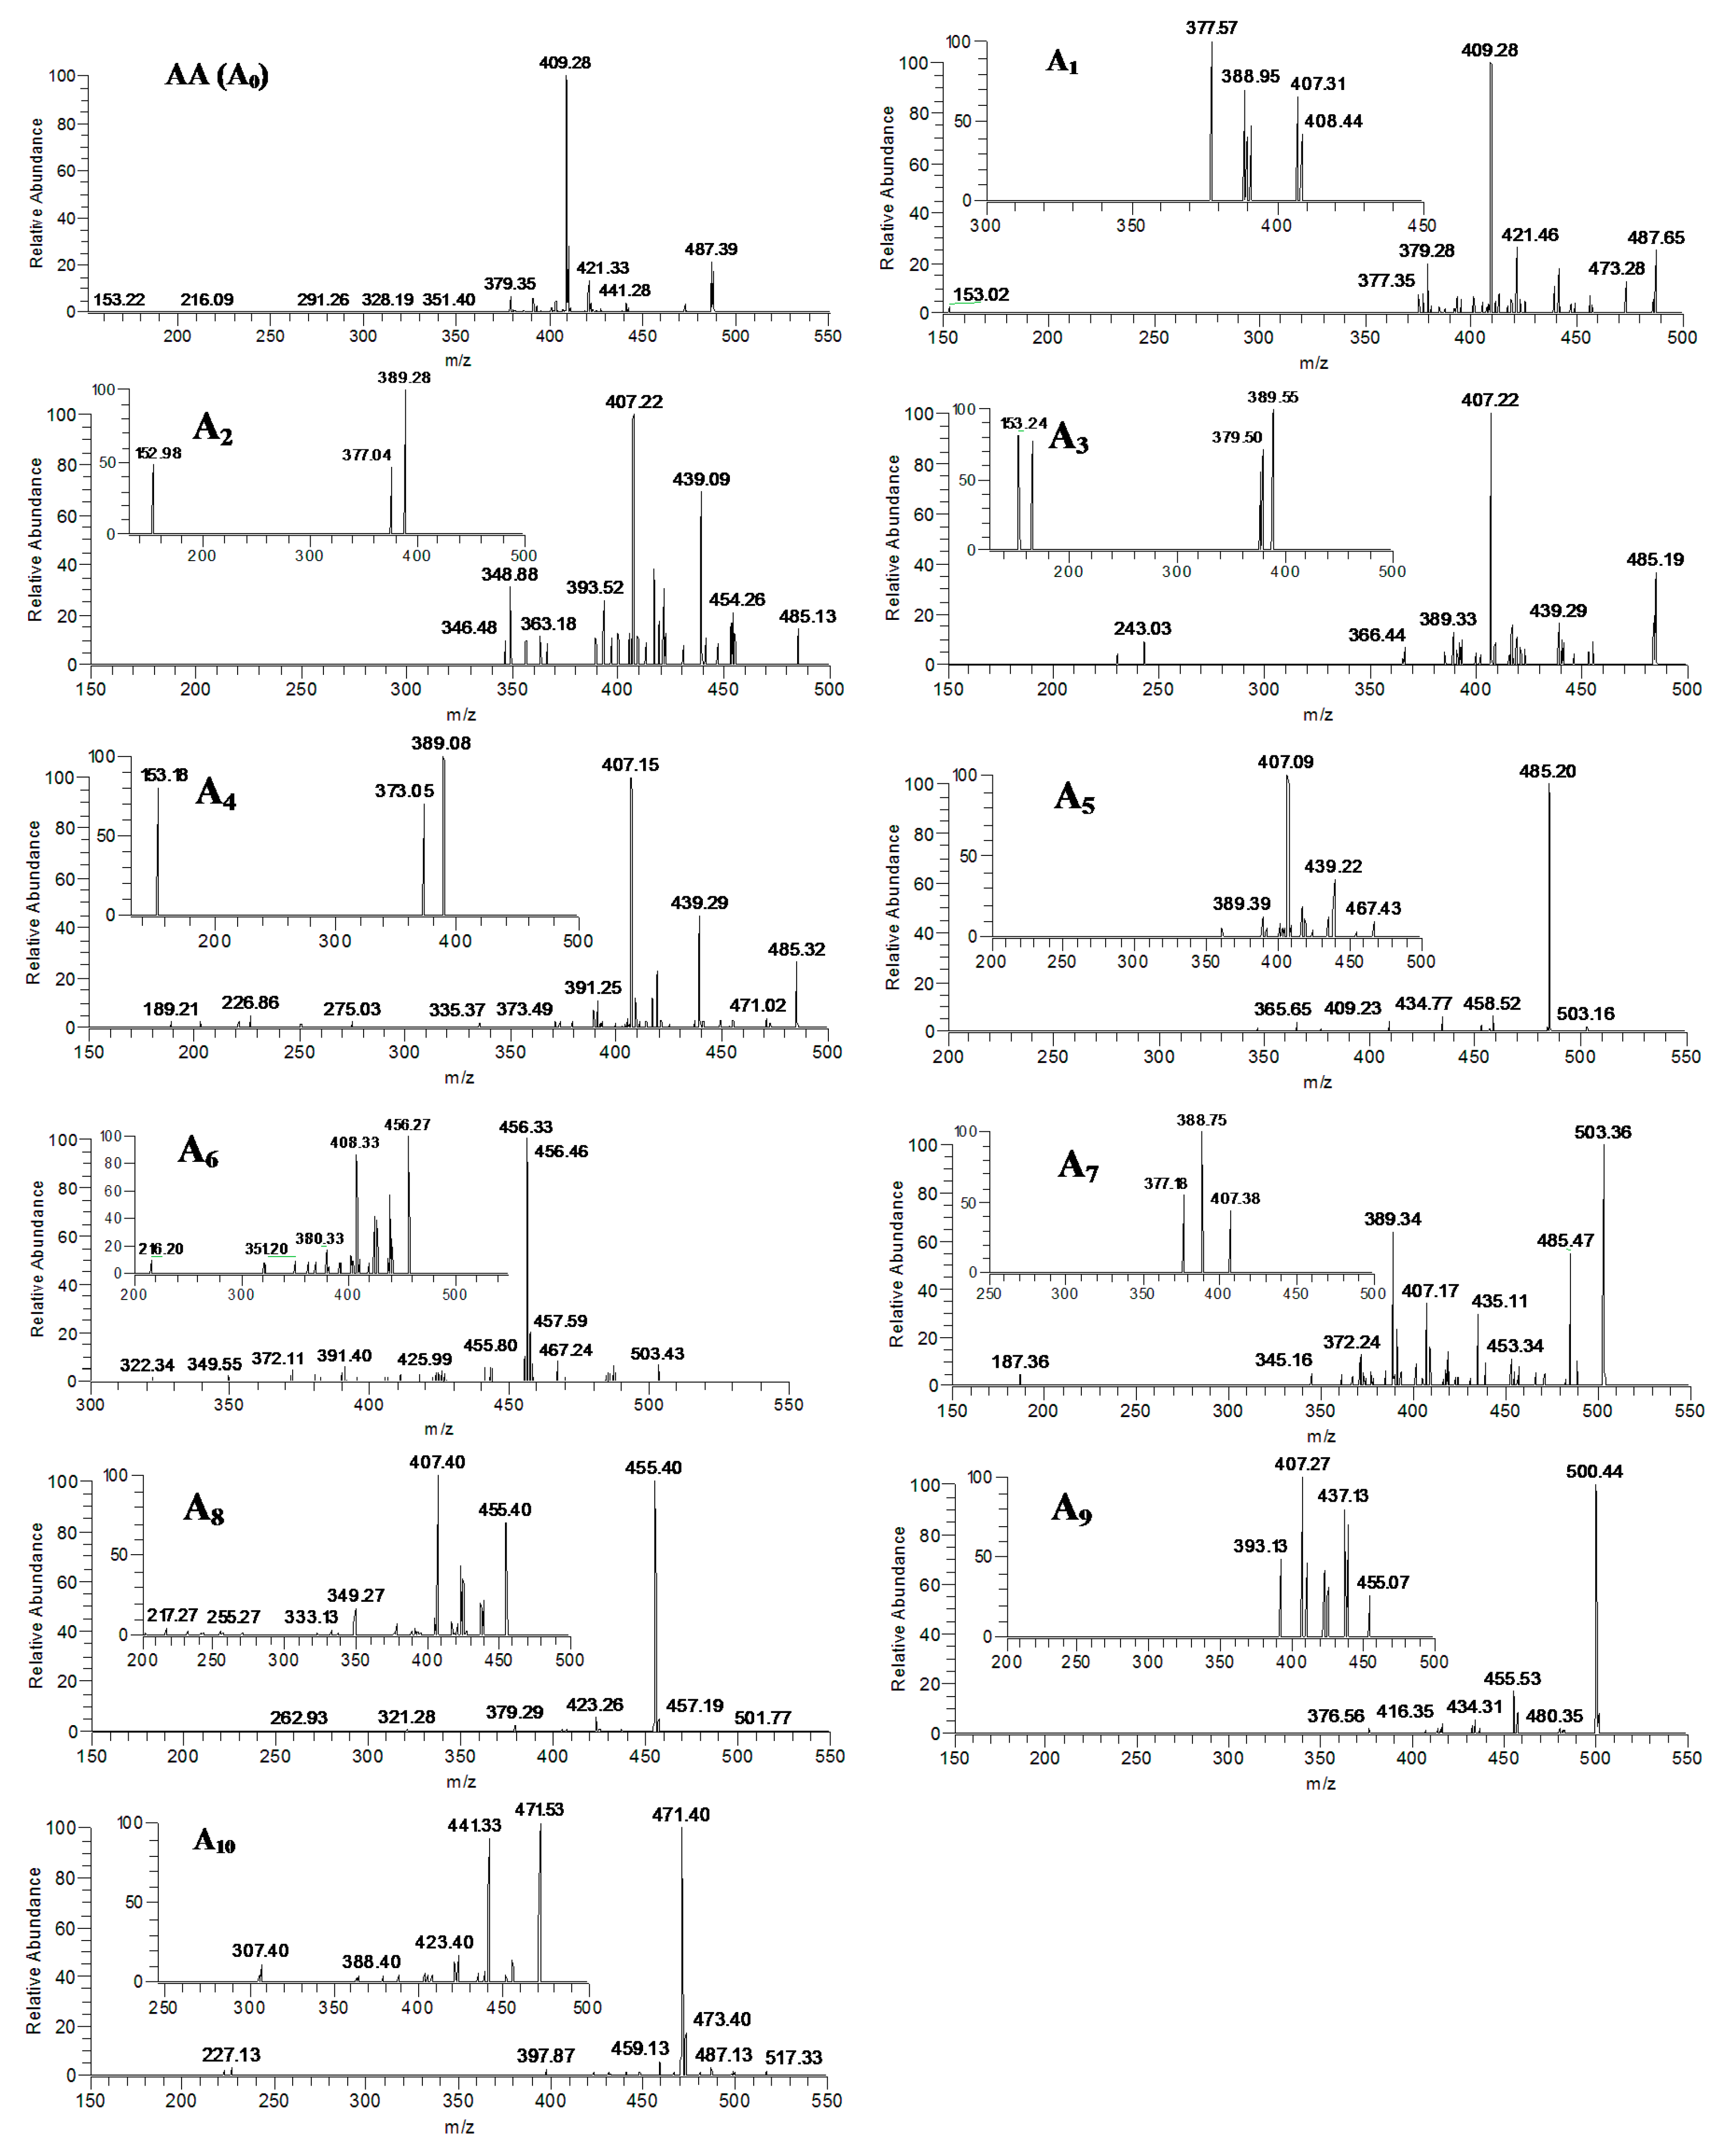
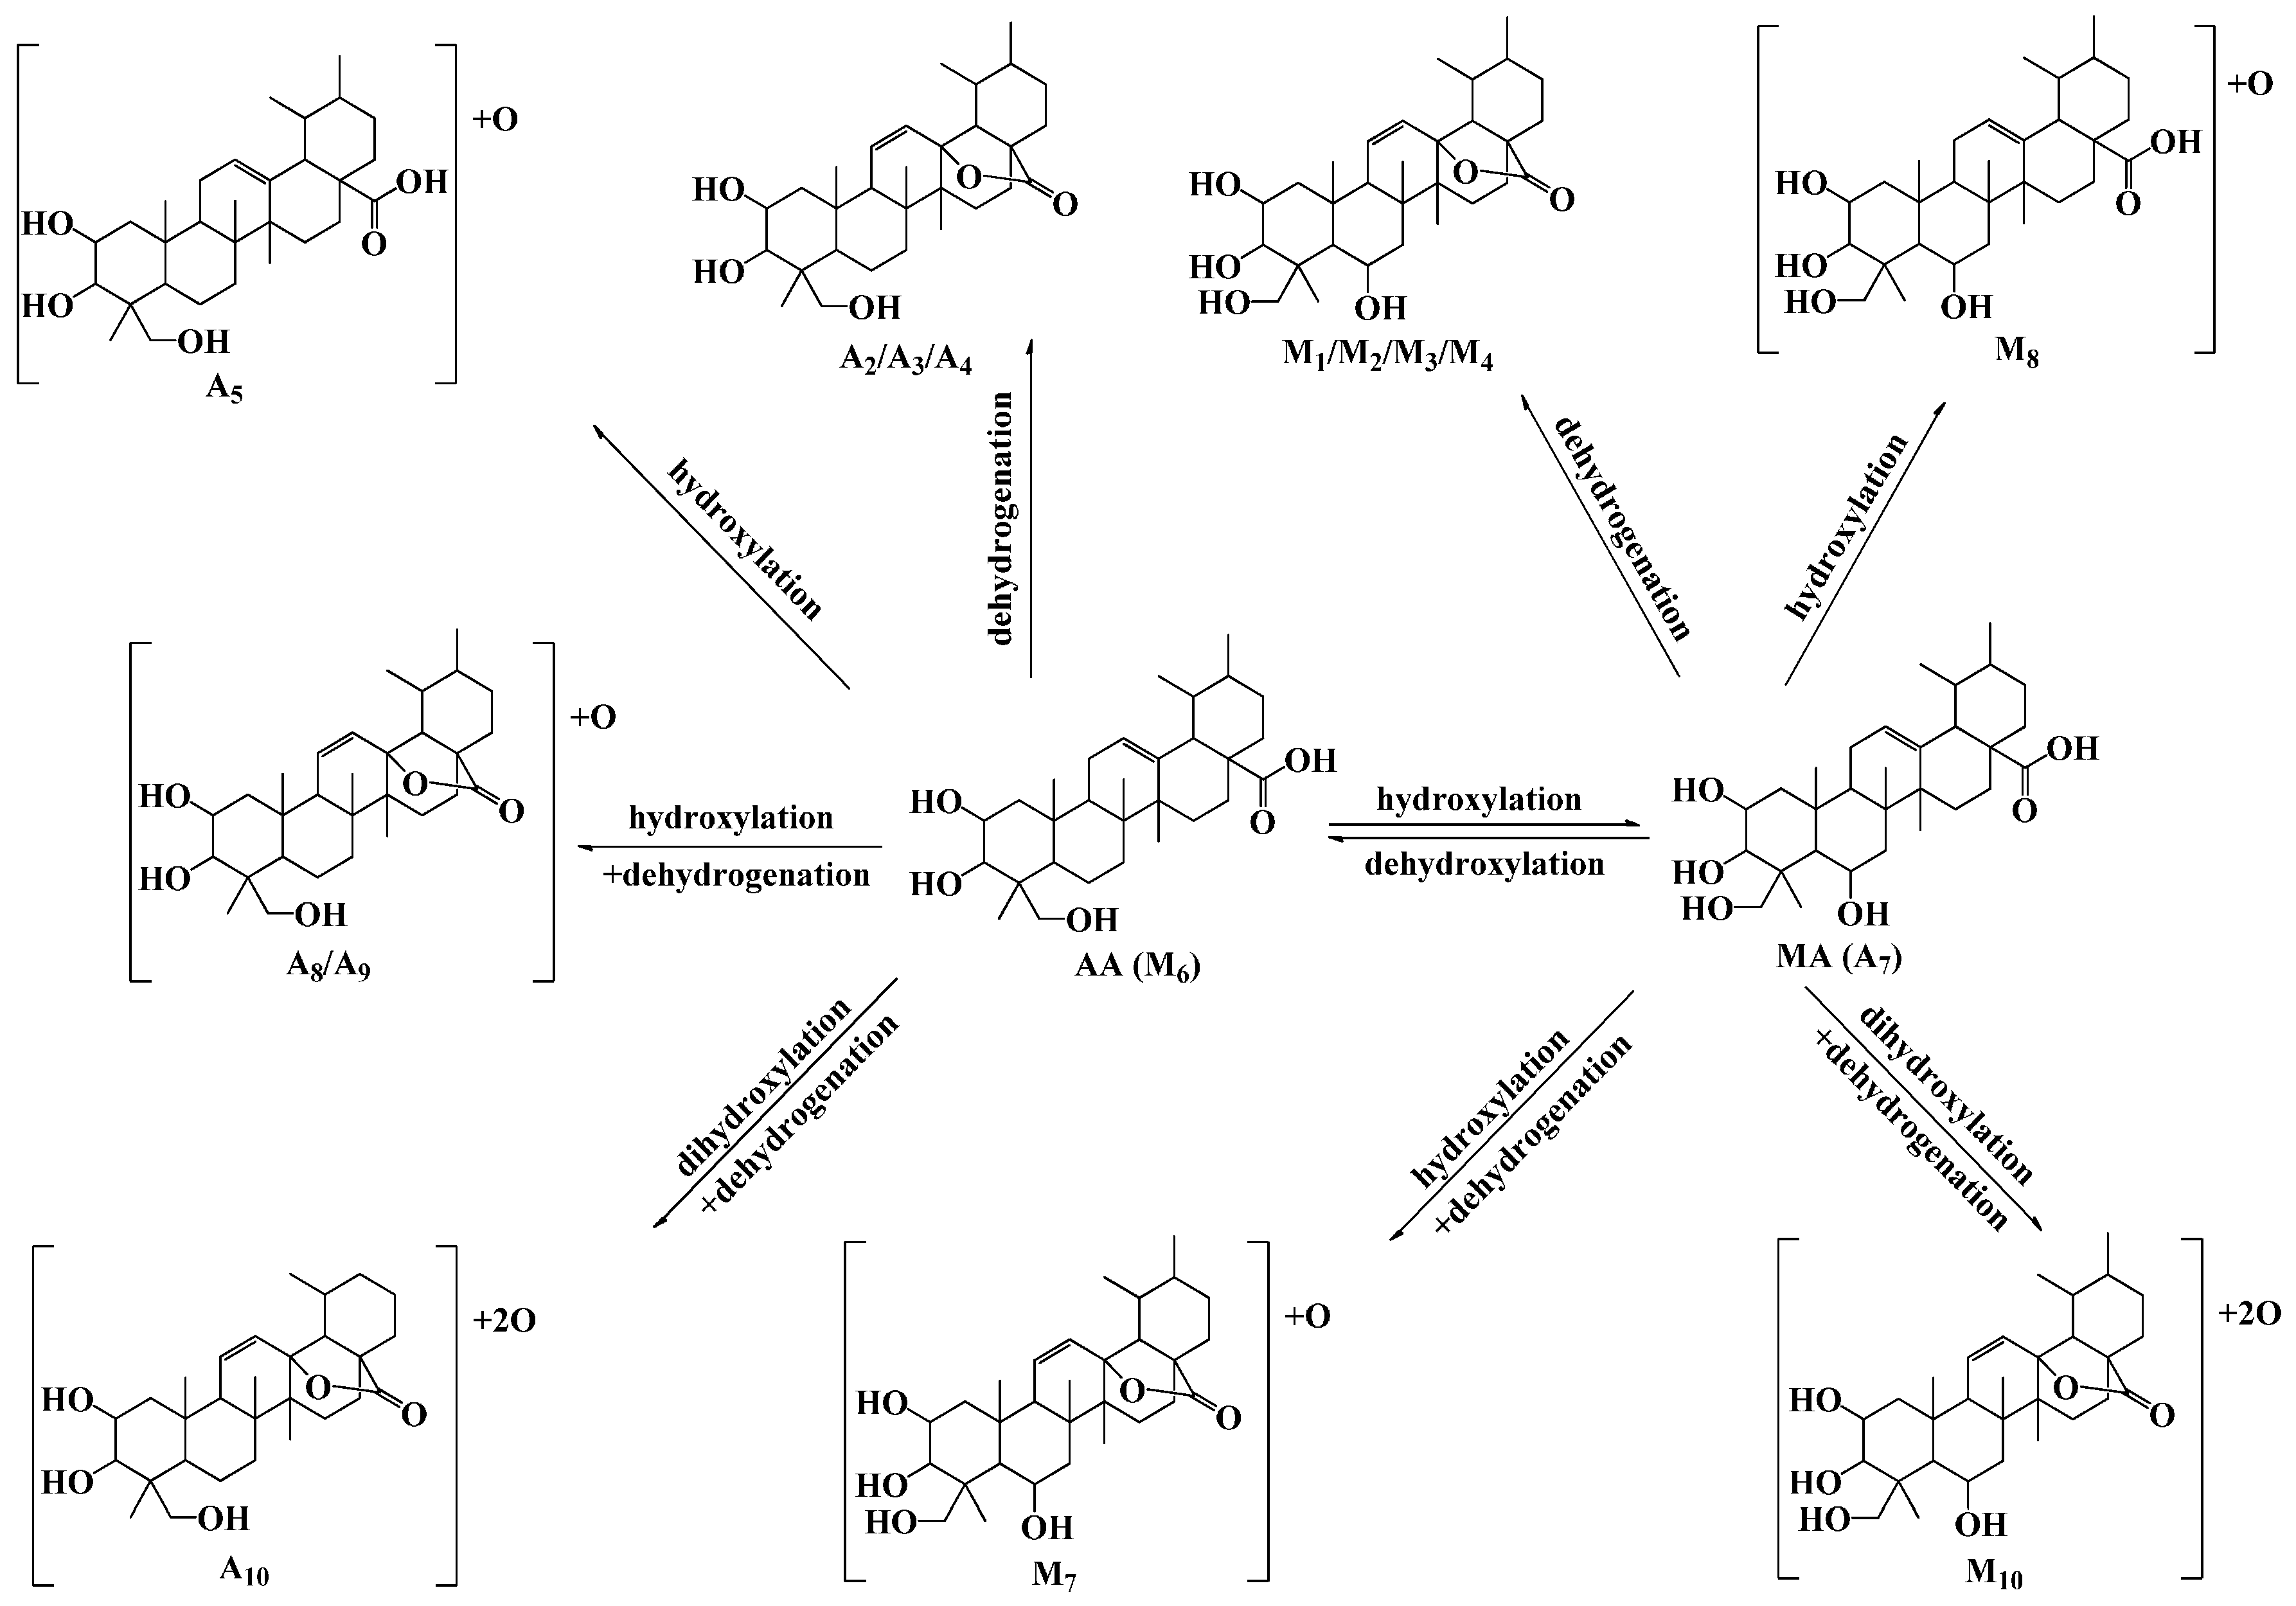
2.2. Identification of AA and Its Metabolites with Zebrafish Exposure

AA was observed as the deprotonated molecule [M−H] at m/z 487 with the retention time of 37.57 min (Figure 2A). The retention time and the MSn spectra of A0 were the same as those of the standard compound AA, indicating that A0 was the unchanged parent drug (Figure 2B and Figure 3). A1 was eluted at 28.01 min (Figure 2B) and gave rise to the quasi-molecular ion at m/z 487 ([M−H]). The MS/MS spectra of A1 were similar to that of AA, and the main fragment ions were also produced by the same neutral loss from AA (Figure 3), forming the characteristic product ions at the m/z 441 ([m-HCOOH]), m/z 421 ([m-HCOOH-H2O-2H]), m/z 409 ([m-HCOOH-HCH2OH]) and m/z 379 ([m-HCOOH-HCH2OH-CO-2H]) (here, m = M-H). Thus, A1 was identified as the regio-isomer of AA. The data from the MS3 spectra of A1 (m/z 487→409) could further confirm this conclusion (Figure 3, Table 2).
Figure 2. LC-MS/MS chromatograms of AA at m/z 487 (A) and its metabolites with zebrafish exposure at m/z 487 (B), m/z 485(C), m/z 503 (D), m/z 501(E), m/z 517(F).
Molecules 20 03001 g002
The metabolite A2, A3 and A4 was detected at 22.09, 27.39 and 35.90 min, respectively (seen in Figure 2C) and gave rise to the same deprotonated quasi-molecular ions at m/z 485. All of these metabolites were 2 Da less than that of AA. These three metabolites exhibited almost identical mass spectral profiles, indicating that they were the isomers. The main fragment ions from the mass spectra of A2, A3 and A4 were also 2 Da less than those of AA (Figure 3). The mass spectra of the deprotonated ions of A2, A3 and A4 formed two predominated product ions at m/z 439 and 407 (see Figure 3), which were consistent with the sequentially neutral losses of HCOOH and HCH2OH. As a consequence, A2, A3 and A4 were identified as the isomers of the dehydrogenation products of AA. The data from the MSn spectra (m/z 485→455, m/z 485→439, m/z 485→407 and m/z 485→407→389) of A2, A3 and A4 could further confirm this conclusion (shown in Figure 3 and Table 2).
The metabolite A5, A6 and A7, eluted at 22.22, 24.15 and 30.42 min, respectively (Figure 2D), were characterized with the quasi-molecular ion at m/z 503 ([M−H]) and 16 Da over the parent drug (shown in Figure 3). The major product ion at m/z 485 was observed in the mass spectra of A5, corresponding to the cleavage of a H2O. The MS3 spectra of A5 (m/z 503→485), which was similar to the mass spectra of A4, formed main the fragment ions at m/z 439 ([m-HCOOH]), m/z 407 ([m-HCOOH-HCH2OH]) and m/z 389 ([m-H2O-HCOOH-HCH2OH]) (here, m = M-H-H2O). The main product ions at m/z 457 and 456 were detected in the MS/MS spectra of A6 (see Figure 3), which was consistent with the neutral losses of a COOH group and a HCOOH group. The MS/MS spectra of A7 formed the main characteristic fragment ions at the m/z 485 ([m-H2O]), m/z 453 ([m-H2O-HCH2OH]), m/z 435 ([m-2H2O-HCH2OH]), m/z 407 ([m-H2O-HCOOH-HCH2OH]), and m/z 389 ([m-2H2O-HCOOH-HCH2OH]), which was actually identical to the fragment ions of MA (here, m = M–H). The predominated characteristic product ion at m/z 389 was also observed in the MS3 spectra of A7 (m/z 503→407). Based the MSn spectra of A5, A6 and A7 (shown in Table 2) and the data with Table 3, they were identified as the isomers of hydroxylation products of AA.
Figure 3. The MSn (n = 2–3) spectra of the metabolites (A0–A10) of asiatic acid after zebrafish exposure: A0 (m/z 487); A1 (m/z 487, m/z 487→409), A2, A3 and A4 (m/z 485, m/z 485→407 ); A5 (m/z 503, m/z 503→485); A6 (m/z 503, m/z 503→457); A7 (m/z 503, m/z 503→407); A8 and A9 (m/z 501, m/z 501→455); and A10 (m/z 517, m/z 501→471).
Molecules 20 03001 g003
Table 2. Chromatographic retention times, mass spectrometric data of potential metabolites of AA (A1–A10) and MA (M1–M9).
MetabolitesPrecursor Ion ([M−H])Retention Time (min)Data-Dependent MSn Data (Relative Abundance: % Base Peak)
A148728.01MS2[487]: 487, 473, 443, 441, 421, 409(100), 379, 377, etc.
MS3[487→409]: 407, 391, 389, 377(100)
A248522.09MS2[485]: 485, 455, 439, 419, 417, 407 (100), 393 etc.
MS3[485→455]: 455, 439, 425, 411 (100), 379
MS3[485→439]: 439, 419, 417, 407 (100), 402, 393
MS3[485→407]: 389(100), 377, 153
MS4[485→407→389]: 389(100), 374,
A348527.39MS2[485]: 485, 455, 439, 419, 417, 407 (100), 391, 389, etc.
MS3[485→455]: 411 (100), 391
MS3[485→439]: 439, 407 (100), 371, 257
MS3[485→407]: 389(100), 379, 165, 153
MS4[485→407→389]: 389, 371(100)
A448535.90MS2[485]: 485, 471, 455, 439, 419, 417, 407 (100), 391, 389, 373, 189 etc.
MS3[485→455]: 455(100), 407, 391, 389
MS3[485→439]: 439(100), 419, 417, 407 (100)
MS3[485→407]: 389(100), 373, 153
MS4[485→407→389]: 389(100)
A550322.22MS2[503]: 503, 485(100), 459, 435, 409, etc.
MS3[503→485]: 467, 439, 419, 417, 407(100), 389
MS4[503→485→407]: 391, 389, 377(100)
A650324.15MS2[503]: 503, 487, 467, 457, 456(100), 443, 425, 411, 391, etc.
MS3[503→457]: 456(100), 438, 424, 408, 392, etc.
MS4[503→457→407]: 408(100), 407, 392, 390, 379, 377
A750330.42MS2[503]: 503(100), 485, 453, 435, 407, 391, 389, etc.
MS3[503→453]: 453, 435, 423(100)
MS3[503→407]: 407, 389(100), 377
A850122.94MS2[501]: 501, 457, 455(100), 423, 379, etc.
MS3[501→457]: 457, 455, 439, 437, 425(100), 407, 393, etc.
MS3[501→455]: 455,439, 437, 425, 423, 407(100), 379, 349
MS3[501→423]: 423(100), 407, 405, 389, 379
MS3[501→379]: 379(100), 361, 353, 335
MS4[501→455→407]: 407(100), 391, 379, 377, etc.
A950126.01MS2[501]: 501(100), 457, 455, 434, 416, 377 etc.
MS3[501→455]: 455,439, 437, 425, 423, 409, 407(100), 393
A1051720.24MS2[517]: 517, 499, 487, 473, 471(100), 459, etc.
MS3[517→471]: 471(100), 455, 441, 423, 421, etc.
MS4[517→471→441]: 441(100), 423, 409, 393, 391, 379, 375, 363, etc.
MS4[517→471→455]: 455(100), 439, 407, 405
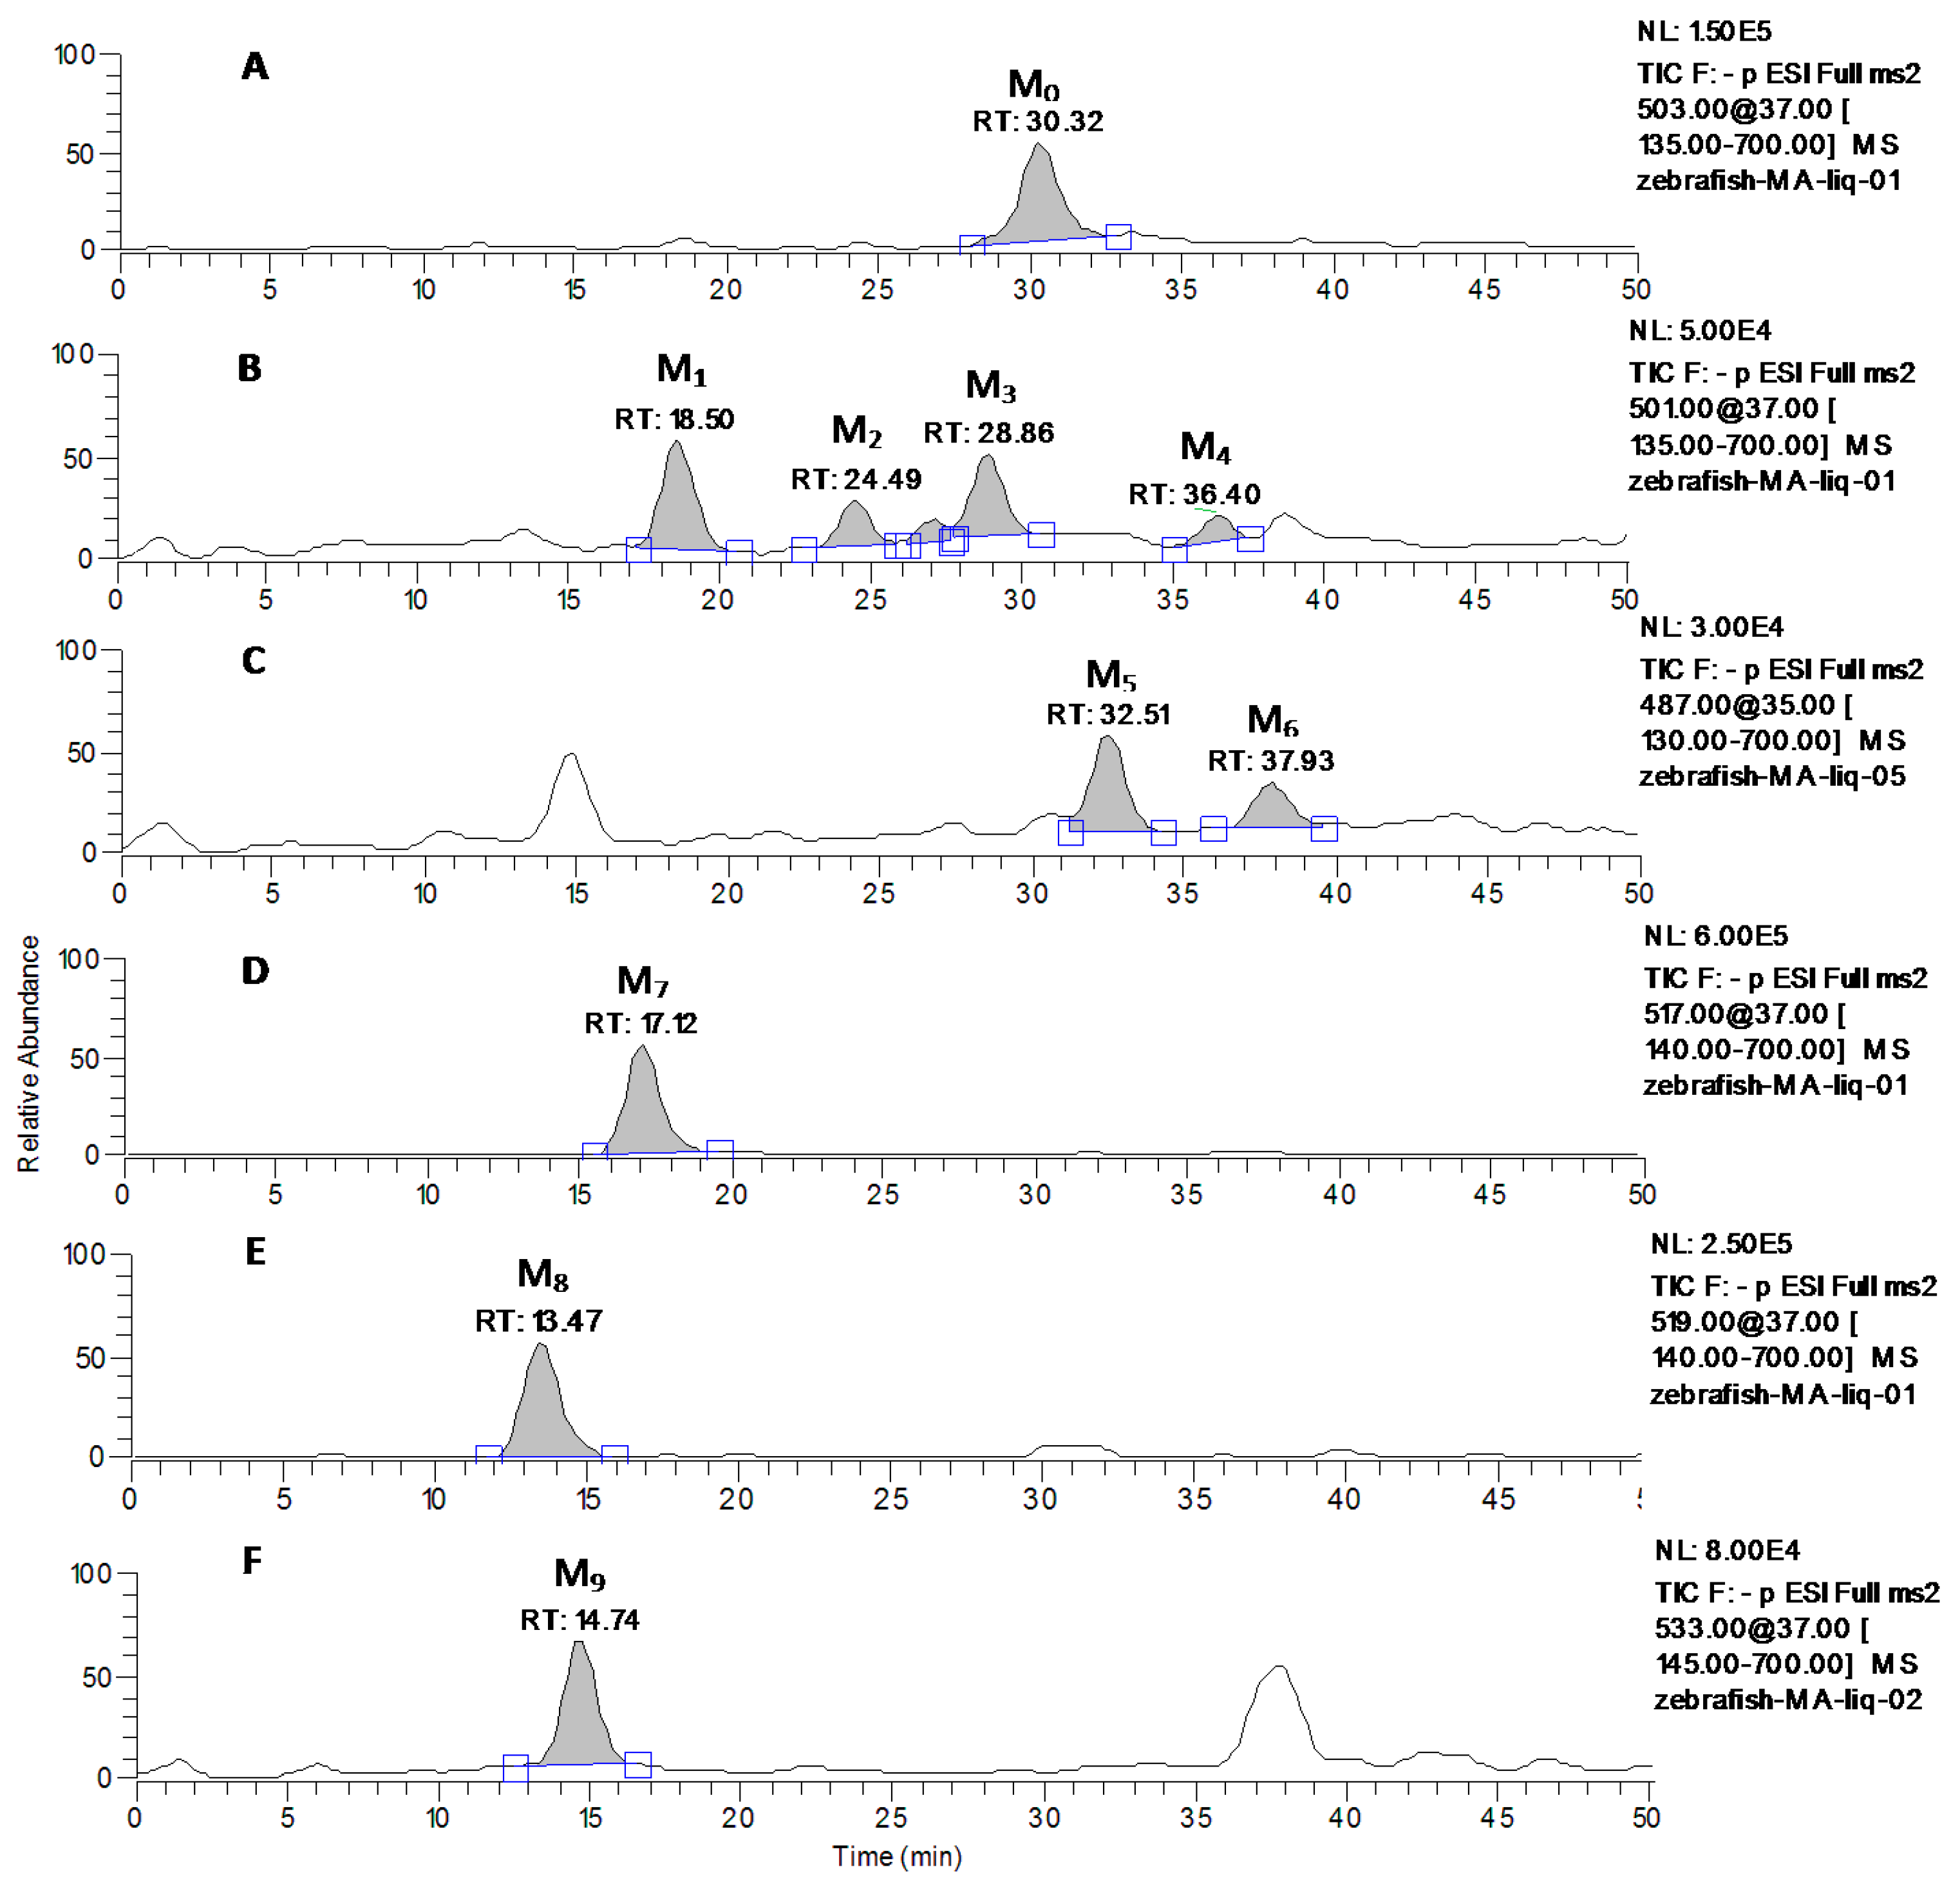
M150118.50MS2[501]: 501, 483(100), 457, 435, 419, 417, 407, 405, 389, 373, 361, etc.
MS3[501→483]: 435, 407(100), 389, 371
MS3[501→435]: 417(100), 389
MS3[501→407]: 389(100), 371
MS3[501→389]: 389(100), 373, etc.
M250124.49MS2[501]: 501, 483, 471, 455(100), 425, 407, 379, etc.
MS3[501→455]: 455(100), 439, 437, 425, 423, 407, 389, 379, 361, etc.
MS3[501→407]: 407, 389(100), 377
M350128.86MS2[501]: 501, 483(100), 457, 455, 437, 435, 419, 407,405, 389, 371, etc.
MS3[501→455]: 483, 453, 437, 435, 417, 407, 405, 389, 387, 363(100)
M450136.40MS2[501]: 501, 483, 463, 437, 435, 433, 419, 407,405, 389(100), 371, etc.
MS3[501→389]: 389, 387(100)
M548732.51MS2[487]: 487, 469, 457,441, 423(100), etc.
MS3[487→423]: 393(100), 467, 349
M648737.93MS2[487]: 487, 457,441, 419, 409(100), etc.
MS3[487→409]: 379(100), 363
M751717.12MS2[517]: 517, 501, 471(100), 453, 423, 407, 405, 391, etc.
MS3[517→471]: 453, 435, 423, 405(100), 387, 371, etc.
MS3[517→453]: 435, 423(100), 405, 387, 347, 173
MS3[517→423]: 407, 405(100), 389, 387, 357, 341
MS4[517→471→453]: 453, 435, 425, 423, 407, 405(100), 389,387
MS4[517→471→423]: 423, 405(100), 387, 357
MS4[517→471→405]: 405(100), 387, 377, 371, 357, etc.
M851913.47MS2[519]: 519, 501(100), 483, etc.
MS3[519→501]: 483, 435(100), 425
MS3[519→483]: 483, 471, 435, 417, 407, 405, 389, 371, 363, 361, etc.
MS4[519→501→483]: 465, 435(100), 407
M953314.74MS2[533]: 533, 489, 487(100), 469, 425, 403, etc.
MS3[533→489]: 489, 471, 441, 423(100), 405, 381, 365, etc.
MS3[533→487]: 487(100), 469, 457, 439, 421, 403, 363, etc.
MS4[533→489→471]:423, 405, 395, 381, 363(100)
MS4[533→487→469]: 469, 454, 439(100), 421, 403, 387, 379
A8 and A9 were detected at 22.94 and 26.01 min, respectively (Figure 2E). Both of A8 and A9 shared the same deprotonated quasi-molecular ions at m/z 501([M−H]), and were 14 Da more than that of AA. The characteristic fragment ion at m/z 455 was observed in the MS/MS spectra of A8 and A9 (Figure 3), which was consistent with the neutral loss of a HCOOH (46 Da). The MS3 spectra of A8 and A9 (m/z 501→455) that exhibited similar mass spectral profiles (seen in Figure 3), forming the main product ions at m/z 439, 437, 425, 423 and 407, could further confirm the results Base on the fragmentation pathways of AA, MA (Figure 1) and the data with Table 3, A8 and A9 were tentatively identified as the isomers of hydroxylation and dehydrogenation products, or the methylene to ketone product of AA.
A10, eluted at 20.24 min, gave rise to the deprotonated ion at m/z 517 (see Figure 2F). The major fragment ion at m/z 471 (Figure 3) was detected in the MS/MS spectra of A10, which was 16 Da more than that of A8 at m/z 455, and also formed via loss of a HCOOH group (46 Da) from the parent ion (Figure 3). The MS3 spectra of A10 (m/z 517→471), which was similar to that of A8 (m/z 501→455), produced the characteristic fragment ions at m/z 453, 441 and 423, corresponding to the cleavages of a H2O (18 Da), a CH2O (30 Da), and a CH2O coupled with a H2O group (48 Da). Therefore, the A10 was tentatively identified to be the hydroxylated product of A8 or the dihydroxylated and dehydrogenated product of AA.
Table 3. Presupposed metabolic types and the m/z changes for potential metabolites of AA and MA.
DescriptionMolecular Formula Changem/z Change
Decarboxylation−CO2−44
Hydroxymethylene loss−CH2O−30
Demethylation−CH2−14
Hydroxylation + dehydration−2H−2
Dehydrogenation−2H−2
Demethylation + hydroxylation−CH2, +O+2
Methylene to ketone −2H+O+14
Hydroxylation + dehydrogenation−2H+O+14
Methylation+CH2+14
Hydroxylation+O+16
Methyl to carboxylation−2H+2O+30
Hydroxylation and methylation+CH2O+30
Dihydroxylation+ dehydrogenation+2O, −2H+30
Dihydroxylation+2O+32
Tri-hydroxylation + dehydrogenation+3O, −2H+46
Tri-hydroxylation+3O+48
Glycine conjugation+C2H3NO+57
Sulfation +SO3+80
Hydroxylation and sulfation+SO4+96
Cysteine conjugation+C3H5NOS+103
Taurine conjugation+C2H5NO2S+107
S,N-Acetylcysteine onjugation+C5H7NO2S+145
Glucosidation+C6H10O5+162
Glucuronide conjugation+C6H8O6+176
Hydroxylation + glucuronide+C6H8O7+192
Glutathione conjugation+C10H15N3O6S+305
Glutathione conjugation+C10H17N3O6S+307

2.3. Identification of MA and Its Metabolites with Zebrafish Exposure

M0 was observed as the deprotonated molecule [M−H] at m/z 503 with retention time of 30.32 min (shown in Figure 4A). The retention time and MSn spectra of M0 were the same as those of the standard compound, indicating that M0 was the unchanged parent drug MA.
The metabolite M1, M2, M3 and M4, eluted at 18.50, 24.49, 28.86 and 36.40 min, respectively, (seen in Figure 4B), showed the quasi-molecular ion at m/z 501 [M−H] that was 2 Da less than that of the parent MA (Figure 5). The MS/MS spectra of M1, M3 and M4 formed the common fragment ions at the m/z 483, which was also 2 Da than that of MA. The characteristic fragment ions at m/z 435, 407 and389, which were detected in the MS/MS spectra of M1, M3 and M4, were the same as that of MA, indicating that these metabolic reactions occurred on the functional groups outside structure. The characteristic fragment ion at m/z 455 was observed in the MS/MS spectra of M2, which was consistent with the neutral loss of a HCOOH (46 Da) from the quasi-molecular ion. The MS3 spectra of M2 (m/z 501→455), which was similar to that of A8 (m/z 501→455), formed the characteristic fragment ions at m/z 455, 439, 437, 425, 423 and 407. Based on the MSn spectra data of M1, M2, M3 and M4 (shown in Table 2) and the fragmentation pathways of MA and AA (Figure 1), The metabolite M1, M2, M3 and M4 were identified as the isomers of dehydrogenation products of MA, and the metabolic pathway of M2 was different from that of M1 M3 and M4.
The MS/MS spectra of metabolite M5 and M6, eluted at 32.51 and 37.93 min, gave rise to the deprotonated ion [M−H] at m/z 487 that was 16 Da less than that of MA (seen in Figure 4C and Figure 5). The pseudo-molecular ion at m/z 487 of M5 exhibited the predominant product ions at m/z 441 and 423, indicating that there were neutral losses of a HCOOH (46 Da) and a HCOOH coupled with a H2O group (18 Da). The MS3 spectra of M5 (m/z 487→423) produced the major fragment ion at m/z 393 (see Figure 5), indicating that the neutral loss of a CH2O (30 Da) existed. The mass spectra of M6 were similar to that of AA, forming the characteristic fragment ions at m/z 441 and 409. Based on the MSn spectra data of M5 and M6 (Table 2), the fragmentation pathways of MA and AA (Figure 1) and the data in Table 3, M5 and M6 was tentatively identified as the isomers of dehydroxylated product, or demethylation and dehydrogenation of MA.
Figure 4. LC-MS/MS chromatograms of MA and its metabolites at m/z 503 (A), m/z 501 (B), m/z 487(C), m/z 517 (D), m/z 519 (E), m/z 533(F) with zebrafish exposure.
Molecules 20 03001 g004
Figure 5. The MSn (n = 2–3) spectra of the metabolites (M0–M10) of MA after zebrafish exposure: M0 (m/z 503); M1, M3 (m/z 501, m/z 501→483), M2 (m/z 501, m/z 501→455), M4 (m/z 501, m/z 501→389); M5 (m/z 487, m/z 487→423); M6 (m/z 487, m/z 487→409); M7 (m/z 517, m/z 517→471); M8 (m/z 519, m/z 519→483); and M9 (m/z 533, m/z 533→487).
Molecules 20 03001 g005
M7 was observed at 17.12 min (Figure 4D), which gave rise to the deprotonated ion [M−H] at m/z 517 (shown in Figure 5) and were 14 Da more than that of MA. The predominant deprotonated ions of M7 exhibited at m/z 471 and 453 (Figure 5 and Table 2), suggesting that there were sequential cleavages of a HCOOH (46 Da) and H2O group (18 Da). The MS3 spectra of M7 (m/z 517→471) produced the main fragment ions at m/z 453 ([m-H2O]), 435 ([m-2H2O]), 423 ([m-H2O-CH2O]), 405 ([m-2H2O-CH2O]) and 387 ([m-3H2O-CH2O]) (see Figure 5 and Table 2) (here, m = M-HCOOH). The MS4 spectra of M7 (m/z 517→471→453) formed the main fragment ions at m/z 435 ([m-H2O]), 425 ([m-CO]), 423 ([m-CH2O]), 407 ([m-H2O-CO]), 405 ([m-H2O-CH2O]) and 387 ([m-2H2O-CH2O]) (here, m = M-HCOOH-H2O). The MS4 spectra of M7 (m/z 517→471→423) formed the main fragment ions at 405 ([m-H2O]), 387 ([m-2H2O]) and 357 ([m-2H2O-CO-2H]) (here, m = M-HCOOH-H2O-CH2O). Therefore, M7 was identified as the hydroxylated and dehydrogenated product of MA. The data of MSn spectra of M7 could further confirm this result.
M8, which was eluted at 13.47 min, gave rise to the deprotonated quasi-molecular ion [M−H] at m/z 519 (Figure 4E). The major product ions at m/z 501 and 483 were observed in the MS/MS spectra of M8 (Figure 5), which was consisted with the sequential neutral losses of two H2O groups. The main product ions of the MS3 spectra of M8 (m/z 519→501) were similar to the MS/MS spectra of MA except less 2 Da (Figure 5 and Table 2). Based on the MSn spectra data of M8 (m/z 519→501, 519→483, 519→501→483) (Table 2), the fragmentation pathways of MA (Figure 1) and the data in Table 3, M8 was identified as hydroxylated product of MA.
The metabolite M9, eluted at 14.74 min (shown in Figure 4F), gave rise to the quasi-molecular ion [M−H] at m/z 533, which were 14 Da more than that of M8 and 30 Da more than that of MA. The characteristic product ions from the MS/MS spectra of M9 exhibited at m/z 489 and 487 (see Figure 5), suggesting that there were the cleavages of a CO2 (44 Da) and a HCOOH group (46 Da). The MS3 spectra of M9 (m/z 533→487) produced the main fragment ions at m/z 469 ([m-H2O]), 457 ([m-CH2O]), 439 ([m-H2O-CH2O]) and 421 ([m-2H2O-CH2O]) (here, m = M-H-HCOOH). Based on the MSn spectra data of M9 (see Table 2), the fragmentation pathways of MA and the data in Table 3, M9 was tentatively elucidated as the hydroxylated and dehydrogenation product of M8 or the dihydroxylated and dehydrogenated product of MA.

2.4. Verification of Metabolites by Authentic Standards

To further confirm the metabolite identifications, two major metabolites A7 and M6 that were proposed as the hydroxylated product of AA and the dehydroxylated product of MA, respectively, were verified by using the authentic standards. Comparative analysis of the fragment ions from the MSn spectra and retention times between the metabolites and authentic standards showed that the metabolite A7 well matched with the authentic standard of MA and M6 is in almost accordance with that of AA (shown in Figure 2A, Figure 3, Figure 4A, Figure 5 and Table 2), further supporting the original structure characterizations.

2.5. Discussion

Zebrafish is excellent model animal and widely used in drug screening and toxicological studies owing to its many advantages such as high-throughput, low cost and high efficiency, etc. [17,28,29]. Many results indicated that the developmental, biochemical and physiological processes were highly conserved between zebrafish and mammals, and drugs interacted with the biomacromolecules in zebrafish usually produced the similar pharmacological effects in human and mammals [18] Especially, the metabolic enzyme cytochrome P450 family was markedly expressed in zebrafish [19] that were very suitable for studying phase I drug metabolites. Our investigation confirmed that the zebrafish model could imitate the regular methods in elucidating the phase I metabolites and metabolic mechanism, which provided the further useful evidence for the possibility and reasonability using adult zebrafish in the drug metabolism study.
The hyphenated MS techniques are frequently the initial choice for drug metabolite detection and identification because of their sensitivity and convenience. It confirmed that the mass fragmentation patterns of metabolites are frequently similar to that of the parent compounds, thus, the analysis of fragmentation pattern of parent compound is very important and helpful for the metabolite characterizations [30] Actually, the mass spectral patterns of the parent drugs could serve as the templates in elucidation of the structures of the proposed metabolites of AA and its analogue MA. Determination of the metabolite structure was facilitated by the fact that the parent compound undergoes extensive and well definable fragmentation under the MS-MS conditions. Based on the above consideration, we analyzed and illustrated the detail fragmentation pathways of AA and its analogue MA in the first step of our work.
The most frequently applied strategy for the identification of unknown metabolites in biological matrix was as follows: firstly, scan of the product ions from the parent drug, and then, scan of the precursor ions and/or neutral loss of the biological samples, finally, scan of the product ions for the suspected or predicted metabolites. The metabolites of drug could be identified based on these experiment data and being aware of the typical metabolic pathways [31,32,33]. In this investigation, we firstly developed a novel method for rapid identification of the main metabolites in biological samples treated with AA or MA, which was the predictive multiple reactions monitoring (MRM) and targeted accurate mass measurement. The predictive MRM method was generated on the basis of the expected mass difference, the known fragmentation pathways and the in vivo metabolic rules of AA and its analogues (shown in Table 3) [34,35,36,37,38,39,40,41]. Then, an efficient LC/IT-MS/MS method with MRM mode was developed for the rapid screening and identification of the in vivo metabolites of AA and MA. In targeted accurate mass screening, the accurate mass of a suspected metabolite is calculated via the known metabolic pathways and the expected m/z changes. The MSn spectra of the potential metabolites were obtained via fragmentation of the deprotonated molecules and used for more precise structural identification.
Figure 6. The main putative metabolites and proposed metabolic pathways of AA and MA in zebrafish.
Molecules 20 03001 g006
Based the above methods, ten phase I metabolites of AA (A1–A10) and nine phase I metabolites of MA (M1–M9) were observed and identified in the solution after zebrafish was exposed to the compound. AA and MA were bio-transformed to phase I metabolites in the similar metabolic pathways, which formed from dehydrogenation, hydroxylation, hydroxylation and dehydrogenation, methylene to ketone reaction, dihydroxylation and dehydrogenation, demethylation and dehydrogenation, and dehydroxylation reaction. The proposed structures and metabolic pathways of these metabolites were also elucidated and analyzed (shown in Figure 6), which were coincident with the known metabolic rules of AA and its analogues.

3. Experimental Section

3.1. Chemicals and Reagents

Asiatic acid (AA) and mdecassic acid (MA) were obtained from Chengdu Must Biotechnology Co., Ltd (Chengdu, Sichuan, China). The purities of AA and MA were both more than 99%. Methanol and acetonitrile were purchased from Fisher Scientific (Fair lawn, NJ, USA) as the HPLC grade. Formic acid was purchased from Dikma Reagent Company (Beijing, China) as the HPLC grade. Triply distilled water was used in sample analysis. All other chemicals, reagents and solvents used were of analytical grade.

3.2. Apparatus and Analytical Conditions

The LC/IT-MSn system, controlled by the Xcalibur® (version 1.3) software, was consisted of a HPLC system (Series 1100, Agilent technology, Palo Alto, CA, USA) including a G1312A binary pump, a G1379A vacuum degasser and G1313A autosampler. The HPLC system was coupled to the Finngan LCQ Deca XP ion-trap spectrometer equipped with electrospray source (Thermo Finnigan, San Jose, CA, USA). Separation and determination of the analytes were achieved on a Symmetry® C18 column (150 mm × 2.1 mm, i.d., 5 μm; Waters, Ireland) at ambient temperature. The mobile phase was composed of acetonitrile (A) and water with 0.05% formic acid (B), which was pumped at a flow-rate of 0.2 mL/min. The gradient program was performed in the following manner: 28% A at 0–2 min, 35% A at 18 min, and 50% A at 38–50 min. The sample injection volume was 10 μL with a run time of 50 min for each sample. Following a period of optimization, the ESI-MSn was operated at the sheath flow rate of 40 psi with an ion spray voltage of 4.5 kV, and a heated capillary temperature of 350 °C. The MSn product ion spectra were produced by collision induced dissociation (CID) of the deprotonated molecule ion [M−H] of the analyte at the respective HPLC retention time with the isolation width (the m/z) of 1.0. The collision energy for the analyte was in the range of 25%–38%, depending on the structures of different compounds.

3.3. Animal Protocol

The wild type (TU strain) zebrafish (D. rerio, mixed sex, 6 months in age, 5 cm in length, 0.25 g in mass) were obtained from the Laboratory Animals Center of Capital Medical University (LACCMU, Beijing, China). All studies on animals were in accordance with the guidelines of the Committee on the Care and Use of Laboratory Animals in China (CCULA, Beijing, China). The animal experiments welfare committee of Capital Medical University (CMU, Beijing, China) had approved the protocols of the animal studies.

3.4. Metabolism of AA and MA in Adult Zebrafish

Prior to the experiments the zebrafish were acclimated under 14:10 h light-dark cycle and constant temperature (25 °C ± 2 °C) for at least two weeks in 10 L tanks equipped with a re-circulating fresh water in zerafish feeding system (Far East Instrument Co., Ltd., Taiwan, China) with air pump, biological and mechanical filtration system and ultraviolet lamps. The physicochemical properties of water such as the dissolved oxygen, pH, temperature, and salinity were monitored daily. When the zebrafish were exposed to the drug solution, drug metabolism consequently occurred, and the metabolites were continuously produced to delivery into the solution [42]. Comparative analysis of the component change of solution between the experiment and control groups could provide significant information about drug metabolism.
The experiments were performed in thermostat waterbath at 25 °C. The concentrations of the test compounds were determined and did not influence the activity of zebrafish for at least 48 h. Thirty zebrafish were randomly assigned into three groups and each group had ten zebrafish. After fasting for 12 h, ten zebrafish of each test group were exposed in 300 mL of water with AA (15 μg/mL) and MA (15 μg/mL), respectively. The control group was exposed in 300 mL of the water without these compounds. The samples were collected from the solution contained the test drug after the zebrafish had been exposed to the test drug for 36 h. All the samples were stored at liquid nitrogen prior to their analysis.

3.5. Sample Preparation

The solution sample (20 mL) of each group was freeze-dried to dryness, and the residue was dissolved in 0.5 mL methanol and vortexed for 2 min. After centrifugation at 14,000 rpm/min for 10 min, each supernatant was filtered with a 0.22 μm of membrane and an aliquot of 10 μL were directly injected into the LC-MS system for metabolite analysis.

4. Conclusions

This study firstly described the application of LC/IT-MSn method using negative ion mode and collision induced dissociation to acquire the fragmentation pathways of AA and its analogue MA, and elucidate their in vivo metabolites. The main characteristic fragment ions of AA and MA were formed via cleavage of alicyclic ring, keto-enol tautomerism and retro-Diels-Alder cleavage on the C ring from their structures. Ten phase I metabolites of AA and nine phase I metabolites of MA were observed and identified in the solution after zebrafish were exposed to the drug.
This investigation confirmed that zebrafish model could imitate the regular methods in elucidating the drug phase I metabolism, which provided further useful evidence for the possibility and reasonability using adult zebrafish in the drug metabolism. With the advantages of lower cost and higher efficiency, zebrafish could be used as an effective metabolic model in drug metabolism research. Our investigation would also contribute to obtain the novel information on the structural elucidation, in vitro fragmentation of mass spectra, in vivo metabolites, intermediate process and metabolic mechanism of pentacyclic triterpenoids, which would be helpful to better understand the safety and efficacy of these compounds.

Acknowledgments

This work was supported by the Program of National Natural Science Foundation of China (81173121), the Key Program of Beijing Municipal Commission of Education (KZ201110025024), the projects for Academic Human Resources Development in Institutions of High Learning (PHR201007111) and Beijing Laboratory for Biomedical Detection Technology and Instrument (PXM2014-014226-000021) under the Jurisdiction of Beijing Municipality of China.

Author Contributions

M. Xue designed the research and provided critical advice on operation of the analytical equipment. B. Xia was responsible for preparing the first draft of the manuscript and performed most of the experimentation and analysis. L. Bai, X. Li, J. Xiong and P. Xu had a significant role in development of the experiments and interpretation of results. All authors read and approved the final manuscript.

Conflicts of Interest

The authors declare no conflict of interest.

References

  1. Chinese Pharmacopoeia Commission. Pharmacopoeia of the People’s Republic of China; China Medical Science and Technology Press: Beijing, China, 2010; Volume 1, p. 266. [Google Scholar]
  2. An, I.S.; An, S.; Choe, T.Β.; Kang, S.Μ.; Lee, J.H.; Park, I.C.; Jin, Y.W.; Lee, S.J.; Bae, S. Centella asiatica protects against UVB-induced HaCaT keratinocyte damage through microRNA expression changes. Int. J. Mol. Med. 2012, 30, 1349–1356. [Google Scholar]
  3. Hong, S.S.; Kim, J.H.; Li, H.; Shim, C.K. Advanced formulation and pharmacological activity of hydrogel of the titrated extract of C. asiatica. Arch. Pharm. Res. 2005, 28, 502–508. [Google Scholar] [CrossRef]
  4. Cho, M.K.; Sung, M.A.; Kim, D.S.; Park, H.G.; Jew, S.S.; Kim, S.G. 2-Oxo-3,23-isopropylidene-asiatate (AS2006A), a wound-healing asiatate derivative, exerts anti-inflammatory effect by apoptosis of macrophages. Int. Immunopharmacol. 2003, 3, 1429–1437. [Google Scholar] [CrossRef] [PubMed]
  5. Won, J.H.; Shin, J.S.; Park, H.J.; Jung, H.J.; Koh, D.J.; Jo, B.G.; Lee, J.Y.; Yun, K.; Lee, K.T. Anti-inflammatory effects of madecassic acid via the suppression of NF-B pathway in LPS-induced RAW 246.7 macrophage cells. Planta Med. 2010, 76, 251–257. [Google Scholar] [CrossRef]
  6. Yadav, V.R.; Prasad, S.; Sung, B.; Kannappan, R.; Aggarwal, B.B. Targeting inflammatory pathways by triterpenoids for prevention and treatment of cancer. Toxins 2010, 2, 2428–2466. [Google Scholar] [CrossRef] [PubMed]
  7. Yun, K.J.; Kim, J.Y.; Kim, J.B.; Lee, K.W.; Jeong, S.Y.; Park, H.J.; Jung, H.J.; Cho, Y.W.; Yun, K.; Lee, K.T. Inhibition of LPS-induced NO and PGE2 production by asiatic acid via NF-kappa B inactivation in RAW 264.7 macrophages: Possible involvement of the IKK and MAPK pathways. Int. Immunopharmacol. 2008, 8, 431–441. [Google Scholar]
  8. Maulidiani; Abas, F.; Khatib, A.; Shaari, K.; Lajisa, N.H. Chemical characterization and antioxidant activity of three medicinal Apiaceae species. Ind. Crop. Prod. 2014, 55, 238–247. [Google Scholar]
  9. Ramachandran, V.; Saravanan, R. Asiatic acid prevents lipid peroxidation and improves antioxidant status in rats with streptozotocin-induced diabetes. J. Funct. Foods 2013, 5, 1077–1087. [Google Scholar] [CrossRef]
  10. Xiong, Y.; Ding, H.; Xu, M.; Gao, J. Protective effects of asiatic acid on rotenone- or H2O2-induced injury in SH-SY5Y cells. Neurochem. Res. 2009, 34, 746–754. [Google Scholar] [CrossRef] [PubMed]
  11. Hsu, Y.L.; Kuo, P.L.; Lin, L.T.; Lin, C.C. Asiatic acid, a triterpene, induces apoptosis and cell cycle arrest through activation of extracellular signal-regulated kinase and p38 mitogen-activated protein kinase pathways in human breast cancer cells. J. Pharmacol. Exp. Ther. 2005, 313, 333–344. [Google Scholar] [CrossRef] [PubMed]
  12. Park, B.C.; Bosire, K.O.; Lee, E.S.; Lee, Y.S.; Kim, J.A. Asiatic acid induces apoptosis in SK-MEL-2 human melanoma cells. Cancer Lett. 2005, 218, 81–90. [Google Scholar] [CrossRef] [PubMed]
  13. Salvador, J.A.R.; Moreira, V.M.; Goncalves, B.M.F.; Leal, A.S.; Jing, Y. Ursane-type pentacyclic triterpenoids as useful platforms to discover anticancer drugs. Nat. Prod. Rep. 2012, 29, 1463–1479. [Google Scholar] [CrossRef] [PubMed]
  14. Krishnamurthy, R.G.; Senut, M.C.; Zemke, D.; Min, J.; Frenkel, M.B.; Greenberg, E.J.; Yu, S.W.; Ahn, N.; Goudreau, J.; Kassab, M.; et al. Asiatic acid, a pentacyclic triterpene from Centella asiatica, is neuroprotective in a mouse model of focal cerebral ischemia. J. Neurosci. Res. 2009, 87, 2541–2550. [Google Scholar]
  15. Xiong, Y.Y.; Ding, H.Q.; Xu, M.F.; Gao, J. Neuroprotective effects of Asiatic Acid against Parkinson-like injury of SH-SY5Y cells and motor deficient of mutant drosophilas. J. Neurochem. 2010, 115, 55–55. [Google Scholar]
  16. Zhang, X.N.; Wu, J.Y.; Dou, Y.; Xia, B.B.; Rong, W.B.; Rimbach, G.; Lou, Y.J. Asiatic acid protects primary neurons against C2-ceramide-induced apoptosis. Eur. J. Pharmacol. 2012, 679, 51–59. [Google Scholar] [CrossRef] [PubMed]
  17. Hu, G.; Siu, S.O.; Li, S.; Chu, I.K.; Kwan, Y.W.; Chan, S.W.; Leung, G.P.; Yan, R.; Lee, S.M. Metabolism of calycosin, an isoflavone from Astragali Radix, in zebrafish larvae. Xenobiotica 2012, 42, 294–303. [Google Scholar] [CrossRef] [PubMed]
  18. Crawford, A.D.; Esguerra, C.V.; de Witte, P.A.M. Fishing for drugs from nature: Zebrafish as a technology platform for natural product discovery. Planta Med. 2008, 74, 624–632. [Google Scholar] [CrossRef] [PubMed]
  19. Scornaienchi, M.L.; Thornton, C.; Willett, K.L.; Wilson, J.Y. Functional differences in the cytochrome P450 1 family enzymes from zebrafish (Danio rerio) using heterologously expressed proteins. Arch. Biochem. Biophys. 2010, 502, 17–22. [Google Scholar] [CrossRef] [PubMed]
  20. Thompson, E.D.; Burwinkel, K.E.; Chava, A.K.; Notch, E.G.; Mayer, G.D. Activity of Phase I and Phase II enzymes of the benzo[a]pyrene transformation pathway in zebrafish (Danio rerio) following waterborne exposure to arsenite. Comp. Biochem. Phys. C 2010, 152, 371–378. [Google Scholar]
  21. Trickler, W.J.; Guo, X.; Cuevas, E.; Ali, S.F.; Paule, M.G.; Kanungo, J. Ketamine attenuates cytochrome p450 aromatase gene expression and estradiol-17β levels in zebrafish early life stages. J. Appl. Toxicol. 2014, 34, 480–488. [Google Scholar] [CrossRef] [PubMed]
  22. Almeida, D.V.; Nornberg, B.F.; Geracitano, L.A.; Barros, D.M.; Monserrat, J.M.; Marins, L.F. Induction of phase II enzymes and hsp70 genes by copper sulfate through the electrophile-responsive element (EpRE): Insights obtained from a transgenic zebrafish model carrying an orthologous EpRE sequence of mammalian origin. Fish Physiol. Biochem. 2010, 36, 347–353. [Google Scholar] [CrossRef] [PubMed]
  23. Liu, T.A.; Bhuiyan, S.; Liu, M.Y.; Sugahara, T.; Sakakibara, Y.; Suiko, M.; Yasuda, S.; Kakuta, Y.; Kimura, M.; Williams, F.E.; et al. Zebrafish as a model for the study of the phase II cytosolic sulfotransferases. Curr. Drug Metab. 2010, 11, 538–546. [Google Scholar]
  24. Christen, V.; Fent, K. Tissue-, sex- and development-specific transcription profiles of eight UDP-glucuronosyltransferase genes in zebrafish (Danio rerio) and their regulation by activator of aryl hydrocarbon receptor. Aquat. Toxicol. 2014, 150, 93–102. [Google Scholar] [CrossRef] [PubMed]
  25. Zheng, Y.F.; Qi, L.W.; Zhou, J.L.; Li, P. Structural characterization and identification of oleanane-type triterpene saponins in Glycyrrhiza uralensis Fischer by rapid-resolution liquid chromatography coupled with time-of-flight mass spectrometry. Rapid Commun. Mass Spectrom. 2010, 24, 3261–3270. [Google Scholar] [CrossRef] [PubMed]
  26. Ye, J.; Qin, J.J.; Su, J.; Lin, S.; Huang, Y.; Jin, H.Z.; Zhang, W.D. Identification and structural characterization of dimeric sesquiterpene lactones in Inula japonica Thunb by high-performance liquid chromatography/electrospray ionization with multi-stage mass spectrometry. Rapid Commun. Mass Spectrom. 2013, 27, 2159–2169. [Google Scholar] [CrossRef] [PubMed]
  27. Hamish, M.; Ester, S.B.F.; Alison, N.H.; Anita, Q. Negative ion ESI-MS analysis of natural yellow dye flavonoids-An isotopic labelling study. Int. J. Mass Spectrom. 2009, 284, 57–65. [Google Scholar] [CrossRef]
  28. Lee, Y.T.; Fong, T.H.; Chen, H.M.; Chang, C.Y.; Wang, Y.H.; Chern, C.Y.; Chen, Y.H. Toxicity assessments of chalcone and some synthetic chalcone analogues in a zebrafish model. Molecules 2014, 19, 641–650. [Google Scholar] [CrossRef] [PubMed]
  29. Yang, L.L.; Wang, G.Q.; Yang, L.M.; Huang, Z.B.; Zhang, W.Q.; Yu, L.Z. Endotoxin molecule lipopolysaccharide-induced zebrafish inflammation model: A novel screening method for anti-inflammatory drugs. Molecules 2014, 19, 2390–2409. [Google Scholar] [CrossRef] [PubMed]
  30. Wang, Y.X.; Hao, H.P.; Wang, G.J.; Tu, P.F.; Jiang, Y.; Liang, Y.; Dai, L.; Yang, H.; Lai, L.; Zheng, C.N.; et al. An approach to identifying sequential metabolites of a typical phenylethanoid glycoside, echinacoside, based on liquid chromatography-ion trap-time of flight mass spectrometry analysis. Talanta 2009, 572–580. [Google Scholar]
  31. Clarke, N.J.; Rindgen, D.; Korfmacher, W.A.; Cox, K.A. Systematic LC/MS metabolite identification in drug discovery. Anal. Chem. 2001, 73, 430A–439A. [Google Scholar] [CrossRef] [PubMed]
  32. Tozuka, Z.; Kaneko, H.; Shiraga, T.; Mitani, Y.; Beppu, M.; Terashita, S.; Kawamura, A.; Kagayama, A. Strategy for structural elucidation of drugs and drug metabolites using (MS)n fragmentation in an electrospray ion trap. J. Mass Spectrom. 2003, 38, 793–808. [Google Scholar] [CrossRef] [PubMed]
  33. Song, Y.L.; Jing, W.H.; Chen, Y.G.; Yuan, Y.F.; Yan, R.; Wang, Y.T. H-1 nuclear magnetic resonance based-metabolomic characterization of Peucedani Radix and simultaneous determination of praeruptorin A and praeruptorin B. J. Pharmaceut. Biomed. 2014, 93, 86–94. [Google Scholar] [CrossRef]
  34. Feng, X.; Zou, Z.M.; Fu, S.B.; Sun, L.Z.; Su, Z.H.; Sun, D.A. Microbial oxidation and glucosidation of echinocystic acid by Nocardia coralline. J. Mol. Catal. B: Enzym. 2010, 66, 219–223. [Google Scholar] [CrossRef]
  35. Feng, X.; Luan, J.; Guo, F.F.; Li, D.P.; Chu, Z.Y. Microbial transformation of maslinic acid by Cunninghamella blakesleana. J. Mol. Catal. B: Enzym. 2012, 82, 127–130. [Google Scholar] [CrossRef]
  36. Martinez, A.; Rivas, F.; Perojil, A.; Parra, A.; Garcia-Granados, A; Fernandez-Vivas, A. Biotransformation of oleanolic and maslinic acids by Rhizomucor miehei. Phytochemistry 2013, 94, 229–237. [Google Scholar]
  37. Fu, S.B.; Yang, J.S.; Cui, J.L.; Sun, D.A. Biotransformation of ursolic acid by Syncephalastrum racemosum CGMCC 3.2500 and anti-HCV activity. Fitoterapia 2013, 86, 123–128. [Google Scholar]
  38. He, W.N.; Dai, J.G.; Ye, M.; Wu, L.J.; Guo, D.A. Microbial transformation of asiatic acid by Alternaria longipes. J. Asian Nat. Prod. Res. 2010, 12, 760–764. [Google Scholar]
  39. Huang, F.X.; Yang, W.Z.; Ye, F.; Tian, J.Y.; Hu, H.B.; Feng, L.M.; Guo, D.A.; Ye, M. Microbial transformation of ursolic acid by Syncephalastrum racemosum (Cohn) Schroter AS 3.264. Phytochemistry 2012, 82, 56–60. [Google Scholar] [CrossRef]
  40. Zhang, D.L.; Zhu, M.S.; Humphreys, W.G. Drug Metabolism in Drug Design and Development: Basic Concepts and Practice; John Wiley & Sons, Inc.: Hoboken, NJ, USA, 2007; pp. 319–359. [Google Scholar]
  41. Wu, G.W.; Gao, J.M.; Shi, X.W.; Zhang, Q.; Wei, S.P.; Ding, K. Microbial transformations of diosgenin with the white-rot basidiomycete Coriolus versicolor. J. Nat. Prod. 2011, 74, 2095–2101. [Google Scholar] [CrossRef] [PubMed]
  42. Wei, Y.J.; Li, P.; Fan, H.W.; Peng, Y.R.; Liu, W.; Wang, C.M.; Shu, L.; Jia, X.B. Metabolism of Tanshinone IIA, Cryptotanshinone and Tanshinone I from Radix Salvia Miltiorrhiza in Zebrafish. Molecules 2011, 16, 6621–6633. [Google Scholar] [CrossRef] [PubMed]
  • Sample Availability: Samples of the compounds are available from the authors.

