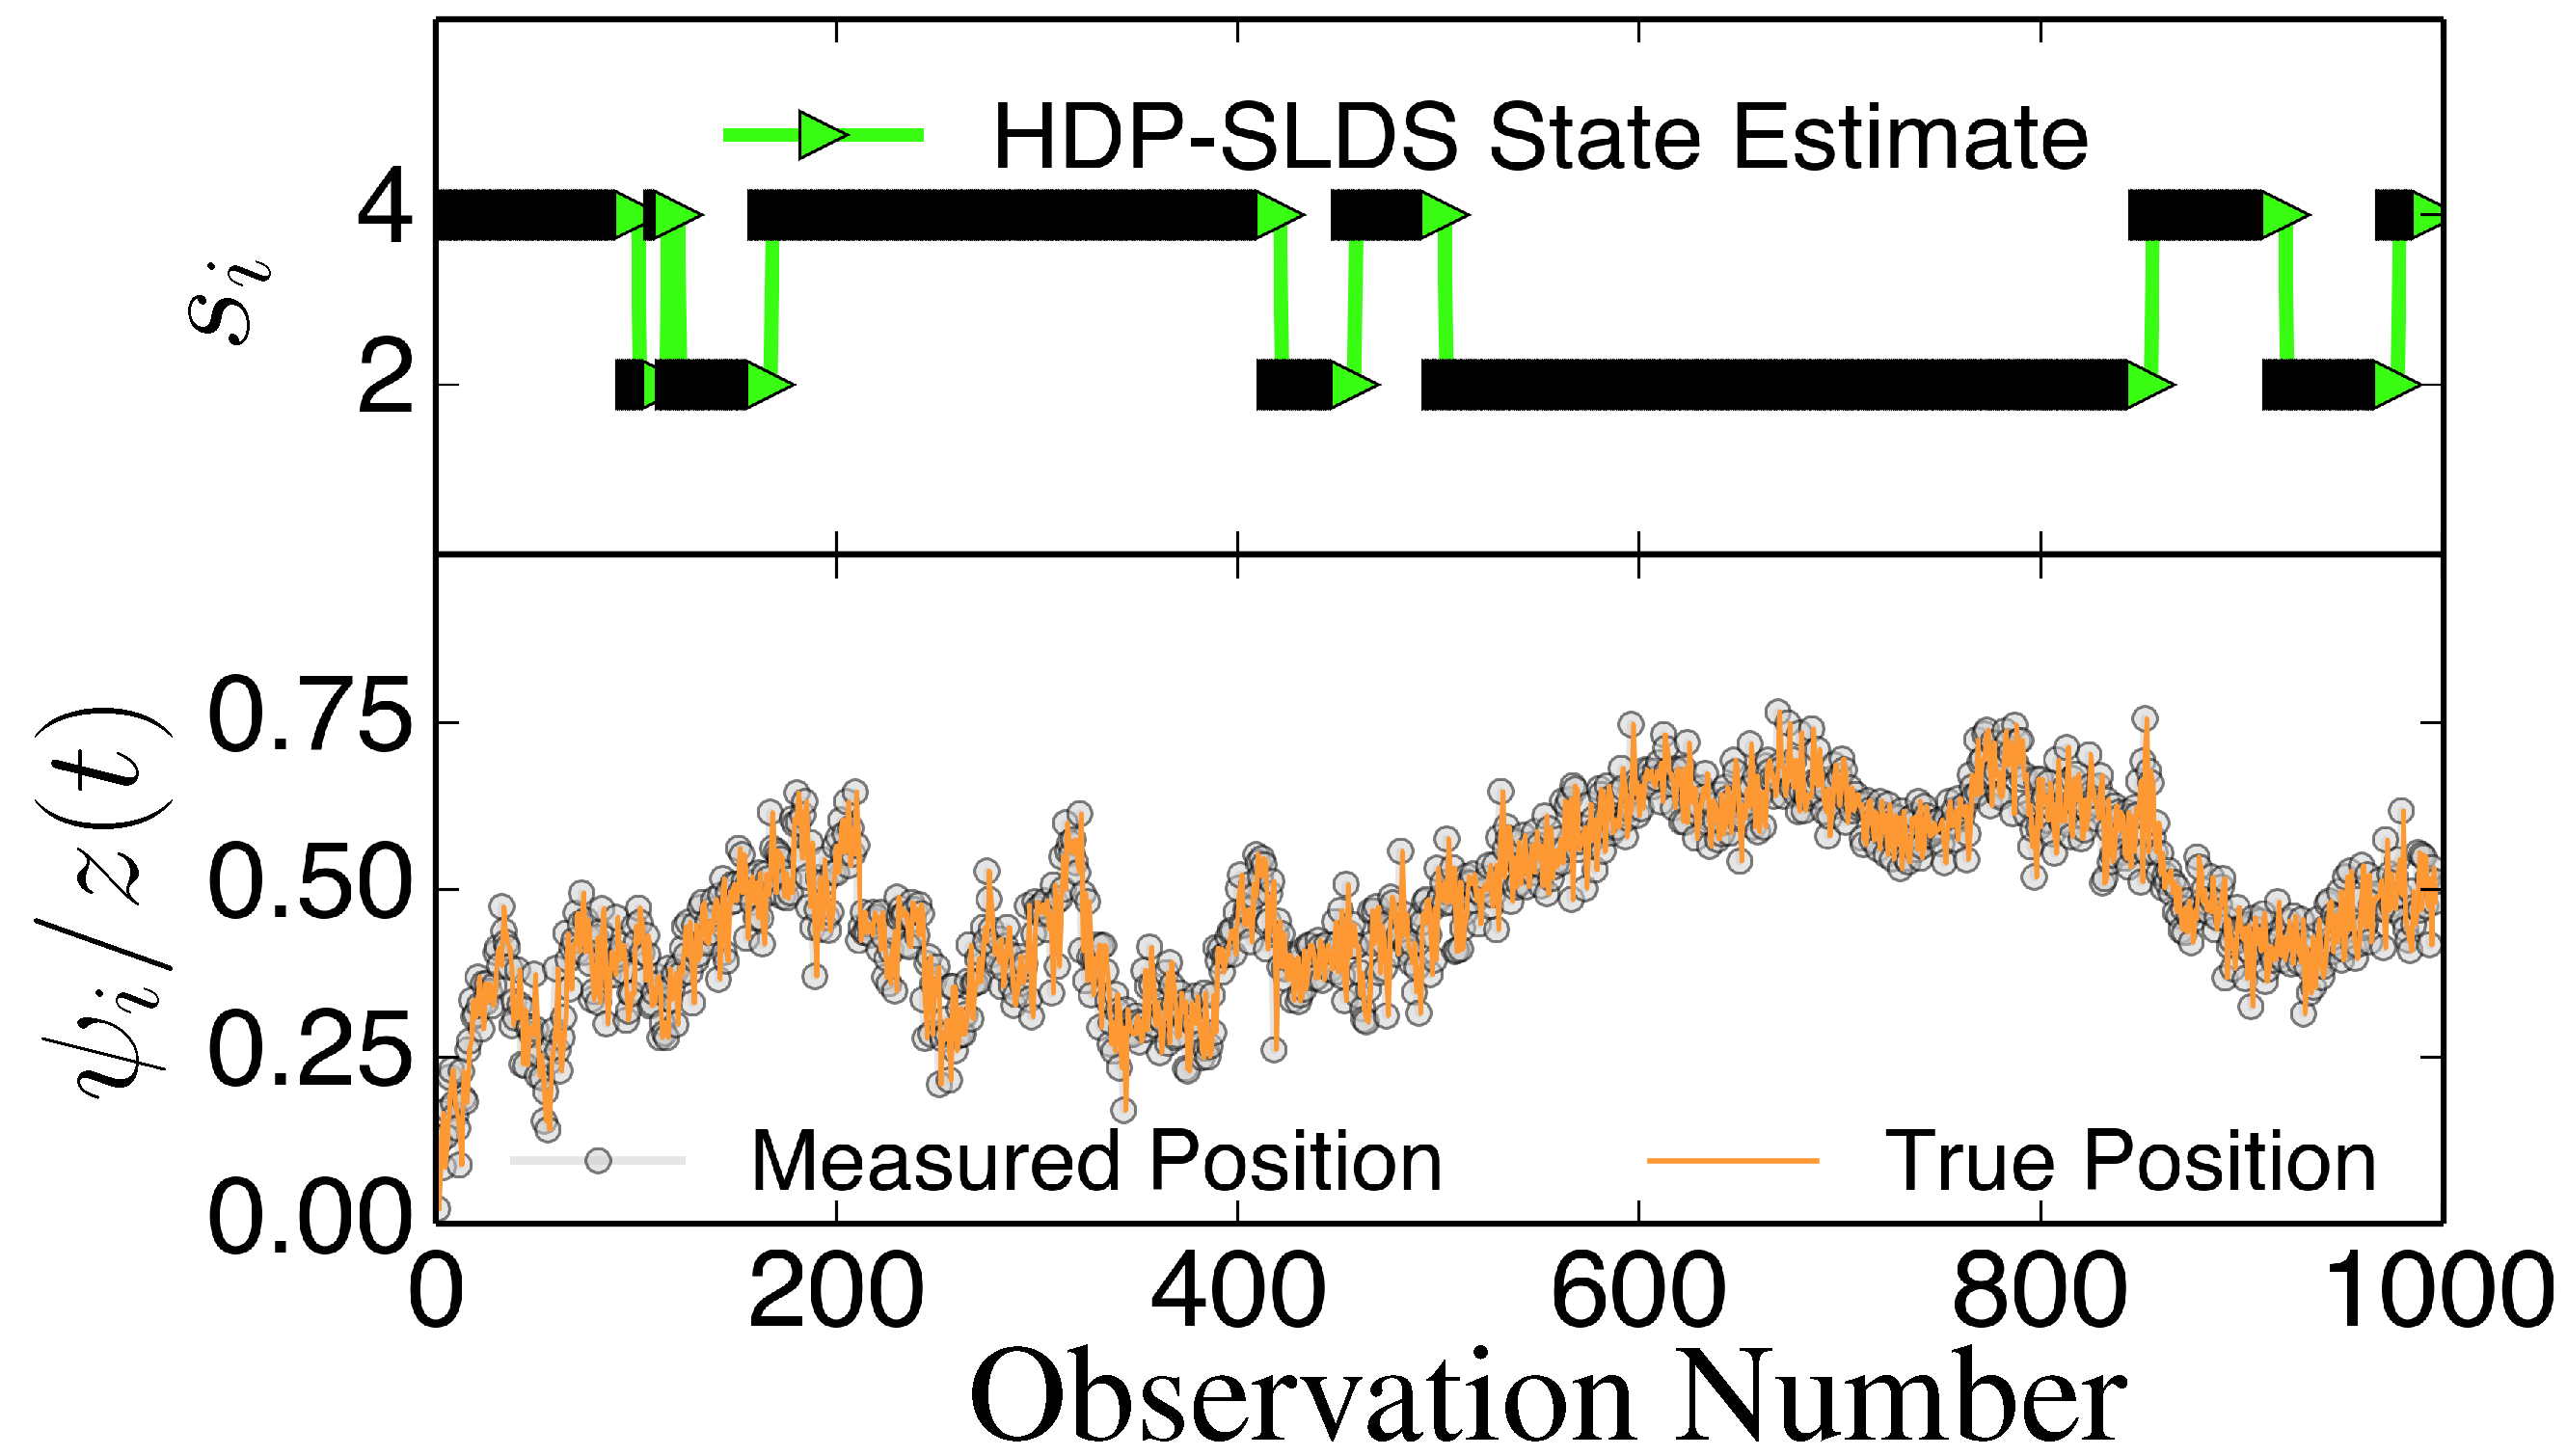
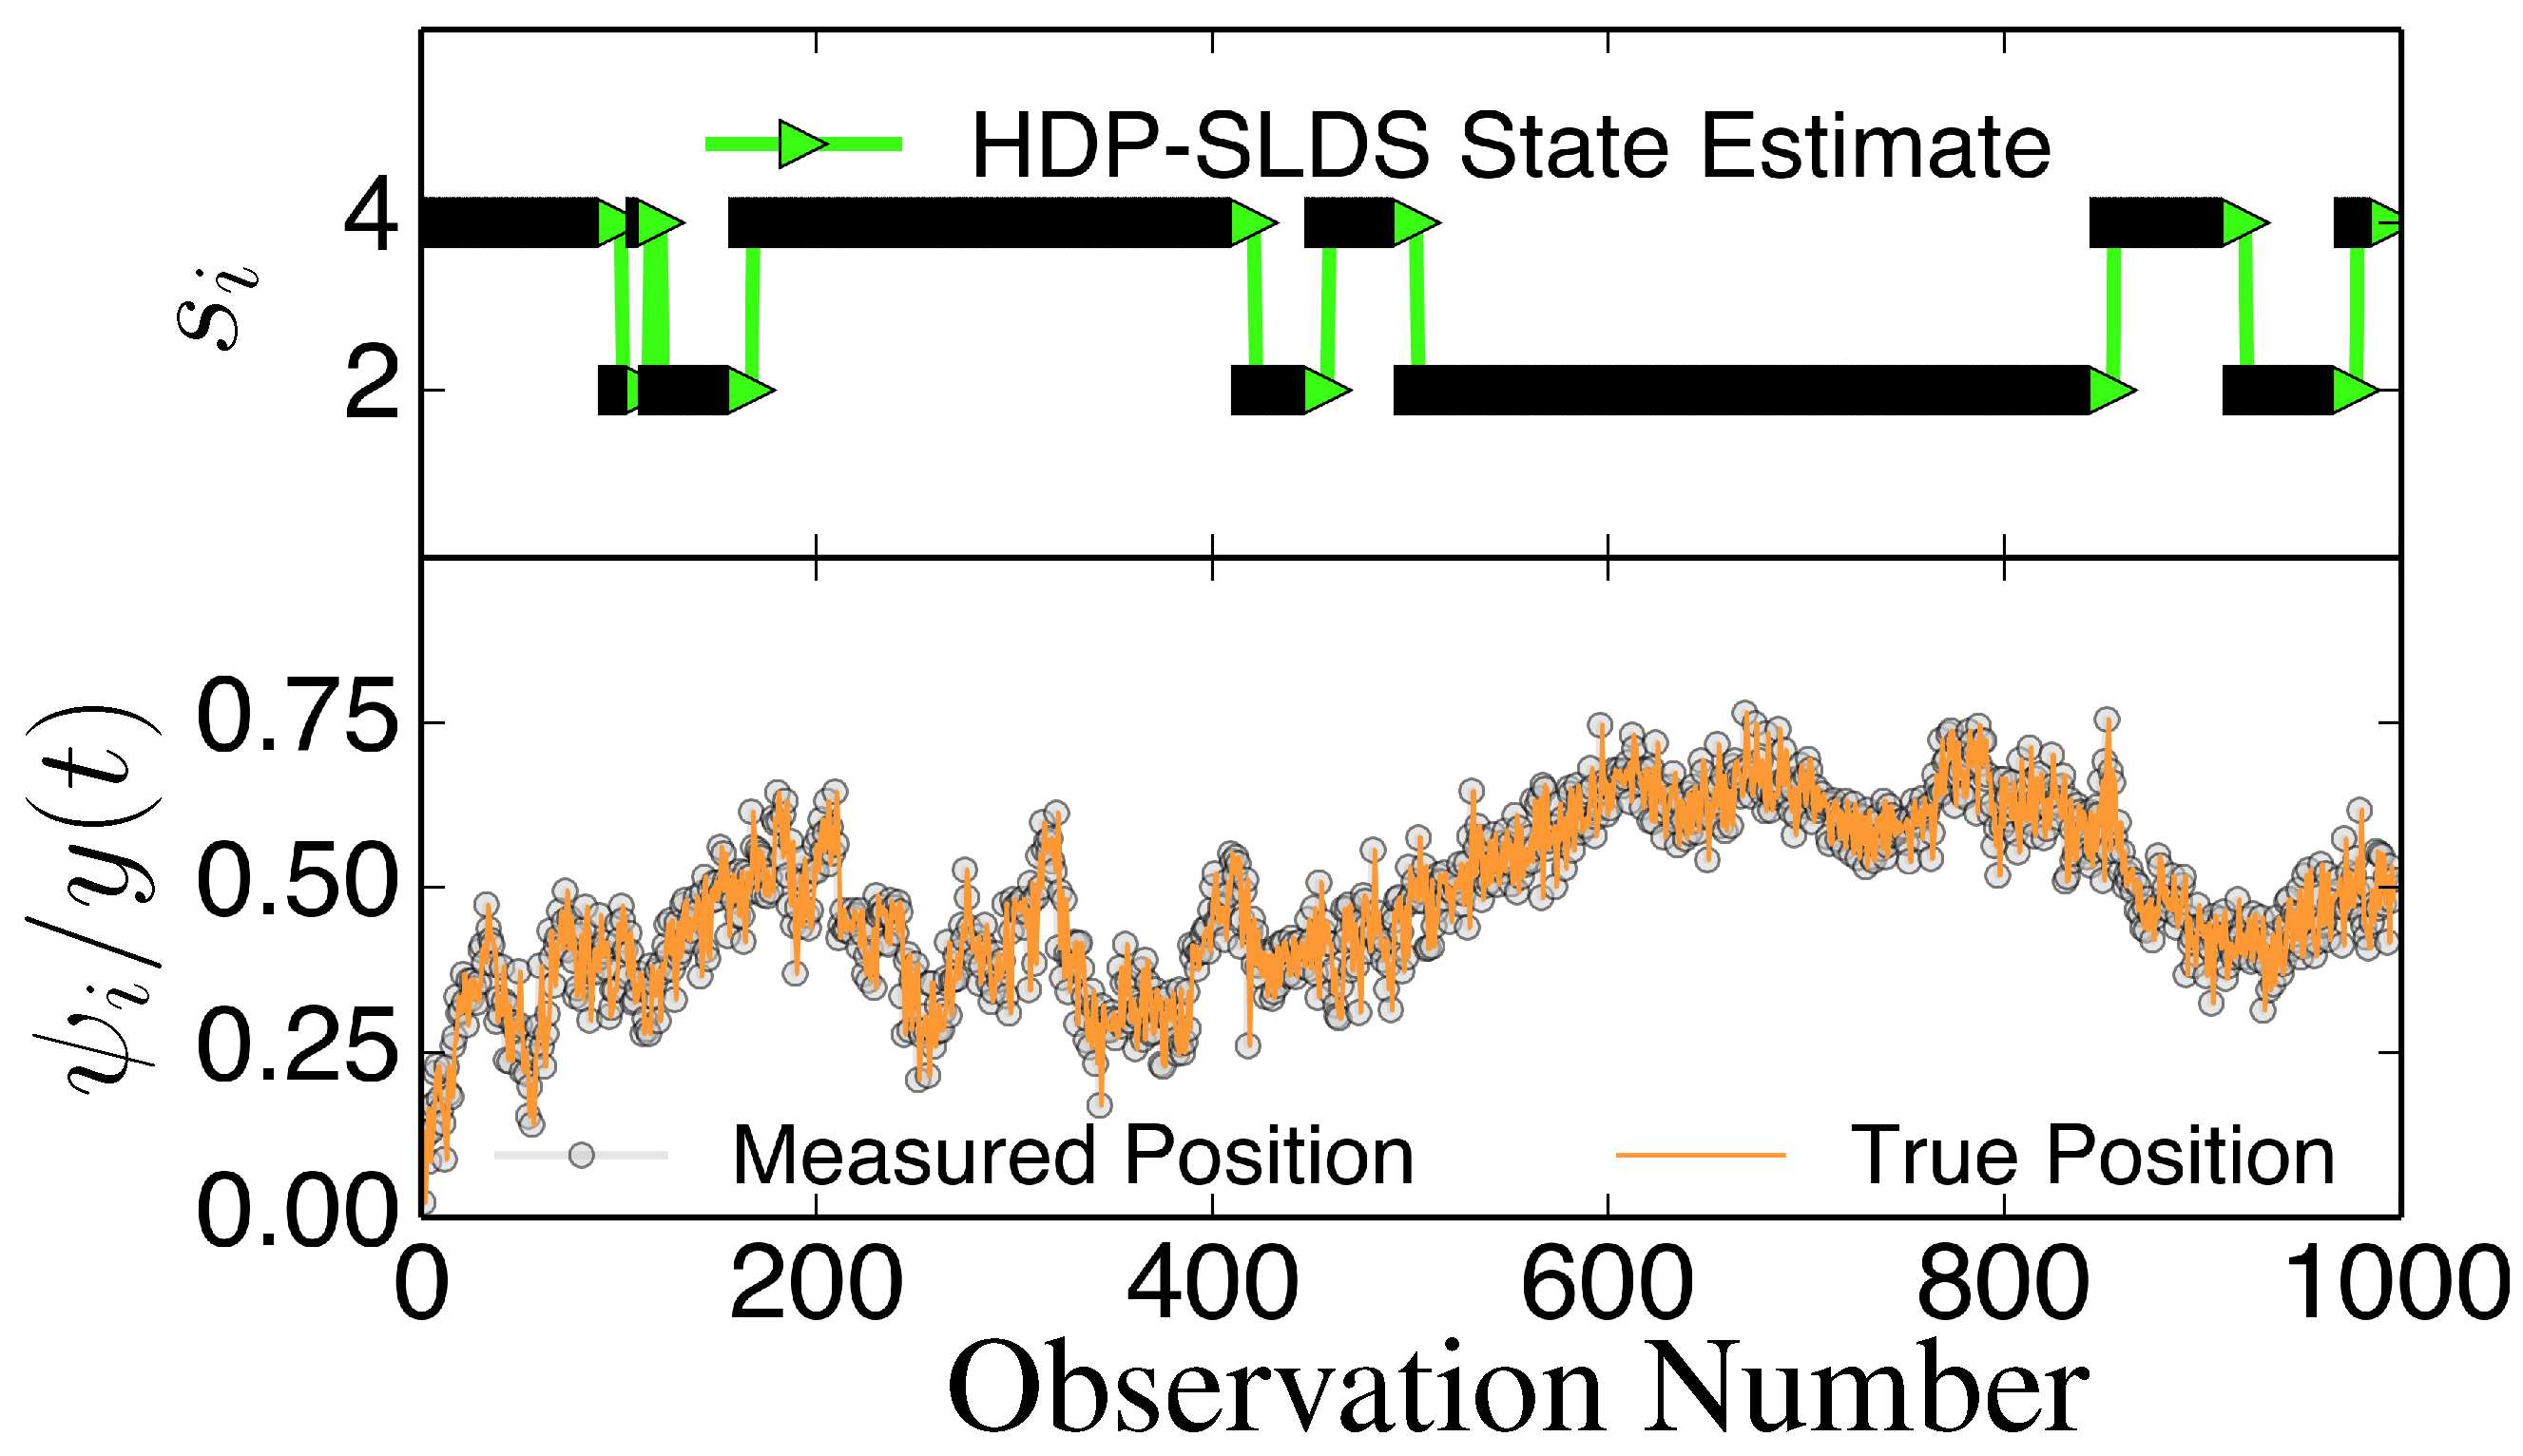
Correction: Calderon, C.P. Data-Driven Techniques for Detecting Dynamical State Changes in Noisily Measured 3D Single-Molecule Trajectories. Molecules 19, 18381-18398
- (1)
- The fixed point reported on pgs. 18384 and 18388 corresponds to a different parameterization of the model reported Equation (1). That is, −F−1 corresponds to the fixed point of = + + F (random noise components omitted). For the model in Equation (1), the correct fixed point expression is (Id − F)−1 where Id denotes the identity matrix. Accordingly, to be consistent with the discrete model shown in the published manuscript, the expression −F−1 on pgs. 18384 and 18388 should be replaced by (Id − F)−1. This was a typographical error and did not affect the results presented.
- (2)
- The following information should have appeared in the Appendix, but was unintentionally omitted in the published version: “The simulations were generated by using the Euler-Maruyama integration scheme using a time step size of 2 × 10⁻⁴[s]. The time series data was recorded uniformly in time with ∆t = 1 × 10⁻² time units separating observations. Simulated measurement noise was then added to the time series to produce measurements. The HDP-SLDS toolbox currently available on Emily Fox’s webpage (http:// www.stat.washington.edu/ ~ebfox/ software/ HDPHMM_HDPSLDS_toolbox.zip) was used to implement the HDP inference.”
- (3)
- The last sentence in the published Appendix, “Note: the plots ... by .” (pg. 18395), should not have appeared in the published work. The comment is not applicable to the final published version of the paper and adds confusion. The plots presented in the published manuscript did not use the ad hoc linear scaling discussed.


Reference
- Calderon, C.P. Data-Driven Techniques for Detecting Dynamical State Changes in Noisily Measured 3D Single-Molecule Trajectories. Molecules 2014, 19, 18381–18398. [Google Scholar]
© 2015 by the authors. Licensee MDPI, Basel, Switzerland. This article is an open access article distributed under the terms and conditions of the Creative Commons Attribution license ( http://creativecommons.org/licenses/by/4.0/).
Share and Cite
Calderon, C.P. Correction: Calderon, C.P. Data-Driven Techniques for Detecting Dynamical State Changes in Noisily Measured 3D Single-Molecule Trajectories. Molecules 19, 18381-18398. Molecules 2015, 20, 2828-2830. https://doi.org/10.3390/molecules20022828
Calderon CP. Correction: Calderon, C.P. Data-Driven Techniques for Detecting Dynamical State Changes in Noisily Measured 3D Single-Molecule Trajectories. Molecules 19, 18381-18398. Molecules. 2015; 20(2):2828-2830. https://doi.org/10.3390/molecules20022828
Chicago/Turabian StyleCalderon, Christopher P. 2015. "Correction: Calderon, C.P. Data-Driven Techniques for Detecting Dynamical State Changes in Noisily Measured 3D Single-Molecule Trajectories. Molecules 19, 18381-18398" Molecules 20, no. 2: 2828-2830. https://doi.org/10.3390/molecules20022828


