
Short-Term and Sub-Chronic Dietary Exposure to Aspalathin-Enriched Green Rooibos (Aspalathus linearis) Extract Affects Rat Liver Function and Antioxidant Status

 , and
, and
Abstract
:1. Introduction
2. Results and Discussion
2.1. Characterization of GRE
2.2. Feed Intake Parameters, Body Weight Gain and Relative Organ Weights

| Duration | Feed Intake (g/100 g bw) | GRE a Intake (g/100 g bw) | TP Intake b | Bwg (g) | RLW (%) c | RKW (%) c |
|---|---|---|---|---|---|---|
| 28 days | ||||||
| Control | 9.73 ± 0.42a | - | - d | 94.50 ± 10.20a | 3.57 ± 0.18a | 0.65 ± 0.03a |
| GRE | 9.65 ± 0.39a | 0.019 ± 0.001a | 7.57 ± 0.30a | 89.50 ± 12.94a | 3.70 ± 0.18a | 0.63 ± 0.03a |
| 90 days | ||||||
| Control | 7.27 ± 0.49b | - | - d | 126.85 ± 19.21b | 2.73 ± 0.27b | 0.80 ± 0.14b |
| GRE | 7.97 ± 0.57c | 0.016 ± 0.001b | 6.27 ± 0.30b | 139.86 ± 17.41b | 2.68 ± 0.20b | 0.75 ± 0.07b |
| Structure | Compound | Substitution | Daily Intake b (28 days) | Daily Intake b (90 days) |
|---|---|---|---|---|
Dihydrochalcones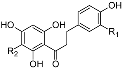 | aspalathin | R1 = OH, R2 = β-d-glucopyranosyl | 3.557 ± 0.14 | 2.947 ± 0.2 |
| nothofagin | R1 = H, R2 = β-d-glucosylpyranosyl | 0.249 ± 0.01 | 0.207 ± 0.014 | |
Flavones | orientin | R1 = β-d-glucopyranosyl, R2 = H; R3 = OH | 0.203 ± 0.01 | 0.17 ± 0.011 |
| isoorientin | R1 = H; R2 = β-d-glucopyranosyl, R3 = OH | 0.396 ± 0.016 | 0.328 ± 0.022 | |
| vitexin | R1 = β-d-glucopyranosyl, R2, R3 = H | 0.052 ± 0.002 | 0.043 ± 0.003 | |
| isovitexin | R1, R3 = H, R2 = β-d-glucopyranosyl | 0.075 ± 0.003 | 0.06 ± 0.004 | |
Flavonols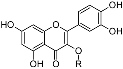 | rutin | R = α-l-rhamnopyranosyl-(1→6)-β-d-glucopyranosyl (rutinosyl) | 0.103 ± 0.004 | 0.086 ± 0.006 |
| quercetin-3-O-robinobioside | R = α-l-rhamnopyranosyl-(1→6)-β-d-galactopyranosyl (robinobiosyl) | 0.20 ± 0.008 | 0.17 ± 0.011 | |
| hyperoside | R = β-d-galactopyranosyl | 0.051 ± 0.002 | 0.043 ± 0.003 | |
| isoquercitrin | R = β-d-glucopyranosyl | 0.073 ± 0.003 | 0.060 ± 0.004 | |
Phenylpropenoic acid | Enolic phenylpyruvic acid-2-O-β-d-glucopyranosyl | R = β-d-glucopyranosyl | 0.095 ± 0.004 | 0.078 ± 0.005 |
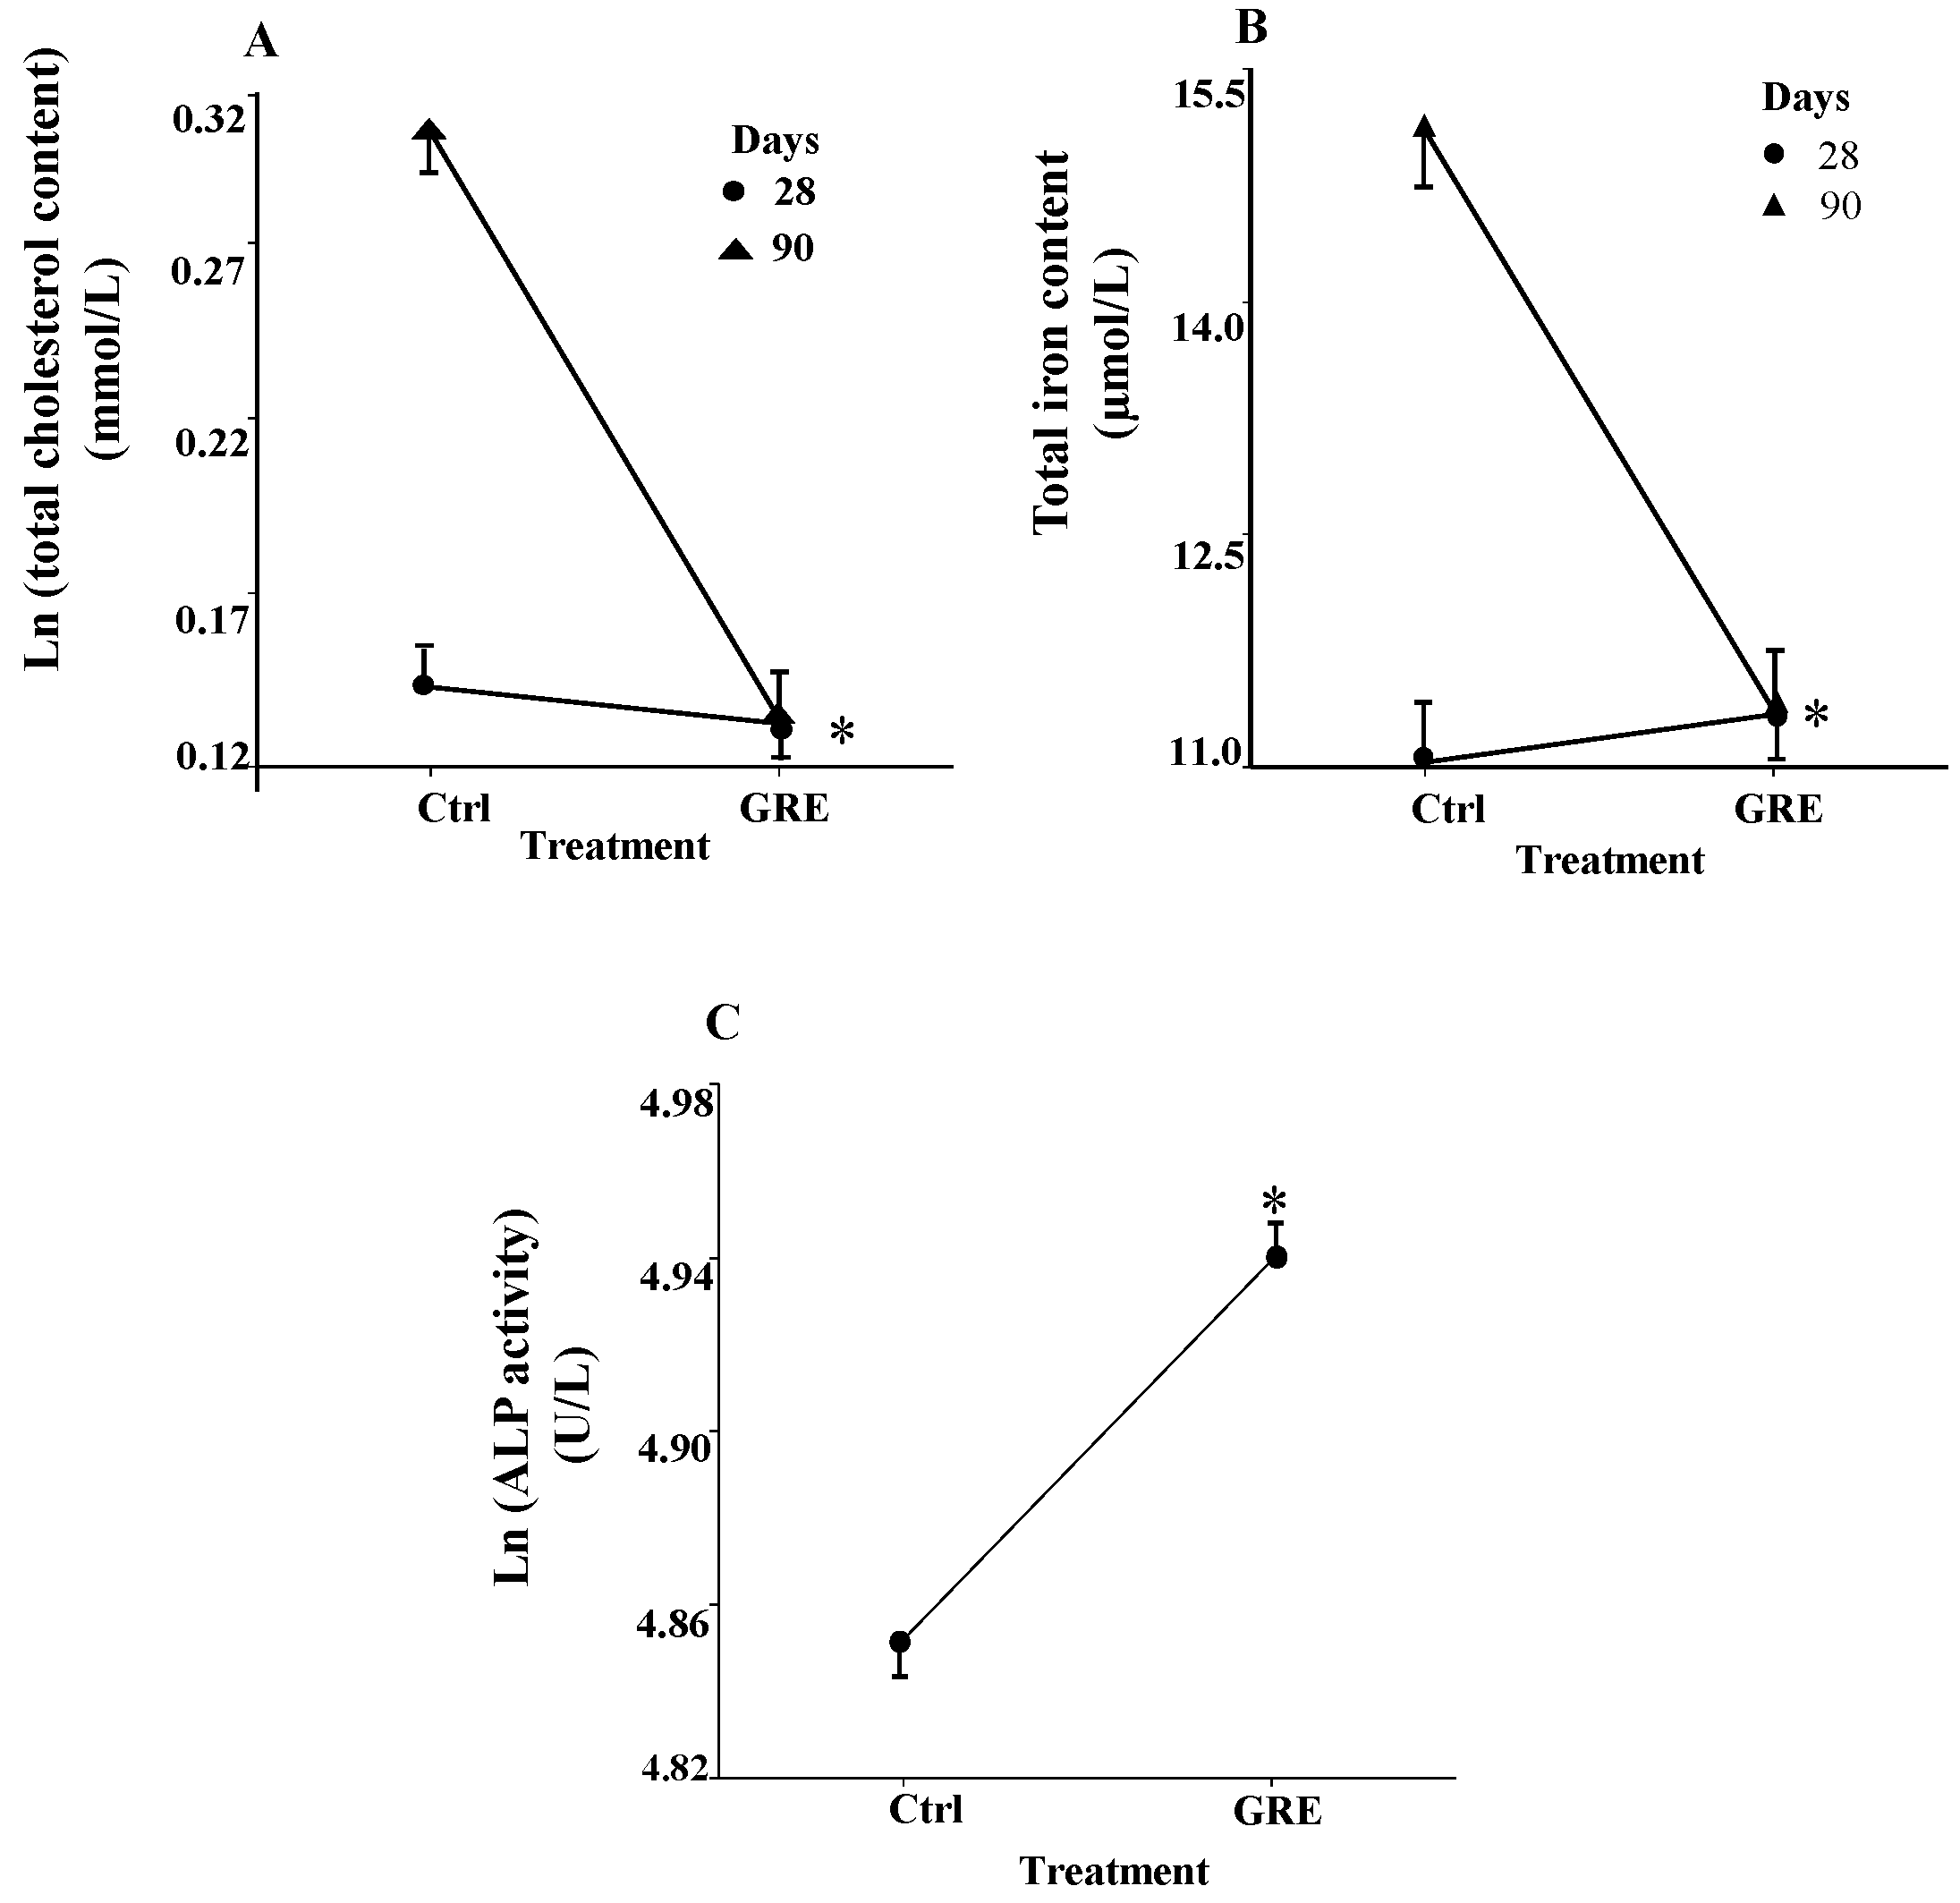
2.3. Serum Clinical Biochemical Parameters
| Clinical Parameter | GGT (U/L) | ALT (U/L) | AST (μmol/L) | Tbili (μmol/L) | Dbili (μmol/L) | Creat (μmol/L) |
|---|---|---|---|---|---|---|
| 28 days | ||||||
| Control | 2.70 (2.75)a | 44.20 (9.90)a | 104.90 (21.93)a | 8.26 (1.75)a | 0.99 (0.41)ab | 46.19 (4.54)a |
| GRE | 1.80 (2.70)a | 42.40 (5.04)a | 105.40 (12.96)a | 7.78 (1.21)a | 0.84 (0.21)a | 46.09 (2.72)a |
| 90 days | ||||||
| Control | 3.00 (1.89)a | 76.33 (7.57)b | 107.80 (25.73)a | 2.46 (0.36)b | 1.24 (0.23)b | 64.70 (8.41)b |
| GRE | 3.67 (2.00)a | 83.00 (14.02)b | 121.00 (16.17)a | 2.09 (0.22)b | 1.30 (0.33)b | 60.33 (3.77)b |
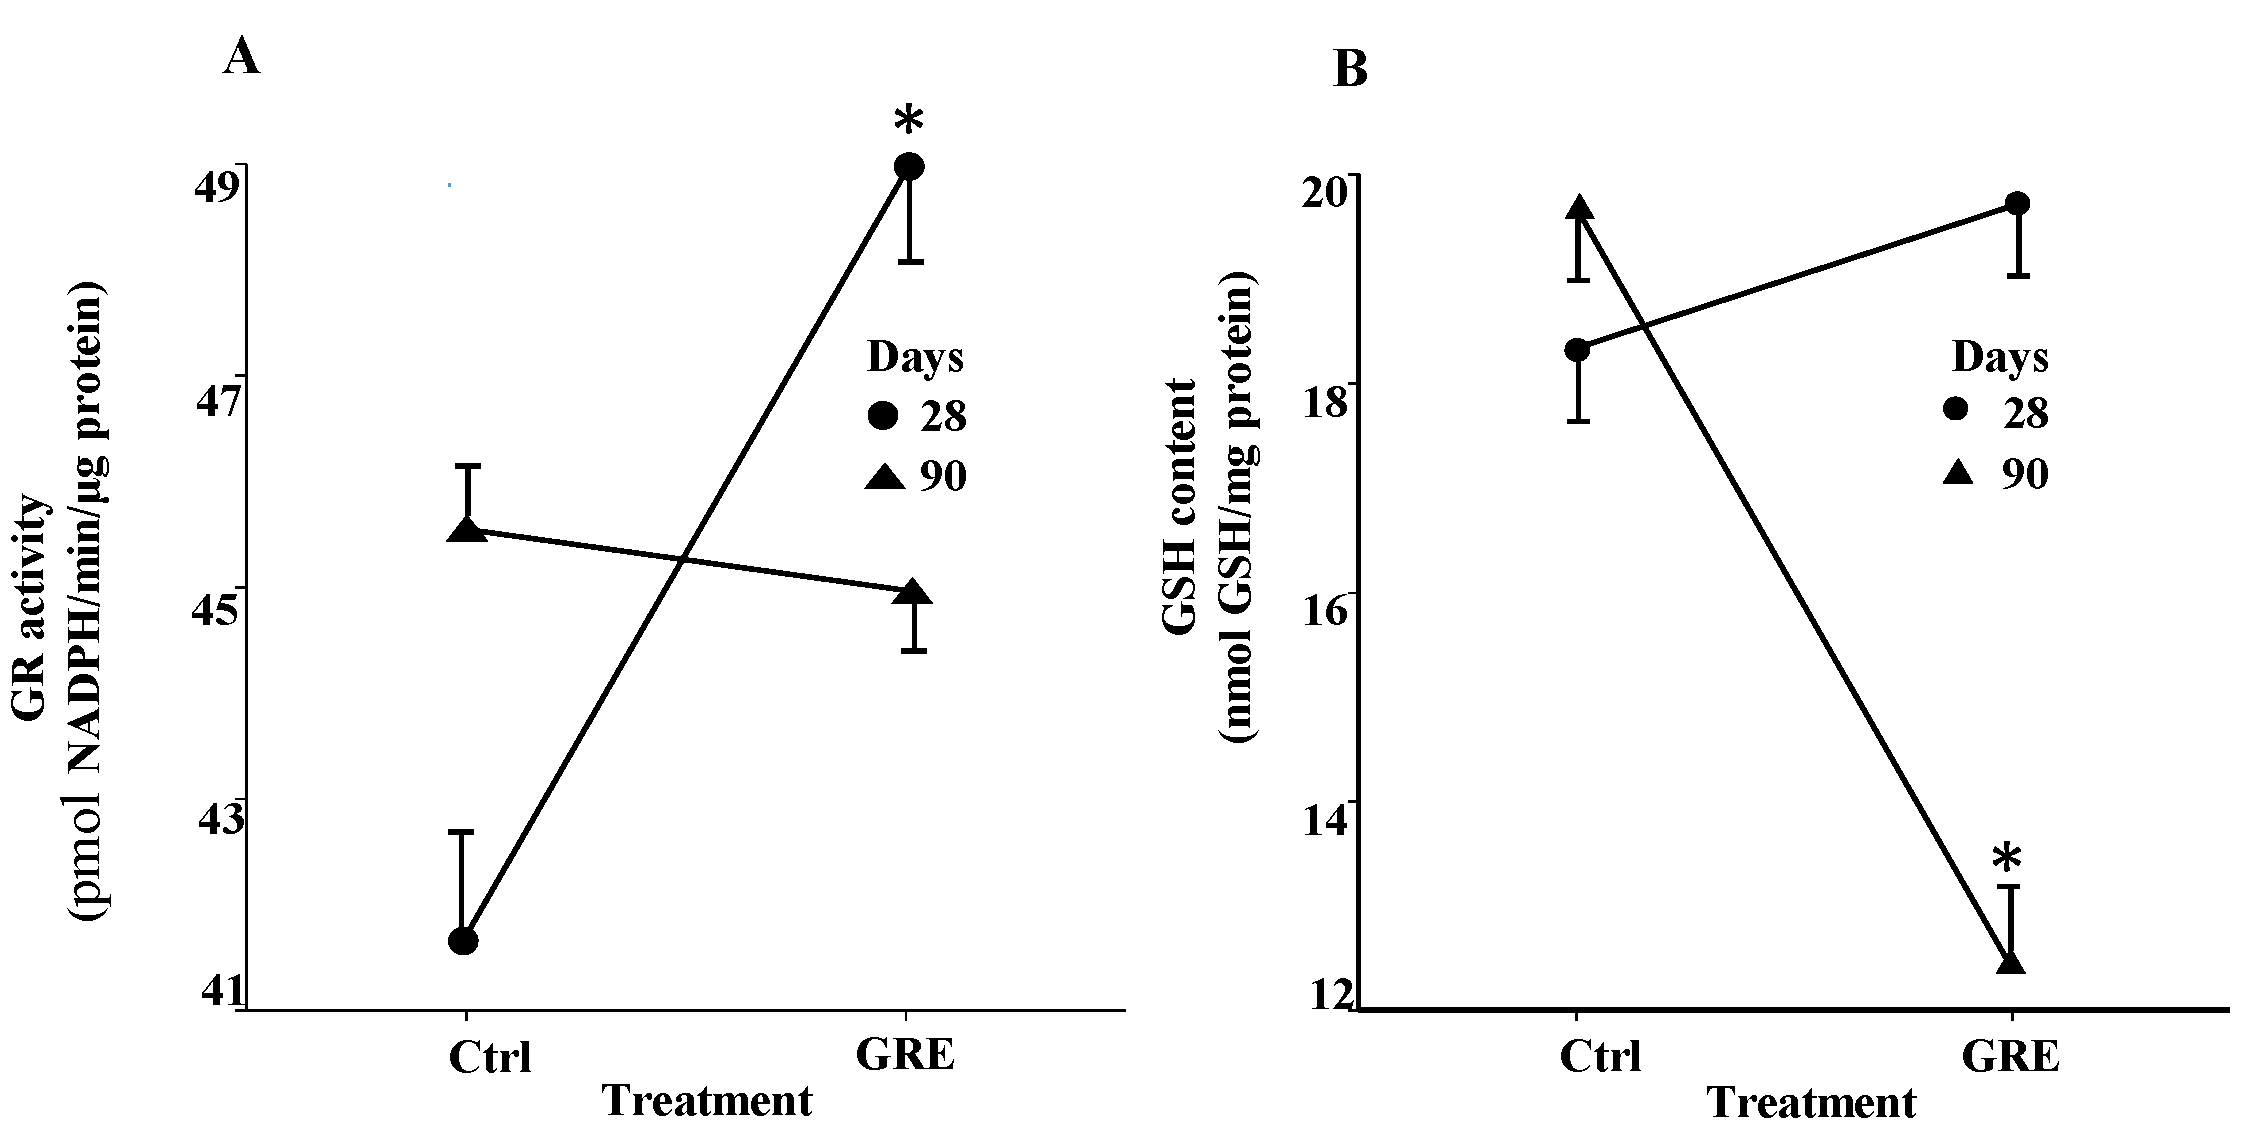
2.4. Oxidative Parameters in the Liver
| Parameter | 28 days | 90 days | ||
|---|---|---|---|---|
| Control | GRE | Control | GRE | |
| CAT b | 320.69 ± 36.85a | 296.56 ± 28.56a | 323.47 ± 33.29a | 320.85 ± 37.48a |
| SOD c | 0.64 ± 0.06a | 0.58 ± 0.06a | 0.55 ± 0.09a | 0.53 ± 0.06a |
| GSSG d | 1.40 ± 0.42a | 1.66 ± 0.57a | 1.68 ± 0.33a | 1.26 ± 0.37a |
| GSH/GSSG e | 12.80 ± 4.44a | 11.95 ± 5.77a | 11.35 ± 3.79a | 9.66 ± 3.01a |
| CD f | 10.43 ± 2.08a | 10.20 ± 2.13a | 10.57 ± 1.68a | 12.27 ± 1.44a |
| MDA g | 1.58 ± 0.53a | 1.67 ± 0.66a | 1.50 ± 0.59a | 1.78 ± 0.43a |
2.5. Differential Expression of Antioxidant Defense and Oxidative Stress Related Genes
| Function Grouping and Name of Gene | Symbol | FC c | p-Value d |
|---|---|---|---|
| (i) Antioxidant defense related genes | |||
| Glutathione Peroxidases | |||
| Glutathione peroxidase 2 | Gpx2 | +1.80 c | 0.04 |
| Glutathione peroxidase 3 | Gpx3 | −1.20 d | 0.04 |
| (i) Genes involved in reactive oxygen species (ROS) metabolism | |||
| Oxidative Stress Responsive Genes | |||
| Aminoadipate-semialdehyde synthase | Aass | +1.32 | 0.01 |
| Apolipoprotein E | Apoe | −1.27 | 0.05 |
| Isocitrate dehydrogenase 1 | Idh1 | +1.30 | 0.04 |
| NAD(P)H dehydrogenase, quinone 1 | Nqo1 | +1.68 | 0.02 |
| Other genes involved in superoxide metabolism | |||
| Neutrophil cytosolic factor 2 | Ncf2 | −4.78 | 0.03 |
3. Experimental Section
3.1. Green Rooibos Extract
3.2. Chemicals
3.3. Total Polyphenol (TP) Content and Total Antioxidant Capacity (TAC) of GRE
3.4. Short-Term (28 Day) and Sub-Chronic (90 Day) Feeding Studies in Male Fischer 344 Rats
3.4.1. Animals and Diets
3.4.2. Experimental Design and Sample Collection
3.4.3. Serum Clinical Biochemical Parameters
3.4.4. Antioxidant Enzymes Assays
3.4.5. Glutathione Analysis
3.4.6. Lipid Peroxidation in Rat Liver Homogenates
3.5. Gene Expression of Antioxidant Defense and Oxidative Stress Related Genes
3.5.1. Extraction, Cleanup and Quality Assessment of Ribonucleic Acid (RNA)
3.5.2. cDNA Synthesis
3.5.3. Quantitative Real Time-PCR Array Analysis
3.5.4. Data Normalization and Analysis
3.6. Statistical Analysis
4. Conclusions
Acknowledgments
Author Contributions
Conflicts of Interest
References
- Chu, K.O.; Chan, S.-O.; Pang, C.P.; Wang, C.C. Pro-oxidative and antioxidative controls and signaling modification of polyphenolic phytochemicals: Contribution to health promotion and disease prevention? J. Agric. Food Chem. 2014, 62, 4026–4038. [Google Scholar] [CrossRef] [PubMed]
- Skibola, C.F.; Smith, M.T. Potential health impacts of excessive flavonoid intake. Free Radic. Biol. Med. 2000, 29, 375–383. [Google Scholar] [CrossRef]
- Valko, M.; Leibfritz, D.; Moncol, J.; Cronin, M.T.D.; Mazur, M.; Telser, J. Free radicals and antioxidants in normal physiological functions and human disease. Int. J. Biochem. Cell Biol. 2007, 39, 44–84. [Google Scholar] [CrossRef] [PubMed]
- Fang, Y.-Z.; Yang, S.; Wu, G. Free radicals, antioxidants, and nutrition. Nutrition 2002, 18, 872–879. [Google Scholar] [CrossRef]
- Halliwell, B. Dietary polyphenols: Good, bad, or indifferent for your health? Cardiovasc. Res. 2007, 73, 341–347. [Google Scholar] [CrossRef] [PubMed]
- Joubert, E.; de Beer, D. Rooibos (Aspalathus linearis) beyond the farm gate: From herbal tea to potential phytopharmaceutical. S. Afr. J. Bot. 2011, 77, 869–886. [Google Scholar] [CrossRef]
- Muller, C.J.F.; Joubert, E.; de Beer, D.; Sanderson, M.; Malherbe, C.J.; Fey, S.J.; Louw, J. Acute assessment of an aspalathin-enriched green rooibos (Aspalathus linearis) extract with hypoglycemic potential. Phytomedicine 2012, 20, 32–39. [Google Scholar] [CrossRef] [PubMed]
- Kamakura, R.; Son, M.; de Beer, D.; Joubert, E.; Miura, Y.; Yagasaki, K. Antidiabetic effect of green rooibos (Aspalathus linearis) extract in cultured cells and type 2 diabetic model KK-Ay mice. Cytotechnology 2015, 67, 699–710. [Google Scholar] [CrossRef] [PubMed]
- Kawano, A.; Nakamura, H.; Hata, S.-I.; Minakawa, M.; Miura, Y.; Yagasaki, K. Hypoglycemic effect of aspalathin, a rooibos tea component from Aspalathus linearis, in type 2 diabetic model db/db mice. Phytomedicine 2009, 16, 437–443. [Google Scholar] [CrossRef] [PubMed]
- Mazibuko, S.E.; Joubert, E.; Johnson, R.; Louw, J.; Opoku, A.R.; Muller, C.J.F. Aspalathin improves glucose and lipid metabolism in 3T3-L1 adipocytes exposed to palmitate. Mol. Nutr. Food Res. 2015, 59, 2199–2208. [Google Scholar] [CrossRef] [PubMed]
- Mazibuko, S.E.; Muller, C.J.F.; Joubert, E.; de Beer, D.; Johnson, R.; Opoku, A.R.; Louw, J. Amelioration of palmitate-induced insulin resistance in C2C12 muscle cells by rooibos (Aspalathus linearis). Phytomedicine 2013, 20, 813–819. [Google Scholar] [CrossRef] [PubMed]
- Son, M.; Minakawa, M.; Miura, Y.; Yagasaki, K. Aspalathin improves hyperglycemia and glucose intolerance in obese diabetic ob/ob mice. Eur. J. Nutr. 2013, 52, 1607–1619. [Google Scholar] [CrossRef] [PubMed]
- Isbrucker, R.A.; Edwards, J.A.; Wolz, E.; Davidovich, A.; Bausch, J. Safety studies on epigallocatechin gallate (EGCG) preparations. Part 2: Dermal, acute and short-term toxicity studies. Food Chem. Toxicol. 2006, 44, 636–650. [Google Scholar] [CrossRef] [PubMed]
- Lambert, J.D.; Kennett, M.J.; Sang, S.; Reuhl, K.R.; Ju, J.; Yang, C.S. Hepatotoxicity of high oral dose (−)-epigallocatechin-3-gallate in mice. Food Chem. Toxicol. 2010, 48, 409–416. [Google Scholar] [CrossRef] [PubMed]
- Bonkovsky, H.L. Hepatotoxicity associated with supplements containing Chinese green tea (Camellia sinensis). Ann. Intern. Med. 2006, 144, 68–71. [Google Scholar] [CrossRef] [PubMed]
- Finley, J.W.; Kong, A.-N.; Hintze, K.J.; Jeffery, E.H.; Ji, L.L.; Lei, X.G. Antioxidants in foods: State of the science important to the food industry. J. Agric. Food Chem. 2011, 59, 6837–6846. [Google Scholar] [CrossRef] [PubMed]
- Wright, T.M.; Vandenberg, A.M. Risperidone- and quetiapine-induced cholestasis. Ann. Pharmacother. 2007, 41, 1518–1523. [Google Scholar] [CrossRef] [PubMed]
- Ozer, J.; Ratner, M.; Shaw, M.; Bailey, W.; Schomaker, S. The current state of serum biomarkers of hepatotoxicity. Toxicology 2008, 245, 194–205. [Google Scholar] [CrossRef] [PubMed]
- Banning, A.; Deubel, S.; Kluth, D.; Zhou, Z.; Brigelius-Flohé, R. The GI-GPx gene is a target for Nrf2. Mol. Cell. Biol. 2005, 25, 4914–4923. [Google Scholar] [CrossRef] [PubMed]
- Brigelius-Flohé, R.; Kipp, A. Glutathione peroxidases in different stages of carcinogenesis. Biochim. Biophys. Acta Gen. Subj. 2009, 1790, 1555–1568. [Google Scholar] [CrossRef] [PubMed]
- Seminotti, B.; Leipnitz, G.; Amaral, A.U.; Fernandes, C.G.; Silva, L.D.B.D.; Tonin, A.M.; Vargas, C.R.; Wajner, M. Lysine induces lipid and protein damage and decreases reduced glutathione concentrations in brain of young rats. Int. J. Dev. Neurosci. 2008, 26, 693–698. [Google Scholar] [CrossRef] [PubMed]
- Galati, G.; Chan, T.; Wu, B.; O’Brien, P.J. Glutathione-dependent generation of reactive oxygen species by the peroxidase-catalyzed redox cycling of flavonoids. Chem. Res. Toxicol. 1999, 12, 521–525. [Google Scholar] [CrossRef] [PubMed]
- Galati, G.; Lin, A.; Sultan, A.M.; O’Brien, P.J. Cellular and in vivo hepatotoxicity caused by green tea phenolic acids and catechins. Free Radic. Biol. Med. 2006, 40, 570–580. [Google Scholar] [CrossRef] [PubMed]
- Galati, G.; Sabzevari, O.; Wilson, J.X.; O’Brien, P.J. Prooxidant activity and cellular effects of the phenoxyl radicals of dietary flavonoids and other polyphenolics. Toxicology 2002, 177, 91–104. [Google Scholar] [CrossRef]
- Rietjens, I.M.C.M.; Boersma, M.G.; Haan, L.D.; Spenkelink, B.; Awad, H.M.; Cnubben, N.H.P.; van Zanden, J.J.; Woude, H.V.D.; Alink, G.M.; Koeman, J.H. The pro-oxidant chemistry of the natural antioxidants vitamin C, vitamin E, carotenoids and flavonoids. Environ. Toxicol. Pharmacol. 2002, 11, 321–333. [Google Scholar] [CrossRef]
- Kachadourian, R.; Day, B.J. Flavonoid-induced glutathione depletion: Potential implications for cancer treatment. Free Radic. Biol. Med. 2006, 41, 65–76. [Google Scholar] [CrossRef] [PubMed]
- Halliwell, B. Are polyphenols antioxidants or pro-oxidants? What do we learn from cell culture and in vivo studies? Arch. Biochem. Biophys. 2008, 476, 107–112. [Google Scholar] [CrossRef] [PubMed]
- Joubert, E.; Winterton, P.; Britz, T.J.; Gelderblom, W.C.A. Antioxidant and pro-oxidant activities of aqueous extracts and crude polyphenolic fractions of rooibos (Aspalathus linearis). J. Agric. Food Chem. 2005, 53, 10260–10267. [Google Scholar] [CrossRef] [PubMed]
- Drummond, G.R.; Selemidis, S.; Griendling, K.K.; Sobey, C.G. Combating oxidative stress in vascular disease: NADPH oxidases as therapeutic targets. Nat. Rev. Drug Discov. 2011, 10, 453–471. [Google Scholar] [CrossRef] [PubMed]
- Selemidis, S.; Sobey, C.G.; Wingler, K.; Schmidt, H.H.H.W.; Drummond, G.R. NADPH oxidases in the vasculature: Molecular features, roles in disease and pharmacological inhibition. Pharmacol. Ther. 2008, 120, 254–291. [Google Scholar] [CrossRef] [PubMed]
- Chan, E.C.; Jiang, F.; Peshavariya, H.M.; Dusting, G.J. Regulation of cell proliferation by NADPH oxidase-mediated signaling: Potential roles in tissue repair, regenerative medicine and tissue engineering. Pharmacol. Ther. 2009, 122, 97–108. [Google Scholar] [CrossRef] [PubMed]
- Koh, H.-J.; Lee, S.-M.; Son, B.-G.; Lee, S.-H.; Ryoo, Z.Y.; Chang, K.-T.; Park, J.-W.; Park, D.-C.; Song, B.J.; Veech, R.L.; et al. Cytosolic NADP+-dependent isocitrate dehydrogenase plays a key role in lipid metabolism. J. Biol. Chem. 2004, 279, 39968–39974. [Google Scholar] [CrossRef] [PubMed]
- Issa, M.H.; Cerda, A.; Genvigir, F.D.V.; Cavalli, S.A.; Bertolami, M.C.; Faludi, A.A.; Hirata, M.H.; Hirata, R.D.C. Atorvastatin and hormone therapy effects on APOE mRNA expression in hypercholesterolemic postmenopausal women. J. Steroid Biochem. Mol. Biol. 2012, 128, 139–144. [Google Scholar] [CrossRef] [PubMed]
- Reitman, Z.J.; Parsons, D.W.; Yan, H. IDH1 and IDH2: Not your typical oncogenes. Cancer Cell 2010, 17, 215–216. [Google Scholar] [CrossRef] [PubMed]
- Shechter, I.; Dai, P.; Huo, L.; Guan, G. IDH1 gene transcription is sterol regulated and activated by SREBP-1a and SREBP-2 in human hepatoma HepG2 cells: Evidence that IDH1 may regulate lipogenesis in hepatic cells. J. Lipid Res. 2003, 44, 2169–2180. [Google Scholar] [CrossRef] [PubMed]
- Marnewick, J.L.; Rautenbach, F.; Venter, I.; Neethling, H.; Blackhurst, D.M.; Wolmarans, P.; Macharia, M. Effects of rooibos (Aspalathus linearis) on oxidative stress and biochemical parameters in adults at risk for cardiovascular disease. J. Ethnopharmacol. 2011, 133, 46–52. [Google Scholar] [CrossRef] [PubMed]
- Strassburg, A.; Strassburg, C.P.; Manns, M.P.; Tukey, R.H. Differential gene expression of NAD(P)H:quinone oxidoreductase and NRH:quinone oxidoreductase in human hepatocellular and biliary tissue. Mol. Pharmacol. 2002, 61, 320–325. [Google Scholar] [CrossRef] [PubMed]
- Lin, X.; Yang, H.; Zhou, L.; Guo, Z. Nrf2-dependent induction of NQO1 in mouse aortic endothelial cells overexpressing catalase. Free Radic. Biol. Med. 2011, 51, 97–106. [Google Scholar] [CrossRef] [PubMed]
- Nioi, P.; McMahon, M.; Itoh, K.; Yamamoto, M.; Hayes, J.D. Identification of a novel Nrf2-regulated antioxidant response element (ARE) in the mouse NAD(P)H:quinone oxidoreductase 1 gene: Reassessment of the ARE consensus sequence. Biochem. J. 2003, 374, 337–348. [Google Scholar] [CrossRef] [PubMed]
- Lim, J.; Park, H.-S.; Choi, J.-K.; Lee, I.-S.; Choi, H. Isoorientin induces Nrf2 pathway-driven antioxidant response through phosphatidylinositol 3-kinase signaling. Arch. Pharm. Ress 2007, 30, 1590–1598. [Google Scholar] [CrossRef]
- Joubert, E.; Richards, E.S.; van der Merwe, J.D.; de Beer, D.; Manley, M.; Gelderblom, W.C.A. Effect of species variation and processing on phenolic composition and in vitro antioxidant activity of aqueous extracts of Cyclopia spp. (honeybush tea). J. Agric. Food Chem. 2008, 56, 954–963. [Google Scholar] [CrossRef] [PubMed]
- De Beer, D.; Joubert, E.; Malherbe, C.J.; Brand, D.J. Use of countercurrent chromatography during isolation of 6-hydroxyluteolin-7-O-β-glucoside, a major antioxidant of Athrixia phylicoides. J. Chromatogr. A 2011, 1218, 6179–6186. [Google Scholar] [CrossRef] [PubMed]
- Snijman, P.W.; Joubert, E.; Ferreira, D.; Li, X.-C.; Ding, Y.; Green, I.R.; Gelderblom, W.C.A. Antioxidant activity of the dihydrochalcones aspalathin and nothofagin and their corresponding flavones in relation to other rooibos (Aspalathus linearis) flavonoids, epigallocatechin gallate, and Trolox. J. Agric. Food Chem. 2009, 57, 6678–6684. [Google Scholar] [CrossRef] [PubMed]
- Marnewick, J.L.; Joubert, E.; Swart, P.; van der Westhuizen, F.; Gelderblom, W.C. Modulation of hepatic drug metabolizing enzymes and oxidative status by rooibos (Aspalathus linearis) and honeybush (Cyclopia intermedia), green and black (Camellia sinensis) teas in rats. J. Agric. Food Chem. 2003, 51, 8113–8119. [Google Scholar] [CrossRef] [PubMed]
- Marnewick, J.L.; van der Westhuizen, F.H.; Joubert, E.; Swanevelder, S.; Swart, P.; Gelderblom, W.C.A. Chemoprotective properties of rooibos (Aspalathus linearis), honeybush (Cyclopia intermedia) herbal and green and black (Camellia sinensis) teas against cancer promotion induced by fumonisin B1 in rat liver. Food Chem. Toxicol. 2009, 47, 220–229. [Google Scholar] [CrossRef] [PubMed]
- Kim, E.-Y.; Ham, S.-K.; Shigenaga, M.K.; Han, O. Bioactive dietary polyphenolic compounds reduce nonheme iron transport across human intestinal cell monolayers. J. Nutr. 2008, 138, 1647–1651. [Google Scholar] [PubMed]
- Breet, P.; Kruger, H.S.; Jerling, J.C.; Oosthuizen, W. Actions of black tea and rooibos on iron status of primary school children. Nutr. Res. 2005, 25, 983–994. [Google Scholar] [CrossRef]
- Hesseling, P.B.; Klopper, J.F.; van Heerden, P.D.R. The effect of rooibos tea on iron absorption [Afrikaans]. S. Afr. Med. J. 1979, 55, 631–632. [Google Scholar] [PubMed]
- Joubert, E.; Beelders, T.; de Beer, D.; Malherbe, C.J.; de Villiers, A.J.; Sigge, G.O. Variation in phenolic content and antioxidant activity of fermented rooibos herbal tea infusions: Role of production season and quality grade. J. Agric. Food Chem. 2012, 60, 9171–9179. [Google Scholar] [CrossRef] [PubMed]
- Reagan-Shaw, S.; Nihal, M.; Ahmad, N. Dose translation from animal to human studies revisited. FASEB J. 2008, 22, 659–661. [Google Scholar] [CrossRef] [PubMed]
- Arthur, H.; Joubert, E.; de Beer, D.; Malherbe, C.J.; Witthuhn, R.C. Phenylethanoid glycosides as major antioxidants in Lippia multiflora herbal infusion and their stability during steam pasteurisation of plant material. Food Chem. 2011, 127, 581–588. [Google Scholar] [CrossRef] [PubMed]
- Huang, D.; Ou, B.; Hampsch-Woodill, M.; Flanagan, J.A.; Prior, R.L. High-throughput assay of Oxygen Radical Absorbance Capacity (ORAC) using a multichannel liquid handling system coupled with a microplate fluorescence reader in 96-well format. J. Agric. Food Chem. 2002, 50, 4437–4444. [Google Scholar] [CrossRef] [PubMed]
- Chan, P.C.; Ramot, Y.; Malarkey, D.E.; Blackshear, P.; Kissling, G.E.; Travlos, G.; Nyska, A. Fourteen-week toxicity study of green tea extract in rats and mice. Toxicol. Pathol. 2010, 38, 1070–1084. [Google Scholar] [CrossRef] [PubMed]
- Mayer, P.R. Absorption, metabolism, and other factors that influence drug exposure in toxicology studies. Toxicol. Pathol. 1995, 23, 165–169. [Google Scholar] [CrossRef] [PubMed]
- Kaushal, V.; Barnes, L.D. Effect of zwitterionic buffers on measurement of small masses of protein with bicinchoninic acid. Anal. Biochem. 1986, 157, 291–294. [Google Scholar] [CrossRef]
- Aebi, H. Catalase in vitro. Methods Enzymol. 1984, 105, 121–126. [Google Scholar] [PubMed]
- Ellerby, L.M.; Bredesen, D.E. Measurement of cellular oxidation, reactive oxygen species, and antioxidant enzymes during apoptosis. Methods Enzymol. 2000, 322, 413–421. [Google Scholar] [PubMed]
- Akerboom, T.P.M.; Sies, H. Assay of glutathione, glutathione disulfide, and glutathione mixed disulfides in biological samples. Methods Enzymol. 1981, 77, 373–382. [Google Scholar] [PubMed]
- Markwell, M.A.K.; Haas, S.M.; Bieber, L.L.; Tolbert, N.E. A modification of the Lowry procedure to simplify protein determination in membrane and lipoprotein samples. Anal. Biochem. 1978, 87, 206–210. [Google Scholar] [CrossRef]
- Abel, S.; de Kock, M.; Smuts, C.M.; de Villiers, C.; Swanevelder, S.; Gelderblom, W.C.A. Dietary modulation of fatty acid profiles and oxidative status of rat hepatocyte nodules: Effect of different n-6/n-3 fatty acid ratios. Lipids 2004, 39, 963–976. [Google Scholar] [CrossRef] [PubMed]
- Hu, M.-L.; Frankel, E.N.; Leibovitz, B.E.; Tappel, A.L. Effect of dietary lipids and vitamin E on in vitro lipid peroxidation in rat liver and kidney homogenates. J. Nutr. 1989, 119, 1574–1582. [Google Scholar] [PubMed]
- Buege, J.A.; Aust, S.D. Microsomal lipid peroxidation. Methods Enzymol. 1978, 52, 302–310. [Google Scholar] [PubMed]
- Sample Availability: Samples of the compounds are commercially available and therefore not available from the authors.
© 2015 by the authors. Licensee MDPI, Basel, Switzerland. This article is an open access article distributed under the terms and conditions of the Creative Commons by Attribution (CC-BY) license ( http://creativecommons.org/licenses/by/4.0/).
Share and Cite
Van der Merwe, J.D.; De Beer, D.; Joubert, E.; Gelderblom, W.C.A. Short-Term and Sub-Chronic Dietary Exposure to Aspalathin-Enriched Green Rooibos (Aspalathus linearis) Extract Affects Rat Liver Function and Antioxidant Status. Molecules 2015, 20, 22674-22690. https://doi.org/10.3390/molecules201219868
Van der Merwe JD, De Beer D, Joubert E, Gelderblom WCA. Short-Term and Sub-Chronic Dietary Exposure to Aspalathin-Enriched Green Rooibos (Aspalathus linearis) Extract Affects Rat Liver Function and Antioxidant Status. Molecules. 2015; 20(12):22674-22690. https://doi.org/10.3390/molecules201219868
Chicago/Turabian StyleVan der Merwe, Johanna Debora, Dalene De Beer, Elizabeth Joubert, and Wentzel C. A. Gelderblom. 2015. "Short-Term and Sub-Chronic Dietary Exposure to Aspalathin-Enriched Green Rooibos (Aspalathus linearis) Extract Affects Rat Liver Function and Antioxidant Status" Molecules 20, no. 12: 22674-22690. https://doi.org/10.3390/molecules201219868