Article

Simultaneous Determination of Eight Ginsenosides in Rat Plasma by Liquid Chromatography–Electrospray Ionization Tandem Mass Spectrometry: Application to Their Pharmacokinetics

State Key Laboratory of Natural and Biomimetic Drugs, Department of Natural Medicines, School of Pharmaceutical Sciences, Peking University Health Science Center, Peking University, No. 38, Xueyuan Road, Haidian District, Beijing 100191, China
*
Author to whom correspondence should be addressed.
Molecules 2015, 20(12), 21597-21608; https://doi.org/10.3390/molecules201219790
Submission received: 31 October 2015 / Revised: 26 November 2015 / Accepted: 27 November 2015 / Published: 3 December 2015
(This article belongs to the Section Natural Products Chemistry)

Abstract

:
A high-performance liquid chromatography–electrospray ionization tandem mass spectrometry (LC-ESI-MS/MS) method was successfully developed and validated for the identification and determination of eight ginsenosides: ginsenoside Rg1 (1); 20(S)-ginsenoside Rh1 (2); 20(S)-ginsenoside Rg2 (3); 20(R)-ginsenoside Rh1 (4); 20(R)-ginsenoside Rg2 (5); ginsenoside Rd (6); 20(S)-ginsenoside Rg3 (7); and 20(R)-ginsenoside Rg3 (8) in rat plasma. The established rapid method had high linearity, selectivity, sensitivity, accuracy, and precision. The method has been used successfully to study the pharmacokinetics of abovementioned eight ginsenosides for the first time. After an oral administration of total saponins in the stems-leaves of Panax ginseng C. A. Meyer (GTSSL) at a dose of 400 mg/kg, the ginsenosides 6, 7, and 8, belonging to protopanaxadiol-type saponins, exhibited relatively long tmax values, suggesting that they were slowly absorbed, while the ginsenosides 15, belonging to protopanaxatriol-type saponins, had different tmax values, which should be due to their differences in the substituted groups. Compounds 2 and 4, 3 and 5, 7 and 8 were three pairs of R/S epimerics at C-20, which was interesting that the t1/2 of 20(S)-epimers were always longer than those of 20(R)-epimers. This pharmacokinetic identification of multiple ginsenosides of GTSSL in rat plasma provides a significant basis for better understanding the clinical application of GTSSL.

1. Introduction

Panax ginseng C. A. Meyer has been used as a medicinal plant in China for thousands of years to enhance stamina and capacity to cope with fatigue and physical stress. Current worldwide use has been diverse because of the molecular diversity in the chemical ingredients of P. ginseng, with mainly focused study on prevention and treatment of cardiovascular and cerebrovascular diseases. There are active chemical components called ginseng saponins (ginsenosides) in P. ginseng, which has been reported to be responsible for the ginseng’s medicinal properties [1]. A lot of studies on ginsenosides have mainly focused on the roots and rhizomes of P. ginseng because the aerial parts, including the stems and leaves, are usually discarded. In recent years, we conducted exploratory research on the chemical ingredients in the stems-leaves of P. ginseng harvested annually, and demonstrated that composition of total saponins in the stems and leaves of P. ginseng (GTSSL) [2,3,4,5] is not different from those of the roots and rhizomes of P. ginseng [6,7]. GTSSL contained ginsenoside in the chemical structure, such as ginsenosides Rh1 and Rg3, and is currently investigated as an anti-aging agent at the preclinical research stage. During the last decade, absorption, distribution, metabolism, excretion, and toxicity (ADMET) have been introduced into the earlier stages of drug discoveries instead of a serial of strategy, because ADMET and pharmacokinetic (PK) issues are partly responsible for failure in clinical trials. Although PK characteristics of individual 20(R)- and 20(S)-ginsenosides Rg2, which are the main ingredients in the GTSSL extract, has been reported after the intravenous dose to rats [8], there has been no any literature reporting PK behaviors of multiple ginsenosides in the GTSSL extract. It is therefore important to investigate PK characteristics of the main active components in GTSSL. The main purpose of this subject is to establish and validate a rapid, accurate, precise, sensitive, and selective high-performance liquid chromatography/electrospray ionization tandem mass spectrometer (LC-ESI-MS/MS) for the identification and quantification of the main active ginsenosides of GTSSL in rat plasma including ginsenoside Rg1 (1) [9,10,11,12], 20(S)-ginsenoside Rh1 (2) [13,14,15,16,17], 20(S)-ginsenoside Rg2 (3) [12,18,19,20], 20(R)-ginsenoside Rh1 (4), 20(R)-ginsenoside Rg2 (5) [18], ginsenoside Rd (6) [21,22,23], 20(S)-ginsenoside Rg3 (7) [12,24,25,26], and 20(R)-ginsenoside Rg3 (8) [27,28]. Their chemical structures are shown in Figure 1. The PK profiles of the eight ginsenosides could be revealed after an oral administration of GTSSL at a single dose of 400 mg/kg to rats based on the developed method. To our knowledge, it is the first study on the detailed PK characterizations of the less-polar eight main ginsenosides with diverse biological and pharmacological activities in GTSSL in rat plasma. It has been well known that the efficacy of ginsenoside increases with the extent of less-polar molecules or deglycosylation, which enhances its hydrophobicity and ability to permeate the cell wall.
Figure 1. Chemical structures of eight ginsenosides (1, ginsenoside Rg1; 2, 20(S)-ginsenoside Rh1; 3, 20(S)-ginsenoside Rg2; 4, 20(R)-ginsenoside Rh1; 5, 20(R)-ginsenoside Rg2; 6, ginsenoside Rd; 7, 20(S)-ginsenoside Rg3; 8, 20(R)-ginsenoside Rg3) and I.S. (digoxin).
Molecules 20 19790 g001

2. Results and Discussion

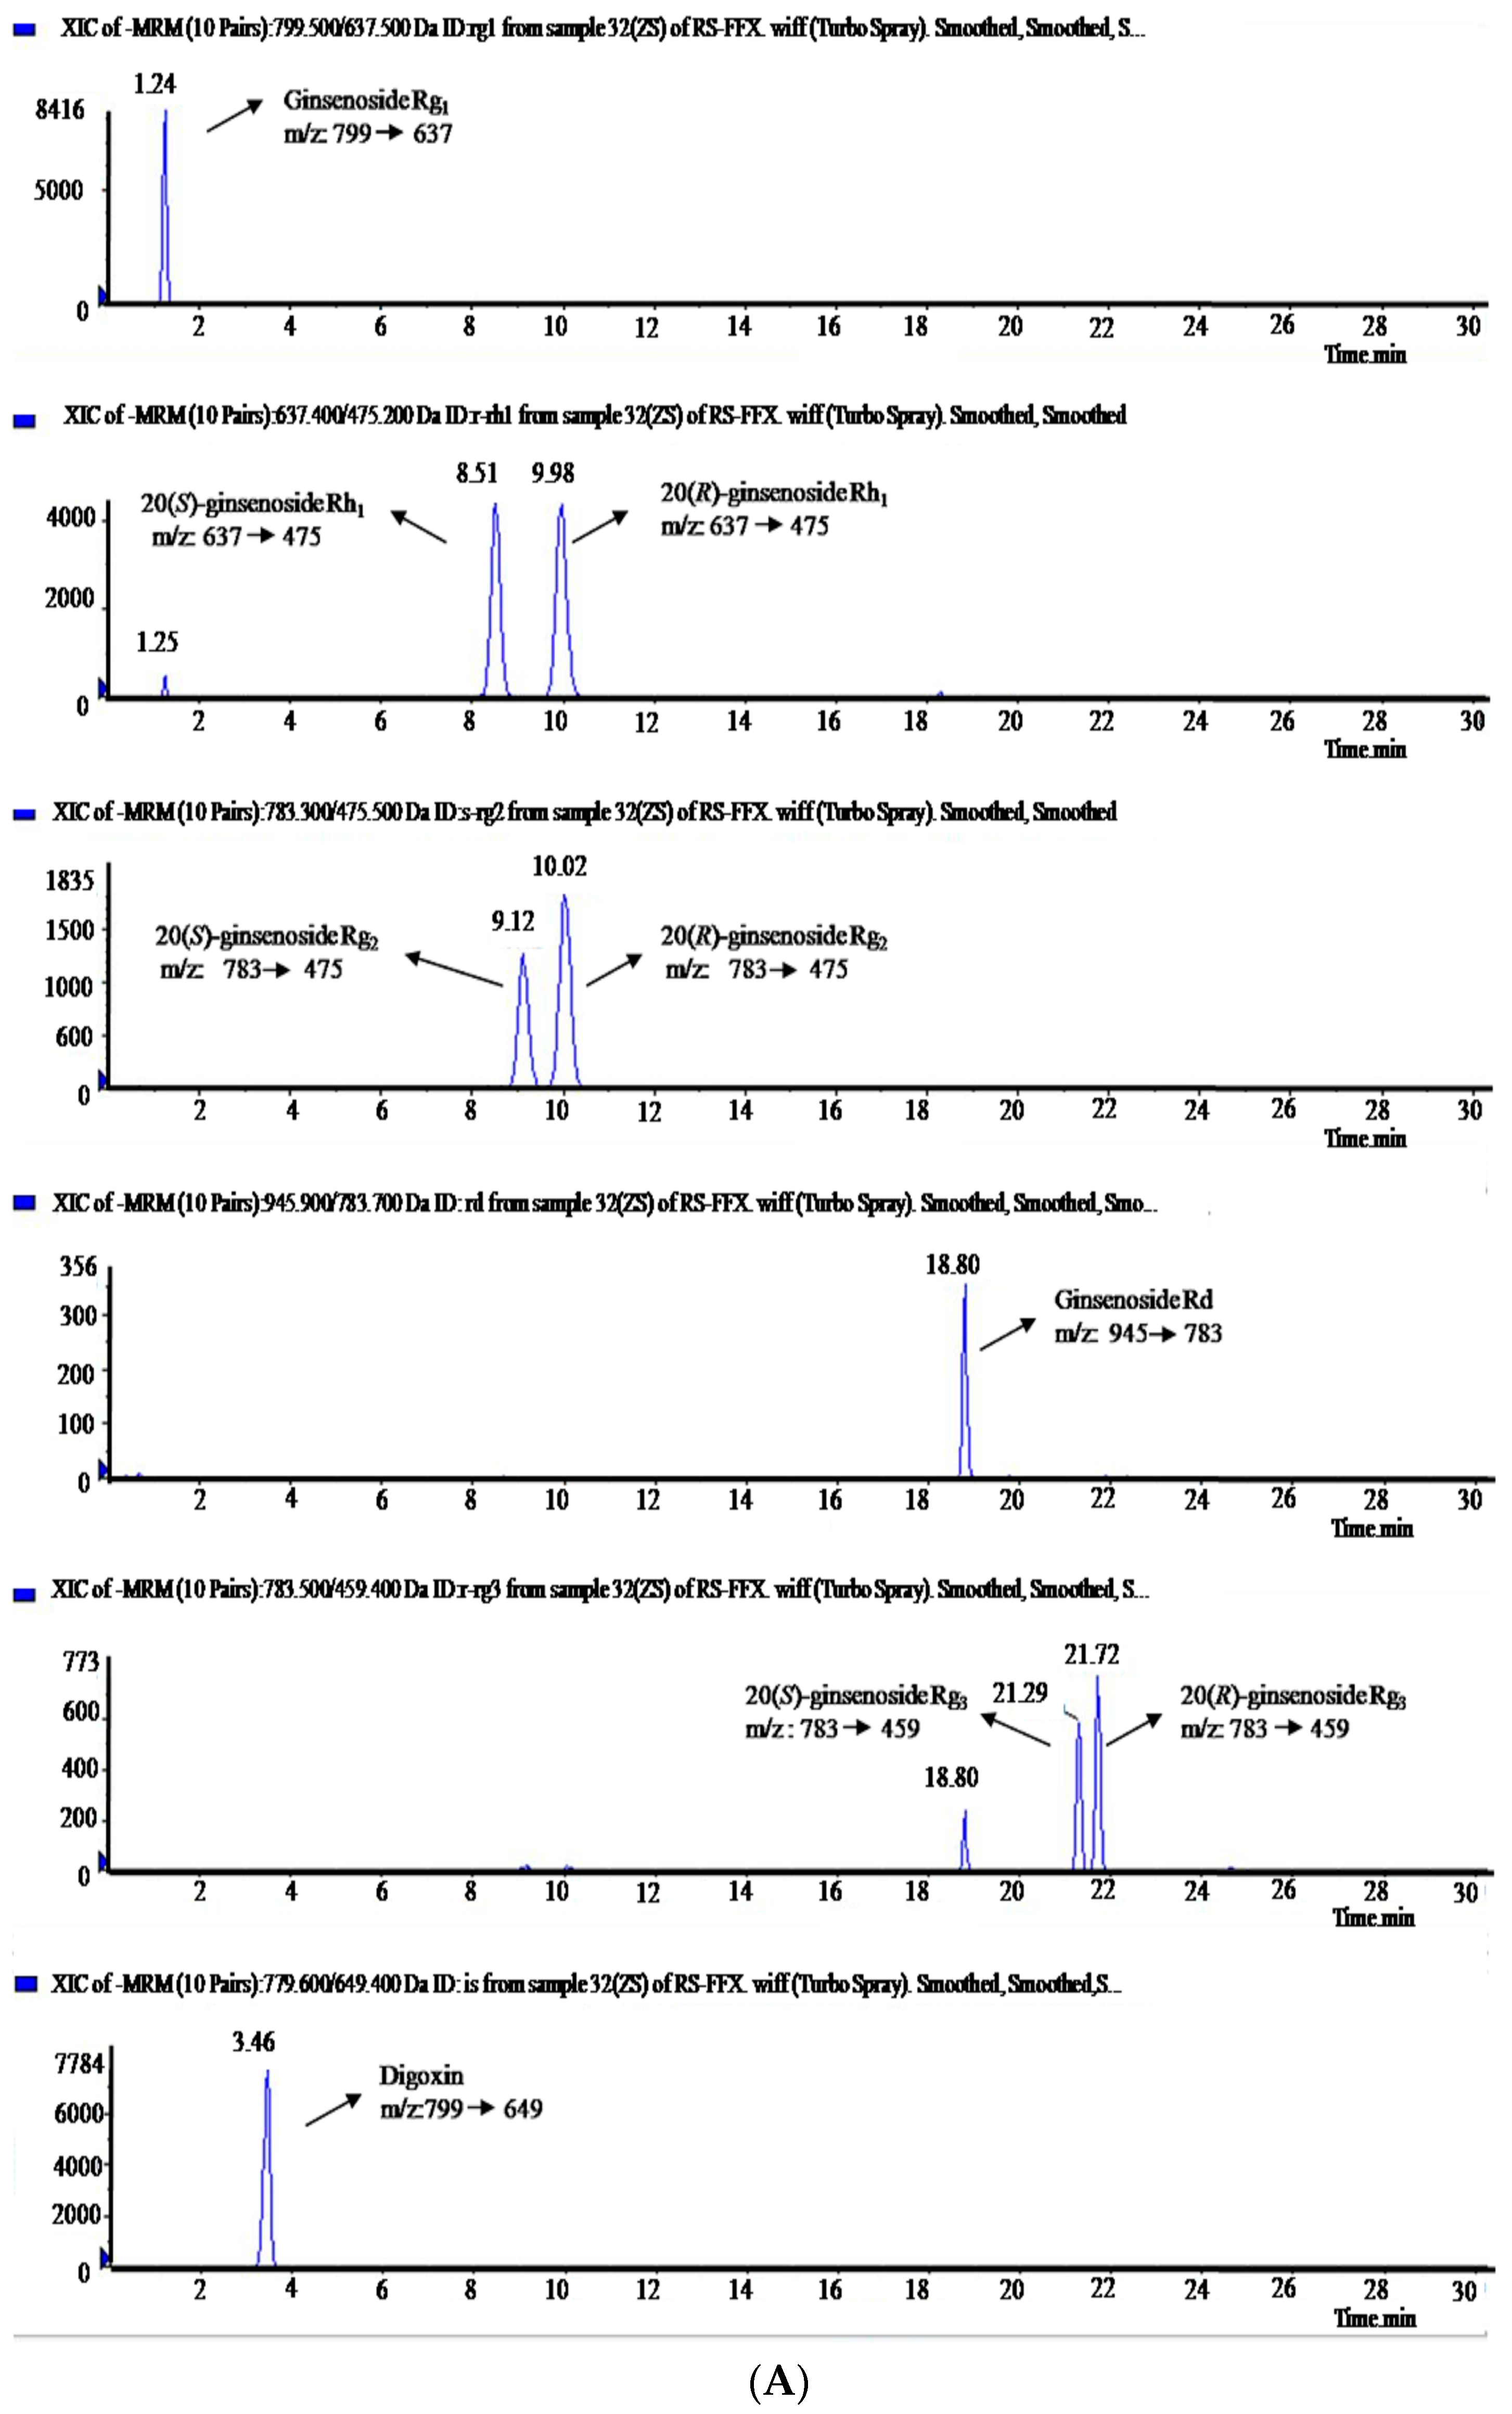
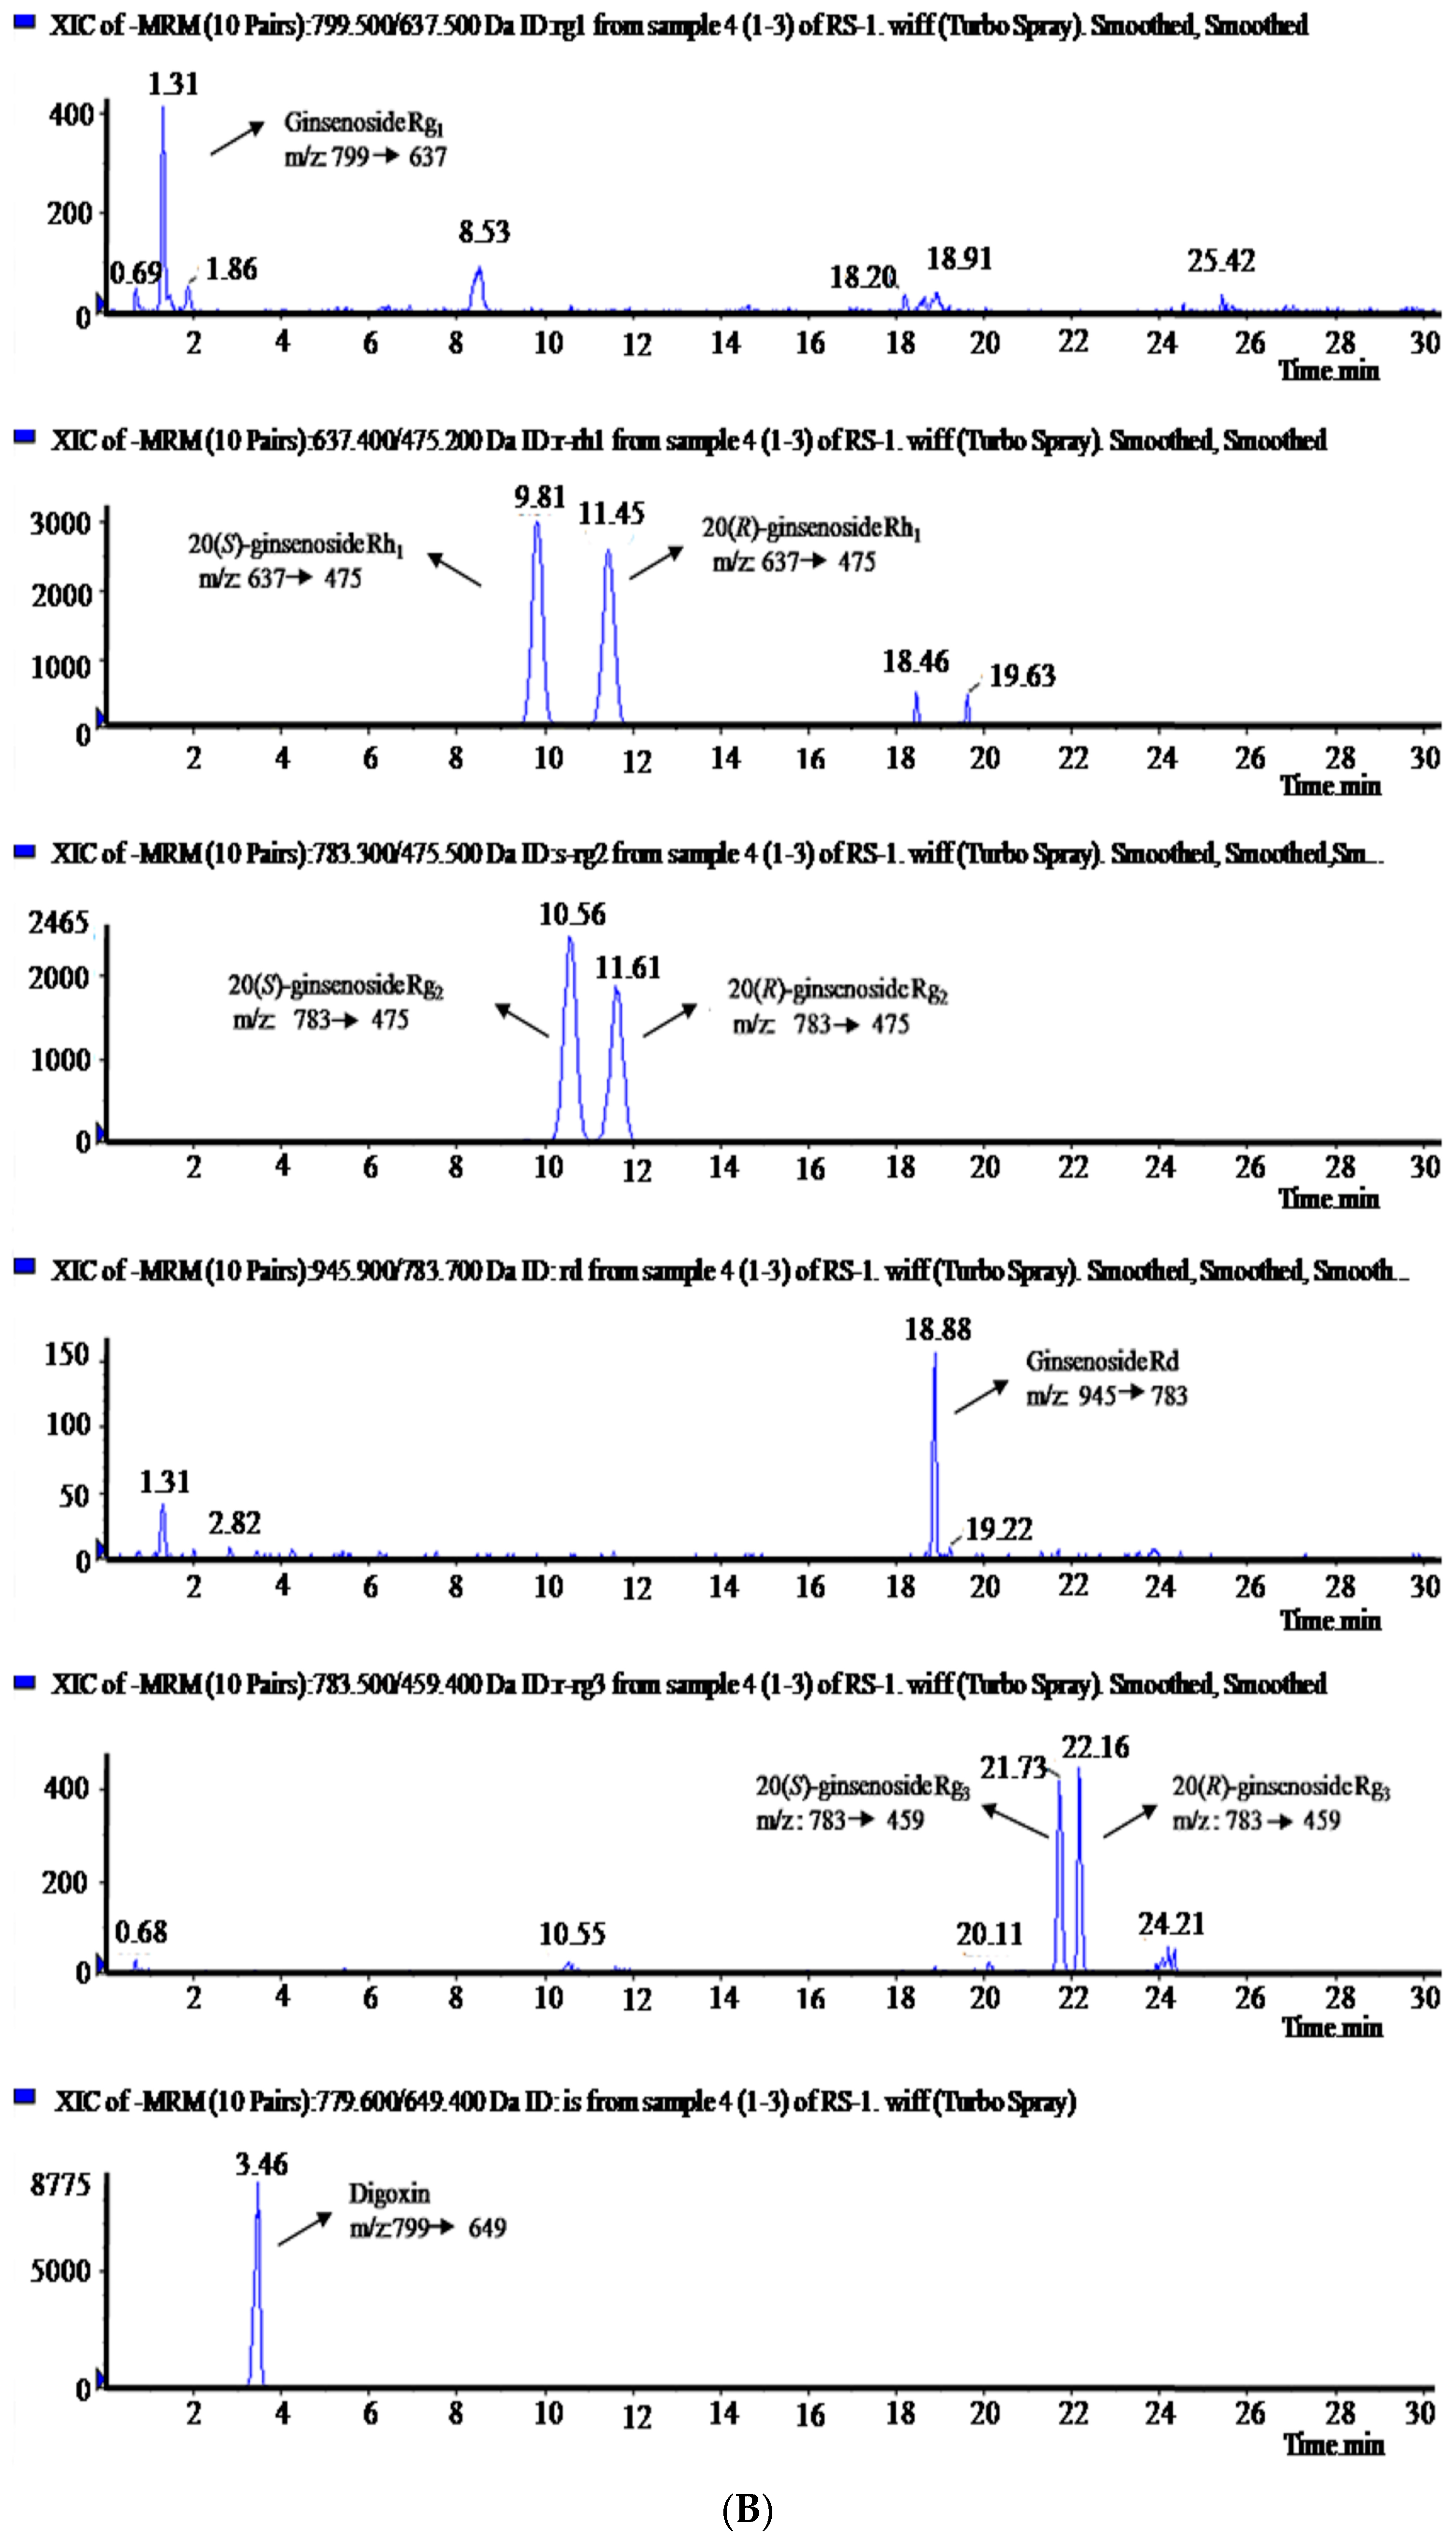
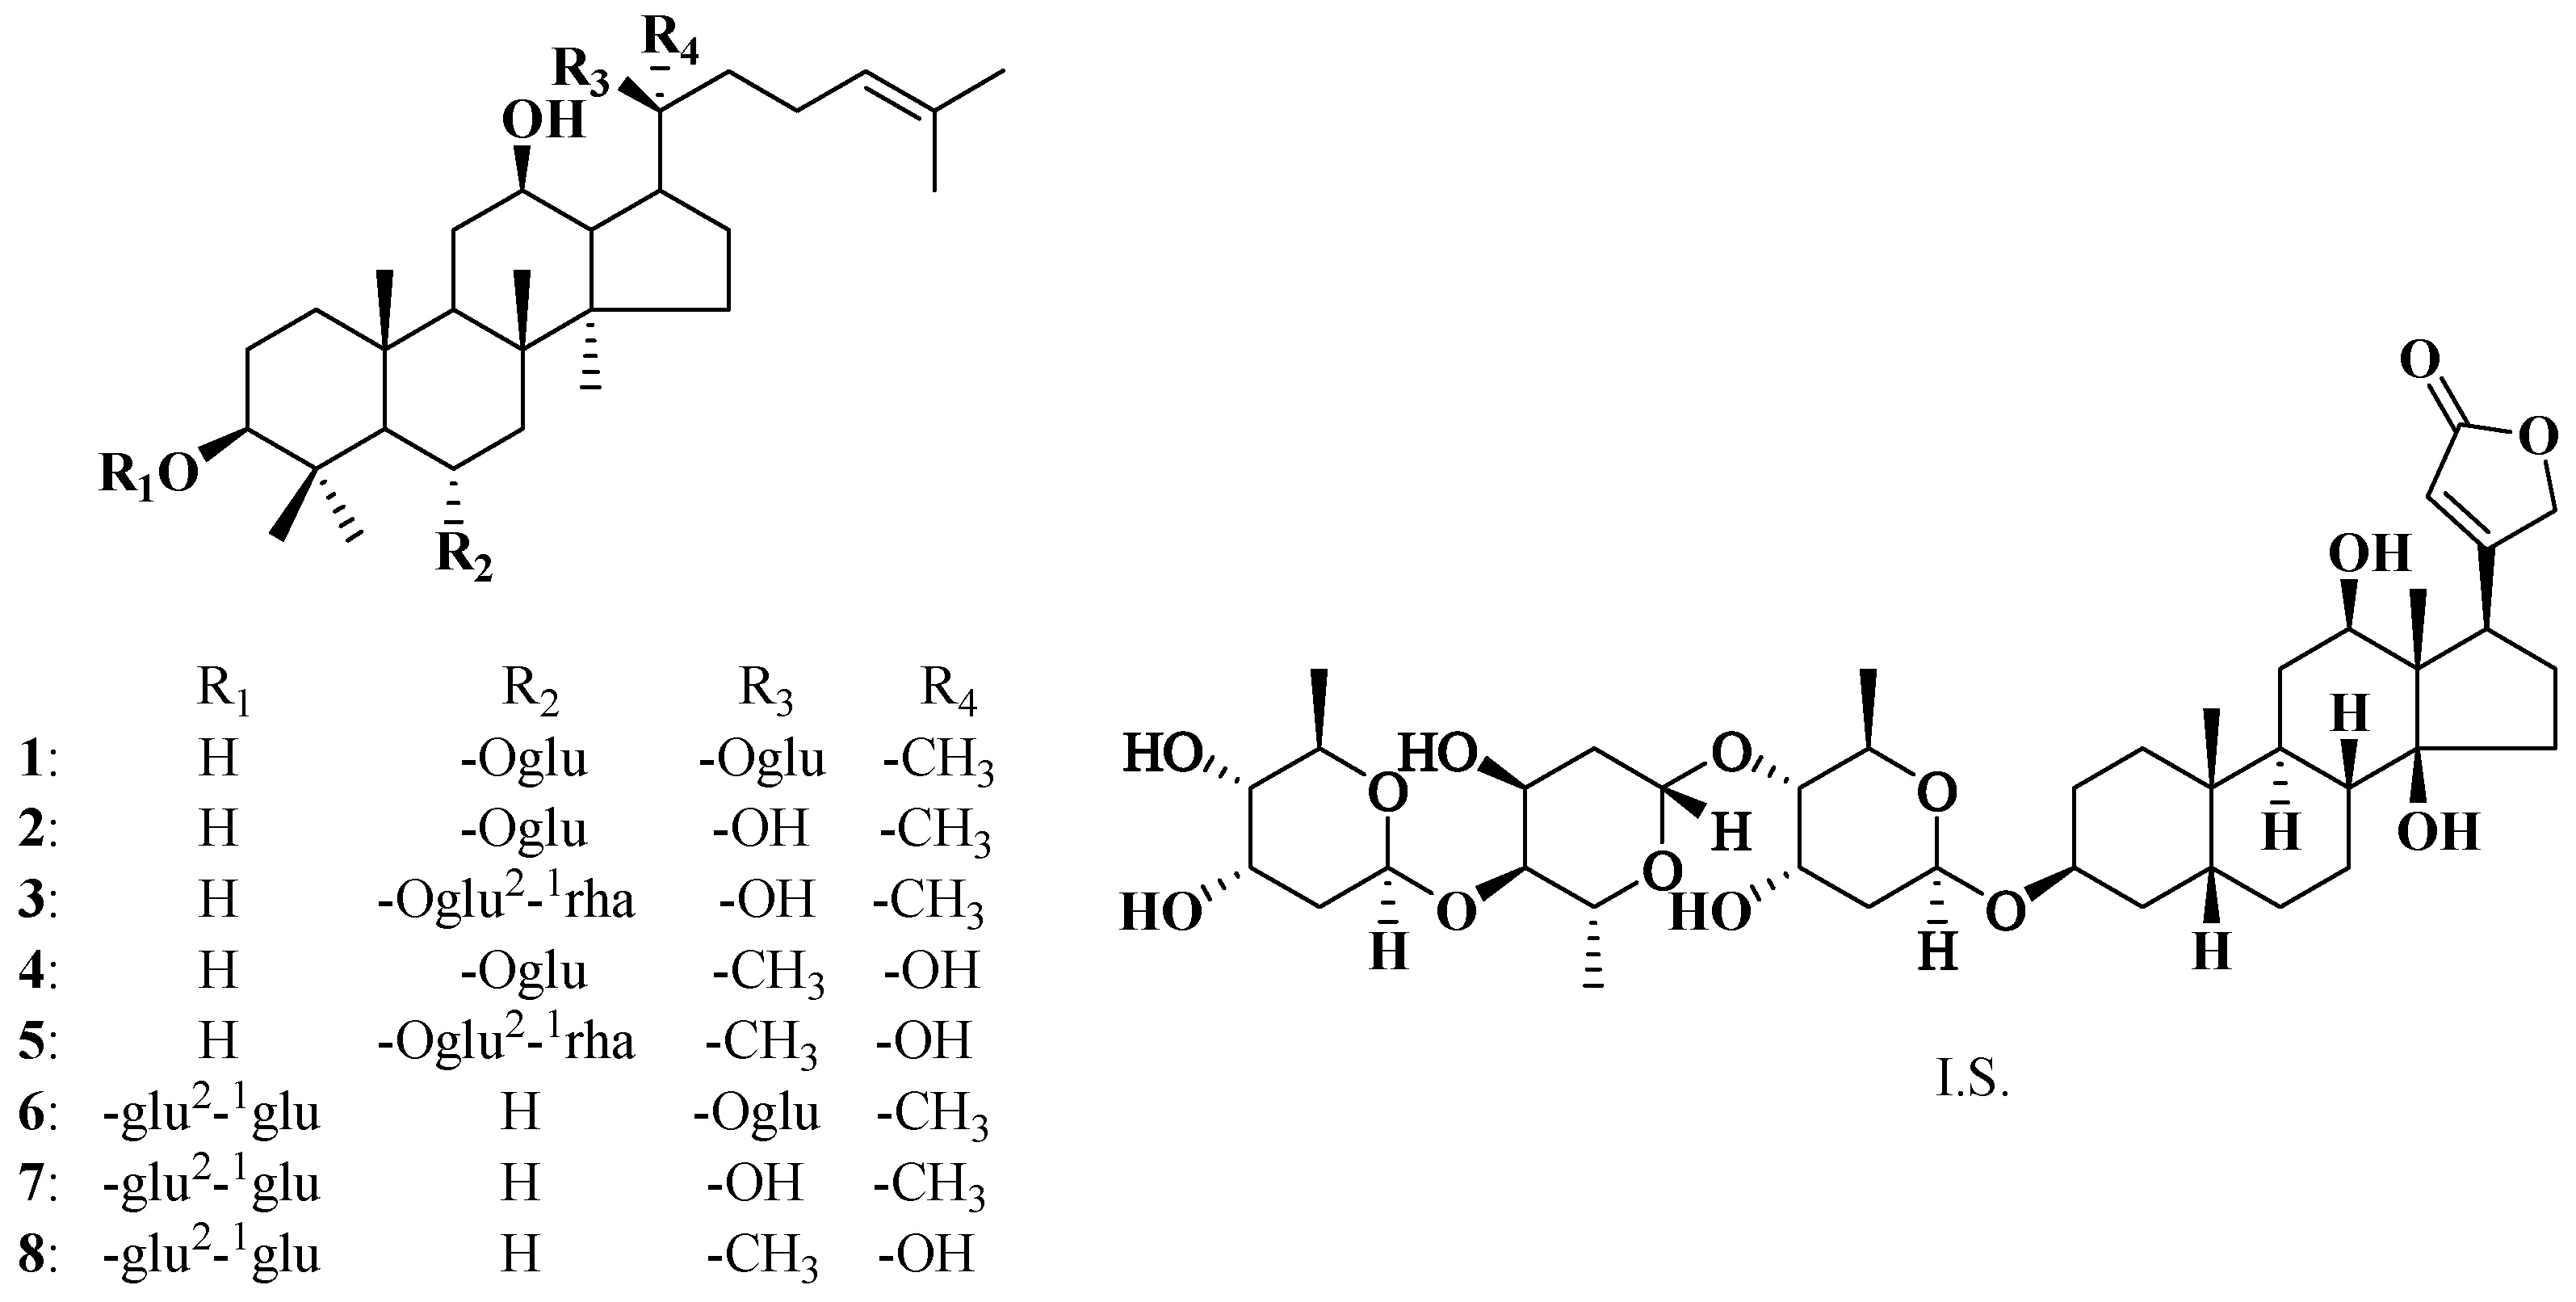
2.1. Identification and Determination of Ginsenosides in Rat Plasma

The extracted ionic currents (XIC) of the eight ginsenosides and digoxin as an internal standard (I.S.) on the reference standard, as well as in rat plasma, are shown in Figure 2A,B. For the XIC of blank rat plasma see Supplementary Materials, Figure S1. Mass spectral and tandem mass spectral measurements of the ginsenosides and I.S. were performed with these standard solutions by infusion. The eight standard ginsenosides were detected in both positive and negative ion modes. Since ginsenosides had not only higher sensitivity but also clearer mass spectra in the negative ion mode, data monitored in negative ion mode were used for the component detection and characterization, which made it easier to detect ginsenosides of lower content and confirm molecular ions or quasi-molecular ions in the identification of each peak. Deprotonated ions [M − H] at m/z 799 for 1, 637 for 2 and 4, 783 for 3 and 5, 945 for 6, 783 for 7 and 8, and 779 for I.S., which showed up as base peaks in mass spectra, were selected as the precursor ions. The selection of product ions was accomplished by utilizing the “Quantitative Optimization” function of Analyst software. The product ions at m/z 637 [M − glucosyl (glu) − H] for 1, 475 [M − glu − H] for 2 and 4, 475 [M − rhamnosyl (rha) − glu − H] for 3 and 5, 783 [M − glu − H] for 6, 459 [M − 2glu − H] for 7 and 8, and 649 [M − digitoxosyl − H] for I.S., were automatically selected at the highest peak intensity in tandem mass spectra.
Figure 2. The extracted ionic currents: (A) blank plasma spiked with the eight ginsenoside standards and I.S. (digoxin); and (B) the plasma sample at 1 h after oral administration of 400 mg/kg GTSSL to rats spiked with I.S.
Molecules 20 19790 g002aMolecules 20 19790 g002b

2.2. Method Validation

2.2.1. Selectivity and Linearity

From XICs of blank plasma spiked with analytes (A) and the plasma sample at 1 h after oral administration of 400 mg/kg GTSSL to rats spiked with I.S. (B) shown in Figure 2, and the XIC of blank plasma shown in Figure S1 (see Supplementary Materials section), it was indicated that there is no interfering peak in blank plasma under the assay conditions. The retention times (RT), the calibration curve, correlation coefficient (r2), linear range, lower limit of detection (LLOD), and lower limit of quantification (LLOQ) of each analyte were shown in Table 1. The RT of I.S. was 3.46 min. Each analyte displayed good linearity.
Table 1. Calibration curves, LLODs, and LLOQs for eight ginsenosides.
AnalyteRT (min)Calibration Curve aCorrelation Coefficient (r2)Linear Range (ng/mL)LLOD (ng/mL)LLOQ (ng/mL)
11.24y = 0.0101x + 0.00320.99350.45–126.600.120.45
28.51y = 0.0122x + 0.03620.99090.30–85.540.070.30
39.12y = 0.0028x + 0.01270.99430.45–129.600.120.45
49.98y = 0.0105x + 0.04870.99590.21–59.620.050.21
510.02y = 0.006x + 0.04090.99030.34–98.500.080.34
618.80y = 0.0036x + 0.0050.99210.95–182.400.270.95
721.29y = 0.0008x + 0.00220.99800.32–93.310.080.32
821.72y = 0.0009x + 0.01140.99100.38–108.860.090.38
a y = peak area and x = concentration (ng/mL).

2.2.2. Precision, Accuracy and Stability

Intra- and inter-day precision and accuracy were determined by analyzing the extracted quality control (QC) standards at three concentration levels. Blank plasma were spiked with appropriate concentrations of ginsenosides, as well as 10 μL of I.S. solutions (5 µg/mL). The mixture was then processed as the drug-containing sample to prepare lower, middle, and upper QC samples.
The analysis was repeated on the same day and three consecutive days to give intra- and inter-day precision values that were expressed as relative standard deviation values (RSDs). Percentage differences were taken as measures of accuracy. The intra- and inter-day accuracies were within 81%–101% (see Supplementary Materials Table S1) and the precisions were within acceptable limits at three concentrations (n = 6). The stability of eight ginsenosides in rat plasma was tested as follows by assaying samples. The investigation of short-term stability was examined by analyzing the drug-containing samples at room temperature for 24 h and long-term stability was performed by analyzing the drug-containing samples stored at −20 °C for one month. Freeze/thaw stability was assessed in three cycles. The drug-containing samples were frozen at −20 °C for 24 h and thawed at 37 °C in water bath to be completely melted up to three cycles and then assayed. All stability QC samples were analyzed in six replicates. The stability in the test conditions were in the range of 80.01%–112.42% (see Supplementary Materials Table S2).
To determine extraction recovery and matrix effects, the extraction of rat plasma samples was also optimized in our preliminary studies by comparing protein precipitation reagents, such as methanol (MeOH), acetonitrile (MeCN), and normal butanol. The results were satisfactory when MeOH/MeCN = 4/1 (v/v) was used in protein precipitation. The mean extraction recoveries of eight ginsenoside in the test conditions were within 77%–96% (Table 2). The matrix effect is defined as the effect of co-eluting residual matrix components on the ionization of the target analyte. In other words, suppression or enhancement of analyte response is accompanied by diminished precision and accuracy of subsequent measurements. In this study, the matrix effects were in the range of 85.07%–93.90% (n = 6), which were within acceptable limits (Table 2) [29].
Table 2. Extraction recovery and matrix effects of eight ginsenosides.
GinsenosideSpiked (ng/mL)RecoveryMatrix Effects
Measured (%)RSD (%)Measured (%)RSD (%)
164.8089.618.2185.888.18
16.2088.5212.8686.987.67
0.4577.9816.2185.3112.70
242.7795.688.0088.8814.54
10.6990.9412.2785.2814.24
0.3084.7711.6586.3312.63
364.8078.0810.0286.6913.70
16.2083.7912.5187.0614.16
0.4575.6915.7786.5010.95
429.8195.5912.1584.1110.91
7.4583.7513.6385.0714.23
0.2179.8214.2285.779.59
549.2584.938.1388.2111.95
12.3187.8410.9585.7911.83
0.3477.6215.0787.429.88
691.2084.034.8186.0412.48
22.8083.2011.7485.6413.25
0.9579.058.6885.9011.45
746.6682.0912.9788.9014.06
11.6679.9111.5193.908.68
0.3278.1912.1485.4012.40
854.4380.048.7685.6015.38
13.6177.5111.9687.2211.44
0.3884.7812.1587.349.93

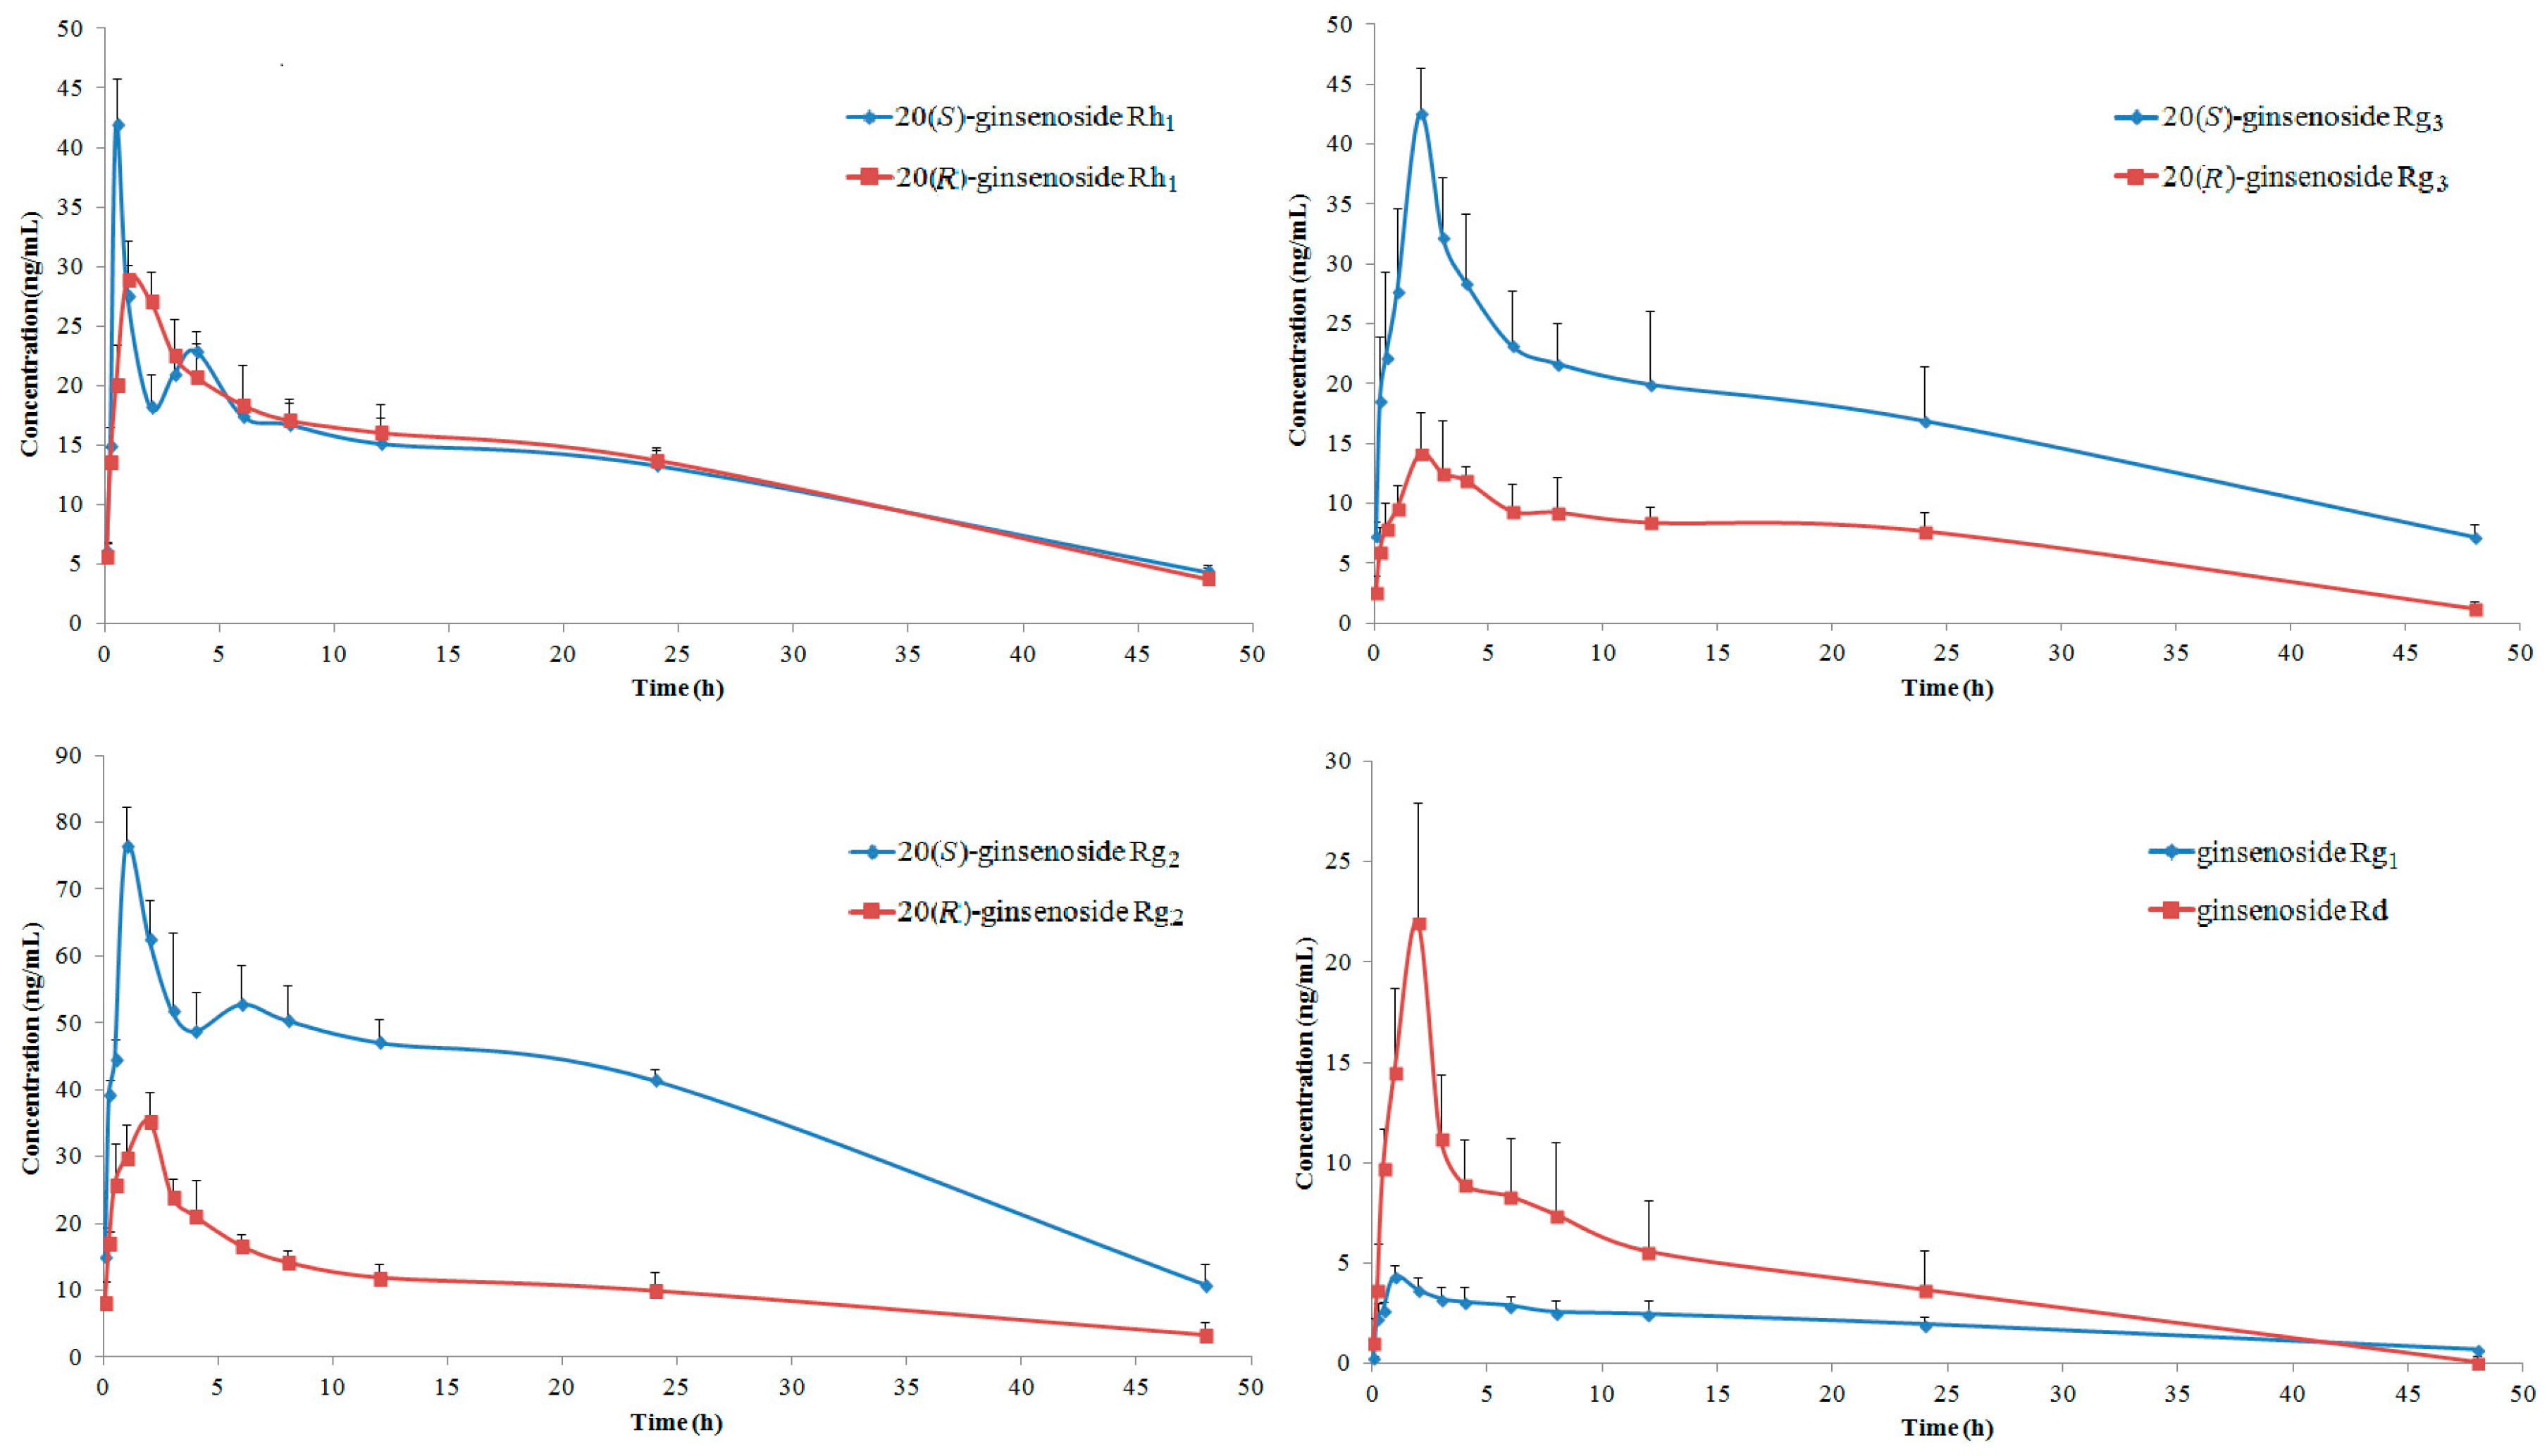
2.3. Pharmacokinetics of GTSSL

The oral median lethal dose (LD50) of GTSSL for mouse was estimated to be more than 5 g/kg, and GTSSL in a dose of 400 mg/kg produced a significant elongation of sleeping time of hexobarbital, as well as significantly inhibited writhing induced by 0.7% acetic acid. A dose-effect relationship has been established for the sedative, anti-inflammatory, and analgesic effects of GTSSL [30]. The mean plasma concentration-time profiles of ginsenosides 18 after oral administration of GTSSL powder at a dose of 400 mg/kg were shown in Figure 3. All eight ginsenosides were measurable in rat plasma up to 48 h after oral administration of GTSSL. Pharmacokinetic parameters were estimated using the DAS pharmacokinetic 2.0 software (Drug and Statistics 2.0, the Committee of the Mathematic Pharmacology, the Chinese Society of Pharmacology, Hefei, China). Maximum concentration (Cmax) and time to maximum concentration (tmax) were the experimentally-observed values. Area under the plasma concentration–time curve (AUC) was calculated using the trapezoidal rule, and AUC0→t from time zero to real-time and AUC0→∞ from time zero to infinity were calculated. Elimination half-life (t1/2) was calculated as t1/2 = 0.693/ke, and mean residence time (MRT) was calculated as AUMC/AUC. The estimated pharmacokinetic parameters of all analytes after oral administration were shown in Table 3.
The ginsenosides 6, 7, and 8, belonging to protopanaxadiol-type saponins, exhibited relatively long tmax values, suggesting that they were slowly absorbed. The ginsenosides 15, belonging to protopanaxatriol-type saponins, had different tmax values, which should be due to the differences in the substituted groups. According to the PK investigations on 20(R)-ginsenoside Rg3 (8) following oral administration of the single 8 to rats [31], the value of tmax was (4.40 ± 1.67) h, suggesting promotion of absorption by oral administration of GTSSL. Namely, the tmax of 8 after oral administration of GTSSL is shorter than that of single 8 administration, the oral administration of GTSSL containing 8 resulted in a shorter tmax of 8 than when the single 8 was administered. It has also been noted that 3 (20(S)-ginsenoside Rg2) was not detected in the rat plasma samples after oral administration of single 3 with a dose at 10 mg/kg [32], conflicting with the results obtained in this research and further research is needed. Taking into consideration combined with results from our present research, it was believed that absorption of the combination as found in herbal preparations would be superior to that of individual compound in vivo, which the increased absorption of 3 might be due in part to the additional compound absorption interaction and GTSSL could significantly enhance the exposure of 3 in rat plasma.
Figure 3. The concentration-time profiles of eight ginsenosides in GTSSL after oral administration at a dose of 400 mg/kg to rats (n = 6).
Molecules 20 19790 g003
Table 3. The pharmacokinetic parameters of eight ginsenosides in GTSSL after oral administration at a dose of 400 mg/kg to rats (n = 6).
GinsenosideAUC0→t (μg h/L)AUC0→∞ (μg h/L)MRT0→t (h)MRT0→∞ (h)t1/2 (h)tmax (h)Cmax (μg/L)
188.77 ± 22.08105.64 ± 18.329.78 ± 0.4812.70 ± 2.9814.99 ± 3.7724.32 ± 1.09
2622.92 ± 46.37753.19 ± 48.8517.06 ± 0.1427.61 ± 1.6720.61 ± 1.180.541.99 ± 3.82
31778.47 ± 86.072302.22 ± 536.4717.43 ± 0.5525.65 ± 4.0222.24 ± 9.88176.42 ± 5.90
4616.55 ± 49.28716.65 ± 92.9417.05 ± 0.6724.78 ± 3.5817.68 ± 2.99129.74 ± 2.71
5511.51 ± 63.84617.80 ± 156.7815.63 ± 1.9225.55 ± 10.4519.05 ± 8.05235.68 ± 4.04
6218.10 ± 18.69221.75 ± 16.5712.43 ± 1.4613.46 ± 2.117.30 ± 3.32222.05 ± 2.21
7778.63 ± 56.72922.70 ± 119.8516.50 ± 1.0223.83 ± 2.0919.11 ± 3.34242.91 ± 3.55
8302.59 ± 32.45311.84 ± 30.3715.43 ± 0.7416.91 ± 1.399.93 ± 2.34215.42 ± 3.38
Compounds 2 and 4, 3 and 5, 7 and 8 are three pairs of R/S epimerics at C-20 (Figure 1). It was interesting that the t1/2 of 20(S)-epimers were always longer than those of 20(R)-epimers and showed significant differences, indicating that elimination of 20(S)-epimer from rat body was more slower than that of the 20(R)-epimer and 20(S)-epimer would be expected to have a longer-lasting effect. Although the MRT0t values of three pairs of R/S epimerics were comparable, the MRT0→∞ of 7 showed nearly 1.5 times larger than that of 8. The t1/2 values of 6, 8, and 1 were (7.30 ± 3.32), (9.93 ± 2.34) and (14.99 ± 3.77) h, respectively, indicating that they were metabolized slowly but still more rapidly than 25 and 7. These results were consistent with their MRT0→∞ profiles. MRT represents the average time a drug molecule remains in the body after administration. It has been well known that the larger MRT could provide a longer duration of action for drugs. However, whether these superior benefit will actually translate to humans requires further study.
Compared to the previous PK studies of individual ginsenoside Rd [33,34], ginsenoside Rg1 [35], 20(R)- and 20(S)-ginsenoside Rg2 [8], and 20(R)-ginsenoside Rg3 [31,36,37] after intravenous administration to animals or healthy volunteers, we have investigated three couples of 20(R)- and 20(S)-epimers simultaneously by LC-ESI-MS/MS, which possesses higher sensitivity and precision. On the contrary, the PK studies of individual ginsenoside was simple and uncomplicated, it is well-known that interactions from complex constituents of traditional Chinese medicines could substantially affect the PK profiles of targeted compounds, therefore, the research of PK on eight ginsenosides of GTSSL here will be useful for drug development in future.

3. Experimental Section

3.1. Materials and Reagents

GTSSL was prepared by using standard method as previously published [38]. The eight reference standard ginsenosides, ginsenoside Rg1 (1), 20(S)-ginsenoside Rh1 (2), 20(S)-ginsenoside Rg2 (3), 20(R)-ginsenoside Rh1 (4), 20(R)-ginsenoside Rg2 (5), ginsenoside Rd (6), 20(S)-ginsenoside Rg3 (7), and 20(R)-ginsenoside Rg3 (8) were purified from acid hydrolysates of GTSSL [5,6,39]. Their chemical structures as shown in Figure 1 were confirmed by MS, 1H- and 13C-NMR spectroscopies and the purities were all >99.8% analyzed with HPLC-DAD method. The I.S. with a purity of 99.9% was purchased from the National Institutes for Food and Drug Control (Beijing, China). LC-MS grade MeCN and MeOH was obtained from J. T. Baker (Center Valley, PA, USA). HPLC-grade formic acid was purchased from Dikma Tech. Inc. (Beijing, China). Water (H2O) was purified by a Milli-Q system (Millipore, Billerica, MA, USA) in our laboratory. Heparin sodium injection (Lot# 20110101) was purchased from Tianjin Biochemical Pharmaceutical Co., Ltd. (Tianjin, China) and normal saline was from Shuanghe Pharmaceutical Co. (Beijing, China). Other reagents were of analytical grade.

3.2. Animals

Male Sprague–Dawley (SD) rats weighting 200–220 g were supplied by the Laboratory Animal Center of Peking University Health Science Center (Beijing, China). The rats were kept in a controlled breeding room with temperature conditions at (22 ± 1) °C and relative humidity at (60 ± 5)% before the experiment. They were fed standard laboratory chow with water ad libitum for three days and then fasted with free access to water for 12 h prior to each experiment. All experimental procedures were approved by the Animal Care Ethics committee on Peking University (No. LA2014162) and conducted according to the European Community guidelines for the use of experimental animals.

3.3. Instrumental and Chromatographic Conditions

Detection and quantification of the analytes were performed on a HPLC–MS system. The analytical DIONEX Ultimate 3000 HPLC system was equipped with an Ultimate 3000 Pump, a DIONEX Ultimate 3000 Autosampler and a DIONEX Ultimate 3000 Compartment. The chromatograph was connected online to a 4000QTRAP triple quadrupole tandem mass spectrometer (Applied Biosystems/MDS Sciex, Toronto, ON, Canada) equipped with an electrospray ionization (ESI) source for the mass analysis and detection. Analyst 1.5.1 software (Applied Biosystems/MDS Sciex) was used for data collection and analysis. The separation was performed on a BDS HYPERSIL C18 column (100 × 2.1 mm i.d., 2.4 μm; Thermo Scientific, Massachusetts, MA, USA). The mobile phases were MeCN (A) and H2O (B) with gradient condition of A as follows: 0–16 min, 25%; 16–16.5 min, 25%–42%; 16.5–19.5 min, 42%; 19.5–22 min, 42%–50%; 22–22.1 min, 50%–90%; 22.1–28 min, 90%; 28–28.1 min, 90%–25%; 28.1–34 min, 25%. The flow rate was set at 0.4 mL/min and the injection volume was 5 µL. Quantification of the analytes was performed using multiple reaction monitoring (MRM) in the negative ionization mode with the following settings after optimization: source voltage 3.5 kV, nebulizer gas 50 psi, turbo gas 70 psi, curtain gas 35 psi, collision gas 7, and source temperature (TEM) 500 °C. Gases were 99.999% nitrogen. The MRM transitions monitored were from m/z 799.5 to 637.5 for 1, from m/z 637.5 to 475.1 for 2, from m/z 783.3 to 475.5 for 3, from m/z 637.6 to 475.2 for 4, from m/z 783.4 to 475.6 for 5, from m/z 945.9 to 783.7 for 6, from m/z 783.6 to 459.5 for 7, from m/z 783.7 to 459.6 for 8, and from m/z 779.6 to 649.4 for I.S. Data acquiring and processing were performed with Analyst software, version 1.6 (Applied Biosystems/MDS Sciex).

3.4. Identification and Determination of Ginsenosides in Blood Samples

3.4.1. Preparation of Blood Samples

The rat blood samples were processed to obtain plasma by centrifugation at 3000 g for 10 min. A 150 μL aliquot of the upper layer of plasma was mixed with 10 μL of I.S. (5 μg/mL) and 750 μL MeOH/MeCN = 4/1 (v/v) using vortex-mixing for 1 min and then centrifuged at 10,000 g for 10 min at 4 °C. The upper layer was transferred to another clean Eppendorf tube and dried under gentle N2 gas stream at 45 °C. Each dried residue sample was added to 120 μL of MeOH, using vortex-mixing for 1 min and then centrifuged at 10,000 g for 10 min at 4 °C. A 5 μL aliquot of supernatant was injected into the LC-ESI-MS/MS system for analysis. The same sample handling process was used for the recovery and precision determinations.

3.4.2. Preparation of Stock Solutions, Calibration Samples and Quality Control Samples

Stock solutions of the eight reference standard ginsenosides were separately prepared in MeOH. A 5 μg/mL solution for I.S. was also prepared in MeOH. Eight calibration curves for ginsenosides were prepared with the method above by spiking blank rat plasma with I.S. A mixed working solution containing eight analytes at seven concentrations, which were obtained by dilution the stock solutions, to give 126.60, 64.80, 32.40, 16.20, 5.40, 1.35, and 0.45 ng/mL for 1; 85.54, 42.77, 21.38, 10.69, 3.56, 0.89, and 0.30 ng/mL for 2; 129.60, 64.80, 32.40, 16.20, 5.40, 1.35, and 0.45 ng/mL for 3; 59.62, 29.81, 14.90, 7.45, 2.48, 0.62, and 0.21 ng/mL for 4; 98.50, 49.25, 24.62, 12.31, 4.10, 1.03, and 0.34 ng/mL for 5; 182.40, 91.20, 45.60, 22.80, 11.40, 2.85, and 0.95 ng/mL for 6; 93.31, 46.66, 23.33, 11.66, 3.89, 0.97, and 0.32 ng/mL for 7; and 108.86, 54.43, 27.22, 13.61, 4.54, 1.13, and 0.38 ng/mL for 8. QC samples at lower, middle and upper concentrations were chosen as the seventh, fourth, and second concentration solution. All the solutions were stored at −20 °C before use.

3.5. Method Validation

3.5.1. Linearity and Selectivity

Each standard curve consisted of seven concentration levels mentioned above and was constructed by calculating the peak area ratio (y) of an analyte to I.S. against the analyte concentrations (x). The correlation coefficient (r2) of the calibration curves should be >0.990 to satisfy linearity requirements. The LLOD was defined as the amount that could be detected with a S/N of three. The LLOQ for analyte of the assay was defined as the lowest concentrations of the calibration curve that could be quantitated with a S/N of at least 10. Each concentration standard needed to meet the following acceptable criteria: accuracy should not exceed 20%. The selectivity of the method was investigated by analyzing blank rat plasma, blank plasma spiked with each standard analyte and I.S., and a rat plasma sample.

3.5.2. Precision and Accuracy

The precision and accuracy were analyzed with the QC samples (lower, middle, and upper concentration) in six replicates, which were assessed on three continuous days. The intra- and inter-day precision was evaluated from the relative standard deviation (RSD %) and the relative error (RE%) was calculated according to the formula:
RE% = [(assayed value − nominal value)/nominal value] × 100%

3.5.3. Extraction Recovery and Matrix Effects

The extraction recoveries of analytes were assessed by comparing the mean peak areas of QC samples (dissolved in MeOH) with the mean peak areas of the spike-after-extraction samples (blank plasma extracted with MeOH/MeCN = 4/1) at the same concentrations (n = 6). The matrix effects of analytes were assessed with comparing the mean peak areas of QC samples (dissolved in MeOH) with the mean peak areas of the analytes in QC samples which were dissolved in the blank plasma extracted with MeOH/MeCN (4/1) at the same concentrations (n = 6). There was no matrix effect if the ratio was between 85% and 115%, however the matrix effect was obvious if the ratio was less than 85% or more than 115% [29].

3.5.4. Stability

The stability was investigated by assessing six replicates of the QC samples in different conditions. These conditions included storage 24 h at indoor temperature, three freeze-thaw cycles, and storage in the dark for 30 days at −20 °C. The samples were considered stable if the RE% was within 15% of the actual value.

3.6. Application

Male SD rats were used in the study after a one week acclimatization period. The rats were allowed free access to food and water before the experiment, and then fasted with free access to water for 12 h prior to each experiment. After overnight fasting, GTSSL powder was administered orally at the dosage of 400 mg/kg to rats (n = 6). The blood samples (0.5 mL) were collected in heparinized tubes at 0.083, 0.25, 0.5, 1, 2, 3, 4, 6, 8, 12, 24, and 48 h after dosing. The blood samples were immediately centrifuged at 3000 g for 10 min, and the supernatant plasma layer was gathered and stored at −20 °C until analysis.

4. Conclusions

The LC-ESI-MS/MS method was developed for identification and quantification of eight ginsenosides of GTSSL: ginsenoside Rg1 (1), 20(S)-ginsenoside Rh1 (2), 20(S)-ginsenoside Rg2 (3), 20(R)-ginsenoside Rh1 (4), 20(R)-ginsenoside Rg2 (5), ginsenoside Rd (6), 20(S)-ginsenoside Rg3 (7), and 20(R)-ginsenoside Rg3 (8), in rat plasma with high sensitivity, accuracy, precision, selectivity, and rapidity. The PK profiles of these eight ginsenosides were first simultaneously determined following oral administration of a single dose to rats. The PK information on these ginsenosides obtained in this study could provide valuable reference for the clinical use of GTSSL.

Supplementary Materials

The XIC of blank rat plasma, as well as intra- and inter-day accuracy, precision and stability of method validation for the analysis of eight ginsenosides in rat plasma are available as Supplementary Materials, which may be accessed at: https://www.mdpi.com/1420-3049/20/12/19790/s1.

Acknowledgments

This research was supported partly by the National Key Technology R & D Program of China (2011BAI03B01; 2011BAI07B08; 96-901-01-12).

Author Contributions

The list authors contributed to this work as follows: X.-W.Y. conceived and designed the experiments, L.-Y.M., Y.-B.Z., Q.-L.Z. and Y.-F.Y. performed the experiments and analyzed the data, L.-Y.M. wrote the paper, X.-W.Y. polished the paper. X.-W.Y. acquired funding for the research. All authors read and approved the final manuscript.

Conflicts of Interest

The authors declare no conflict of interest.

References

  1. Cao, J.Q.; Zhang, X.S.; Qu, F.Z.; Guo, Z.H.; Zhao, Y.Q. Dammarane triterpenoids for pharmaceutical use: A patent review (2005–2014). Expert Opin. Ther. Pat. 2015, 25, 805–817. [Google Scholar] [CrossRef] [PubMed]
  2. Li, K.K.; Yang, X.W. A new triterpene natural product from stems and leaves of Panax ginseng. Chin. Tradit. Herb. Drugs 2015, 46, 169–173. [Google Scholar]
  3. Li, K.K.; Yang, X.B.; Yang, X.W.; Liu, J.X.; Gong, X.J. New triterpenoids from the stems and leaves of Panax ginseng. Fitoterapia 2012, 83, 1030–1035. [Google Scholar] [CrossRef] [PubMed]
  4. Li, K.K.; Yao, C.M.; Yang, X.W. Four new dammarane-type triterpene saponins from the stems and leaves of Panax ginseng and their cytotoxicity on HL-60 cells. Planta Med. 2012, 78, 189–192. [Google Scholar]
  5. Yang, X.W. Complete assignment of 1H- and 13C-NMR chemical shifts of 20(R)-ginsenoside Rg2 and 20(S)-ginsenoside Rg2. Chin. J. Magn. Reson. 2000, 17, 9–15. [Google Scholar]
  6. Wang, H.P.; Yang, X.B.; Yang, X.W.; Liu, J.X.; Wang, Y.P.; Zhang, L.X. Chemical constituents from roots and rhizomes of Panax ginseng cultivated in Jilin province. China J. Chin. Mater. Med. 2013, 38, 2807–2817. [Google Scholar]
  7. Wang, H.P.; Yang, X.B.; Yang, X.W.; Liu, J.X.; Xu, W.; Zhang, Y.B.; Zhang, L.X.; Wang, Y.P. Ginsenjilinol, a new protopanaxatriol type saponin with inhibitory activity on LPS-activated NO production in macrophage RAW 264.7 cells from the roots and rhizomes of Panax ginseng. J. Asian Nat. Prod. Res. 2013, 15, 579–587. [Google Scholar] [CrossRef] [PubMed]
  8. Gui, F.J.; Yang, X.W.; Li, L.Y.; Tian, J.M. Simultaneous enantiomer determination of 20(R)- and 20(S)-ginsenoside-Rg2 in rat plasma after intravenous administration using HPLC method. J. Chromatogr. B 2007, 850, 1–6. [Google Scholar] [CrossRef] [PubMed]
  9. Lee, S.Y.; Jeong, J.J.; Eun, S.H.; Kim, D.H. Anti-inflammatory effects of ginsenoside Rg1 and its metabolites ginsenoside Rh1 and 20(S)-protopanaxatriol in mice with TNBS-induced colitis. Eur. J. Pharmacol. 2015, 762, 333–343. [Google Scholar] [CrossRef] [PubMed]
  10. Li, J.P.; Gao, Y.; Chu, S.F.; Zhang, Z.; Xia, C.Y.; Mou, Z.; Song, X.Y.; He, W.B.; Guo, X.F.; Chen, N.H. Nrf2 pathway activation contributes to anti-fibrosis effects of ginsenoside Rg1 in a rat model of alcohol- and CCl4-induced hepatic fibrosis. Acta Pharmacol. Sin. 2014, 35, 1031–1044. [Google Scholar] [CrossRef] [PubMed]
  11. Shen, L.H.; Zhang, J.T. Ginsenoside Rg1 promotes proliferation of hippocampal progenitor cells. Neurol. Res. 2004, 26, 422–428. [Google Scholar] [CrossRef] [PubMed]
  12. Zhang, Y.H.; Lin, J.N.; Pei, Y.P.; Chen, Y.J.; Liu, C.M.; Xu, S.X.; Yao, X.S. Studies on the antiarrhythmic constituents from the rhizomes of Panax ginseng C.A. Meyer. J. Shenyang Coll. Pharm. 1992, 9, 103–105. [Google Scholar]
  13. Siddiqi, M.H.; Siddiqi, M.Z.; Ahn, S.; Kim, Y.J.; Yang, D.C. Ginsenoside Rh1 induces mouse osteoblast growth and differentiation through the bone morphogenetic protein 2/runt-related gene 2 signalling pathway. J. Pharm. Pharmacol. 2014, 66, 1763–1773. [Google Scholar] [CrossRef] [PubMed]
  14. Ma, L.Y.; Zhou, Q.L.; Yang, X.W. New SIRT1 activator from alkaline hydrolysate of total saponins in the stems-leaves of Panax ginseng. Bioorg. Med. Chem. Lett. 2015, 25, 5321–5325. [Google Scholar] [CrossRef] [PubMed]
  15. Siraj, F.M.; Natarajan, S.; Kim, Y.J.; Chun Yang, D. In silico screening of ginsenoside Rh1 with PPARγ and in vitro analysis on 3T3-L1 cell line. Mol. Simul. 2015, 41, 1219–1226. [Google Scholar] [CrossRef]
  16. Gai, Y.S.; Ma, Z.G.; Yu, X.F.; Qu, S.C.; Sui, D.Y. Effect of ginsenoside Rh1 on myocardial injury and heart function in isoproterenol-induced cardiotoxicity in rats. Toxicol. Mech. Methods 2012, 22, 584–591. [Google Scholar] [CrossRef] [PubMed]
  17. Wang, Y.Z.; Chen, J.; Chu, S.F.; Wang, Y.S.; Wang, X.Y.; Chen, N.H.; Zhang, J.T. Improvement of memory in mice and increase of hippocampal excitability in rats by ginsenoside Rg1’s metabolites ginsenoside Rh1 and protopanaxatriol. J. Pharmacol. Sci. 2009, 109, 504–510. [Google Scholar] [CrossRef] [PubMed]
  18. Lü, W.W.; Liu, J.; Tian, J.M.; Li, L.Y.; Ye, J.M.; Zhang, Z.W. Effect of 20-(S) and 20-(R)-ginsenoside Rg2 on hemodynamics and blood oxygen content of cardiogenic shock canine. Chin. Tradit. Herb. Drugs 2003, 34, 254–256. [Google Scholar]
  19. Zhang, Z.W.; Zhao, Y.J.; Ye, J.M.; Tian, J.M.; Guo, W.F.; Li, H.; Li, L.Y.; Jin, Y. Effects of ginsenoside Rg2 on myocardial damage induced by endotoxic diffuse intravascular coagulation and hemorrheology. Chin. Tradit. Herb. Drugs 2002, 33, 814–816. [Google Scholar]
  20. Liu, J.; Sun, W.J.; Lü, W.W.; Ye, J.M.; Li, L.Y. Comparison of cardiotonic and toxic effects between ginsenoside Rg2 and strophanthin K. Chin. Tradit. Herb. Drugs 2001, 32, 809–811. [Google Scholar]
  21. Liu, J.F.; Yan, X.D.; Li, L.; Li, Y.; Zhou, L.F.; Zhang, X.H.; Hu, X.H.; Zhao, G. Ginsenoside Rd improves learning and memory ability in APP transgenic mice. J. Mol. Neurosci. 2015, 57, 522–528. [Google Scholar] [CrossRef] [PubMed]
  22. Liu, J.F.; Yan, X.D.; Qi, L.S.; Li, L.; Hu, G.Y.; Li, P.; Zhao, G. Ginsenoside Rd attenuates Aβ25-35-induced oxidative stress and apoptosis in primary cultured hippocampal neurons. Chem. Biol. Interact. 2015, 239, 12–18. [Google Scholar] [CrossRef] [PubMed]
  23. Zhang, X.; Shi, M.; Bjoras, M.; Wang, W.; Zhang, G.Y.; Han, J.L.; Liu, Z.R.; Zhang, Y.X.; Wang, B.; Chen, J.; et al. Ginsenoside Rd promotes glutamate clearance by up-regulating glial glutamate transporter GLT-1 via PI3K/AKT and ERK1/2 pathways. Front. Pharmacol. 2013, 4, 1–8. [Google Scholar] [CrossRef] [PubMed]
  24. Joo, E.J.; Chun, J.; Ha, Y.W.; Ko, H.J.; Xu, M.Y.; Kim, Y.S. Novel roles of ginsenoside Rg3 in apoptosis through downregulation of epidermal growth factor receptor. Chem. Biol. Interact. 2015, 233, 25–34. [Google Scholar] [CrossRef] [PubMed]
  25. Li, J.; Liu, T.; Zhao, L.; Chen, W.; Hou, H.L.; Ye, Z.X.; Li, X. Ginsenoside 20(S)-Rg3 inhibits the Warburg effect through STAT3 pathways in ovarian cancer cells. Int. J. Oncol. 2015, 46, 775–781. [Google Scholar] [CrossRef] [PubMed]
  26. Wang, X.Y.; Chen, L.L.; Wang, T.; Jiang, X.Q.; Zhang, H.; Li, P.; Lv, B.; Gao, X.M. Ginsenoside Rg3 antagonizes adriamycin-induced cardiotoxicity by improving endothelial dysfunction from oxidative stress via upregulating the Nrf2-ARE pathway through the activation of akt. Phytomedicine 2015, 22, 875–884. [Google Scholar] [CrossRef] [PubMed]
  27. Liu, Y.E.; Liu, X.W.; Shi, L.; Zhang, Y.B.; Xu, T.T.; Gao, Y.; Hou, M.X. Effects of 20(R)-ginsenoside Rg3 on apoptosis of human glioma U87 cells. J. Chengdu Med. Coll. 2014, 9, 4–7. [Google Scholar]
  28. Kim, D.Y.; Yuan, H.D.; Huang, B.; Quan, H.Y.; Chung, S.H. Ginsenoside 20(R)-Rg3 stimulates glucose uptake in C2C12 myotubes via CaMKK-AMPK pathways. Food Sci. Biotechnol. 2010, 19, 1277–1282. [Google Scholar] [CrossRef]
  29. Guidance for Industry: Bioanalytical Method Validation. In Food and Drug Administration; Silver Spring, MD, USA, 2001; pp. 4–10. Available online: http://www.fda.gov/downloads/Drugs/.../Guidances/ucm070107.pdf (accessed on 10 October 2015).
  30. Saito, H.; Morita, M.; Takagi, K. Pharmacological studies of Panax ginseng leaves. Jpn. J. Pharmacol. 1973, 23, 43–56. [Google Scholar] [CrossRef] [PubMed]
  31. Xie, H.T.; Wang, G.J.; Sun, J.G.; Tucker, I.; Zhao, X.C.; Xie, Y.Y.; Li, H.; Jiang, X.L.; Wang, R.; Xu, M.J.; et al. High performance liquid chromatographic-mass spectrometric determination of ginsenoside Rg3 and its metabolites in rat plasma using solid-phase extraction for pharmacokinetic studies. J. Chromatogr. B 2005, 818, 167–173. [Google Scholar] [CrossRef] [PubMed]
  32. Xu, M.J.; Wang, G.J.; Xie, H.T.; Wang, R.; Wang, W.; Li, X.Y.; Sun, J.G. Determination of ginsenoside Rg2 in rat plasma by high-performance liquid chromatography-mass spectrometry after solid-phase extraction. Anal. Lett. 2006, 39, 113–126. [Google Scholar] [CrossRef]
  33. Wang, W.; Wang, G.J.; Xie, H.T.; Sun, J.G.; Zhao, S.; Jiang, X.L.; Li, H.; Lv, H.; Xu, M.J.; Wang, R. Determination of ginsenoside Rd in dog plasma by liquid chromatography-mass spectrometry after solid-phase extraction and its application in dog pharmacokinetics studies. J. Chromatogr. B 2007, 852, 8–14. [Google Scholar] [CrossRef] [PubMed]
  34. Yang, L.; Deng, Y.H.; Xu, S.J.; Zeng, X. In vivo pharmacokinetic and metabolism studies of ginsenoside Rd. J. Chromatogr. B 2007, 854, 77–84. [Google Scholar] [CrossRef] [PubMed]
  35. Feng, L.; Wang, L.; Hu, C.J.; Jiang, X.H. Pharmacokinetics, tissue distribution, metabolism, and excretion of ginsenoside Rg1 in rats. Arch. Pharm. Res. 2010, 33, 1975–1984. [Google Scholar] [CrossRef] [PubMed]
  36. Qian, T.X.; Cai, Z.W.; Wong, R.N.S.; Mak, N.K.; Jiang, Z.H. In vivo rat metabolism and pharmacokinetic studies of ginsenoside Rg3. J. Chromatogr. B 2005, 816, 223–232. [Google Scholar] [CrossRef] [PubMed]
  37. Wang, H.L.; Zou, H.F.; Kong, L.; Zhang, Y.K.; Pang, H.; Su, C.Y.; Liu, G.Y.; Hui, M.; Fu, L. Determination of ginsenoside Rg3 in plasma by solid-phase extraction and high-performance liquid chromatography for pharmacokinetic study. J. Chromatogr. B 1999, 731, 403–409. [Google Scholar] [CrossRef]
  38. Ma, L.Y.; Yang, X.W. Six new dammarane-type triterpenes from acidic hydrolysate of the stems-leaves of Panax ginseng and their inhibitory–activities against three human cancer cell lines. Phytochem. Lett. 2015, 13, 406–412. [Google Scholar] [CrossRef]
  39. Ma, L.Y.; Yang, X.W. Chemical constituents in acid hydrolysates of total saponins from stems and leaves of Panax ginseng. Chin. Tradit. Herb. Drugs 2015, 46, 2522–2533. [Google Scholar]
  • Sample Availability: Samples of the compounds are not available from the authors.

