Article

Studies on Chromatographic Fingerprint and Fingerprinting Profile-Efficacy Relationship of Saxifraga stolonifera Meerb.

1
Guizhou Engineering Laboratory for Quality Control & Evaluation Technology of Medicine, Guizhou Normal University, 116 Baoshan North Rd., Guiyang 550001, Guizhou, China
2
The Research Center for Quality Control of Natural Medicine, Guizhou Normal University, 116 Baoshan North Rd., Guiyang 550001, Guizhou, China
3
Guiyang College of Traditional Chinese Medicine, 50 Shidong Rd., Guiyang 550002, Guizhou, China
*
Author to whom correspondence should be addressed.
These authors contributed equally to this work.
Molecules 2015, 20(12), 22781-22798; https://doi.org/10.3390/molecules201219882
Submission received: 28 September 2015 / Revised: 15 December 2015 / Accepted: 15 December 2015 / Published: 19 December 2015
(This article belongs to the Section Medicinal Chemistry)

Abstract

:
This work investigated the spectrum-effect relationships between high performance liquid chromatography (HPLC) fingerprints and the anti-benign prostatic hyperplasia activities of aqueous extracts from Saxifraga stolonifera. The fingerprints of S. stolonifera from various sources were established by HPLC and evaluated by similarity analysis (SA), hierarchical clustering analysis (HCA) and principal component analysis (PCA). Nine samples were obtained from these 24 batches of different origins, according to the results of SA, HCA and the common chromatographic peaks area. A testosterone-induced mouse model of benign prostatic hyperplasia (BPH) was used to establish the anti-benign prostatic hyperplasia activities of these nine S. stolonifera samples. The model was evaluated by analyzing prostatic index (PI), serum acid phosphatase (ACP) activity, concentrations of serum dihydrotestosterone (DHT), prostatic acid phosphatase (PACP) and type II 5α-reductase (SRD5A2). The spectrum-effect relationships between HPLC fingerprints and anti-benign prostatic hyperplasia activities were investigated using Grey Correlation Analysis (GRA) and partial least squares regression (PLSR). The results showed that a close correlation existed between the fingerprints and anti-benign prostatic hyperplasia activities, and peak 14 (chlorogenic acid), peak 17 (quercetin 5-O-β-d-glucopyranoside) and peak 18 (quercetin 3-O-β-l-rhamno-pyranoside) in the HPLC fingerprints might be the main active components against anti-benign prostatic hyperplasia. This work provides a general model for the study of spectrum-effect relationships of S. stolonifera by combing HPLC fingerprints with a testosterone-induced mouse model of BPH, which can be employed to discover the principle components of anti-benign prostatic hyperplasia bioactivity.

1. Introduction

Traditional Chinese medicines (TCMs) have attracted more and more attention in recent years since they exhibit weak toxicity, affordability and complementary therapeutic effects against many diseases, and many of them were reported to have the anti-benign prostatic hyperplasia biological activities [1]. Recent studies have shown that the extract of Saxifraga stolonifera Meerb. has a strong effect on the treatment of benign prostatic hyperplasia (BPH) [2]. The main phytochemical constituents of S. stolonifera are flavonoids, organic acids and phytosterols such as bergenin, gallic acid and β-sitosterol [3]. Pharmacological experiments have indicated that extracts of S. stolonifera have a wide range of biological activities, including bacteriostatic [4], antioxidant [4,5] and antitumor activities, etc. [2].
As is known to us, BPH is one of the most common urinary disorders in the aging male. The prevalence of histologically identifiable BPH was characterized by hyperplasia of the prostate stromal as well as epithelial cells, which results in prostate gland enlargement [6]. Numerous studies have reported that the prevalence of BPH was greater than 50% in men of 60 years and reaches approximately 90% by the age 85 [7,8]. The symptoms of BPH include urinary frequency, weak urine stream, nocturia and lower urinary tract symptoms (LUTS) [9], which can cause significant impact on the quality of life. Many kinds of medicines are prevalent in treating BPH, such as hormonal therapy, alpha 1-adrenoreceptor blockers and 5 alpha-reductase inhibitors [10]. The finasteride has been used for many years in the treatment of BPH and it reduced local production of the growth promoted by androgen dihydrotestosterone (DHT) [11,12]. However, the onset of finasteride-related adverse effects was often associated with these options such as erectile dysfunction, fatigue, dizziness, ejaculatory dysfunction and upper respiratory tract infection [9,13]. Therefore, searching for more natural plant extracts for the management of these conditions has attracted much attention [14,15,16].
Chromatographic fingerprint was accepted as a useful method for the identification and quality control of traditional Chinese medicine in recent years [17,18], but it cannot be employed to identify the components which play the leading role in treatment. So, it is imperative and urgent to investigate the spectrum-effect relationship between HPLC fingerprints and efficacy, establish integrated evaluation system and finally find the principal bioactive components in the fingerprint representing the curative effect [19].
Water decoction is a classical extract method that has been widely accepted in Chinese folk since his convenience, environmental protection [20,21]. Then, water decoction was chosen to extract S. stolonifera samples. In the present study, HPLC was applied to establish the fingerprints of S. stolonifera aqueous extract from different regions, and investigate the curative effectiveness of the aqueous extract of S. stolonifera (AESS) in a testosterone-induced BPH model in castrated mice. According to the results of S. stolonifera fingerprints and pharmacodynamics activities, partial least squares regression (PLSR) and Gray Correlation Analysis (GRA) were used to learn the primary active components against benign prostatic hyperplasia.

2. Results and Discussion

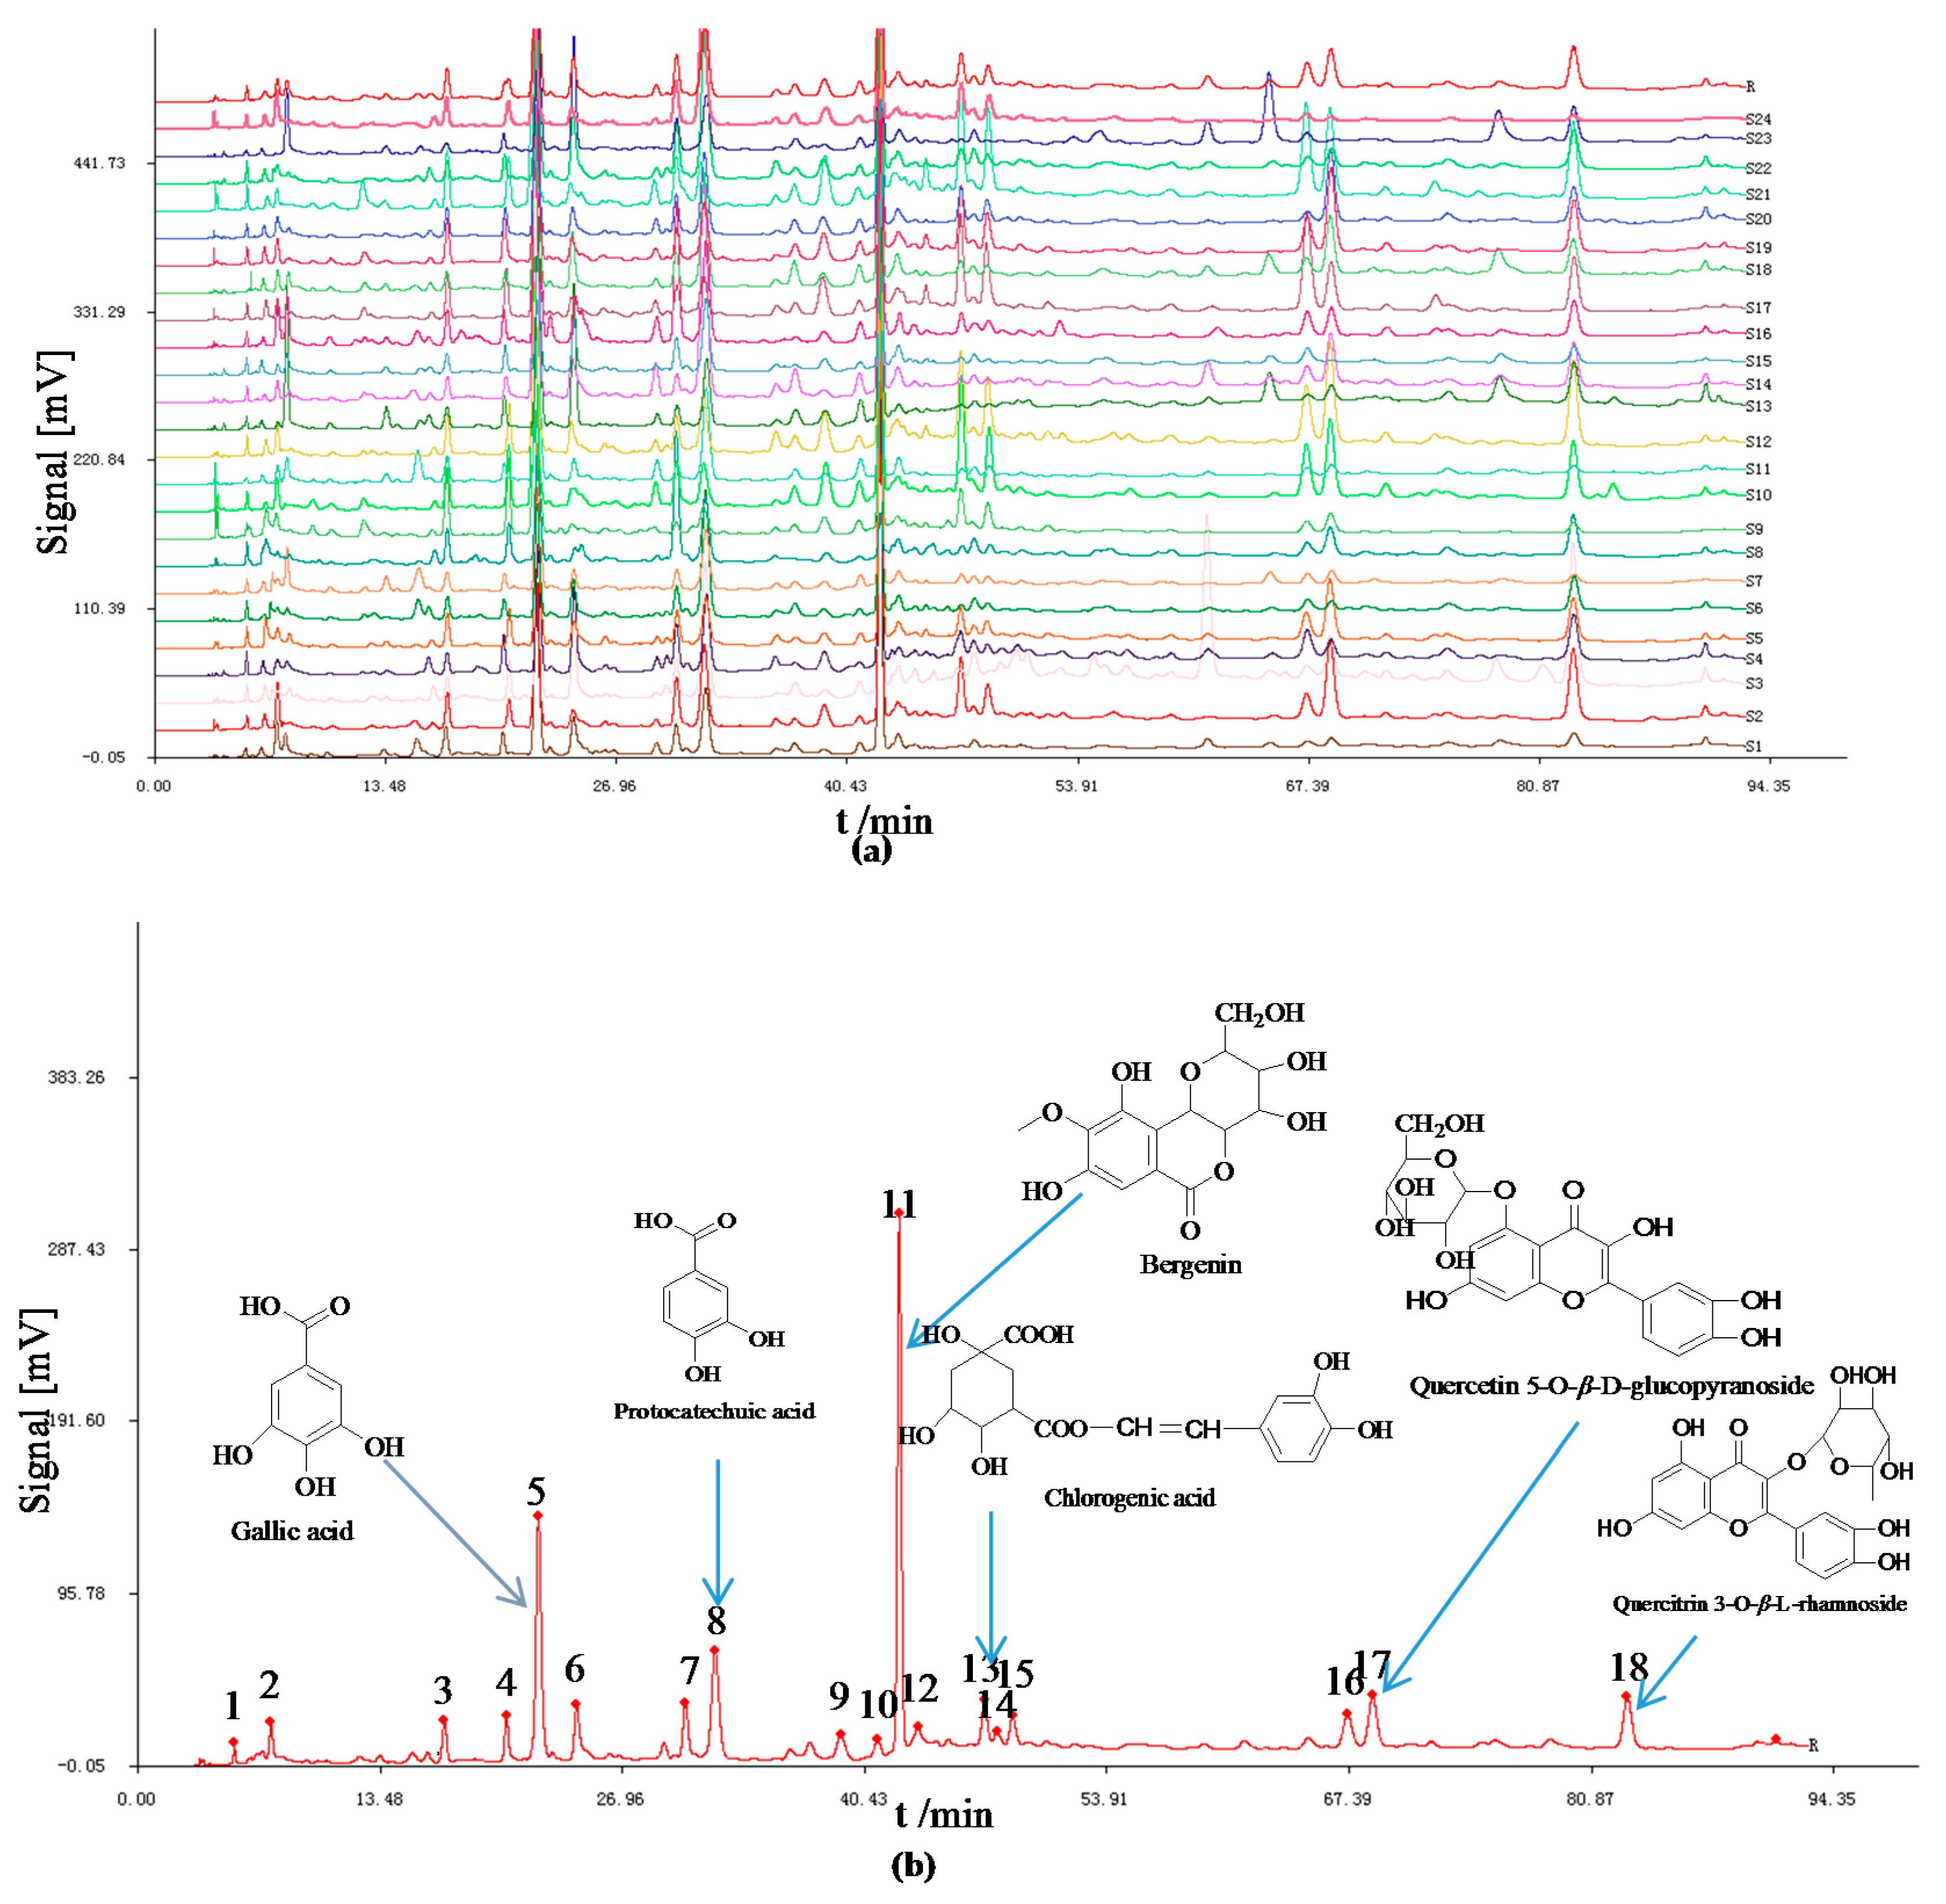
2.1. HPLC Fingerprints

2.1.1. Analysis of HPLC Fingerprints and Similarities

Our previous studies of methodology validation showed that the method of HPLC for the fingerprint analysis had good segregation from consecutive peaks and with large areas. As the Figure 1a showed the typical HPLC fingerprints of AESS from 24 batches and reference standard fingerprint was generated at the same time Figure 1b. Eighteen common peaks were found in the reference chromatogram of S. stolonifera by comparison of their HPLC retention time, most the chromatogram shapes of congeneric sample from different sources were quite similar. However, there were still some fingerprint differences among these samples of different sources, such as the values of peak area and peak number (which is equal to the injection volume) shown in Figure 1a. The state food and drug administration (SFDA) of China advocated that all herbal chromatograms should be evaluated in terms of similarity by calculation of the correlative coefficient and/or angle cosine values of original data [22,23]. The similarities between the entire chromatographic profiles of 24 batches of S. stolonifera and the reference chromatogram were evaluated by SA, and correlation coefficients of their chemical fingerprints were shown in Table 1. The results showed that correlation coefficients of those samples were from 0.027 (Qingchang town, Guizhou, China) to 0.990 (Qitan town, Guizhou, China), and the correlation coefficients between the chromatograms of samples from the same source there were very different.

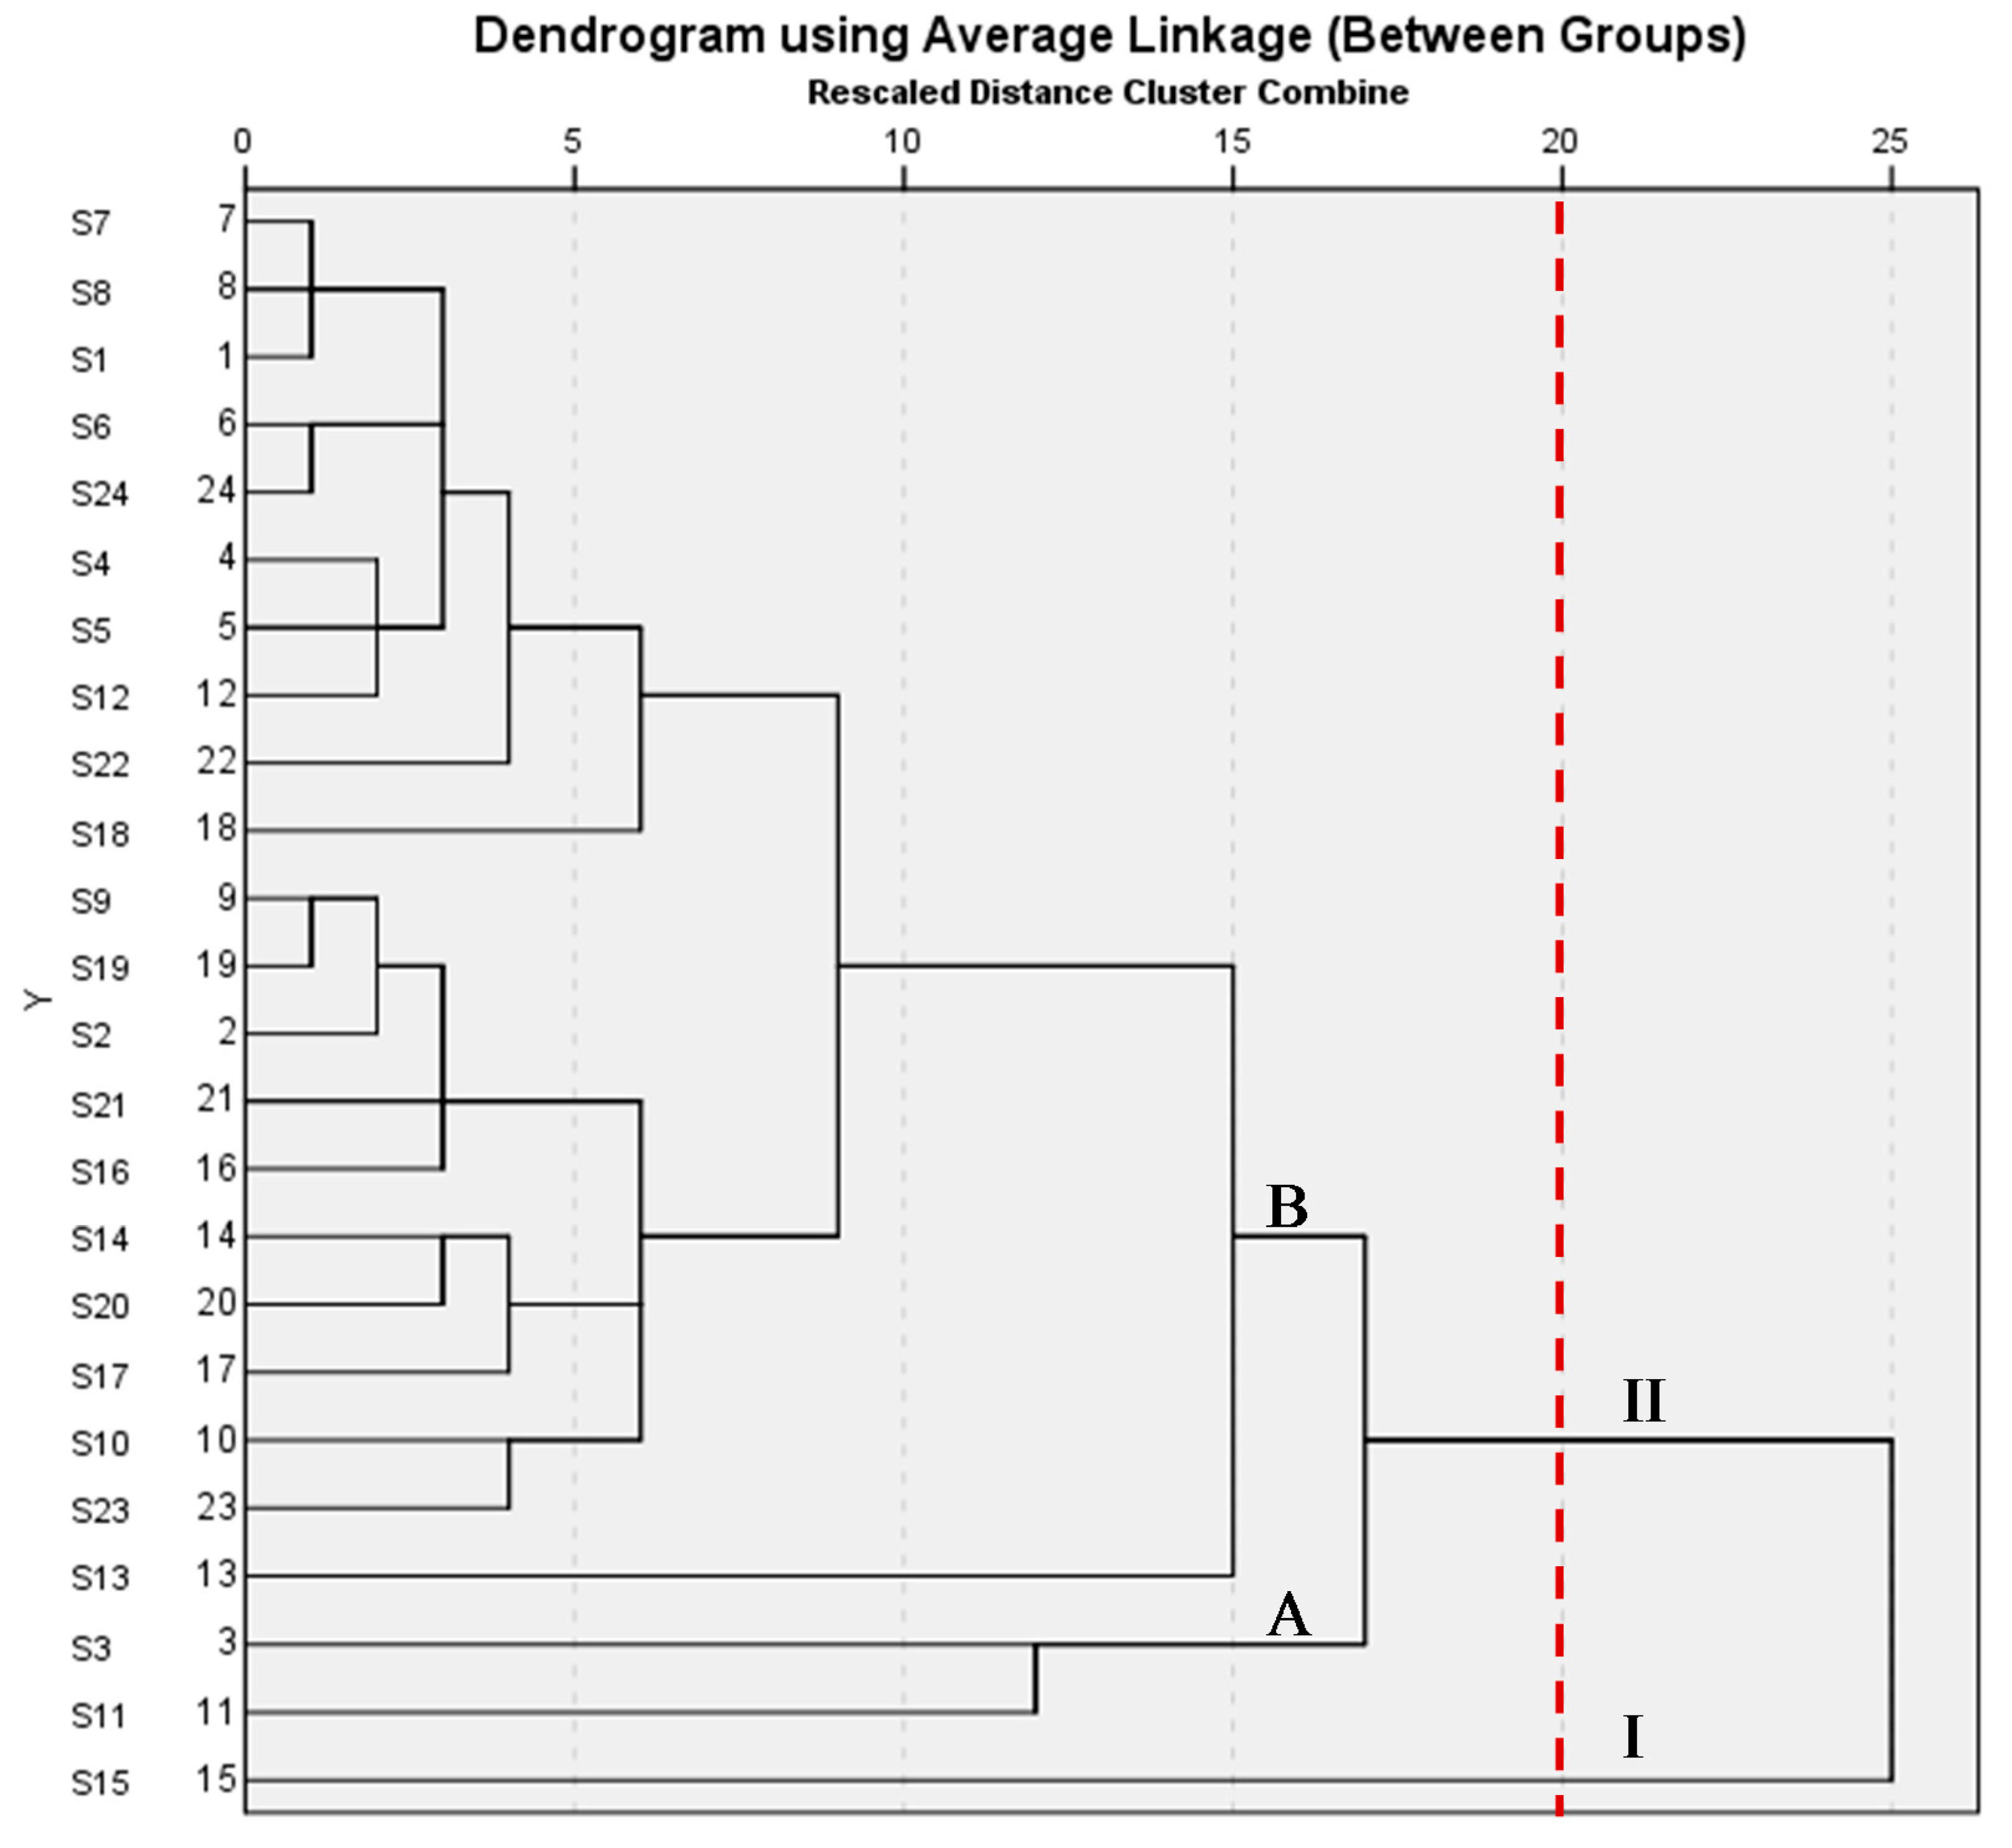
2.1.2. Results of HCA

In order to assess this tendency, a hierarchical agglomerative cluster analysis of samples was performed. HCA carried out were generating different clusters according to similarity of fingerprints. Between group methods, one of the most efficient methods for the analysis of variance between clusters was applied, and Square Euclidean distance was selected as a measurement. As the results in Figure 2 show, it was clear that 24 tested samples of S. stolonifera were divided into two main clusters. Sample no. 15 was in cluster I and the other samples were in cluster II which was divided into two subgroups again. Sample nos. 3 and 11 were in subgroup A and the others were in subgroup B. The result suggested the contents and distribution of the main components were different in different S. stolonifera samples, which would result in their different efficacies.
Figure 1. (a) The high performance liquid chromatography (HPLC) fingerprints of aqueous extracts of S. stolonifera from various sources; (b) The reference chromatogram was generated from the fingerprints of the 24 batches of S. stolonifera samples by using the Similarity Evaluation System for Chromatographic Fingerprint of traditional Chinese medicines (TCM) using the median method.
Molecules 20 19882 g001
Table 1. Collected information and similarity of the samples.
Sample No.SourcesAcquisition TimeSimilaritySample No.SourcesAcquisition TimeSimilarity
S1Haozhou city, Medicine Market, AnhuiMay, 20140.984S13Kaiyang county, Medicine Market, GuizhouMay, 20140.949
S2Baiyun town, GuizhouApril, 20140.978S14Censong town, GuizhouApril, 20140.979
S3Qingchang town, GuizhouJune, 20140.027S15Majiangxiasi town, GuizhouOctober, 20120.981
S4Yanxia town, GuizhouJuly, 20140.972S16Dujiangyan city Medicine Market, SichuanApril, 20140.758
S5Guilin city, Medicine Market, GuangxiMay, 20140.983S17Benzhuang town, GuizhouMarch, 20140.956
S6Qingping, Medicine Market, GuangdongMarch, 20140.972S18Qitan town, GuizhouApril, 20140.990
S7Huaguoyuan, Medicine Market, GuizhouMay, 20140.979S19Shidong town, GuizhouMarch, 20140.983
S8Dongfeng town, GuizhouJuly, 20140.599S20Zhenfeng county, Medicine Market, GuizhouApril, 20140.986
S9Shuitian town, GuizhouMarch, 20140.935S21Liutong town, GuizhouMarch, 20140.942
S10Guizhou, Botanical Garden, GuizhouApril, 20140.973S22Liutun town, GuizhouJuly, 20140.981
S11Baoding city, Medicine Market, HebeiMay, 20140.981S23Zhazuo town, GuizhouJuly, 20140.941
S12Gaopo town, GuizhouMarch, 20140.970S24Banqiao town, GuizhouJune, 20140.967
Figure 2. Hierarchical clustering analysis of S. stolonifera samples. The hierarchical clustering analysis (HCA) of samples 1–24 was performed using SPSS statistics software (SPSS for Windows 20.0, SPSS Inc., New York, NY, USA). A method called Between-Groups Linkage was applied. І and II represent cluster I and cluster II, respectively. A and B represent subgroup A and subgroup B, respectively.
Molecules 20 19882 g002

2.1.3. Results of PCA

Large data sets are becoming more common in our scientific research, and PCA has turned out to be an extremely useful tool to reduce the computation burden [24]. In this study, we considered 18 common peaks areas of 24 samples as research objects. Therefore, the 18 common peak areas of different resolved components were analyzed in different samples and a new data matrix with dimensions 24 samples × 18 variables (components) was developed. The peak areas of 18 components in 24 samples are the elements of this new data matrix. For multivariate classification of chromatographic fingerprints, this new data matrix was calculated by PCA. Auto-scaling was chosen as a preprocessing step before PCA analysis [25]. In order to obtain more accurate and detailed information about the fingerprints, SPSS software was used for PCA. The result of the PCA showed that first six principal components (Z1 to Z6) contained 82.49% of the information of the original 18 indexes. The total variance explained in Table 2 shows the distribution of these 18 parameters. The 18 relations of first six components referencing to the Eigenvectors is as follows:
Z1 = 0.01x1 − 0.12x2 + 0.32x3 + 0.50x4 + 0.27x5 + 0.29x6 + 0.02x7 + 0.04x8 + 0.36x9 + 0.65x10 + 0.60x11 + 0.48x12 + 0.45x13 + 0.59x14 + 0.47x15 + 0.71x16 + 0.83x17 + 0.85x18
Z2 = −0.40x1 + 0.09x2 − 0.80x3 − 0.75x4 + 0.40x5 + 0.64x6 − 0.17x7 + 0.64x8 + 0.05x9 + 0.21x10 + 0.55x11 + 0.34x12 + 0.09x13 + 0.08x14 + 0.01x15 − 0.41x16 − 0.21x17 + 0.71x18
Z3 = −0.15x1 − 0.09x2 − 0.58x3 + 0.20x4 + 0.08x5 + 0.64x6 + 0.68x7 − 0.41x8 − 0.47x9 + 0.33x10 − 0.13x11 + 0.63x12 − 0.43x13 − 0.08x14 − 0.61x15 − 0.07x16 + 0.15x17 − 0.09x18
Z4 = −0.73x1 − 0.06x2 − 0.22x3 − 0.01x4 − 0.21x5 + 0.18x6 + 0.34x7 + 0.28x8 − 0.43x9 − 0.52x10 − 0.11x11 − 0.09x12 + 0.56x13 + 0.51x14 − 0.31x15 − 0.11x16 − 0.07x17 + 0.42x18
Z5 = −0.14x1 − 0.30x2 − 0.17x3 − 0.11x4 + 0.25x5 + 0.22x6 + 0.71x7 − 0.05x8 + 0.60x9 − 0.05x10 − 0.45x11 − 0.07x12 − 0.12x13 + 0.07x14 + 0.46x15 − 0.03x16 − 0.11x17 − 0.06x18
Z6 = −0.28x1 + 0.49x2 − 0.16x3 − 0.25x4 + 0.06x5 − 17x6 + 0.11x7 + 0.12x8 + 0.05x9 − 0.24x10 + 0.08x11 + 0.04x12 − 0.39x13 − 0.21x14 + 0.04x15 + 0.30x16 + 0.33x17 + 0.15x18
Table 2. Total Variance Explained.
ComponentInitial EigenvaluesExtraction Sums of Squared Loadings
Total% of VarianceCumulative %Total% of Variance
14.32424.02224.0224.32424.022
23.07517.08541.1073.07517.085
32.74115.22856.3352.74115.228
42.19212.17968.5132.19212.179
51.5698.71677.2301.5698.716
60.9475.26182.4900.9475.261
70.8164.53387.0230.8164.533
80.6993.88290.9060.6993.882
90.4072.26493.1690.4072.264
100.3461.92295.0920.3461.922
110.2671.48596.5770.2671.485
120.2211.23197.8070.2211.231
130.1590.88298.6890.1590.882
140.0990.55299.2410.0990.552
150.0810.45199.6920.0810.451
160.0400.22099.9130.0400.220
170.0130.07199.9840.0130.071
180.0030.016100.0000.0030.016
The absolute value of the coefficient before x1, x2, x3, …, x17 and x18 was the coefficient between the principal component and the 18th parameter. The bigger the coefficient of the parameter, the better the correlation the principal component had with the parameter. The Equations of (1)–(6) showed the values of Z1–Z6 (the first six principal components), which were mainly decided by x1, x2, x3, x7 and x18, showing that A1, A2, A3, A17 and A8 might the main influence in the Z1–Z6.

2.2. Results of Screening Differences Samples

On the basis of chromatographic fingerprints of the 24 batches of S. stolonifera and the chemometrics including similarity evaluation, PCA, and HCA, nine batches of S. stolonifera with different chemical profiles were selected for researches on their activities and for profile-efficiency study. The specific methods by which we chose these nine batches of S. stolonifega are as follows: the peaks of S2 (from Baiyun town, Douyun, China) have good resolution and therefore we selected it as the reference chromatogram when the HPLC fingerprint of other S. stolonifera extracts was established. According to the results of HCA, sample S15 was classified in cluster I. Besides, on the basis of the cluster II, PCA and common peaks area, we selected the other seven samples. Therefore, we choose the nine samples of different origins as follows: A (S2) from Baiyun town, Anshun city, China; B (S3) from Qingchang town, Bijie city, China; C (S4) from Yanxia town, Duyun city, China; D (S9) from Shuitian town, Guiyang city, China; E (S13) from Kaiyang Medicine Market, Guiyang city, China; F (14) from Censong town, Kaili city, China; G (S14) from Majiangxiasi town, Kaili city, China; H (S21) from Liutong town, Guiyang city, China; I (23) from Zhazuo town, Guiyang city, China were using pharmacodynamics analysis.

2.3. Results of Anti-Benign Prostatic Hyperplasia Activities

2.3.1. Effect of AESS on Prostate Index

The prostate index is an important indicator in BPH. The results were shown in Table 3. The PI showed a significant increase in the BHP model control group (51.52 ± 5.56 mg/100 g body weight, p < 0.01) compared with the AESS treated groups (AE) (p < 0.01) and sample G (p < 0.05). The finasteride control group and QLKT control group showed a significantly lower PI (p < 0.01) compared to the BHP model control group. The results showed that the animal model used in this study was suitable for evaluating the effect of AESS on the growth of the prostate. Administration of the tested sample significantly reduced the PI of BPH in our mouse, and the effects were similar to the currently-used drugs finasteride and QLKT.

2.3.2. Effect of Aqueous Extracts of S. stolonifera on Serum DHT Concentration

DHT is the product of the 5α-reduction of testosterone (T). The particular androgens were shown to be two or three times more potent than testosterone in target tissues. Because DHT could cause pathologic prostate growth, it can not only be detrimental in the adult prostate but also plays a beneficial role in the developing prostate [26]. Then, the level of DHT in serum was used to evaluate the effect of AESS in anti-benign prostatic hyperplasia. According to the result, the BHP model control group had significantly increased DHT levels (187.54 ± 29.75 nmol/L) compared with the control group (130.50 ± 15.41 nmol/L, p < 0.01). The Finasteride control group results were 126.47 ± 15.42 nmol/L, p < 0.01 and the QLKT control group results were 128.43 ± 18.00 nmol/L, p < 0.01. Administration of AESS from different habitats is shown in Table 3. Compared with the BHP model control group, all of the AESS from nine batches had a significantly (p < 0.01) lower serum DHT levels except both sample H and I (p < 0.05). This study confirmed that serum DHT concentration was significantly elevated in the mouse model of BPH and administration of the AESS all shows significantly reduces serum DHT concentration.

2.3.3. Effect of AESS on Serum ACP Activity

ACP is produced in the liver, spleen and prostate gland and it has long been used as a clinical serum biomarker of BPH and prostate cancer [27]. Therefore, the activity of ACP on the serum was chosen as the index of BPH. From the data in Table 3, the serum ACP activity of the BPH model control group (69.79 ± 8.45 IU/L) was significantly higher than that of the control group (47.89 ± 5.90 IU/L, p < 0.01). The finasteride control group, at a dose of 1 mg/kg, significantly decreased the serum activity of ACP (46.63 ± 8.49 IU/L, p < 0.01) in castrated mice treated with testosterone, compared to the BPH model control group. Mice which received QKPT administered orally (750 mg/kg body weight), had significantly decreased ACP serum activity (50.60 ± 7.84 IU/L, p < 0.01). The serum activity of ACP in castrated mice treated with testosterone and administered AESS was obviously lower than the BPH model control group (all p < 0.01). All of the test samples from different habitats displayed significantly decreasing serum ACP activity and similar effects as in the finasteride control group.
Table 3. Effect of aqueous extracts of S. stolonifera on the serum acid phosphatase (ACP) activity, prostate index (PI), and the concentration of serum dihydrotestosterone (DHT), prostatic acid phosphatase (PACP) and SRD5A2 in a castration and testosterone-induced mice model of benign prostatic hyperplasia (BPH).
GroupsProstatic Index (mg/100 g Body Weight)Serum DHT Concentration (nmol/L)Serum ACP Activity (IU/L)Serum PACP Concentration (ng/L)Serum SRD5A2 Concentration (pg/L)
control group36.42 ± 2.36 ##130.50 ± 15.41 ##47.89 ± 5.90 ##647.85 ± 54.63 ##78.23 ± 9.26 ##
BPH model control group51.52 ± 5.56187.54 ± 29.7569.79 ± 8.45816.66 ± 60.85125.23 ± 9.69
Finasteride control group35.15 ± 5.33 ##126.47 ± 15.42 ##46.63 ± 8.49 ##698.06 ± 32.38 ##90.72 ± 9.54 ##
QKPT control group36.11 ± 3.46 ##128.43 ± 18.00 ##50.60 ± 7.84 ##675.98 ± 55.81 ##89.86 ± 12.60 ##
group A37.47 ± 4.67 ##127.02 ± 14.80 ##50.23 ± 4.89 ##708.86 ± 40.00 ##101.04 ± 13.99 ##
group B37.22 ± 7.34 ##133.97 ± 7.79 ##54.23 ± 5.91 ##750.58 ± 47.51 #105.10 ± 6.61 #
group C38.57 ± 5.84 ##153.06 ± 28.35 ##55.18 ± 5.39 ##878.04 ± 50.05 #106.87 ± 19.10 #
group D38.09 ± 6.07 ##125.02 ± 13.57 ##48.76 ± 5.46 ##755.04 ± 42.58 #99.89 ± 8.35 ##
group E38.10 ± 5.03 ##143.39 ± 17.74 ##48.95 ± 6.24 ##755.50 ± 51.82 #102.15 ± 11.32 ##
group F41.07 ± 5.37 ##151.88 ± 22.64 ##48.92 ± 6.28 ##776.68 ± 68.20106.97 ± 15.05 #
group G41.57 ± 7.43 #129.50 ± 8.10 ##48.46 ± 6.57 ##769.71 ± 98.94108.68 ± 9.03 #
group H36.53 ± 5.32 ##162.25 ± 15.47 #52.14 ± 7.95 ##792.84 ± 36.84109.76 ± 10.09
group I39.70 ± 5.24 ##165.30 ± 19.39 #53.78 ± 8.57 ##746.88 ± 19.32 ##114.82 ± 7.74
Values are mean ± SD, n = 12/group; PI: prostatic index; DHT: dihydrotestosterone; ACP: acid phosphatase; PACP: prostatic acid phosphatase; SRD5A2: type 2,5-alpha-reductase. # p < 0.05; ## p < 0.01 vs. BPH model control group, one way ANOVA and Dunnett’s multiple comparisons t.

2.3.4. Effect of AESS on Serum PACP Concentration

PACP is a well-known prognostic biochemical indicator for diagnosis and often used to monitor the progression in BPH and prostate cancer. t is considered an essential regulator of cell growth and proliferation in the prostate. Generally speaking, PACP serum levels are abnormally elevated in the patients with BPH, when prostate cancer and patients with prostatic inflammatory conditions [28]. As the results in Table 3 show, the mice in the BPH model control group (816.66 ± 60.85 ng/L, p < 0.01) exhibited a significant increase compared to the control group (647.85 ± 54.63 ng/L, p < 0.01). However, the finasteride-treated group (698.06 ± 32.38 ng/L, p < 0.01) and QKPT control group (675.98 ± 55.81 ng/L, p < 0.01) decreased the level of PACP in serum more than the BPH group. At the AESS group, only sample E (769.71 ± 98.94 ng/L), G (776.68 ± 68.20 ng/L) and H (792.84 ± 36.84 ng/L) showed no significantly lower serum PACP concentration compared with BPH model control group. From the result, the significant increase in serum PACP concentration in the BPH model control group compared to the control group in the mice. Samples AE and I significantly reduced the PACP concentration in serum, but the effects were not the same. The reason for this might be because the different producing areas in the sample have different components.

2.3.5. Effect of AESS on Serum SRD5A2 Concentration

Two 5α-reductase isozymes responsible for testosterone converted to DHT in the body and type-1,5-reductase is expressed in the skin and liver and type-2,5-reductase predominates in the prostate, respectively [29]. Then, all mice type-2,5-reductase concentration in serum has been monitored, to evaluate the therapeutic effects of BPH. As the results in Table 3 show, the BPH model control group exhibited significant increases in the levels of SRD5A2 in serum (125.23 ± 9.69 pg/L, p < 0.01) compared with the control group (78.23 ± 9.26 pg/L). However, the finasteride control group (90.72 ± 9.54 pg/L, p < 0.01) and QKPT control group (89.86 ± 12.60 pg/L, p < 0.01) decreased the level of SRD5A2 in serum more than the BPH group. In the AESS group, only sample H (400.53 ± 12.81 pg/L) and I (114.82 ± 7.74 pg/L) did not decrease the level of SRD5A2 in serum compared with the BPH group, other samples show significant decreases in the levels of SRD5A2 in serum compared with the BPH group. In the present study, most of the samples showed significantly reduced levels of SRD5A2 in serum except samples H and I. These findings in combination with the results of the indicators assay suggest that AESS is an effective treatment for BPH.

2.4. Analysis of Spectrum-Effect Relationship

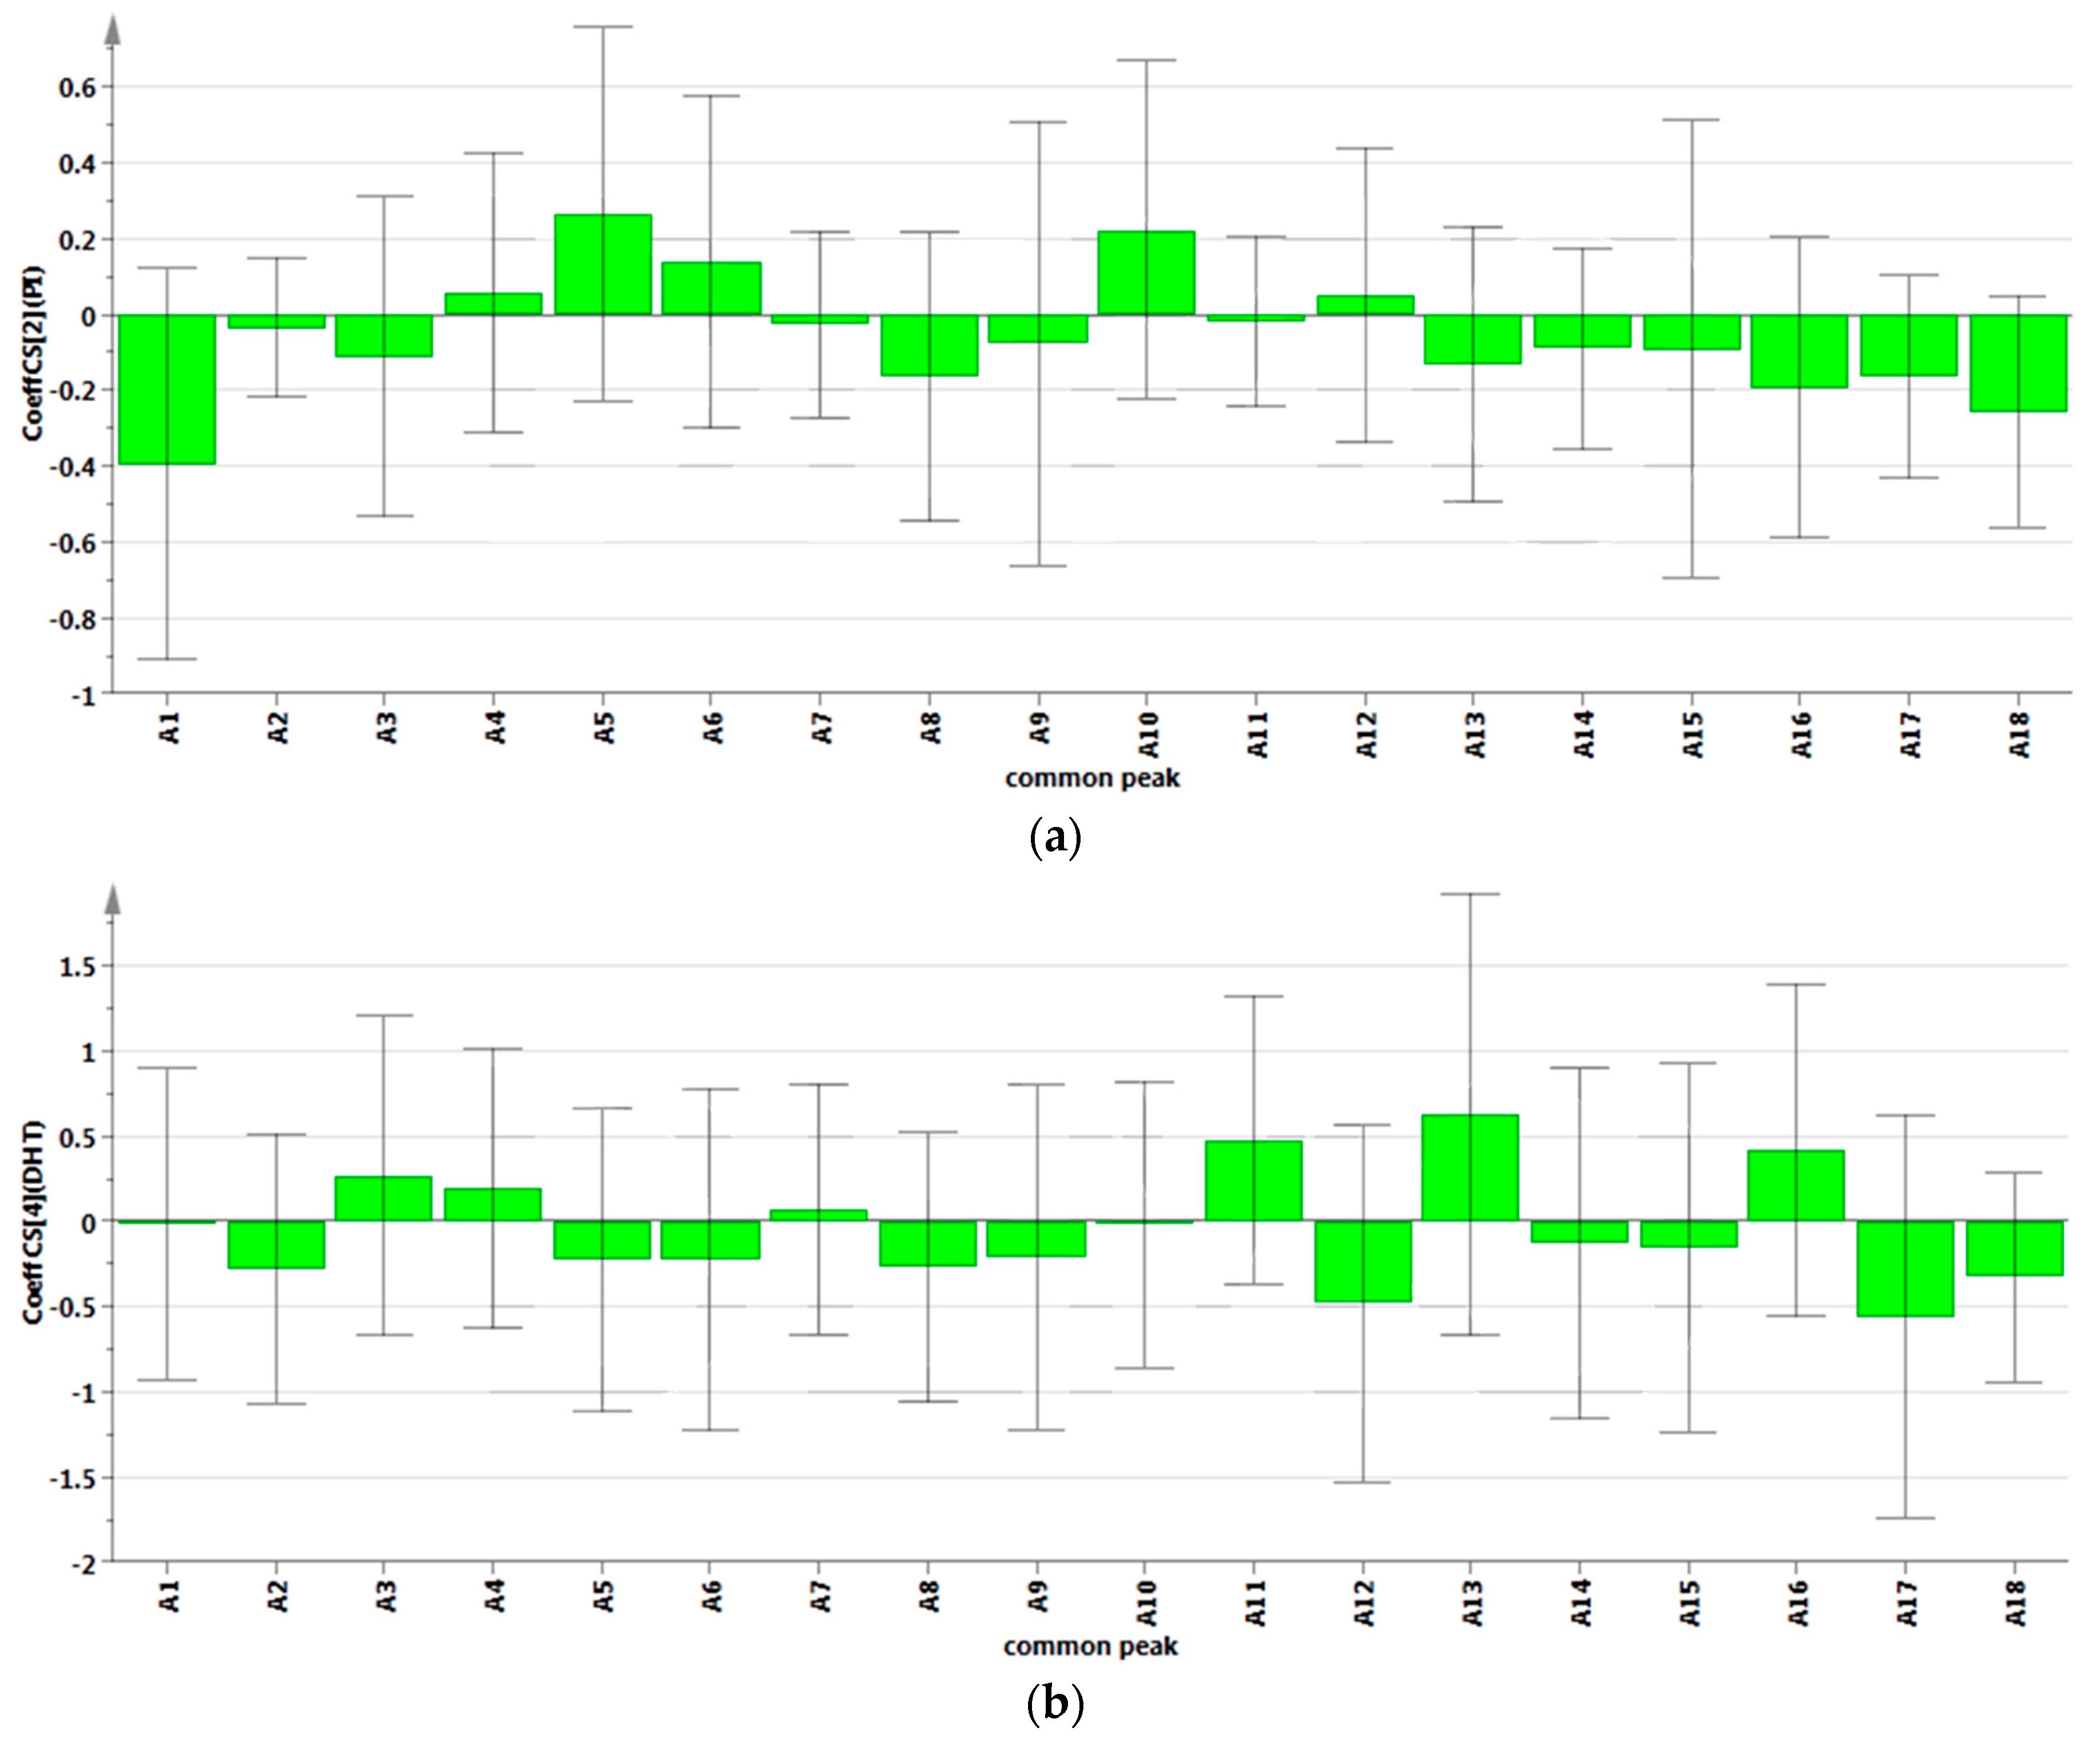
2.4.1. Results of Grey Relational Analysis

In the present study, the five pharmacodynamics indexes (PI, DHT, ACP, PACP, and SRD5A2) were chosen as five reference series and the 18 values of peak areas were chosen as compared series. Then, the GRD between the compared and reference series was calculated with a resolution ratio of 0.5. The higher the GRD, the greater the effect of anti-benign prostatic hyperplasia. The grey system theory used Grey Modeling software (Grey relational degree V6.0, Nanjing University of Aeronautics and Astronautics, Nanjing, China). The grey relational grade is shown in Table 4. As given in Table 4, the average GRG between the five pharmacodynamics indexes and the 18 values of peak areas and were as follows: A18 > A14 > A17 > A16 > A4 > A13 > A15 > A9 > A1 = A10 > A11 > A7 > A5 > A3 > A12 > A6 > A8 > A2. A18 indicated a relatively high influence for anti-benign prostatic hyperplasia, A14 and A17 showed a noticeable influence for anti-benign prostatic hyperplasia, A16, A4, A13, A15, A9, A1 and A10 remained a small influence for anti-benign prostatic hyperplasia, and A11, A7, A5, A3, A12, A6, A8 and A2 contained a negligible influence for anti-benign prostatic hyperplasia. Then, A18, A17 and A14 were greater than other peaks, which suggested that the three components had marked influence. The peak of the A18 is the level with the highest grey relational grade, suggesting that A18 common peak of S. stolonifera may be the active ingredient for anti-benign prostatic hyperplasia. At the same time, both of A14 and A17 peaks had a higher grey relational grade than the other compounds, which indicated that the two compositions had a relatively high influence on anti-benign prostatic hyperplasia. Therefore, the three constituents were considered as key components which could play very important roles on bioactivities. However, further statistical analysis process needed to be done to find whether the grey relational grade performed positive correlation or negative correlation on treatment of BHT.
Table 4. The calculated grey relational coefficient and grey relational grade for 18 comparability sequences and their order.
NO.Y1Y2Y3Y4Y5AverageOrder
A10.5730.6510.5840.6410.5730.6049
A20.5220.5250.4960.6200.5220.53717
A30.5570.6300.5360.6400.5570.58413
A40.6260.6980.5950.6730.6260.6445
A50.5660.6210.5390.6590.5660.59012
A60.5320.5830.5340.6410.5320.56415
A70.5670.6380.5640.6440.5670.59611
A80.5250.5870.5140.6080.5250.55216
A90.6190.6150.6500.6360.6190.6288
A100.5880.6440.5460.6550.5880.6049
A110.5790.5810.5480.7020.5790.59810
A120.5550.6220.5380.6460.5550.58314
A130.6230.6410.6110.7160.6230.6436
A140.7240.7330.6690.7740.7240.7252
A150.6310.6220.6610.6210.6310.6337
A160.6560.6350.6500.6560.6560.6514
A170.7360.6580.7040.6770.7360.7023
A180.8690.7440.8380.8190.8690.8281

2.4.2. Results of Partial Least Squares Regression Analysis

The relationship between the 18 compounds and the five indicates about BPH were used to build the regression models, the regression coefficient were shown Figure 3. The regression equation obtained for PLS model is given as follows:
Y (PI) = −0.39A1 − 0.03A2 − 0.11A3 + 0.06A4 + 0.26A5 + 0.14A6 − 0.03A7 − 0.16A8 − 0.08A9 + 0.22A10 − 0.02A11 + 0.05A12 − 0.13A13 − 0.09A14 − 0.09A15 − 0.19A16 − 0.16A17 − 0.25A18
Y (DHT) = −0.01A1 − 0.27A2 + 0.26A3 + 0.19A4 − 0.22A5 − 0.23A6 + 0.07A7 − 0.26A8 − 0.20A9 − 0.02A10 + 0.48A11 − 0.48A12 + 0.63A13 − 0.12A14 − 0.15A15 + 0.42A16 − 0.56A17 − 0.33A18
Y (ACP) = 0.32A1 − 0.10A2 + 0.09A3 + 0.16A4 − 0.44A5 + 0.06A6 − 0.28A7 − 0.06A8 − 0.22A9 − 0.19A10 + 0.53A11 − 0.28A12 + 0.47A13 + 0.13A14 − 0.32A15 + 0.52A16 − 0.45A17 − 0.16A18
Y (PACP) = 0.52A1 − 0.41A2 − 0.12A3 + 0.59A4 − 0.42A5 + 0.74A6 − 0.61A7 − 0.19A8 + 0.07A9 + 0.04A10 + 0.07A11 + 0.16A12 − 0.33A13 + 0.45A14 − 0.41A15 + 0.61A16 − 0.52A17 − 0.55A18
Y (SRD5A2) = −0.19A1 − 0.17A2 + 0.02A3 + 0.04A4 − 0.03A5 + 0.09A6 − 0.01A7 − 0.19A8 + 0.02A9 + 0.13A10 + 0.29A11 − 0.25A12 + 0.41A13 − 0.18A14 + 0.04A15 + 0.12A16 − 0.43A17 − 0.24A18
Equations (7)–(11) were the regression models of 18 common peaks area values and mice serum ACP activity, PI, and the concentration of serum DHT, PACP and SRD5A2, respectively. Equation (7) and Figure 3a shows that A1–A3, A7, A8, A11, A13–A18 were in positive correlation with IP. However, A4–A6, A9, A10, A12 and A13 showed negative correlation with reduced IP. We extracted two principal components R2 = 0.9090, which indicated that the regression model had 0.9090 explanatory power for reduced PI, which indicated that the model has high precision. A1, A18, A8 and A17 were higher correlation compared with other compounds, which denotes that the four compounds have good effect in reduced PI. Y (DHT) and Figure 3b is the regression model of serum DHT concentration and its regression coefficient figure, respectively. From Equation (8) and Figure 3b, A1, A2, A5, A6, A8–A10, A12, A15, A17 and A18 were in positive correlation with a reduction in the concentration of serum DHT, when three principal components R2 = 0.8321 were extracted. This indicated that the regression model prediction accuracy was satisfactory. As shown in Equation (9) and Figure 3c, the model has high explanatory power for reduced mice serum ACP activity (R2 = 0.7659), when three main components have been extracted. A17, A5, A15 and A7 showed a greater reduction in serum ACP activity than other common peaks, which denotes that this compound may be one of the main compounds in reduced serum ACP activity. Equation (9) and Figure 3c were the regression equation and regression coefficient figure obtained for the PLS model, when three principal components R2 = 0.8271 were extracted. As Equation (10) and Figure 3d show, A7 is the most important property to describe the anti-prostate hyperplasia activity followed byA18, A17, A5, A2, A15, A13, A8 and A3, and all these common peaks were directly correlated with a reduction in the concentration of serum PACP. The remained compounds were shown to have inverse correlation. Equation (11) and Figure 3e show the PLS regression equation and regression coefficient figure when three principal components were extracted. For R2 = 0.8273, the model has high explanatory power for reduced mice serum SRD5A2 concentration. Y (SRD5A2) is directly correlated with A17, A12, A18, A1, A2, A14, A8, A5 and A7. An inverse correlation is observed between A13, A11, A10, A16, A6, A4, A3 and A9. The results showed that increasing A17, A12, A18, A1, A2, A14, A8, A5 and A7 and reducing A 13, A11, A10, A16, A6, A4, A3 and A9 peak area can reduce the mice serum SRD5A2 concentration.
Figure 3. Regression coefficient figure of the 18 compounds and the five indicates about benign prostatic hyperplasia. (a) is the regression coefficient figure of PI and the 18 compounds; (b) is the regression coefficient figure of DHT and the 18 compounds; (c) is the regression coefficient figure of ACP and the 18 compounds; (d) is the regression coefficient figure of PACP and the 18 compounds; (e) is the regression coefficient figure of SRD5A2 and the 18 compounds.
Molecules 20 19882 g003aMolecules 20 19882 g003b

3. Experimental Section

3.1. Materials

Twenty-four batches of S. stolonifera samples from various sources (Table 1) were authenticated by Deyuan Chen (Guiyang College of TCM, Guiyang, China). One hundred grams of S. stolonifera was macerated in 1000 mL of water for 30 min and decocted with water three times (3 h each time). The filtrates from each decoction were blended and concentrated to a thick solution using a rotary evaporator, the conditions of concentrating the extract were 60 °C, 20 rpm, and −0.09 MPa. The concentrated sample was dried in vacuum oven and so did the dried powders. All of the 24 batches of S. stolonifera were decocted and dried with the same procedure. The dried powders was weighed and stored in a sealed container in a refrigerator at a temperature of −20 ± 2 °C until use. Methanol (MeOH) of chromatographic grade was purchased from Tedia Chemicals (Faireld, OH, USA), as well as the HPLC grade phosphoric acid with a purity of 99% (Houston, TX, USA). Finasteride was obtained from Merck (Hangzhou, China). Testosterone propionate was manufactured by Shanghai GM Pharmaceutical Co., Ltd. (Shanghai, China). Qianlie Kang Pule’an Tablet was obtained from Zhejiang Conba Pharmaceutical (Lanxi, China), each individual Qianlie Kang Pule’an Tablet (QKPT) consists of 0.5 g of the Brassica campestris L. pollen without any additional ingredients. In the present study all the enzyme-linked immunosorbent assay (ELISA) kits were obtained from Shanghai MLBIO Biotechnology Co., Ltd (Shanghai, China). All other chemicals and solvents used were of analytical grade.
One hundred and fifty-six adult Chinese KM male mice, Specific pathogen-free (SPF, Certificate No. SCXK 2014-0011) grade, weighing 18–22 g were purchased from Changsha Tianqi Biotechnology Co., Ltd. (Changsha, China) for this study. The mice were acclimatized to laboratory environment (20–25 °C) with a 12 h light-darkness cycle for 3 days prior to experimentation. Temperature, humidity, and light conditions in the mice environment were kept constant, with food and water provided ad libitum. Animal care and experiments were conducted in accordance with the guidelines of the Chinese Council on Animal Care and approved by the Guizhou Normal University Animal Care and Use Committee.

3.2. Instruments

HPLC fingerprints of AESS from 24 different regions samples were performed using Thermo Scientific DIONEX UltiMate 3000 system (Waltham, MA, USA), consisting of binary solvent delivery pump, auto sampler manager, column compartment, photo diodearray detector and Chromeleon 7.1 ChemStation (Thermo Scientific, Waltham, UK). The weighing was done with AL204 1/10,000 electronic analytical balance and XS-105DU 1/100,000 electronic analytic balance from Mettler Toledo Instruments (Shanghai) Co., Ltd. (Shanghai, China). The levels of type II 5-alpha-reductase (SRD5A2), acid phosphatase (ACP), prostatic acid phosphatase (PACP) and DHT in serum were measured by Spectra Max 484 Molecular Devices Co., Ltd. (New York, NY, USA).

3.3. Determination of HPLC Fingerprints

3.3.1. Chromatographic Separation

Chromatographic separations were carried out on a Diamonsil C18 column (4.6 mm × 250 mm, 5 μm), column temperature was set at 30 °C. The mobile phase consisted of methanol (A) and water (containing 0.05% phosphoric acid) with the following gradient elution: 0–5 min, 99% B; 5–8 min, 99%–98% B; 8–19 min, 98%–87% B; 19–22 min, 87%–85% B; 22–35 min, 85%–80% B; 35–38 min, 80%–70% B; 38–53 min, 70%–65% B; 53–63 min, 65%–60% B; 63–73 min, 60%–55% B; 73–83 min, 55%–50% B; 83–93 min, 50%–15% B. Flow rate was 0.7 mL/ min−1 and an injection volume of 20 μL. The DAD detection wavelength was set at 256 nm and temperature of the auto-sampler was maintained at 30 °C.

3.3.2. Solution’s Preparation

An equivalent to 2.0 g of dry S. stolonifera extracts powder was accurately weighed and fully dissolved into 24 mL water. The extracted solution was filtered through a 0.45 μm micropore film. All of the 24 batches of S. stolonifera extracts powder were prepared with the same procedure for HPLC fingerprint analysis.

3.3.3. Similarity Analysis (SA)

Twenty-four batches of S. stolonifera collected from various locations were analyzed under optimal conditions, and matched automatically by professional software named Similarity Evaluation System (SES) for Chromatographic Fingerprint of Traditional Chinese Medicine, composed by Chinese Pharmacopoeia Committee (Version 2004 A; Beijing, China). Then, the reference chromatograms were generated by this system using the Median method from the general comparison of the chromatograms of 24 batches of S. stolonifera extracts. The similarities between the entire chromatographic profiles of 24 batches of S. stolonifera and the reference chromatogram were evaluated by SES software. The differences of correlation coefficients indicated variation of the fingerprint and internal qualities of these samples.

3.3.4. Hierarchical Clustering Analysis (HCA)

HCA is a way of grouping pattern vectors which is used to find relatively homogeneous clusters of cases based on measured characteristics. This technique starts with each case in a separate cluster and then combines the clusters sequentially, reducing the number of clusters at every step until all the objects or sample clustered into one category. The similarity or dissimilarity between samples (objects) is usually represented as a tree or dendrogram for ease of interpretation [30]. In this study, the HCA of samples was performed by SPSS software (SPSS for Windows20.0, SPSS Inc., Armonk, NY, USA).

3.3.5. Principal Component Analysis

In many cases, a number of variables need to be analyzed to achieve a comprehensive evaluation. Therefore, date decompositions should be conducted to reduce multidimensional data sets to lower dimensions. Among these techniques, Principal component analysis (PAC) is a very useful tool of data processing for data compression and information extraction which visualizes the main relationships that exist among a large number of variables in terms of a smaller number or potential factors without losing much information by extracting data, removing redundant information, and highlighting hidden features [31]. Here, SPSS computer software (SPSS for Windows20.0, SPSS Inc.) was used to evaluate the differences among the 24 samples by analyzing the relative 18 common peaks.

3.3.6. Screening for Differences between Samples

Based on the chromatographic fingerprints, those samples with significant variations in chemical profiles were selected to investigate their anti-benign prostatic hyperplasia bioactivities as well as profile-effect correlations.

3.4. Anti-Benign Prostatic Hyperplasia Experimentation

3.4.1. Castration Procedure

To exclude the influence of intrinsic testosterone, all mice but twelve were anesthetized by inhalation of isoflurane and castrated after intramuscular administration of penicillin (7.14 × 10⁴ IU/kg body weight). Castration was performed by removing the testicles and epididymal fat through the scrotal sac, according to the method published previously [32].

3.4.2. Induction of BPH and Treatments

In the present study, the mice were randomly divided into 13 groups (n = 12 each) as follows: (1) the control group, which received NS administered orally and placebo injections of the olive oil injected subcutaneously (s.c.); (2) BPH model control group, which received NS administered orally and testosterone propionate (TP) (7.5 mg/kg body weight, s.c.); (3) positive control group, which received finasteride (1 mg/kg body weight) administered orally and TP (7.5 mg/kg body weight, s.c.); (4) Qianlie Kang Pule’an Tablet (QKPT) control group, which received QKPT (750 mg/kg body weight) administered orally and TP (7.5 mg/kg body weight, s.c.); (5–13) nine samples (from the results of screening differences samples) of AESS (equivalent to 4 g dry S. stolonifera/kg body weight) orally administered and TP (7.5 mg/kg body weight, s.c.). All mice were treated once a day for two weeks. Body weight was measured once the three days during the experiment. The application volume was calculated in advance, based on the most recent recorded body weight of individual animals. At the end of the experimental period, mice were fasted for 12 h after administration of last dose. Blood samples were drawn from the retro-orbital blood vessels and then the mice were euthanized. The prostate gland was freed from connective tissues, excised and weighed. The prostate organs were immediately fixed in 10% buffered formaldehyde solution and stored at −20 °C for histological analysis.

3.4.3. Determination of Prostatic Index (PI)

Prostate weight (PW) to body weight (BW) ratio of the mice in each group was calculated. The PI was calculated as: PW/BW × 100. The mean PI ratios were calculated of each group.

3.4.4. Immunohistochemical Analysis

All the blood samples were centrifuged at 5 kg for 10 min at 4 °C to obtain serum for determination of DHT, ACP, PACP and SRD5A2 by enzyme-linked immunosorbent assay (ELISA) kits. Test was carried out according to the manufacturer’s instructions. Values were expressed as per L in serum (Table 3).

3.4.5. Statistical Analysis

Data were expressed as means ± standard deviation (SD) values. Statistical analysis of the data was assessed using analysis of variance (ANOVA) followed by the Dunnett’s multiple comparison test, using SPSS computer software Version 20 (New York, NY, USA). The levels of significance were set at p < 0.05, p < 0.01.

3.5. Spectrum-Effect Relationship Analysis

3.5.1. Grey Relational Analysis

Grey relational analysis (GRA) is an important branch of grey system theory which has been successfully applied to solve many concrete real-world problems that have complicated interrelationships between multiple factors and variables [33]. Overall, the basic principle of the GRA is analyze the degree of approximation of the factors and variables in large the data sets when there is insufficient information, and according to the analysis result estimate correlation of factors and variables [34]. Then, GRA can help to compensate for the shortcomings in statistical regression when experiments are ambiguous or when the experimental method cannot be carried out exactly. In view of this, GRA was used to analysis the spectrum-activity relationships between chemical fingerprint and anti-benign prostatic hyperplasia bioactivity of the AESS, in present study.

3.5.2. Partial Least Squares Regression

Partial least squares regression (PLSR) is a frequently applied technique that specifies a linear relationship between a set of dependent variables from a large set of independent variables, especially when the sample size is small relative to the dimension of these variables. It was originally proposed in economics and chemo metrics as an alternative approach to OLS in ill-conditioned linear regression problems. However, now, it has been successfully extended to other scientific areas, such as bioinformatics, economics, and medicine, etc. [35,36]. In this study, PLSR was used to model the correlation between 18 common peaks (predictor variables) and the five indicates (response variable) of anti-benign prostatic hyperplasia, respectively. The PLSR modeling was performed using software Simca-p (Simca-p13.0, Umetrics, Umeå, Sweden). More detailed description of the PLSR technique can be found in [37,38].

4. Conclusions

In this study, the chemical fingerprints of 24 batches of S. stolonifera sample from various sources were established by HPLC-DAD. Then, the anti-benign prostatic hyperplasia effects of these samples were determined, using a testosterone-induced BPH mouse model. With the help of GRA and PLSR, the relationship between the fingerprints and efficacy of S. stolonifera was elucidated. The results showed that the 24 batches of S. stolonifera from different habitats, harvest season and processing methods may lead to different quality and pharmacological activity. Under this experimental condition, greater relatively differences in mice with PI, DHT, PACP SRD5A2 and ACP of these nine batches of S. stolonifera has been proved from different resources. From the result of GRA, considering the five indexes (PI, DHT, ACP, PACP and SRD5A2) of BPH, A14, A17 and A18 showed relatively higher GRA than other common peaks. PLSR results were shown in Equations (7)–(11) and Figure 3. A2, A8, A17 and A18 all showed negative correlation with these five indicators, but A4 was positively correlated with all the five indicators. Besides, A1, A3, A5, A6, A7, A9, A10, A11, A12, A13, A14, A15 and A16 can reduce some of these indicators. According to the result of GRA and PLSR, the strength of anti-benign prostatic hyperplasia bioactivity AESS was mainly affected by A14 (Chlorogenic acid), A17 (Quercetin 5-O-β-d-glucopyranoside) and A18 (Quercetin 3-O-β-l-rhamnopyranoside). That is to say, chlorogenic acid, quercetin 5-O-β-d-glucopyranoside and quercetin 3-O-β-l-rhamnopyranoside might be the main active components affecting anti-benign prostatic hyperplasia bioactivity of S. stolonifera. Based on the studies above, further study is needed to investigate these three components in the anti-prostate hyperplasia activities. The investigation of HPLC fingerprints and anti-prostate hyperplasia activities relationships of S. stolonifera based on HPLC, GRA, and PLSR could provide a tool to evaluate the differences of internal quality and anti-prostate hyperplasia activities of S. stolonifera, providing a sound experimental foundation and model for its study.

Acknowledgments

The authors gratefully acknowledge the financial support of the present work by Guizhou province science and technology plan projects (KY-2012-005, and 2013-2069).

Author Contributions

Xin Zhou and Hua-Guo Chen conceived and designed the experiments; Xing-Dong Wu performed the experiments; Ya Huang and En-Ming Hu analyzed the data; Zheng-Meng Jiang, Chao Zhao, Xiao-Jian Gong, and Qing-Fang Deng contributed reagents/materials/analysis tools; Xing-Dong Wu wrote the paper.

Conflicts of Interest

The authors declare no conflict of interest.

References

  1. Pagano, E.; Laudato, M.; Griffo, M.; Capasso, R. Phytotherapy of benign prostatic hyperplasia. A minireview. Phytother Res. 2014, 28, 949–955. [Google Scholar] [CrossRef] [PubMed]
  2. Zhou, X.; Chen, H.G.; Huang, Z.J.; Yang, S.L. Screening of anti-prostate-tumor parts from Saxifraga stolonifera. Chin. Pharm. Bulletin. 2013, 29, 867–870. [Google Scholar]
  3. Chen, Z.; Liu, Y.M.; Yang, S.; Song, B.A.; Xu, G.F.; Bhadury, P.S. Studies on the chemical constituents and anticancer activity of Saxifraga stolonifera (L.) Meeb. Bioorg. Med. Chem. 2008, 16, 1337–1344. [Google Scholar] [CrossRef] [PubMed]
  4. Yang, P.; Zhang, Q.Y. Saxifrage research on biological activity and pharmacological effects. Chin. J. Anhui Agric. Sci. 2014, 42, 5422–5424. [Google Scholar]
  5. Liu, J.; Jiao, S.R.; Sun, X.; Tang, Y.M.; Feng, H. The extraction of antioxidants from Saxifraga stolonifera and component analysis. Chin. J. Bioprocess Eng. 2012, 10, 42–46. [Google Scholar]
  6. Daniel, K.A.; George, A.; Asare, K.B.; Samuel, A.; Lin, J.M.; Peng, J.; Hong, Z.F. Treatment of benign prostatic hyperplasia with croton membranaceus in an experimental animal model. J. Ethnopharmacol. 2014, 157, 90–98. [Google Scholar]
  7. Fourcade, R.O.; Theret, N.; Taieb, C. Profile and management of patients treated for the first time for lower urinary tract symptoms/benign prostatic hyperplasia in four European countries. BJU Int. 2008, 101, 1111–1118. [Google Scholar] [CrossRef] [PubMed]
  8. Agrawal, M.; Nahata, A.; Dixit, V.K. Protective effects of Echinops echinatus on testosterone-induced prostatic hyperplasia in rats. Eur. J. Integr. Med. 2012, 4, 177–185. [Google Scholar] [CrossRef]
  9. Zabkowski, T. Evaluation of the clinical indications, adverse drug reactions, and finasteride use in patients with benign prostatic hyperplasia in Poland. Pharmacol. Rep. 2014, 66, 565–569. [Google Scholar] [CrossRef] [PubMed]
  10. Kumar, V.L.; Wahane, V.D. Current status of 5a-reductase inhibitors in the treatment of benign hyperplasia of prostate. Indian. J. Med. Sci. 2008, 62, 167–175. [Google Scholar]
  11. William, D.S. 5α-Reductase activity in the prostate. Urology 2001, 58, 17–24. [Google Scholar]
  12. Harkaway, R.C.; Issa, M.M. Medical and minimally invasive therapies for the treatment of benign prostatic hyperplasia. Prostate Cancer Prostatic Dis. 2006, 9, 204–214. [Google Scholar] [CrossRef] [PubMed]
  13. Nickel, J.C.; Gilling, T.L.; Morrill, B.; Wilson, T.H.; Rittmaster, R.S. Comparison of dutasteride and finasteride for treating benign prostatic hyperplasia the enlarged prostate international comparator study (EPICS). BJU Int. 2011, 108, 388–394. [Google Scholar] [CrossRef] [PubMed]
  14. Wang, R.; Kobayashi, Y.; Lin, Y.; Rauwald, H.W.; Fang, L.; Qiao, H.; Kuchta, K. A phytosterol enriched refined extract of Brassica campestris L. pollen significantly improves benign prostatic hyperplasia (BPH) in a rat model as compared to the classical TCM pollen preparation Qianlie Kang Pule’an Tablets. Phytomedicine 2015, 22, 145–152. [Google Scholar] [CrossRef] [PubMed]
  15. Zambra, F.M.; Biolchi, V.; Brum, I.S.; Chies, J.A. CCR2 and CCR5 genes polymorphisms in benign prostatic hyperplasia and prostate cancer. Hum. Immunol. 2013, 74, 1003–1008. [Google Scholar] [CrossRef] [PubMed]
  16. Shin, I.S.; Lee, M.Y.; Jung, D.Y.; Seo, C.S.; Ha, H.K.; Shin, H.K. Ursolic acid reduces prostate size and dihydrotestosterone level in a rat model of benign prostatic hyperplasia. Food Chem. Toxicolo. 2012, 50, 884–888. [Google Scholar] [CrossRef] [PubMed]
  17. Song, X.Y.; Li, Y.D.; Shi, Y.P.; Jin, L.; Chen, J. Quality control of traditional Chinese medicines a review. Chin. J. Nat. Med. 2013, 11, 596–607. [Google Scholar] [CrossRef] [PubMed]
  18. Zhao, G.; Peng, L.X.; Wang, S.; Hu, Y.B.; Zou, L. HPLC fingerprint-antioxidant properties study of buckwheat. J. Integr. Agri. 2012, 11, 1111–1118. [Google Scholar] [CrossRef]
  19. Kong, W.; Wang, J.; Zang, Q.; Xing, X.; Zhao, Y.; Liu, W.; Jin, C.; Li, Z.; Xiao, X. Fingerprint-efficacy study of artificial Calculus bovis in quality control of Chinese materia medica. Food Chem. 2011, 127, 1342–1347. [Google Scholar] [CrossRef] [PubMed]
  20. Zhu, H.; Bi, K.; Han, F.; Guan, J.; Tang, Z.; Chen, K.; Zhao, L.; Li, Q.; Yin, R.; Hou, X. Simultaneous determination of two iridoid glycosides, two anthraquinones and four flavonoid glycosides of Zhi-Zi-Da-Huang decoction in rat plasma by UFLC-MS/MS: Application to a comparative pharmacokinetic study in normal and cholestatic liver injury rats. J. Chromatogr. B 2014, 960, 116–125. [Google Scholar] [CrossRef] [PubMed]
  21. Jin, J.H.; Chun, E.H.; Hyun, J.H.; Choi, S.W.; Su, S.T.; Kim, W.; Kim, D.O.; Kim, B.Y.; Baik, M.Y. Optimization of hot water extraction and ultra high pressure extraction for deer antler. Food Sci. Biotechnolo. 2015, 24, 507–512. [Google Scholar] [CrossRef]
  22. State Food and Drug Administration of China. Technical requirements for chromatographic fingerprints of traditional Chinese medicinal injection. Chin. Tradit. Pat. Med. 2000, 22, 671–678. [Google Scholar]
  23. Wang, X.W.; Zang, W.Y.; Bi, K.R. Approaching the study on the similarity analysis of HPLC fingerprints spectra for traditional Chinese medicines. J. Shenyang Pharm. Univ. 2003, 20, 360–366. [Google Scholar]
  24. Calhoun, V.D.; Silva, R.F.; Adali, T.; Rachakonda, S. Comparison of PCA approaches for very large group ICA. NeuroImage 2015, 118, 662–666. [Google Scholar] [CrossRef] [PubMed]
  25. Hakimzadeh, N.; Parastar, H.; Fattahi, M. Combination of multivariate curve resolution and multivariate classification techniques for comprehensive high-performance liquid chromatography-diode array absorbance detection fingerprints analysis of Salvia reuterana extracts. J. Chromatogr. A 2014, 1326, 63–72. [Google Scholar] [CrossRef] [PubMed]
  26. Carson, C.; Rittmaster, R. The role of dihydrotestosterone in benign prostatic hyperplasia. Urology 2003, 61, 2–7. [Google Scholar] [CrossRef]
  27. Goto, T.; Kawano, H.; Akiyama, T.; Shinoda, Y.; Okuma, T.; Kobayashi, H.; Nemoto, T.; Funata, N. Serum acid phosphatase can be a useful tumour marker for giant cell tumour of bone. Arch. Orthop. Trauma Surg. 2009, 129, 1641–1644. [Google Scholar] [CrossRef] [PubMed]
  28. Eri, L.M.; Tveter, K.J. Effects of bicalutamide and leuprolide on prostate-specific antigen (PSA) acid phosphatase (ACP). Prostate Cancer Prostatic Dis. 2001, 4, 173–177. [Google Scholar] [CrossRef] [PubMed]
  29. Chan, A.O.; But, B.W.; Lee, C.Y.; Lam, Y.Y.; Ng, K.L.; Tung, J.Y.; Kwan, E.Y.; Chan, Y.K.; Tsui, T.K.; Lam, A.L.; et al. Diagnosis of 5α-reductase 2 deficiency: is measurement of dihydrotestosterone essential? Clin. Chem. 2013, 59, 798–806. [Google Scholar] [CrossRef] [PubMed]
  30. Kannel, P.R.; Lee, S.; Kanel, S.R.; Khan, S.P. Chemometric application in classification and assessment of monitoring locations of an urban river system. Anal. Chim. Acta 2007, 582, 390–399. [Google Scholar] [CrossRef] [PubMed]
  31. Zheng, F.; Zhao, L.; Wang, J.B.; Liu, T.T.; Zhang, B.; Gong, M. Spectrum-effect relationships between UPLC fingerprints and bioactivities of crude secondary roots of Aconitum carmichaelii Debeaux (Fuzi) and its three processed products on mitochondrial growth coupled with canonical correlation analysis. J. Ethnopharmacol. 2014, 153, 615–623. [Google Scholar] [CrossRef] [PubMed]
  32. Coppenolle, F.V.; Bourhis, X.; Carpentier, F.; Delaby, G.; Cousse, H.; Raynaud, J.P.; Prevarskaya, N. Pharmacological effects of the lipidosterolic extract of Serenoa repens (Permixon) on rat prostate hyperplasia induced by hyperprolactinemia: comparison with finasteride. Prostate 2000, 43, 49–58. [Google Scholar] [CrossRef]
  33. Wei, H.; Lin, L.; Zhang, Y.; Wang, L.; Chen, Q. Research on the application of grey system theory in the pattern recognition for chromatographic fingerprints of traditional Chinese medicine. Chin. J. Chromatogr. 2013, 31, 127–132. [Google Scholar] [CrossRef]
  34. Abhang, L.B.; Hameedullah, M. Determination of optimum parameters for multi-performance characteristics in turning by using grey relational analysis. Int. J. Adv. Manuf. Tech. 2012, 63, 13–24. [Google Scholar] [CrossRef]
  35. Zhang, Q.; Bai, Y.; Lei, J.W.; Xie, C.X.; Fan, M.Y.; Hu, X.L. Rapid determination of water-extract in jingutongxiao pills by near-infrared spectroscopy. Chin. J. Exp. Trad. Med. Formul. 2015, 21, 52–55. [Google Scholar]
  36. Li, F.; Mistele, B.; Hu, Y.; Chen, X.U. Reflectance estimation of canopy nitrogen content in winter wheat using optimised hyperspectral spectral indices and partial least squares. Eur. J. Agron. 2014, 52, 198–209. [Google Scholar] [CrossRef]
  37. Wold, S.; Sjöström, M.; Eriksson, L. PLS-regression: A basic tool of chemometrics. Chemom. Intell. Lab. 2001, 58, 109–130. [Google Scholar] [CrossRef]
  38. Molfetta, F.A.; Bruni, A.T.; Rosselli, F.P.; Silva, A.B.F. A partial least squares and principal component regression study of quinone compounds with trypanocidal activity. Struct. Chem. 2006, 18, 49–57. [Google Scholar] [CrossRef]
  • Sample Availability: Samples of the compounds Chlorogenic acid, Quercetin 5-O-β-d-glucopyranoside and Quercetin 3-O-β-l-rhamnopyranoside are available from the authors.

