
Protective Effects of Red Guava on Inflammation and Oxidative Stress in Streptozotocin-Induced Diabetic Mice

 ,
,
Abstract
:1. Introduction
2. Results and Discussion
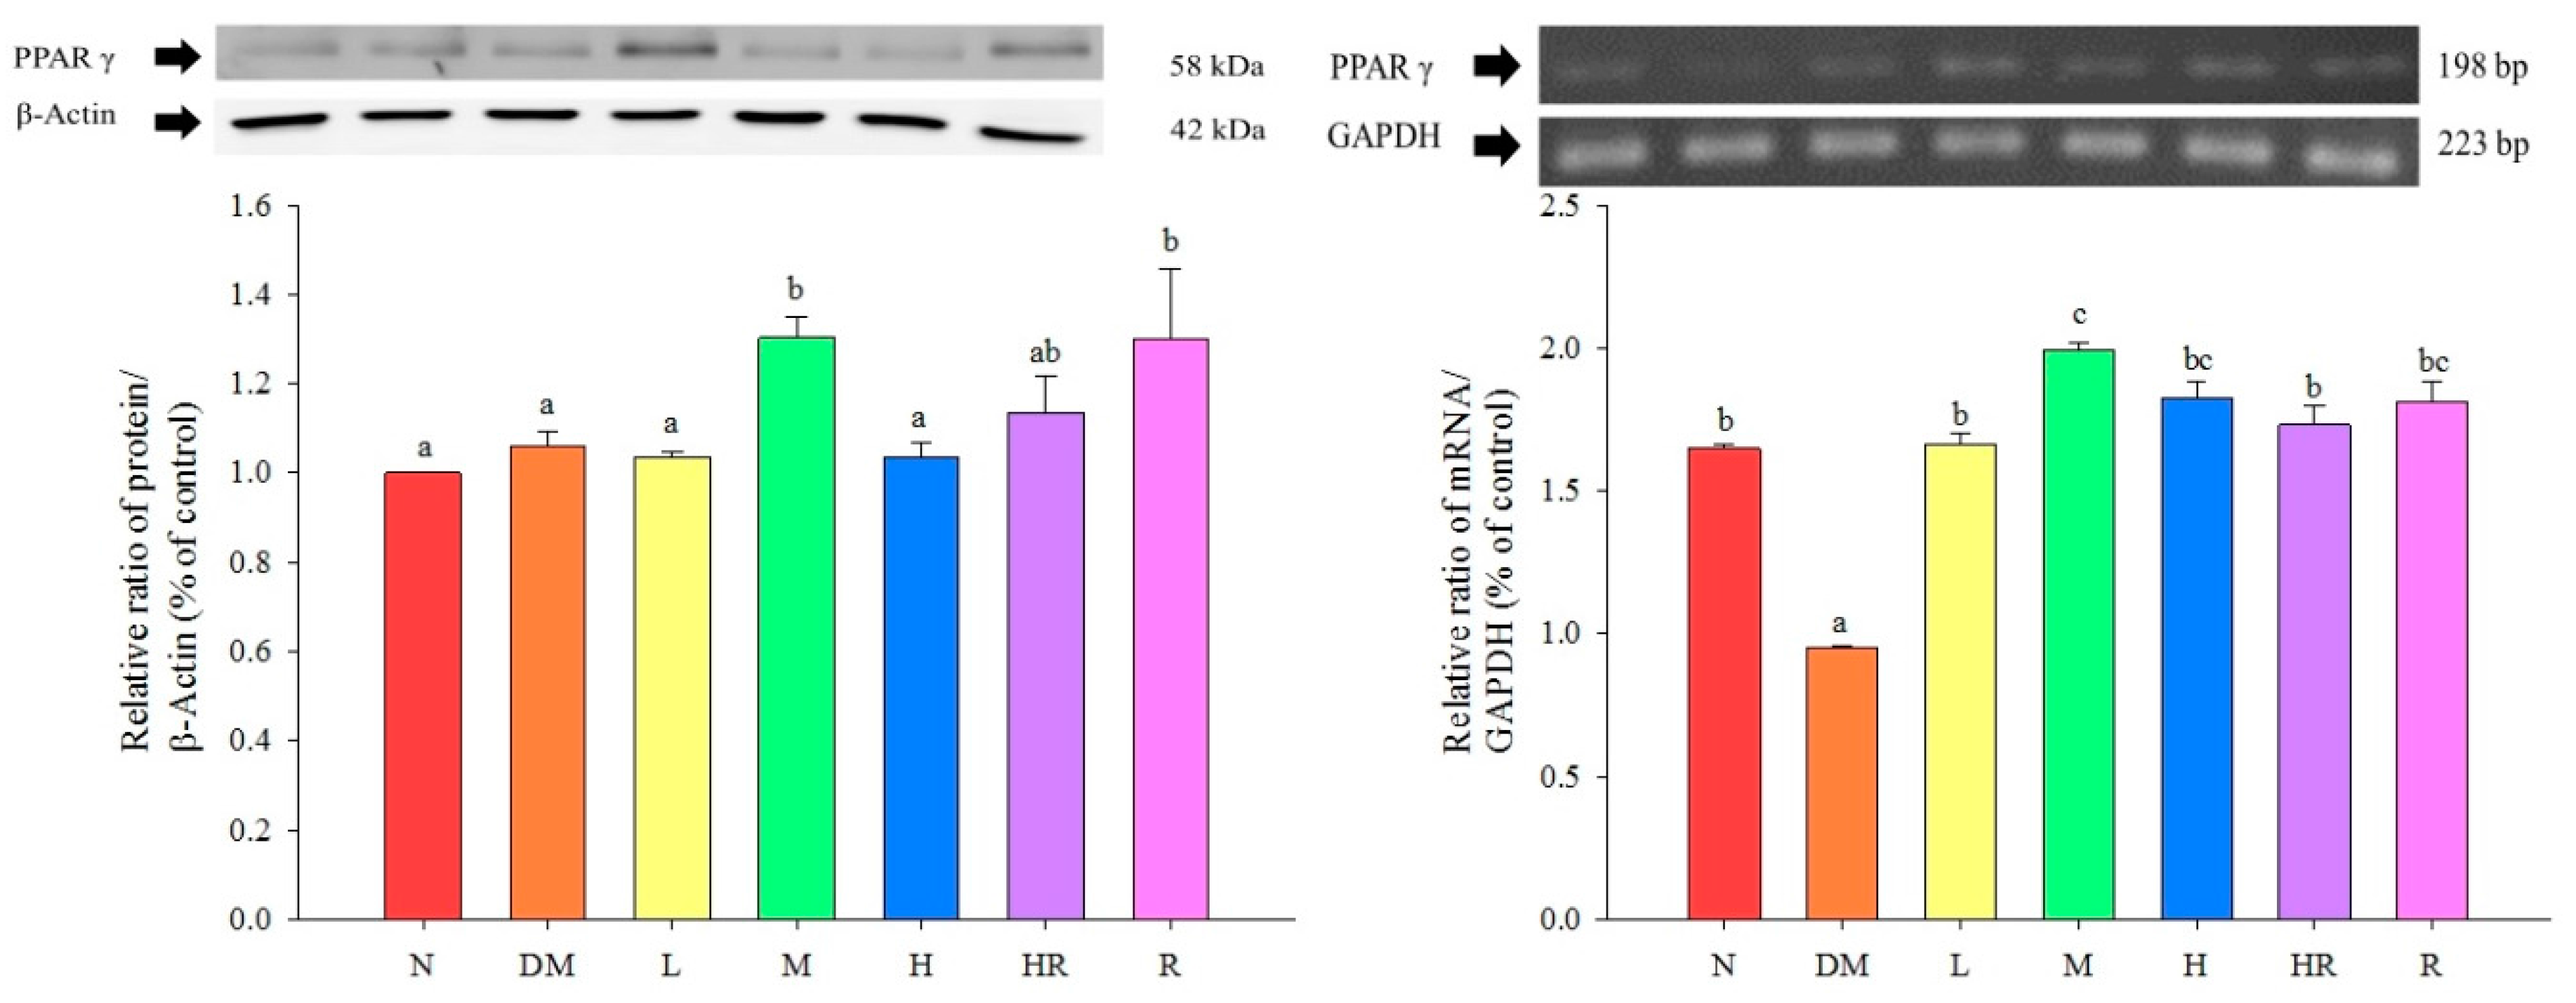
2.1. Results


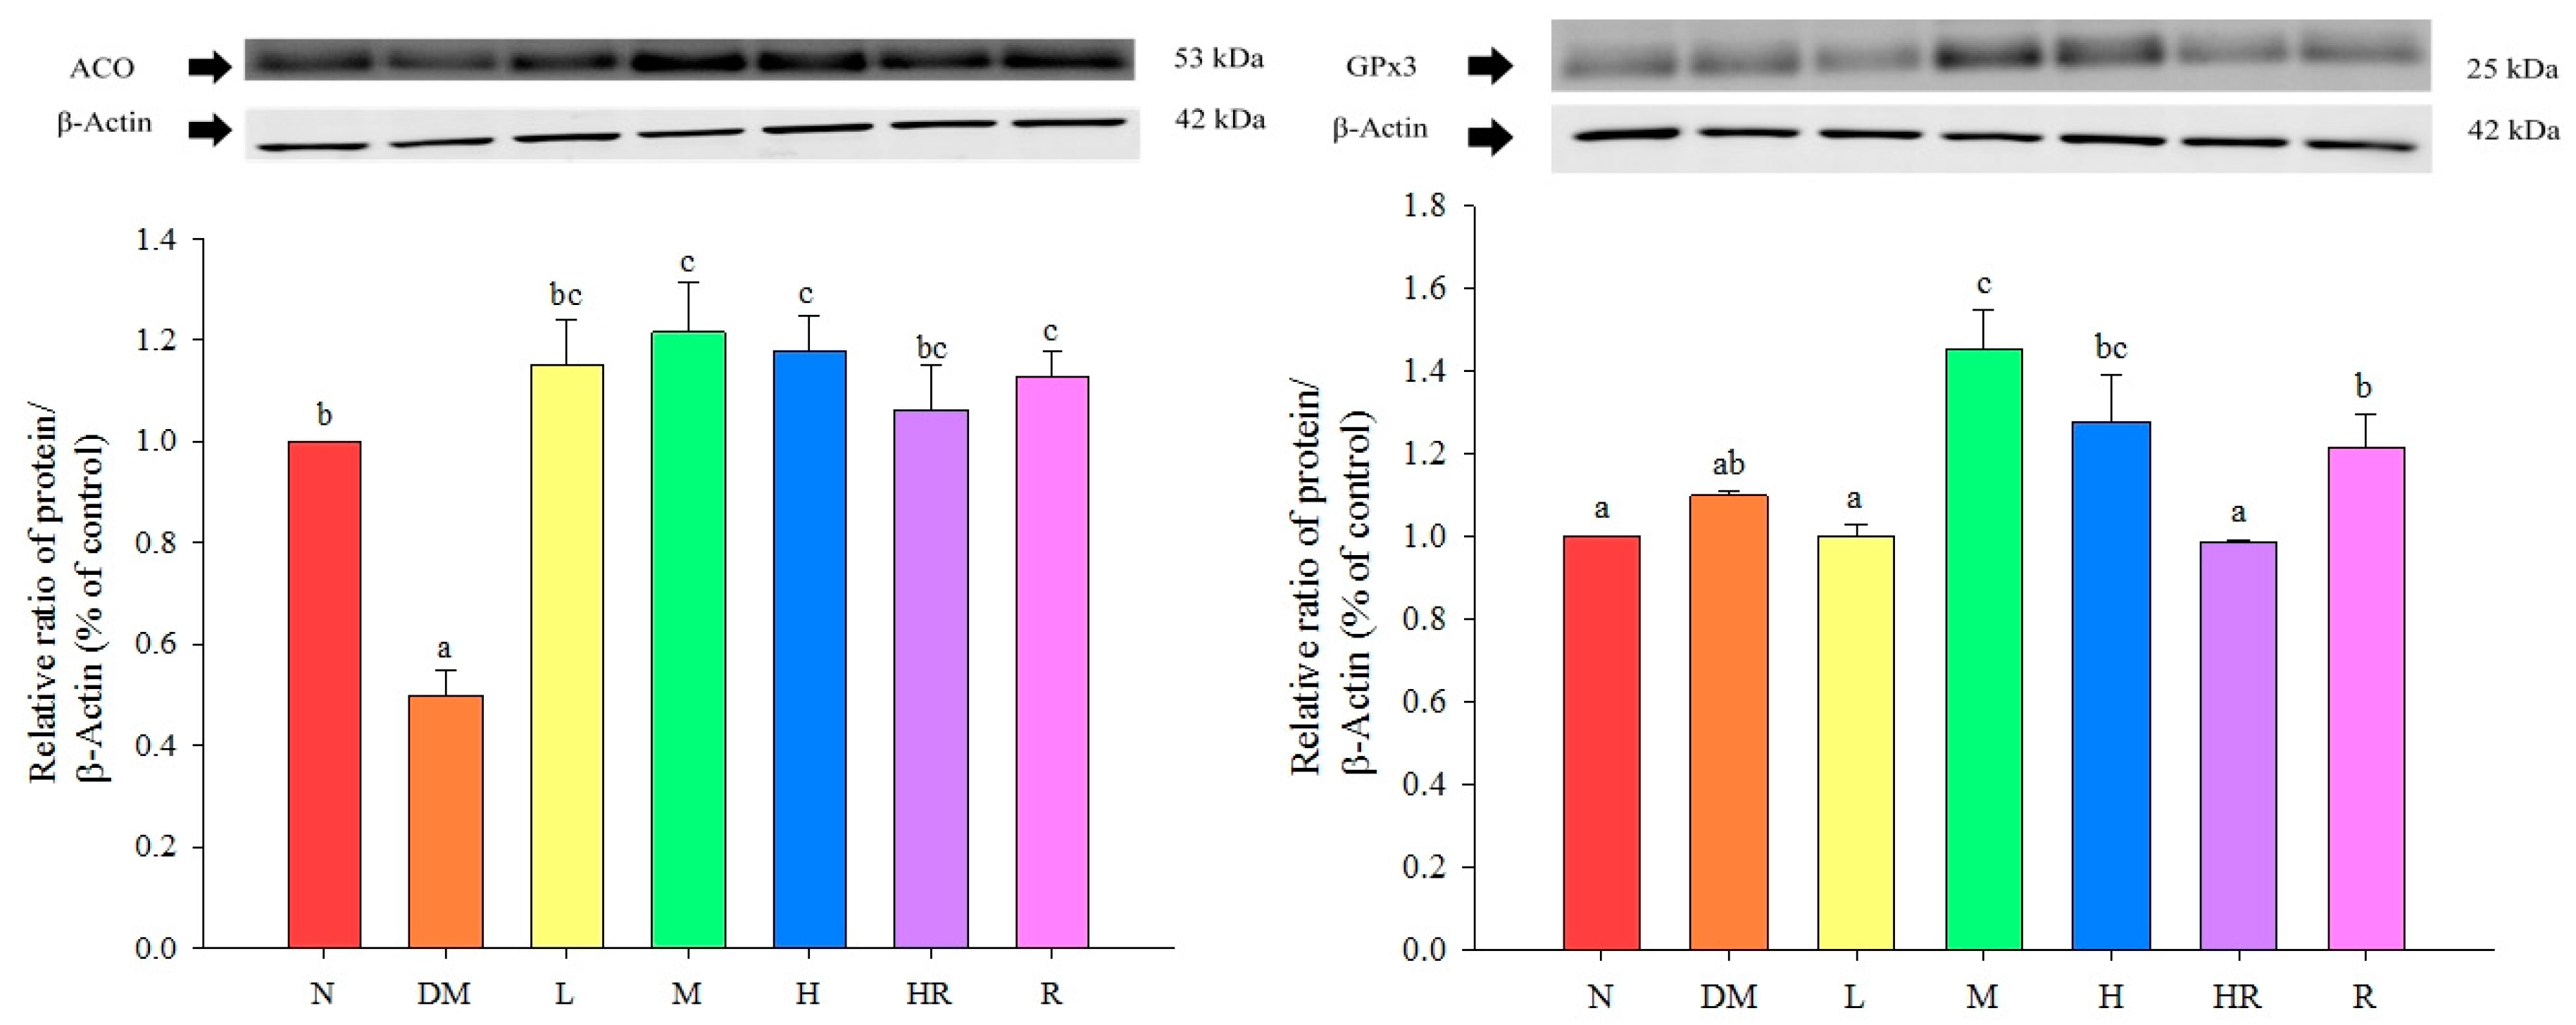
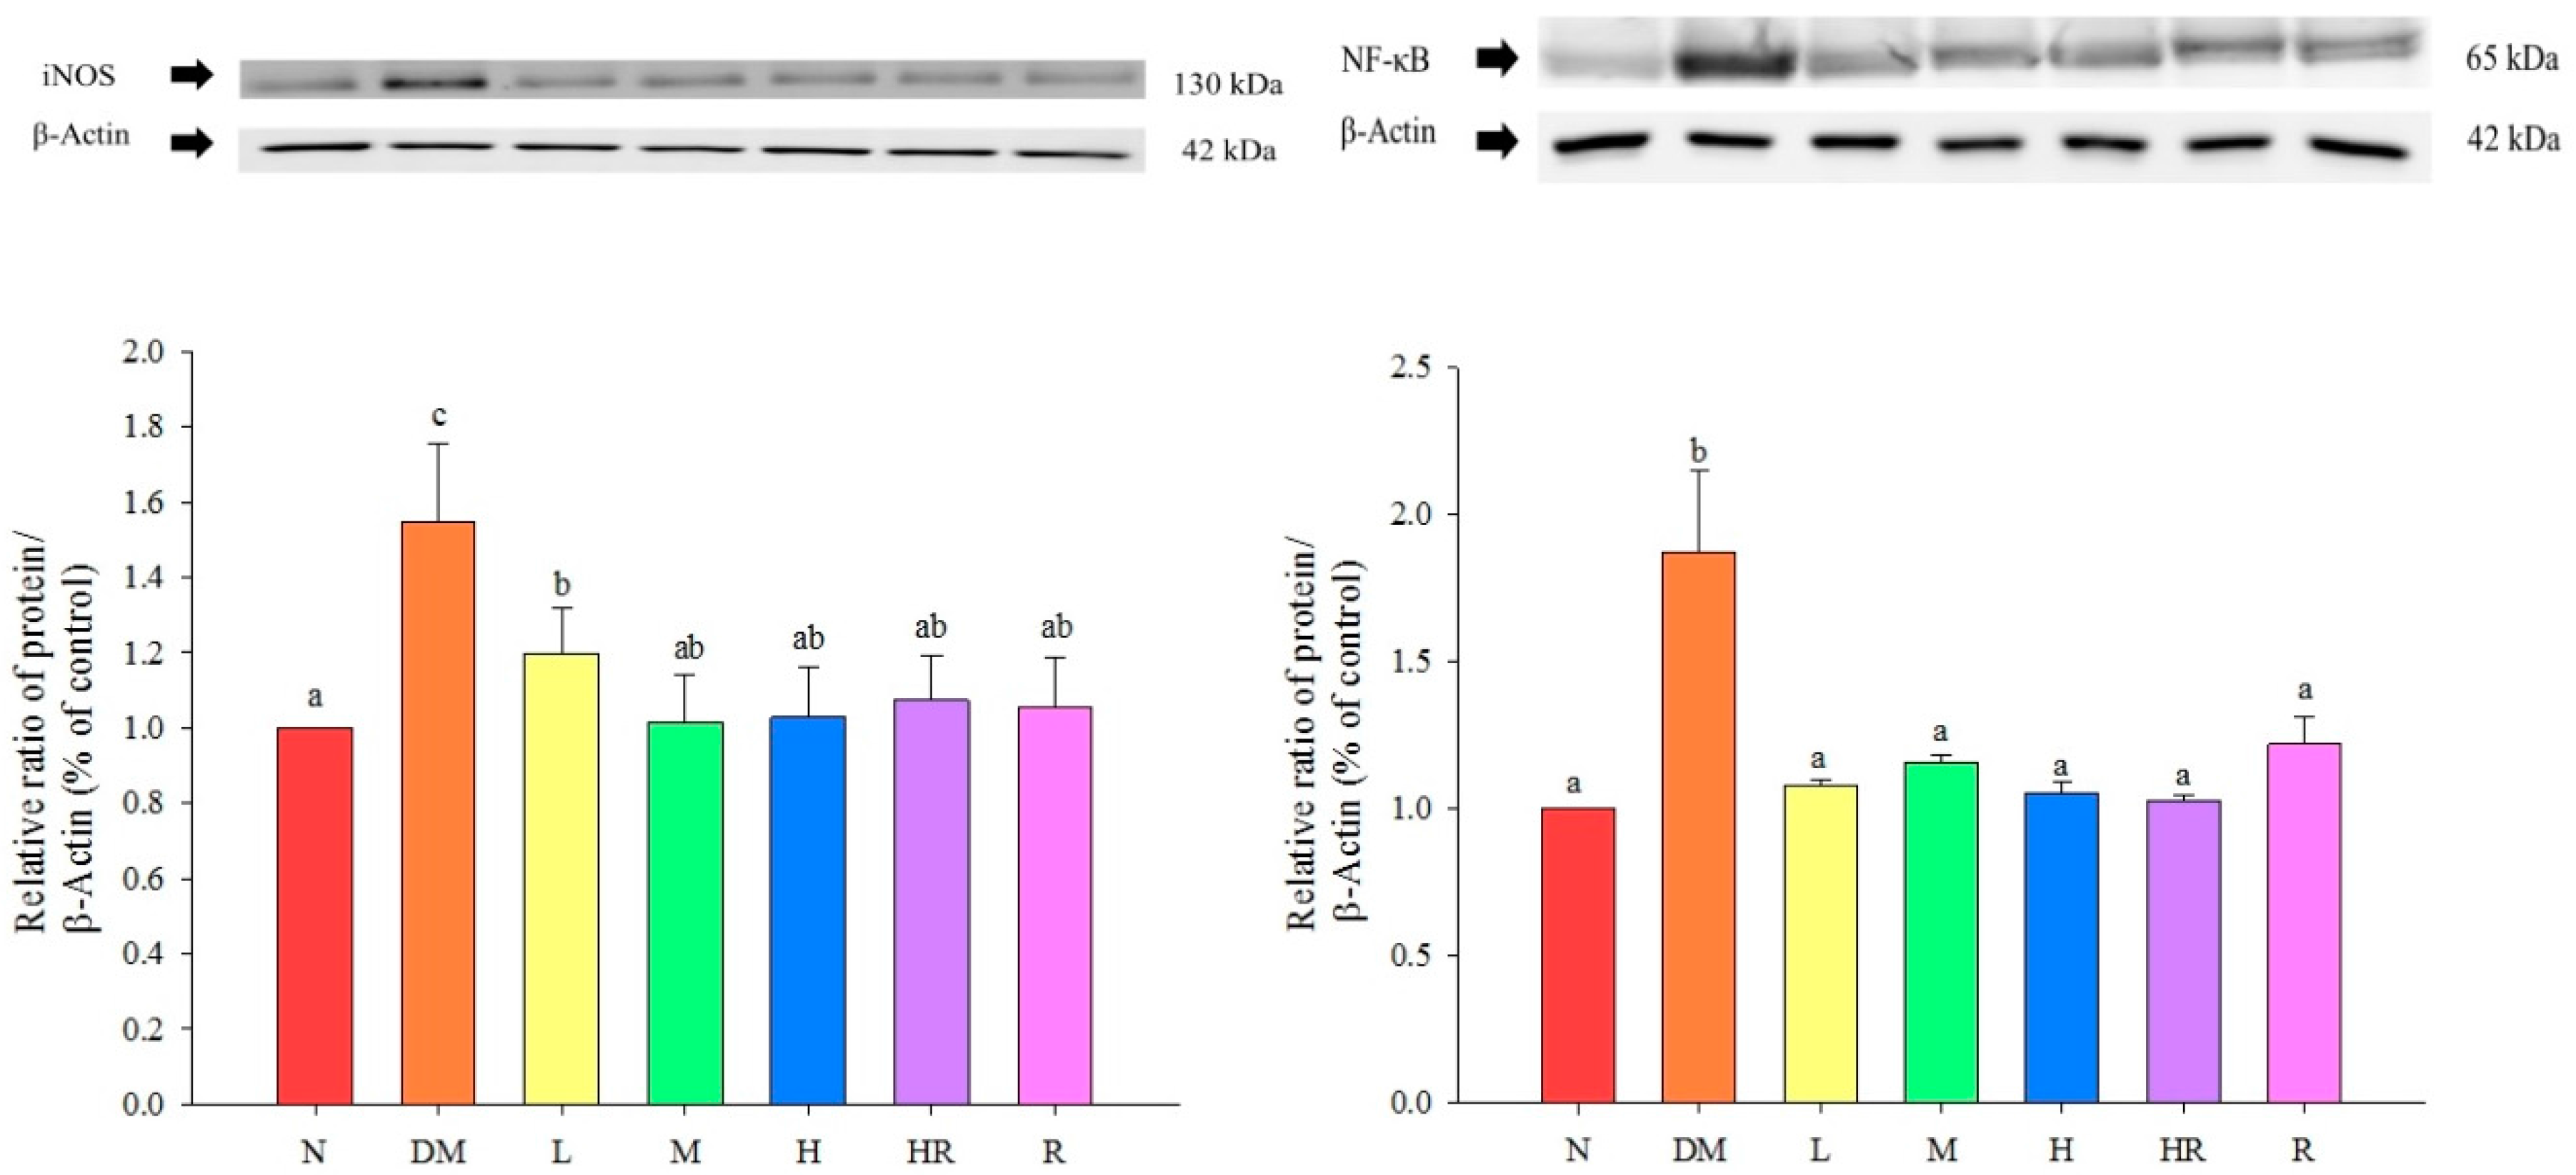
| N | DM | L | M | H | HR | R | |
|---|---|---|---|---|---|---|---|
| Glucose (mg/dL) | 129.06 ± 8.41 a | 234.21 ± 62.94 b | 174.03 ± 24.97 a | 132.69 ± 19.52 a | 141.51 ± 24.33 a | 141.61 ± 25.18 a | 135.83 ± 25.2 a |
| Insulin (μg/L) | 2.13 ± 0.7 a | 4.61 ± 1.44 b | 2.8 ± 0.46 a | 2.33 ± 0.7 a | 2.81 ± 0.34 a | 2.75 ± 0.69 a | 2.36 ± 0.83 a |
| HOMA-IR | 0.68 | 2.71 | 1.22 | 0.98 | 0.86 | 0.76 | 0.79 |
| N | DM | L | M | H | HR | R | |
|---|---|---|---|---|---|---|---|
| Creatinine (mg/dL) | 0.49 ± 0.02 b | 0.69 ± 0.04 c | 0.46 ± 0.03 a,b | 0.43 ± 0.03 a,b | 0.38 ± 0.03 a | 0.38 ± 0.02 a | 0.52 ± 0.03 b |
| BUN (mg/dL) | 14.30 ± 3.35 a | 54.70 ± 2.74 c | 40.06 ± 2.62 b | 37.58 ± 3.13 b | 36.09 ± 4.64 b | 46.66 ± 1.77 b,c | 45.54 ± 4.42 b,c |
| N | DM | L | M | H | HR | R | |
|---|---|---|---|---|---|---|---|
| Triglycerides (mmol/L) | 1.54 ± 0.03 c | 2.45 ± 0.08 d | 1.34 ± 0.02 a,b | 1.31 ± 0.02 a,b | 1.41 ± 0.03 a,b,c | 1.28 ± 0.02 a | 1.44 ± 0.04 b,c |
| Cholesterol (mg/dL) | 140.74 ± 1.28 a | 152.85 ± 2.58 b | 139.12 ± 2 a | 135.97 ± 0.91 a | 137.4 ± 1.7 a | 138.25 ± 1.41 a | 140.78 ± 2.36 a |
| NEFA (mmol/L) | 1.56 ± 0.03 c | 2.05 ± 0.06 d | 1.37 ± 0.04 ab | 1.43 ± 0.02 b,c | 1.47 ± 0.03 b,c | 1.26 ± 0.04 a | 1.45 ± 0.04 b,c |
| N | DM | L | M | H | HR | R | |
|---|---|---|---|---|---|---|---|
| C-RP (ng/mL) | 53.77 ± 0.36 b | 59.98 ± 1.44 c | 54.49 ± 1.91 b | 53.87 ± 1.39 b | 47.87 ± 1.48 a | 55.95 ± 0.68 a,b | 57.52 ± 1.11 a,b |
| TNF-α (pg/mL) | 133.86 ± 6.87 a | 303.4 ± 36.95 c | 264.33 ± 3.18 b,c | 232.33 ± 6.96 b | 250.67 ± 13.86 b,c | 263.33 ± 18.76 b,c | 204.67 ± 15.76 b |
| IL-10 (pg/mL) | 243.18 ± 19.6 b | 150.27 ± 8.3 a | 216.6 ± 19.38 b | 214.98 ± 20.29 b | 206.64 ± 18.69 a,b | 191.31 ± 28.64 a,b | 248.68 ± 25.04 b |

2.2. Discussion
3. Experimental Section
3.1. Animal Model
3.2. Experimental Sample Preparation
3.3. Establishment of the Animal Model of Diabetes
3.4. Analysis Biochemical Parameters
3.5. Statistical Analysis
4. Conclusions
Acknowledgments
Author Contributions
Conflicts of Interest
References
- Gouda, H.N.; Sagoo, G.S.; Harding, A.H.; Yates, J.; Sandhu, M.S.; Higgins, J.P.T. The association between the peroxisome proliferator-activated receptor-γ2 (PPARG2) Pro12Ala gene variant and type 2 diabetes mellitus: A HuGE review and meta-analysis. J. Ethnopharmacol. 2010, 171, 645–655. [Google Scholar]
- Arima, H.; Danno, G.I. Isolation of antimicrobial compounds from guava (Psidium guajava L.) and their structural elucidation. Biosci. Biotechnol. Biochem. 2002, 66, 1727–1730. [Google Scholar] [CrossRef] [PubMed]
- Almeida, C.C.; Karnikowski, M.G.; Foleto, R.; Baldisserotto, B. Analysis of antidiarrhoeic effect of plants used in popular medicine. Rev. Saude Publ. 1995, 29, 428–433. [Google Scholar] [CrossRef]
- Lutterodt, G.D. Inhibition of gastrointestinal release of acetylcholine by quercetin as a possible mode of action of Psidium guajava leaf extracts in the treatment of acute diarrhea disease. J. Ethnopharmacol. 1989, 25, 235–247. [Google Scholar] [CrossRef]
- Cheng, J.T.; Yang, R.S. Hypoglycemic effect of guava juice in mice and human subjects. Am. J. Chin. Med. 1983, 11, 74–76. [Google Scholar] [CrossRef] [PubMed]
- Deguchi, Y.; Osada, K.; Kimura, H.; Yoshikawa, M.; Kudo, T.; Yasui, H.; Watanuki, M. Effects of extract of guava leaves on the development of diabetes in the db/db mouse and on the postprandial blood glucose of human subjects. Nippon Nogeikagaku Kaishi 1998, 72, 923–931. (In Japanese) [Google Scholar] [CrossRef]
- Oh, W.K.; Lee, C.H.; Lee, M.S.; Bae, E.Y.; Sohn, C.B.; Oh, H.; Kim, B.Y.; Ahn, J.S. Antidiabetic effects of extracts from Psidium guajava. J. Ethnopharmacol. 2005, 96, 411–415. [Google Scholar] [CrossRef] [PubMed]
- Jimenez, E.A.; Rincon, M.; Pulido, R.; Saura, C.F. Guava fruit (Psidium guajava L.) as a new source of antioxidant dietary fiber. J. Agric. Food Chem. 2001, 49, 5489–5493. [Google Scholar] [CrossRef]
- Thaipong, K.; Boonprakob, U.; Cisneros-Zevallos, L.; Byrne, D.H. Hydrophilic and lipophilic antioxidant activities of guava fruits. Southeast Asian J. Trop. Med. Public Health 2005, 36, 254–257. [Google Scholar] [PubMed]
- Chang, W.S. Studies on Active Principles of Hypoglycemic Effect from Psidium grajava (I). Master’s Thesis, The Graduate Institute of Pharmacy, Taipei Medical College, Taiwan, 1982. [Google Scholar]
- Mannino, G.C.; Sesti, G. Individualized therapy for type 2 diabetes: Clinical implications of pharmacogenetic data. Mol. Diagn. Ther. 2012, 16, 285–302. [Google Scholar] [CrossRef] [PubMed]
- Olefsky, J.M. Treatment of insulin resistance with peroxisome proliferator-activated receptor gamma agonists. J. Clin. Investig. 2000, 106, 467–472. [Google Scholar] [CrossRef] [PubMed]
- Miyazaki, Y.; Mahankali, A.; Matsuda, M.; Glass, S.; Mahankali, S.; Ferrannini, E. Improved glycemic control and enhanced insulin sensitivity in type 2 diabetic subjects treated with pioglitazone. Diabetes Care 2001, 24, 710–719. [Google Scholar] [CrossRef] [PubMed]
- Qu, H.Q.; Li, Q.; Rentfro, A.R.; Fisher-Hoch, S.P.; McCormick, J.B. The Definition of Insulin Resistance Using HOMA-IR for Americans of Mexican Descent Using Machine Learning. PLoS ONE 2011, 6, e21041. [Google Scholar] [CrossRef] [PubMed]
- Gutiérrez, R.M.P.; Mitchell, S.; Solis, R.V. Psidium guajava: A review of its traditional uses, phytochemistry and pharmacology. J. Ethnopharmacol. 2008, 117. [Google Scholar] [CrossRef] [PubMed]
- Lippert, J.; Ritz, E.; Schwarzbeck, A.; Schneider, P. The rising tide of endstage renal failure from diabetic nephropathy type II--an epidemiological analysis. Nephrol. Dial. Transplant. 1995, 10, 462–467. [Google Scholar] [PubMed]
- Esmatjes, E.; Castell, C.; Gonzalez, T.; Tresserras, R.; Lloveras, G. The Catalan Diabetic Nephropathy Study Group. Epidemiology of renal involvement in type II diabetics (NIDDM) in Catalonia. Diabetes Res. Clin. Pract. 1996, 32, 157–163. [Google Scholar] [CrossRef]
- Hahm, S.W.; Park, J.; Son, Y.S. Opuntia humifusa stems lower blood glucose and cholesterol levels in streptozotocin-induced diabetic rats. Nutr. Res. 2011, 31, 479–487. [Google Scholar] [CrossRef] [PubMed]
- Gil-Campos, M.; Ramírez Tortosa, M.C.; Aguilera, C.M.; Canete, R.; Gil, A. Fasting and postprandial adiponectin alterations anticipate NEFA and TNF-a changes in prepubertal obese children. Nutr. Metab. Cardiovasc. Dis. 2011, 21, 62–68. [Google Scholar] [CrossRef] [PubMed]
- Black, S.; Kushner, I.; Samols, D. C-reactive protein. J. Biol. Chem. 2004, 279, 48487–48490. [Google Scholar] [CrossRef] [PubMed]
- Ouellet, V.; Weisnagel, S.J.; Marois, J.; Bergeron, J.; Julien, P.; Gougeon, R.; Tchernof, A.; Holub, B.J.; Jacques, H. Dietary cod protein reduces plasma C-reactive protein in insulin-resistant men and women. J. Nutr. 2008, 138, 2386–2391. [Google Scholar] [CrossRef] [PubMed]
- Wells, B.J.; Mainous, A.G., III; Everett, C.J. Association between dietary arginine and C-reactive protein. Nutrition 2005, 21, 125–130. [Google Scholar] [CrossRef] [PubMed]
- Hattori, Y.; Matsumura, M.; Kasai, K. Vascular smooth muscle cell activation by C-reactive protein. Cardiovasc. Res. 2003, 58, 186–195. [Google Scholar] [CrossRef]
- Hivert, M.F.; Sullivan, L.M.; Shrader, P.; Fox, C.S.; Nathan, D.M.; D’Agostino, R.B., Sr.; Wilson, P.W.F.; Benjamin, E.J.; Meigs, J.B. The association of TNFr2 and TNF-α with insulin resistance and the influence of adipose tissue biomarkers in humans. Metabolism 2010, 59, 540–546. [Google Scholar] [CrossRef] [PubMed]
- Phulwani, N.K.; Feinstein, D.L.; Gavrilyuk, V.; Akar, C.; Kielian, T. 15-Deoxy-Δ12,14-prostaglandin J2 (15d-PGJ2) and ciglitazone modulate Staphylococcus aureus-dependent astrocyte activation primarily through a PPAR-γ-independent pathway. J. Neurochem. 2006, 99, 1389–1402. [Google Scholar] [CrossRef] [PubMed]
- Srinivasan, K.; Viswanad, B.; Asrat, L.; Kaul, C.L.; Ramarao, P. Combination of high-fat diet-fed and low-dose streptozotocin-treated rat: A model for type 2 diabetes and pharmacological screening. Pharmacol. Res. 2005, 52, 313–320. [Google Scholar] [CrossRef] [PubMed]
- Sample Availability: Samples of the compounds are not available from the authors.
© 2015 by the authors. Licensee MDPI, Basel, Switzerland. This article is an open access article distributed under the terms and conditions of the Creative Commons by Attribution (CC-BY) license ( http://creativecommons.org/licenses/by/4.0/).
Share and Cite
Li, P.-Y.; Hsu, C.-C.; Yin, M.-C.; Kuo, Y.-H.; Tang, F.-Y.; Chao, C.-Y. Protective Effects of Red Guava on Inflammation and Oxidative Stress in Streptozotocin-Induced Diabetic Mice. Molecules 2015, 20, 22341-22350. https://doi.org/10.3390/molecules201219831
Li P-Y, Hsu C-C, Yin M-C, Kuo Y-H, Tang F-Y, Chao C-Y. Protective Effects of Red Guava on Inflammation and Oxidative Stress in Streptozotocin-Induced Diabetic Mice. Molecules. 2015; 20(12):22341-22350. https://doi.org/10.3390/molecules201219831
Chicago/Turabian StyleLi, Pei-Ying, Cheng-Chin Hsu, Mei-Chin Yin, Yueh-Hsiung Kuo, Feng-Yao Tang, and Che-Yi Chao. 2015. "Protective Effects of Red Guava on Inflammation and Oxidative Stress in Streptozotocin-Induced Diabetic Mice" Molecules 20, no. 12: 22341-22350. https://doi.org/10.3390/molecules201219831