
Phenolic Composition from Different Loquat (Eriobotrya japonica Lindl.) Cultivars Grown in China and Their Antioxidant Properties

Abstract
:1. Introduction
2. Results and Discussion
2.1. Fruit Quality Evaluation

| Cultivars | Abbreviation | Harvest Site (County, Province) | Colour | FW (g) | FSI | SSC (°Brix) |
|---|---|---|---|---|---|---|
| Baozhu | BZ | Tangxi, Zhejiang | Red | 24.24 ± 3.56 e | 1.18 ± 0.10 a | 11.72 ± 1.74 ab |
| Dahongpao | DHP | Tangxi, Zhejiang | Red | 33.02 ± 6.66 c | 1.04 ± 0.09 b | 12.08 ± 0.89 a |
| Dayeyangdun | DYYD | Tangxi, Zhejiang | Red | 31.44 ± 3.47 cd | 1.08 ± 0.11 b | 12.02 ± 1.05 ab |
| Jiajiao | JJ | Tangxi, Zhejiang | Red | 40.01 ± 4.48 ab | 1.17 ± 0.08 a | 12.04 ± 1.02 ab |
| Luoyangqing | LYQ | Luqiao, Zhejiang | Red | 42.19 ± 1.28 a | 1.07 ± 0.05 b | 11.15 ± 0.73 bc |
| Ninghaibai | NHB | Ninghai, Zhejiang | White | 28.60 ± 3.79 d | 1.10 ± 0.06 ab | 10.24 ± 1.20 c |
| Ruantiaobaisha | RTBS | Luqiao, Zhejiang | White | 37.52 ± 1.00 b | 1.05 ± 0.05 b | 11.25 ± 1.70 b |
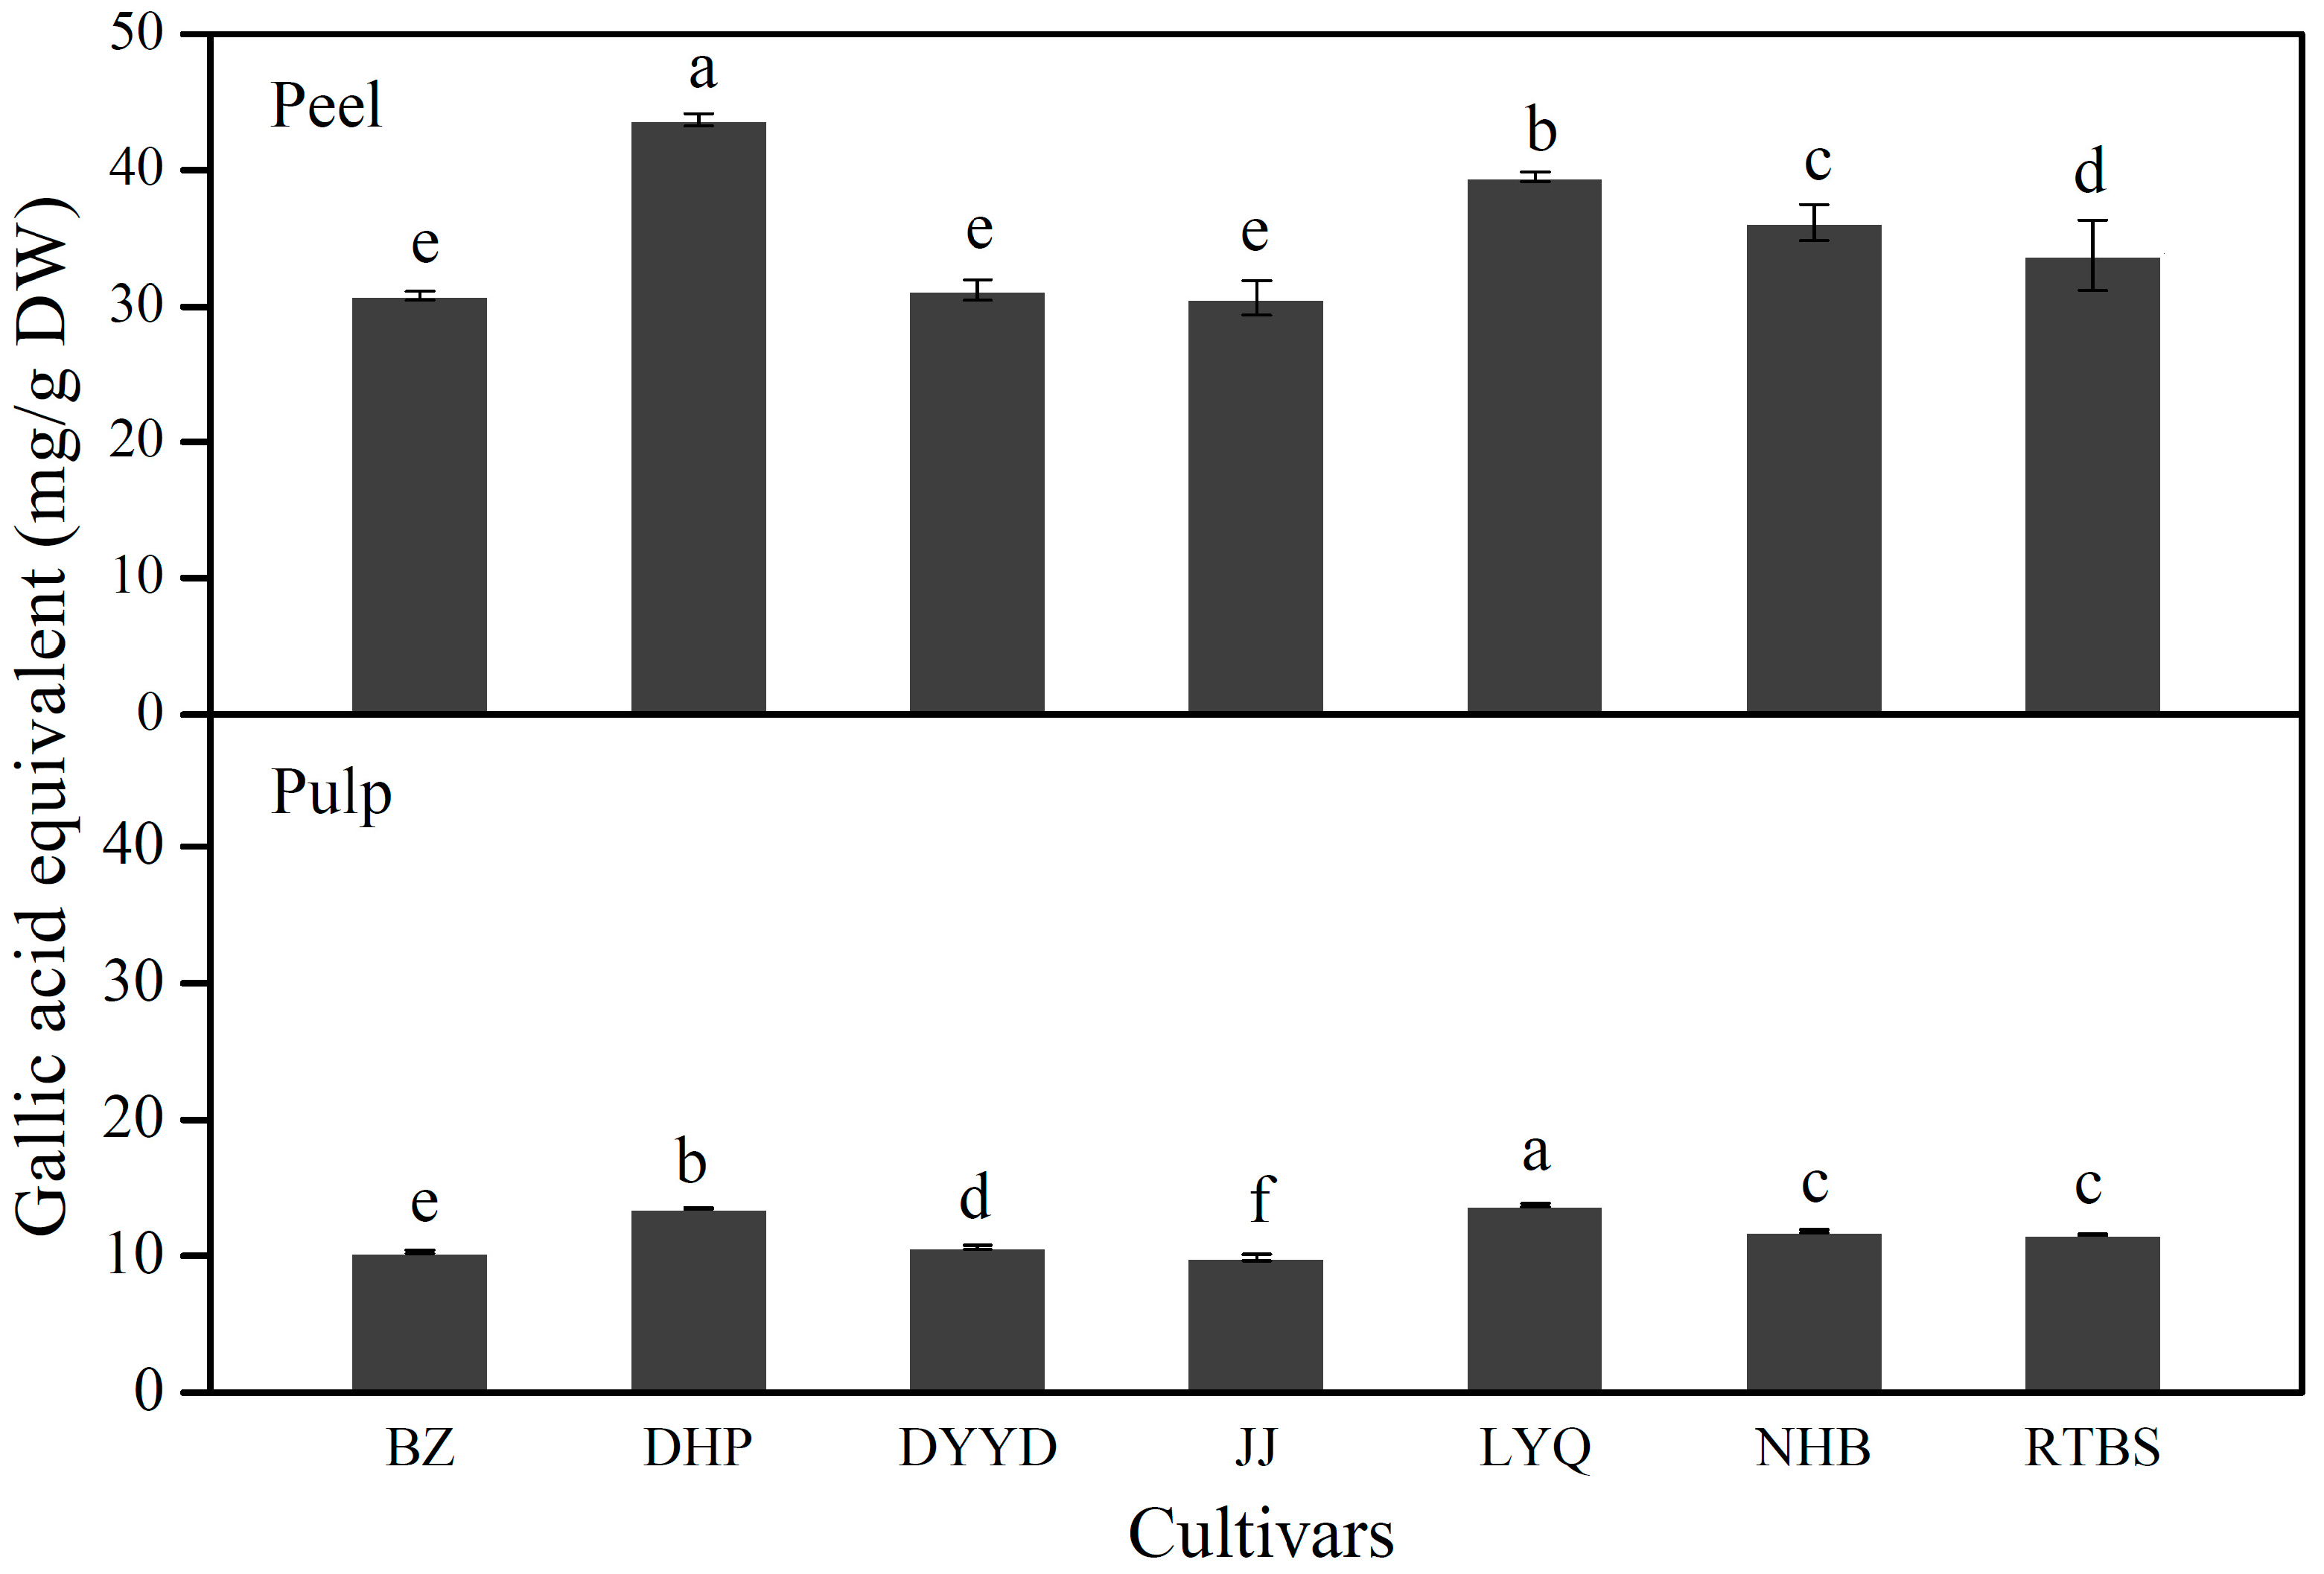
2.2. Total Phenolic Contents
2.3. Identification of Individual Phenolic Compounds
| Structural Formula | Compounds | R1 | R2 | λmax (nm) | Molecular Weight | ESI-MS2 (m/s) |
|---|---|---|---|---|---|---|
HCAs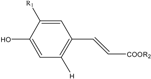 | 3-p-CoQA | H | 3-quinic acid | 226.1, 310.3 | 338 | 336.9, 163.1, 119.0 |
| 5-CQA | OH | 5-quinic acid | 241.4, 324.6 | 354 | 353.0, 191.0, 135.1 | |
| 4-CQA | OH | 4-quinic acid | 240.2, 327.0 | 354 | 353.0, 190.8, 179.1 | |
| 3-CQA | OH | 3-quinic acid | 241.4, 324.6 | 354 | 353.0, 191.0, 135.1 | |
| 5-FQA | OCH3 | 5-quinic acid | 216.6, 325.8 | 368 | 367.0, 191.0, 85.0 | |
Flavonols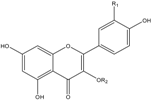 | Q-3-Gal | OH | galactoside | 255.6, 352.8 | 464 | 463.3, 301.1, 300.1 |
| Q-3-Glu | OH | glucoside | 255.6, 352.8 | 464 | 463.3, 301.2, 300.1 | |
| Q-3-Rha | OH | rhamnoside | 255.6, 348.0 | 448 | 447.2, 301.2, 300.3 | |
| K-3-Gal | H | galactoside | 265.1, 346.8 | 448 | 447.2, 285.0, 284.2 | |
| K-3-Rha | H | rhamnoside | 263.9, 341.1 | 432 | 431.3, 285.2, 284.2 | |
| K-3-Glu | H | glucoside | 253.9, 349.2 | 448 | 447.2, 285.2, 284.1 |
2.4. Quantification of Individual Phenolic Compounds
| Compounds | Cultivars | |||||||
|---|---|---|---|---|---|---|---|---|
| BZ | DHP | DYYD | JJ | LYQ | NHB | RTBS | ||
| HCAs | 3-p-CoQA | 0.13 ± 0.01 e | 0.41 ± 0.01 b | 0.36 ± 0.01 c | 0.07 ± 0.002 f | 0.52 ± 0.01 a | 0.39 ± 0.02 b | 0.27 ± 0.003 d |
| 5-CQA | 2.06 ± 0.10 d | 4.60 ± 0.05 b | 4.28 ± 0.02 c | 1.92 ± 0.01 e | 5.10 ± 0.10 a | 4.61 ± 0.08 b | 4.25 ± 0.07 c | |
| 4-CQA | 0.16 ± 0.01 e | 0.36 ± 0.001 c | 0.21 ± 0.002 d | 0.12 ± 0.01 f | 0.37 ± 0.01 c | 0.55 ± 0.01 a | 0.40 ± 0.001 b | |
| 3-CQA | 4.74 ± 0.18 e | 5.25 ± 0.04 c | 5.01 ± 0.12 d | 3.13 ± 0.08 f | 4.71 ± 0.09 e | 6.75 ± 0.11 a | 6.36 ± 0.10 b | |
| 5-FQA | 0.45 ± 0.02 e | 0.98 ± 0.02 a | 0.21 ± 0.01 g | 0.42 ± 0.01 f | 0.82 ± 0.02 b | 0.50 ± 0.01 d | 0.73 ± 0.004 c | |
| Flavonols | Q-3-Gal | 0.34 ± 0.01 b | 0.51 ± 0.01 a | 0.32 ± 0.01 c | 0.30 ± 0.01 d | 0.09 ± 0.01 g | 0.23 ± 0.004 e | 0.18 ± 0.004 f |
| Q-3-Glu | 0.15 ± 0.01 b | 0.19 ± 0.004 a | 0.13 ± 0.004 d | 0.14 ± 0.004 c | 0.03 ± 0.003 g | 0.09 ± 0.003 e | 0.06 ± 0.001 f | |
| Q-3-Rha | 0.49 ± 0.02 b | 0.58 ± 0.01 a | 0.50 ± 0.02 b | 0.46 ± 0.002 c | 0.15 ±0.02 f | 0.42 ± 0.01 d | 0.35 ± 0.01 e | |
| K-3-Gal | 0.13 ± 0.003 d | 0.16 ± 0.004 b | 0.15 ± 0.003 c | 0.21 ± 0.004 a | 0.05 ± 0.002 e | 0.05 ± 0.001 e | ND | |
| K-3-Rha | 0.34 ± 0.01 c | 0.22 ± 0.002 d | 0.48 ± 0.01 b | 0.52 ± 0.01 a | 0.06 ± 0.001 f | 0.08 ± 0.001 e | 0.07 ± 0.001 e | |
| K-3-Glu | 0.08 ± 0.003 b | 0.01 ± 0.003 b | 0.08 ± 0.01 b | 0.11 ± 0.002 a | ND | ND | ND | |
| TIHCAs | 7.52 ± 0.30 e | 11.60 ± 0.09 c | 10.06 ± 0.13 d | 5.66 ± 0.10 f | 11.53 ± 0.23 c | 12.80 ± 0.23 a | 12.02 ± 0.16 b | |
| TIFs | 1.54 ± 0.05 c | 1.73 ± 0.02 a | 1.65 ± 0.05 b | 1.74 ± 0.01 a | 0.39 ± 0.01 f | 0.86 ± 0.02 d | 0.67 ± 0.01 e | |
| Compounds | Cultivars | |||||||
|---|---|---|---|---|---|---|---|---|
| BZ | DHP | DYYD | JJ | LYQ | NHB | RTBS | ||
| HCAs | 3-p-CoQA | ND | ND | 0.06 ± 0.002 a | 0.02 ± 0.000 b | ND | ND | ND |
| 5-CQA | 0.46 ± 0.02 e | 0.76 ± 0.01 c | 0.87 ± 0.01 b | 0.57 ± 0.01 d | 1.42 ± 0.11 a | 0.80 ± 0.02 bc | 0.82 ± 0.04 bc | |
| 4-CQA | 0.02 ± 0.002 c | 0.05 ± 0.01 b | 0.05 ± 0.001 b | 0.02 ± 0.001 c | 0.09 ± 0.01 a | 0.04 ± 0.01 b | 0.05 ± 0.003 b | |
| 3-CQA | 3.88 ± 0.15 c | 6.09 ± 0.02 a | 3.47 ± 0.04 d | 2.65 ± 0.06 e | 6.29 ± 0.45 a | 4.49 ± 0.07 b | 4.75 ± 0.23 b | |
| 5-FQA | 0.20 ± 0.004 d | 0.24 ± 0.01 b | 0.13 ± 0.002 f | 0.23 ± 0.01 bc | 0.29 ± 0.03 a | 0.17 ± 0.01 e | 0.21 ± 0.01 cd | |
| TIHCAs | 4.56 ± 0.17 d | 7.13 ± 0.02 b | 4.58 ± 0.06 d | 3.49 ± 0.08 e | 8.08 ± 0.59 a | 5.50 ± 0.11 c | 5.83 ± 0.26 c | |
2.5. Antioxidant Activity
| Tissues | Cultivars | DPPH | ABTS | FRAP | APC Index | Rank |
|---|---|---|---|---|---|---|
| Peel | BZ | 25.98 ± 0.97 e | 37.10 ± 1.67 d | 37.21 ± 0.33 f | 65.98 | 6 |
| DHP | 36.64 ± 0.88 a | 57.32 ± 1.31 a | 59.71 ± 1.10 a | 100 | 1 | |
| DYYD | 26.25 ± 0.62 e | 36.19 ± 1.47 d | 42.08 ± 0.55 e | 68.42 | 5 | |
| JJ | 25.19 ± 0.61 e | 36.11 ± 0.56 d | 36.25 ± 0.98 f | 64.15 | 7 | |
| LYQ | 33.79 ± 0.27 b | 52.20 ± 1.63 b | 53.96 ± 0.93 b | 91.22 | 2 | |
| NHB | 30.72 ± 0.67 c | 43.76 ± 3.01 c | 48.68 ± 1.70 c | 80.56 | 3 | |
| RTBS | 29.34 ± 0.70 d | 42.65 ± 0.92 c | 44.83 ± 0.43 d | 76.52 | 4 | |
| Pulp | BZ | 6.62 ± 0.51 d | 7.30 ± 0.27 d | 11.59 ± 0.66 d | 59.49 | 7 |
| DHP | 11.79 ± 1.52 a | 11.68 ± 0.31 b | 17.73 ± 0.18 a | 97.03 | 2 | |
| DYYD | 7.23 ± 0.34 cd | 7.76 ± 0.29 d | 12.24 ± 0.44 c | 63.60 | 5 | |
| JJ | 7.11 ± 0.85 cd | 7.47 ± 0.56 d | 10.65 ± 0.23 e | 59.53 | 6 | |
| LYQ | 11.06 ± 0.87 a | 12.77 ± 0.34 a | 17.79 ± 0.18 a | 97.95 | 1 | |
| NHB | 8.91 ± 0.48 bc | 9.54 ± 0.11 c | 13.87 ± 0.15 b | 76.08 | 3 | |
| RTBS | 9.10 ± 1.18 b | 9.19 ± 0.77 c | 13.89 ± 0.68 b | 75.74 | 4 |
2.6. Correlations Analysis
| Antioxidant Capacities/Phenolic Content | Peel | Pulp | ||||
|---|---|---|---|---|---|---|
| DPPH | ABTS | FRAP | DPPH | ABTS | FRAP | |
| DPPH | 1 | 0.974 ** | 0.975 ** | 1 | 0.893 ** | 0.907 ** |
| ABTS | 0.974 ** | 1 | 0.956 ** | 0.893 ** | 1 | 0.963 ** |
| Total phenolics | 0.972 ** | 0.968 ** | 0.961 ** | 0.905 ** | 0.977 ** | 0.993 ** |
| TIHCAs | 0.696 ** | 0.616 ** | 0.753 ** | 0.851 ** | 0.931 ** | 0.959 ** |
| TIFs | −0.294 | −0.267 | −0.279 | − | − | − |
3. Experimental Section
3.1. Chemicals
3.2. Materials
3.3. Fruit Quality Analysis
3.4. Preparation of Fruit Peel and Pulp Extracts
3.5. Determination of Total Phenolics
3.6. HPLC-DAD and LC-ESI-MS/MS Analysis of Phenolic Compounds
3.7. Antioxidant Activity Assays
3.8. Statistical Analysis
4. Conclusions
Acknowledgments
Author Contributions
Conflicts of Interest
References
- Eberhardt, M.V.; Lee, C.Y.; Liu, R.H. Antioxidant activity of fresh apples. Nature 2000, 405, 903–904. [Google Scholar] [PubMed]
- Bazzano, L.A.; He, J.; Ogden, L.G.; Loria, C.M.; Vupputuri, S.; Myers, L.; Whelton, P.K. Fruit and vegetable intake and risk of cardiovascular disease in US adults: The first national health and nutrition examination survey epidemiologic follow-up study. Am. J. Clin. Nutr. 2002, 76, 93–99. [Google Scholar] [PubMed]
- Del Rio, D.; Rodriguez-Mateos, A.; Spencer, J.P.E.; Tognolini, M.; Borges, G.; Crozier, A. Dietary (poly) phenolics in human health: Structures, bioavailability, and evidence of protective effects against chronic diseases. Antioxid. Redox Signal. 2013, 18, 1818–1892. [Google Scholar]
- Crozier, A.; Jaganath, I.; Clifford, E.M.; Miri, R.; Tavakkoli, M.; Pourali, S.; Saso, L.; Borges, F.; Firuzi, O. Dietary phenolics: Chemistry, bioavailability and effects on health. Nat. Prod. Rep. 2009, 26, 1001–1043. [Google Scholar] [CrossRef] [PubMed]
- Li, S. Compendium of Materia Medica; People’s Medical Publishing House: Beijing, China, 1578. [Google Scholar]
- Zhou, C.H.; Li, X.; Xu, C.J.; Sun, C.D.; Chen, K.S. Hydrophilic and lipophilic antioxidant activity of loquat Fruits. J. Food Biochem. 2012, 36, 621–626. [Google Scholar] [CrossRef]
- Hong, Y.; Qiao, Y.; Lin, S.; Jiang, Y.; Chen, F. Characterization of antioxidant compounds in Eriobotrya fragrans Champ leaf. Sci. Hortic.-Amsterdam. 2008, 118, 288–292. [Google Scholar] [CrossRef]
- Hong, Y.; Lin, S.; Jiang, Y.; Ashraf, M. Variation in contents of total phenolics and flavonoids and antioxidant activities in the leaves of 11 Eriobotrya species. Plant Foods Hum. Nutr. 2008, 63, 200–204. [Google Scholar] [CrossRef] [PubMed]
- Koba, K.; Matsuoka, A.; Osada, K.; Huang, Y.S. Effect of loquat (Eriobotrya japonica) extracts on LDL oxidation. Food Chem. 2007, 104, 308–316. [Google Scholar] [CrossRef]
- Takuma, D.; Guangchen, S.; Yokota, J.; Hamada, A.; Onogawa, M.; Yoshioka, S.; Kusunose, M.; Miyamura, M.; Kyotani, S.; Nishioka, Y. Effect of Eriobotrya japonica seed extract on 5-fluorouracil-induced mucositis in hamsters. Biol. Pharm. Bull. 2008, 31, 250–254. [Google Scholar] [CrossRef] [PubMed]
- Cha, D.S.; Eun, J.S.; Jeon, H. Anti-inflammatory and antinociceptive properties of the leaves of Eriobotrya japonica. J. Ethnopharmacol. 2011, 134, 305–312. [Google Scholar] [CrossRef] [PubMed]
- Lü, H.; Chen, J.; Li, W.L.; Ren, B.R.; Wu, J.L.; Zhang, H.Q. Hypoglycemic effect of the total flavonoid fraction from Folium Eriobotryae. Phytomedicine 2009, 16, 967–971. [Google Scholar] [CrossRef] [PubMed]
- Ito, H.; Kobayashi, E.; Li, S.H.; Hatano, T.; Sugita, D.; Kubo, N.; Shimura, S.; Itoh, Y.; Tokuda, H.; Nishino, H.; et al. Antitumor activity of compounds isolated from leaves of Eriobotrya japonica. J. Agric. Food. Chem. 2002, 50, 2400–2403. [Google Scholar] [CrossRef] [PubMed]
- Yokota, J.; Takuma, D.; Hamada, A.; Onogawa, M.; Yoshioka, S.; Kusunose, M.; Miyamura, M.; Kyotani, S.; Nishioka, Y. Gastroprotective activity of Eriobotrya japonica seed extract on experimentally induced gastric lesions in rats. J. Nat. Med. 2008, 62, 96–100. [Google Scholar] [CrossRef] [PubMed]
- Durgac, C.; Polat, A.; Kamiloglu, O. Determining performances of some loquat (Eriobotrya japonica) cultivars under Mediterranean coastal conditions in Hatay, Turkey. New Zeal. J. Crop Hort. 2006, 34, 225–230. [Google Scholar] [CrossRef]
- Insero, O.; Rega, P.; de Luca, A. Comparison among Ten Loquat Cultivars in Campania Area. In Options Méditerranéennes: Série A. Séminaires Méditerranéens, Proceedings of the First International Symposium on Loquat, Valencia, Spain, 11–13 April 2002; Liácer, G., Badenes, M.L., Eds.; Ciheam: Zaragoza, Spain, 2003; pp. 67–70. [Google Scholar]
- Ding, C.K.; Chachin, K.; Ueda, Y.; Imahori, Y.; Wang, C.Y. Metabolism of phenolic compounds during loquat fruit development. J. Agric. Food. Chem. 2001, 49, 2883–2888. [Google Scholar] [CrossRef] [PubMed]
- Ferreres, F.; Gomes, D.; Valentão, P.; Gonçalves, R.; Pio, R.; Chagas, E.A.; Seabra, R.M.; Andrade, P.B. Improved loquat (Eriobotrya japonica Lindl.) cultivars: Variation of phenolics and antioxidative potential. Food Chem. 2009, 114, 1019–1027. [Google Scholar] [CrossRef]
- Cai, Y.; Luo, Q.; Sun, M.; Corke, H. Antioxidant activity and phenolic compounds of 112 traditional Chinese medicinal plants associated with anticancer. Life Sci. 2004, 74, 2157–2184. [Google Scholar] [CrossRef] [PubMed]
- Zhou, C.H.; Sun, C.D.; Chen, K.S.; Li, X. Flavonoids, phenolics, and antioxidant capacity in the flower of Eriobotrya japonica Lindl. Int. J. Mol. Sci. 2011, 12, 2935–2945. [Google Scholar] [CrossRef] [PubMed]
- Xu, H.X.; Chen, J.W. Commercial quality, major bioactive compound content and antioxidant capacity of 12 cultivars of loquat (Eriobotrya japonica Lindl.) fruits. J. Sci. Food Agric. 2011, 91, 1057–1063. [Google Scholar] [CrossRef] [PubMed]
- Ercisli, S.; Gozlekcib, S.; Sengulc, M.; Hegedusd, A.; Tepee, S. Some physicochemical characteristics, bioactive content and antioxidant capacity of loquat (Eriobotrya japonica (Thunb.) Lindl.) fruits from Turkey. Sci. Hortic.-Amsterdam. 2012, 148, 185–189. [Google Scholar] [CrossRef]
- Polat, A.; Oguzhan, C.; Sedat, S.; Onur, S.; Cemal, K. Determining total phenolic content and total antioxidant capacity of loquat cultivars grown in Hatay. Pharmacogn. Mag. 2010, 6, 5–8. [Google Scholar] [CrossRef] [PubMed]
- Pande, G.; Akoh, C.C. Organic acids, antioxidant capacity, phenolic content and lipid characterisation of Georgia-grown underutilized fruit crops. Food Chem. 2010, 120, 1067–1075. [Google Scholar] [CrossRef]
- Clifford, M.N.; Johnston, K.L.; Knight, S.; Kuhnert, N. Hierarchical scheme for LC-MSn identification of chlorogenic acids. J. Agric. Food Chem. 2003, 51, 2900–2911. [Google Scholar] [CrossRef] [PubMed]
- Hvattum, E.; Ekeberg, D. Study of the collision-induced radical cleavage of flavonoid glycosides using negative electrospray ionization tandem quadrupole mass spectrometry. J. Mass Spectrom. 2003, 38, 43–49. [Google Scholar] [CrossRef] [PubMed]
- Seeram, N.P.; Aviram, M.; Zhang, Y.; Henning, S.M.; Feng, L.; Dreher, M.; Heber, D. Comparison of antioxidant potency of commonly consumed polyphenol-rich beverages in the United States. J. Agric. Food Chem. 2008, 56, 1415–1422. [Google Scholar] [CrossRef] [PubMed]
- Koroleva, O.; Torkova, A.; Nikolaev, I.; Khrameeva, E.; Fedorova, T.; Tsentalovich, M.; Amarowicz, R. Evaluation of the antiradical properties of phenolic acids. Int. J. Mol. Sci. 2014, 15, 16351–16380. [Google Scholar] [CrossRef] [PubMed]
- Firuzi, O.; Giansanti, L.; Vento, R.; Seibert, C.; Petrucci, R.; Marrosu, G.; Agostino, R.; Saso, L. Hypochlorite scavenging activity of hydroxycinnamic acids evaluated by a rapid microplate method based on the measurement of chloramines. J. Pharm. Pharmacol. 2003, 55, 1021–1027. [Google Scholar] [CrossRef] [PubMed]
- Brand-Williams, W.; Cuvelier, M.E.; Berset, C. Use of a free-radical method to evaluate antioxidant activity. LWT-Food Sci. Technol. 1995, 28, 25–30. [Google Scholar] [CrossRef]
- Re, R.; Pellegrini, N.; Proteggente, A.; Pannala, A.; Yang, M.; Rice-Evans, C. Antioxidant activity applying an improved ABTS radical cation decolorization assay. Free Radic. Bio. Med. 1999, 26, 1231–1237. [Google Scholar] [CrossRef]
- Benzie, I.F.F.; Strain, J.J. The ferric reducing ability of plasma (FRAP) as a measure of “antioxidant power”: The FRAP assay. Anal. Biochem. 1996, 239, 70–76. [Google Scholar] [CrossRef] [PubMed]
- Sample Availability: Samples of the loquat fruit are available from the authors.
© 2015 by the authors. Licensee MDPI, Basel, Switzerland. This article is an open access article distributed under the terms and conditions of the Creative Commons Attribution license ( http://creativecommons.org/licenses/by/4.0/).
Share and Cite
Zhang, W.; Zhao, X.; Sun, C.; Li, X.; Chen, K. Phenolic Composition from Different Loquat (Eriobotrya japonica Lindl.) Cultivars Grown in China and Their Antioxidant Properties. Molecules 2015, 20, 542-555. https://doi.org/10.3390/molecules20010542
Zhang W, Zhao X, Sun C, Li X, Chen K. Phenolic Composition from Different Loquat (Eriobotrya japonica Lindl.) Cultivars Grown in China and Their Antioxidant Properties. Molecules. 2015; 20(1):542-555. https://doi.org/10.3390/molecules20010542
Chicago/Turabian StyleZhang, Wenna, Xiaoyong Zhao, Chongde Sun, Xian Li, and Kunsong Chen. 2015. "Phenolic Composition from Different Loquat (Eriobotrya japonica Lindl.) Cultivars Grown in China and Their Antioxidant Properties" Molecules 20, no. 1: 542-555. https://doi.org/10.3390/molecules20010542