2.1. Optimization of HILIC-UV Method
HILIC is an alternative LC mode for separating polar compounds [
19,
20]. Recent technological developments in the design of silica-based stationary phases with smaller particles or monoliths have expanded the application of HILIC also to the separation of glycans and glycopeptides [
21], while the number of reports on intact glycoprotein analysis is still limited.
In this work, two different commercial HILIC columns were studied in order to set up an analytical HPLC-UV method able to separate non-glycosylated proteins from the glycosylated counterparts and to resolve the different glycoforms. Particularly, a carbamoyl silica column (TSKgel Amide-80) was chosen since it is widely used for glycopeptide separations [
22,
23] and was recently described for intact glycoprotein analysis [
17,
18]. The pore size of this stationary phase is suitable for low and medium molecular weight proteins. A porous polymeric sulfoalkylbetaine column (ZIC-
pHILIC) was also included. Zwitterionic HILIC columns have been extensively used for the separation of polar compounds including glycopeptides [
24] and for selective purification/enrichment of glycosylated peptides [
25] but, to our best knowledge, no reports on the separation of intact glycoproteins are published. The polymeric ZIC-
pHILIC is pH stable and can never exhibit silanol interactions and therefore gives the largest freedom during method development.
The standard proteins selected in this work were RNase A, a 13,681 Da protein, and its glycosylated variant RNase B, which exists in five glycoforms varying for the number of mannose residues (from five to nine) attached to the chitobiose core in the glycan portion.
During the initial method development, column temperature and flow rate were fixed at the convenient values of 25 °C and 0.2 mL/min, respectively. Samples were prepared dissolving the protein/glycoprotein in acetonitrile/water (50:50, v/v) and analyzed injecting a low volume (2 µL) to avoid the deterioration of peak shape due to high percentages of water [
26].
Initial experiments were based on existing literature reports [
18]. Thus, the TSKgel Amide-80 column and 0.1% (v/v) trifluoroacetic acid (TFA), already described by Zhang and co-workers [
18], were used for the separation of the model proteins. Acetonitrile was used throughout as it has lower UV cut-off absorption and viscosity in aqueous mixtures, and because it is known to generate good peak shapes and reproducible results [
27,
28]. Different gradients with high initial concentration of acetonitrile and increasing concentrations of water were tested to find the conditions providing acceptable sample retention and satisfactory resolution. These aims were achieved applying the following gradient: 68%–58% acetonitrile in 20 min followed by isocratic elution at 58% acetonitrile for 10 min. Under these conditions, RNase A eluted much earlier (
tR = 13.1 min) than the first eluting glycoform of RNase B (
tR = 20.2 min) and the five glycosylated isoforms of RNase B could be partially resolved (Rs of 0.8 between the first two glycoforms). In HILIC, the
tR generally increases with increasing water solubility and polarity of the analyte, and therefore with the length of the glycan chains.
After these promising results obtained using TFA as mobile phase modifier, a revision of the literature regarding different HPLC modifiers was carried out. The report of Shibue
et al. [
29] suggested that HClO
4 could provide additional or different selectivity in comparison with TFA, at least in RP-HPLC. Therefore, HClO
4 was tested in our HILIC separations. The acid was added to mobile phase at concentration close to that of TFA (10 mM). The organic solvent content had to be increased to avoid a too rapid elution of proteins.
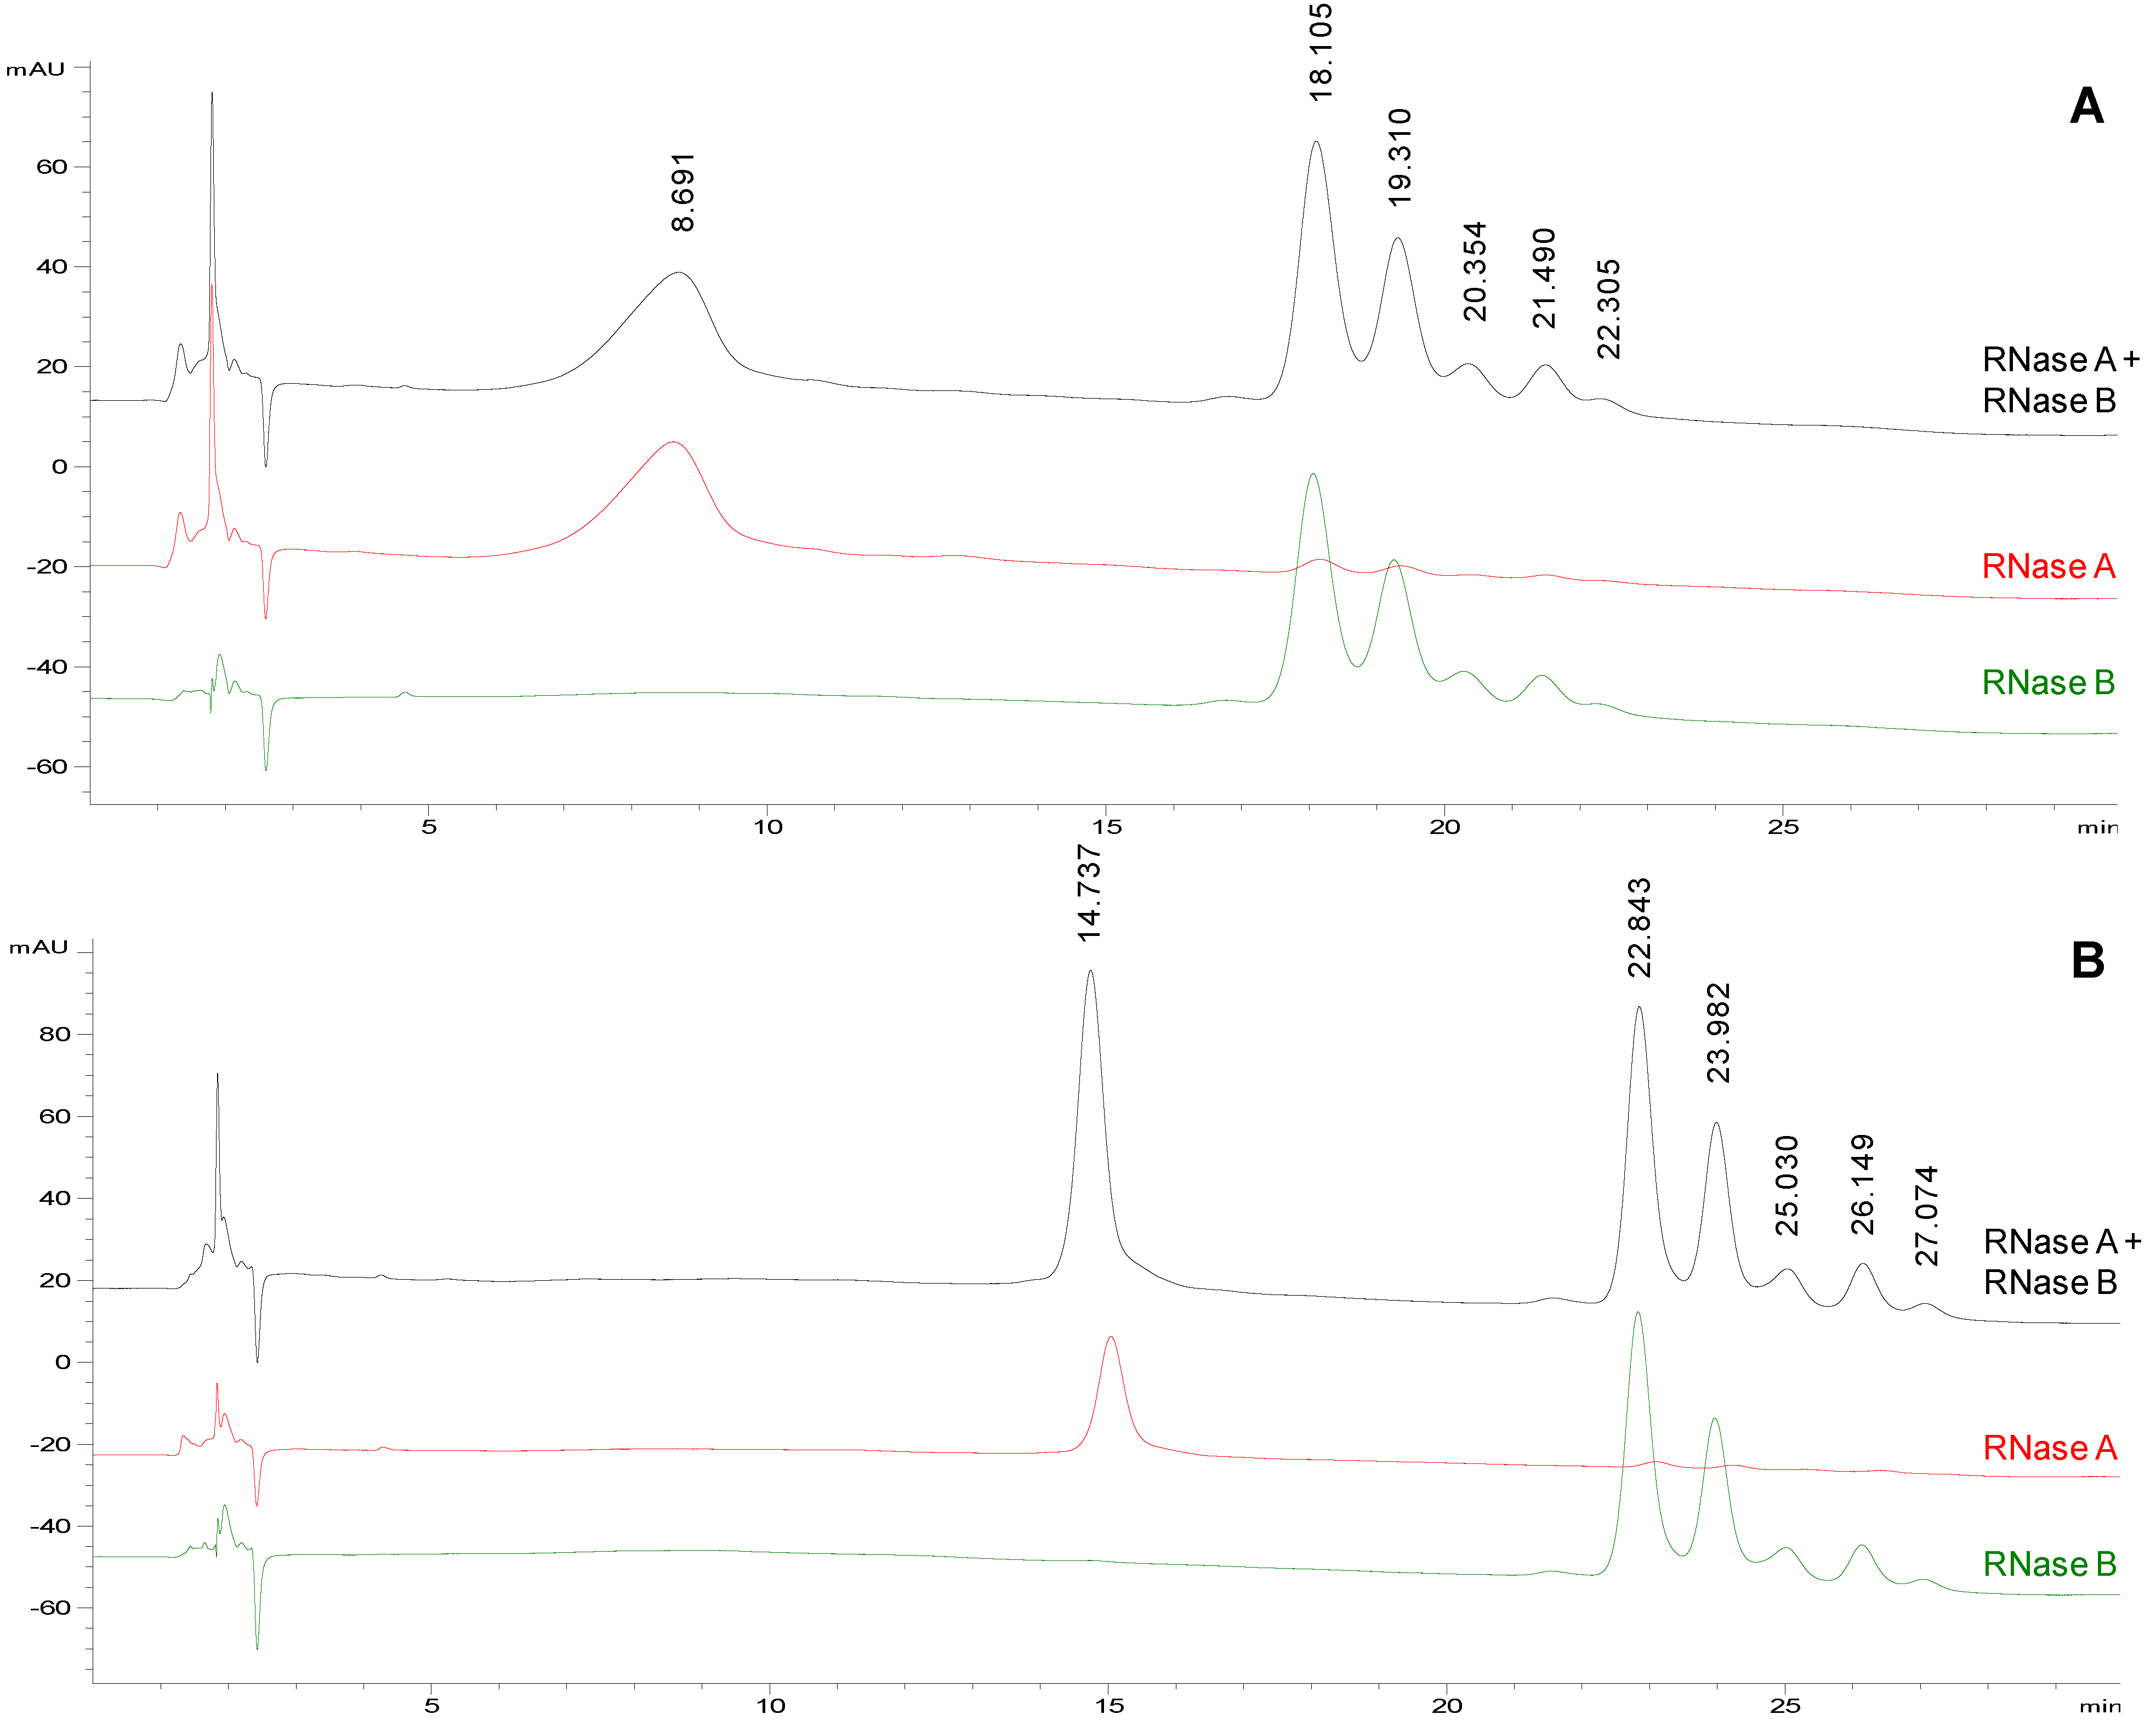
Figure 1A shows the separation of the model proteins obtained applying the following gradient: 75%–65% acetonitrile in 20 min followed by isocratic elution at 65% acetonitrile for 10 min. With these new chromatographic conditions, higher selectivity and resolution were achieved: RNase A eluted at 8.691 min while RNase B glycoforms started to elute at 18.105 min and were well resolved (Rs of 1.1 between the first two glycoforms) and better separated from the non-glycosylated protein.
Figure 1.
Representative chromatographic profiles for RNase A (red traces), RNase B (green traces) and their equimolar mixture (black traces) on TSKgel Amide-80, eluted at a flow rate of 0.2 mL/min. a Mobile phases: acetonitrile (solvent A) and water (solvent B) both containing 10 mM HClO4. Conditions: from 75 to 65% A in 20 min followed by isocratic elution at 65% A for 10 min. Injection volume: 2 µL. Column temperature: (panel A) 25 °C and (panel B) 50 °C.
a Samples were prepared in acetonitrile/water (50:50, v/v) at the following concentrations: (panel A) 0.5 mg/mL of protein/glycoprotein; (panel B) RNase A at 0.25 mg/mL, RNase B and RNase A and B mixture at 0.5 mg/mL.
Chromatographic conditions similar to those already described for TSKgel Amide-80 column were then tested on the ZIC-pHILIC column. Additionally, a mobile phase containing ammonium acetate (10 mM) was studied. The unsatisfactory results obtained led us to try one additional ZIC-pHILIC column with more surface modification and lower surface area prepared specifically for this study. The poor results obtained also with this column lead us to abandon the zwitterionic stationary phase and to direct our efforts on optimizing the chromatographic method using the TSKgel Amide-80 column.
Starting from the chromatographic conditions that led to the best separation of glycoforms on TSKgel Amide 80 column (
Figure 1A), the column temperature was increased to 50 °C (
Figure 1B) in order to improve the resolution and the peak shapes [
30]. As shown in
Figure 1 the rise in temperature significantly affected the chromatographic profile prolonging the
tR (both of protein and glycoprotein isoforms) but also reducing peak widths and improving symmetry. Under these chromatographic conditions, RNase A elutes at a mean
tR = 14.9 ± 0.5 min (
n = 5), while the five glycoforms of RNase B (GlcNAc
2Man
5 → GlcNAc
2Man
9) elute at mean
tR of 22.7 ± 0.4 min; 23.8 ± 0.4 min; 24.9 ± 0.4 min; 26.0 ± 0.4 min; 26.9 ± 0.4 min, respectively (
n = 4). The glycoform elution order (from Man5 to Man9) can be assigned with confidence taking into account the ESI-MS spectrum generated by flow injection analysis (FIA) of the same sample as in
Figure S1 (Supporting Information). The data reported in literature on commercial RNase B glycoform composition and the retention mechanism exhibited by the TSKgel Amide-80 stationary phase [
23,
31,
32] also supports our peak assignment. Under the selected conditions, also the Rs between the first two glycoforms increases from 1.1 (
Figure 1A, 25 °C) to 1.4 (
Figure 1B, 50 °C).
To further improve the glycoform peak shapes and resolution, RNase B analyses were performed dissolving the glycoprotein in a sample diluent containing lower amount of water (acetonitrile/water 90:10, v/v). With this proportion of acetonitrile/water, a small percentage of HClO
4 (10 mM) had to be added to maintain the glycoprotein in solution. The chromatographic profile obtained was comparable to that already reported for the sample dissolved in acetonitrile/water 50:50 (v/v) (
Figures S2 and S3, Supporting Information). This similarity could be explained with a limited influence of the water content in the sample dissolution solvent when a very small volume was injected [
26]. In fact, additional experiments performed using an higher injection volume (10 µL) have shown a considerable peak shape distortion due to the presence of an important amount of water (
Figures S2 and S3, Supporting Information). Considering these results, we decided to analyze samples prepared in acetonitrile/water 50:50 (v/v) in combination with a low injected volume (2 µL).
In conclusion, the HPLC conditions selected were as follows: mobile phase composed of acetonitrile/water both containing 10 mM HClO4, linear gradient from 75% to 65% acetonitrile in 20 min followed by isocratic elution at 65% acetonitrile for 10 min, column temperature at 50 °C, injection volume of 2 μL and flow rate of 0.2 mL/min.
2.2. Analysis of Neo-Glycoproteins
The rational design process and the initial synthesis of new glycoconjugate biotherapeutics can gain from analytical methods able to discriminate intact glycoproteins with slight differences in hydrophobicity, as the preliminary studies on glycosylation extent and protein surface reactivity are often carried out using inexpensive short-chain activated polysaccharides. Thus, the optimized analytical method for RNase A and RNase B glycoforms (
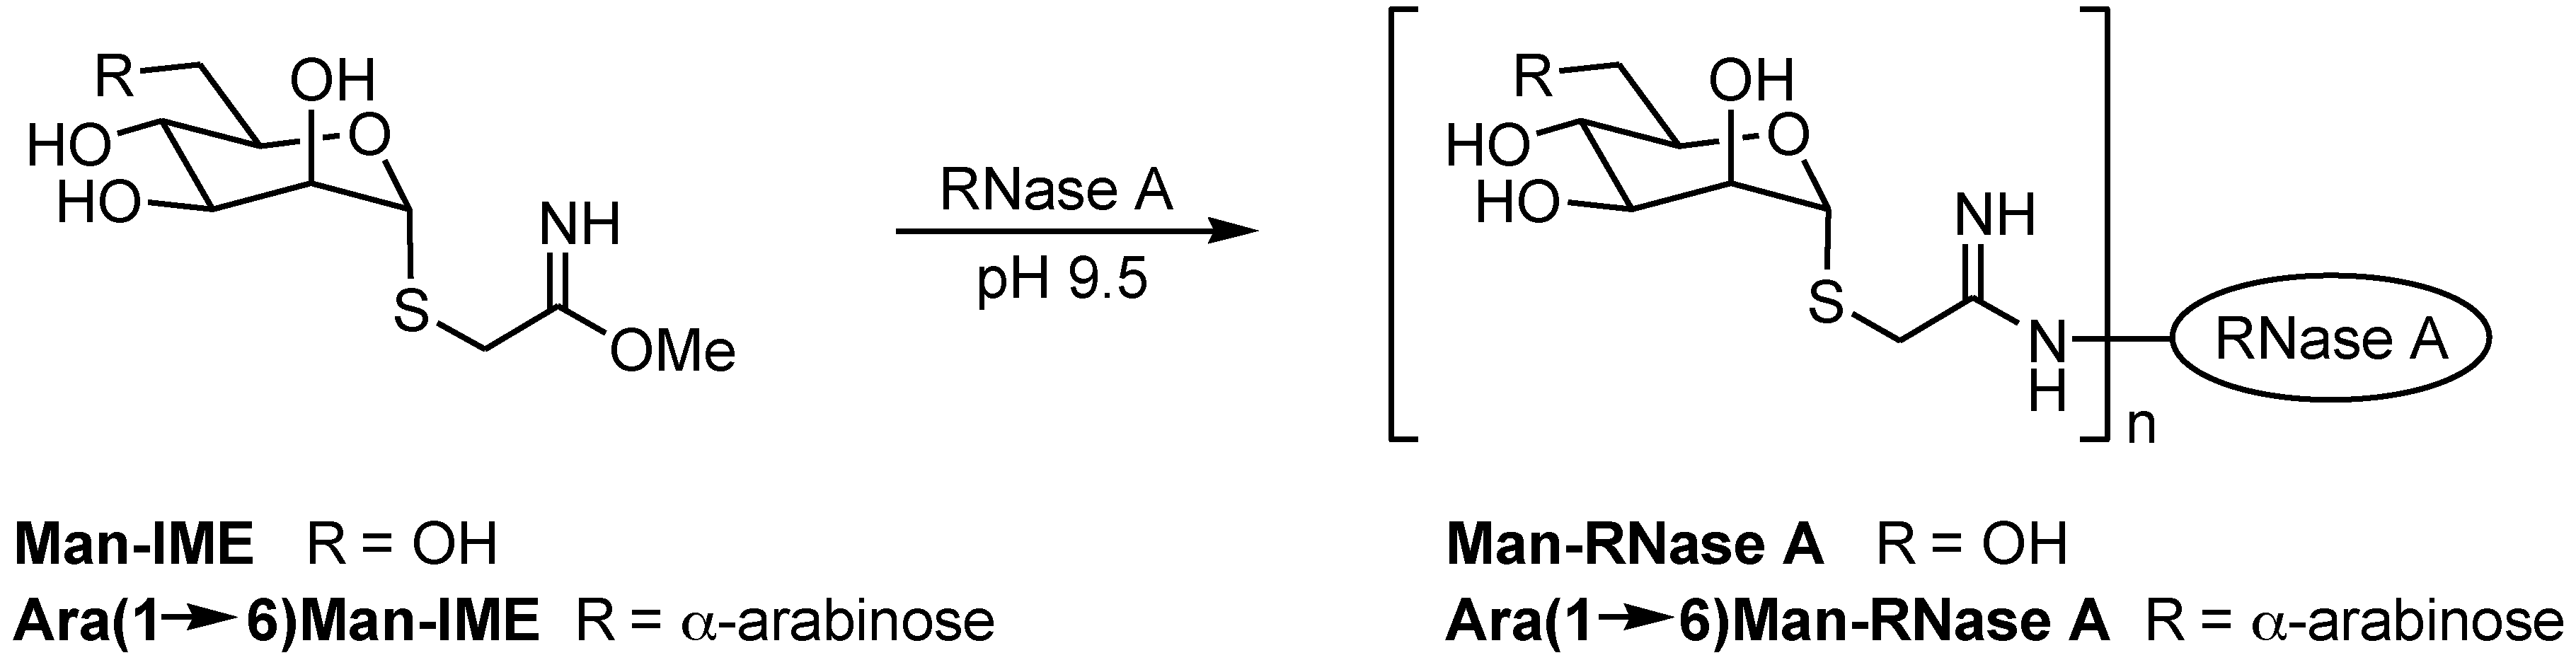
Section 2.1) was applied to non-natural semi-synthetic glycoconjugates with very small glycan moieties. RNase A was coupled to Man-IME following the reaction depicted in
Scheme 1, under the experimental conditions reported in
Section 3.2. IME is known to react with the ε-amino group of Lys residues, and the model RNase A (124 amino acids, molecular mass 13,681 Da) contains ten Lys residues. Thus, the condensation of each Man-IME to one Lys ε-amino group results in a mass shift of + 235 Da of the RNase molecular weight, while condensation with Ara(1→6)Man-IME results in a mass shift of + 367 Da per disaccharide unit (
Scheme 1).
After 24 h incubation, the final products were purified and analyzed in parallel by HILIC-UV and FIA-ESI-MS. Glycosylation reactions were performed at different temperatures (reaction 1 at 37 °C and reaction 2 at 25 °C,
Table 1) to assess the ability of the method to discriminate differences in the final product composition resulting from the different reaction conditions applied. Data reported in
Table 1 are mean values measured from replicate analysis. All the reaction mixtures were purified before the analysis following the procedure described in
Section 3.3.2. It should be noted that the full sample preparation process required more than 2 h. The two explored glycosylation conditions resulted in different conjugation conversion percentages (93.1% at 37 °C and 100% at 25 °C) together with different tagging efficiency (moles of mannose units per mole of protein) suggesting that at 25 °C the whole conjugation reaction was more efficient.
Table 1.
Man-RNase A glycoform distribution (percentage abundance), conjugation conversion (%C) and Man/protein ratio (mole/mole) as calculated by relative abundance in MS spectra and peak heights in HPLC-UV chromatograms.
Table 1.
Man-RNase A glycoform distribution (percentage abundance), conjugation conversion (%C) and Man/protein ratio (mole/mole) as calculated by relative abundance in MS spectra and peak heights in HPLC-UV chromatograms.
| # | Analysis (replicates) | n° Man units (%) ± SD | %C ± SD | Man/protein (mole/mole) ± SD |
|---|
| 0 | 1 | 2 | 3 | 4 | 5 | 6 | 7 |
|---|
| 1 a | MS (n = 3) | 6.9 ± 0.1 | 20.4 ± 0.3 | 29.7 ± 0.4 | 21.7 ± 0.6 | 14.1 ± 0.4 | 7.2 ± 0.3 | n.d. | n.d. | 93.1 ± 0.1 | 2.37 ± 0.01 |
| LC-UV (n = 3) | 6.9 ± 0.1 | 19.7 ± 0.4 | 27.0 ± 0.3 | 24.4 ± 0.2 | 15.2 ± 0.1 | 6.8 ± 0.4 | n.d. | n.d. | 93.1± 0.1 | 2.42 ± 0.02 |
| 2 b | MS (n = 3) | n.d | 6.9 ± 0.3 | 14.9 ± 0.4 | 22.5 ± 0.2 | 24.8 ± 0.2 | 16.8 ± 0.3 | 9.9 ± 0.2 | 4.1 ± 0.2 | 100.0 | 3.76 ± 0.02 |
| LC-UV (n = 4) | n.d. | 5.16 ± 0.06 | 13.58 ± 0.07 | 22.7 ± 0.2 | 25.8 ± 0.2 | 19.4 ± 0.2 | 9.8 ± 0.2 | 3.6 ± 0.2 | 100.0 | 3.842 ± 0.007 |
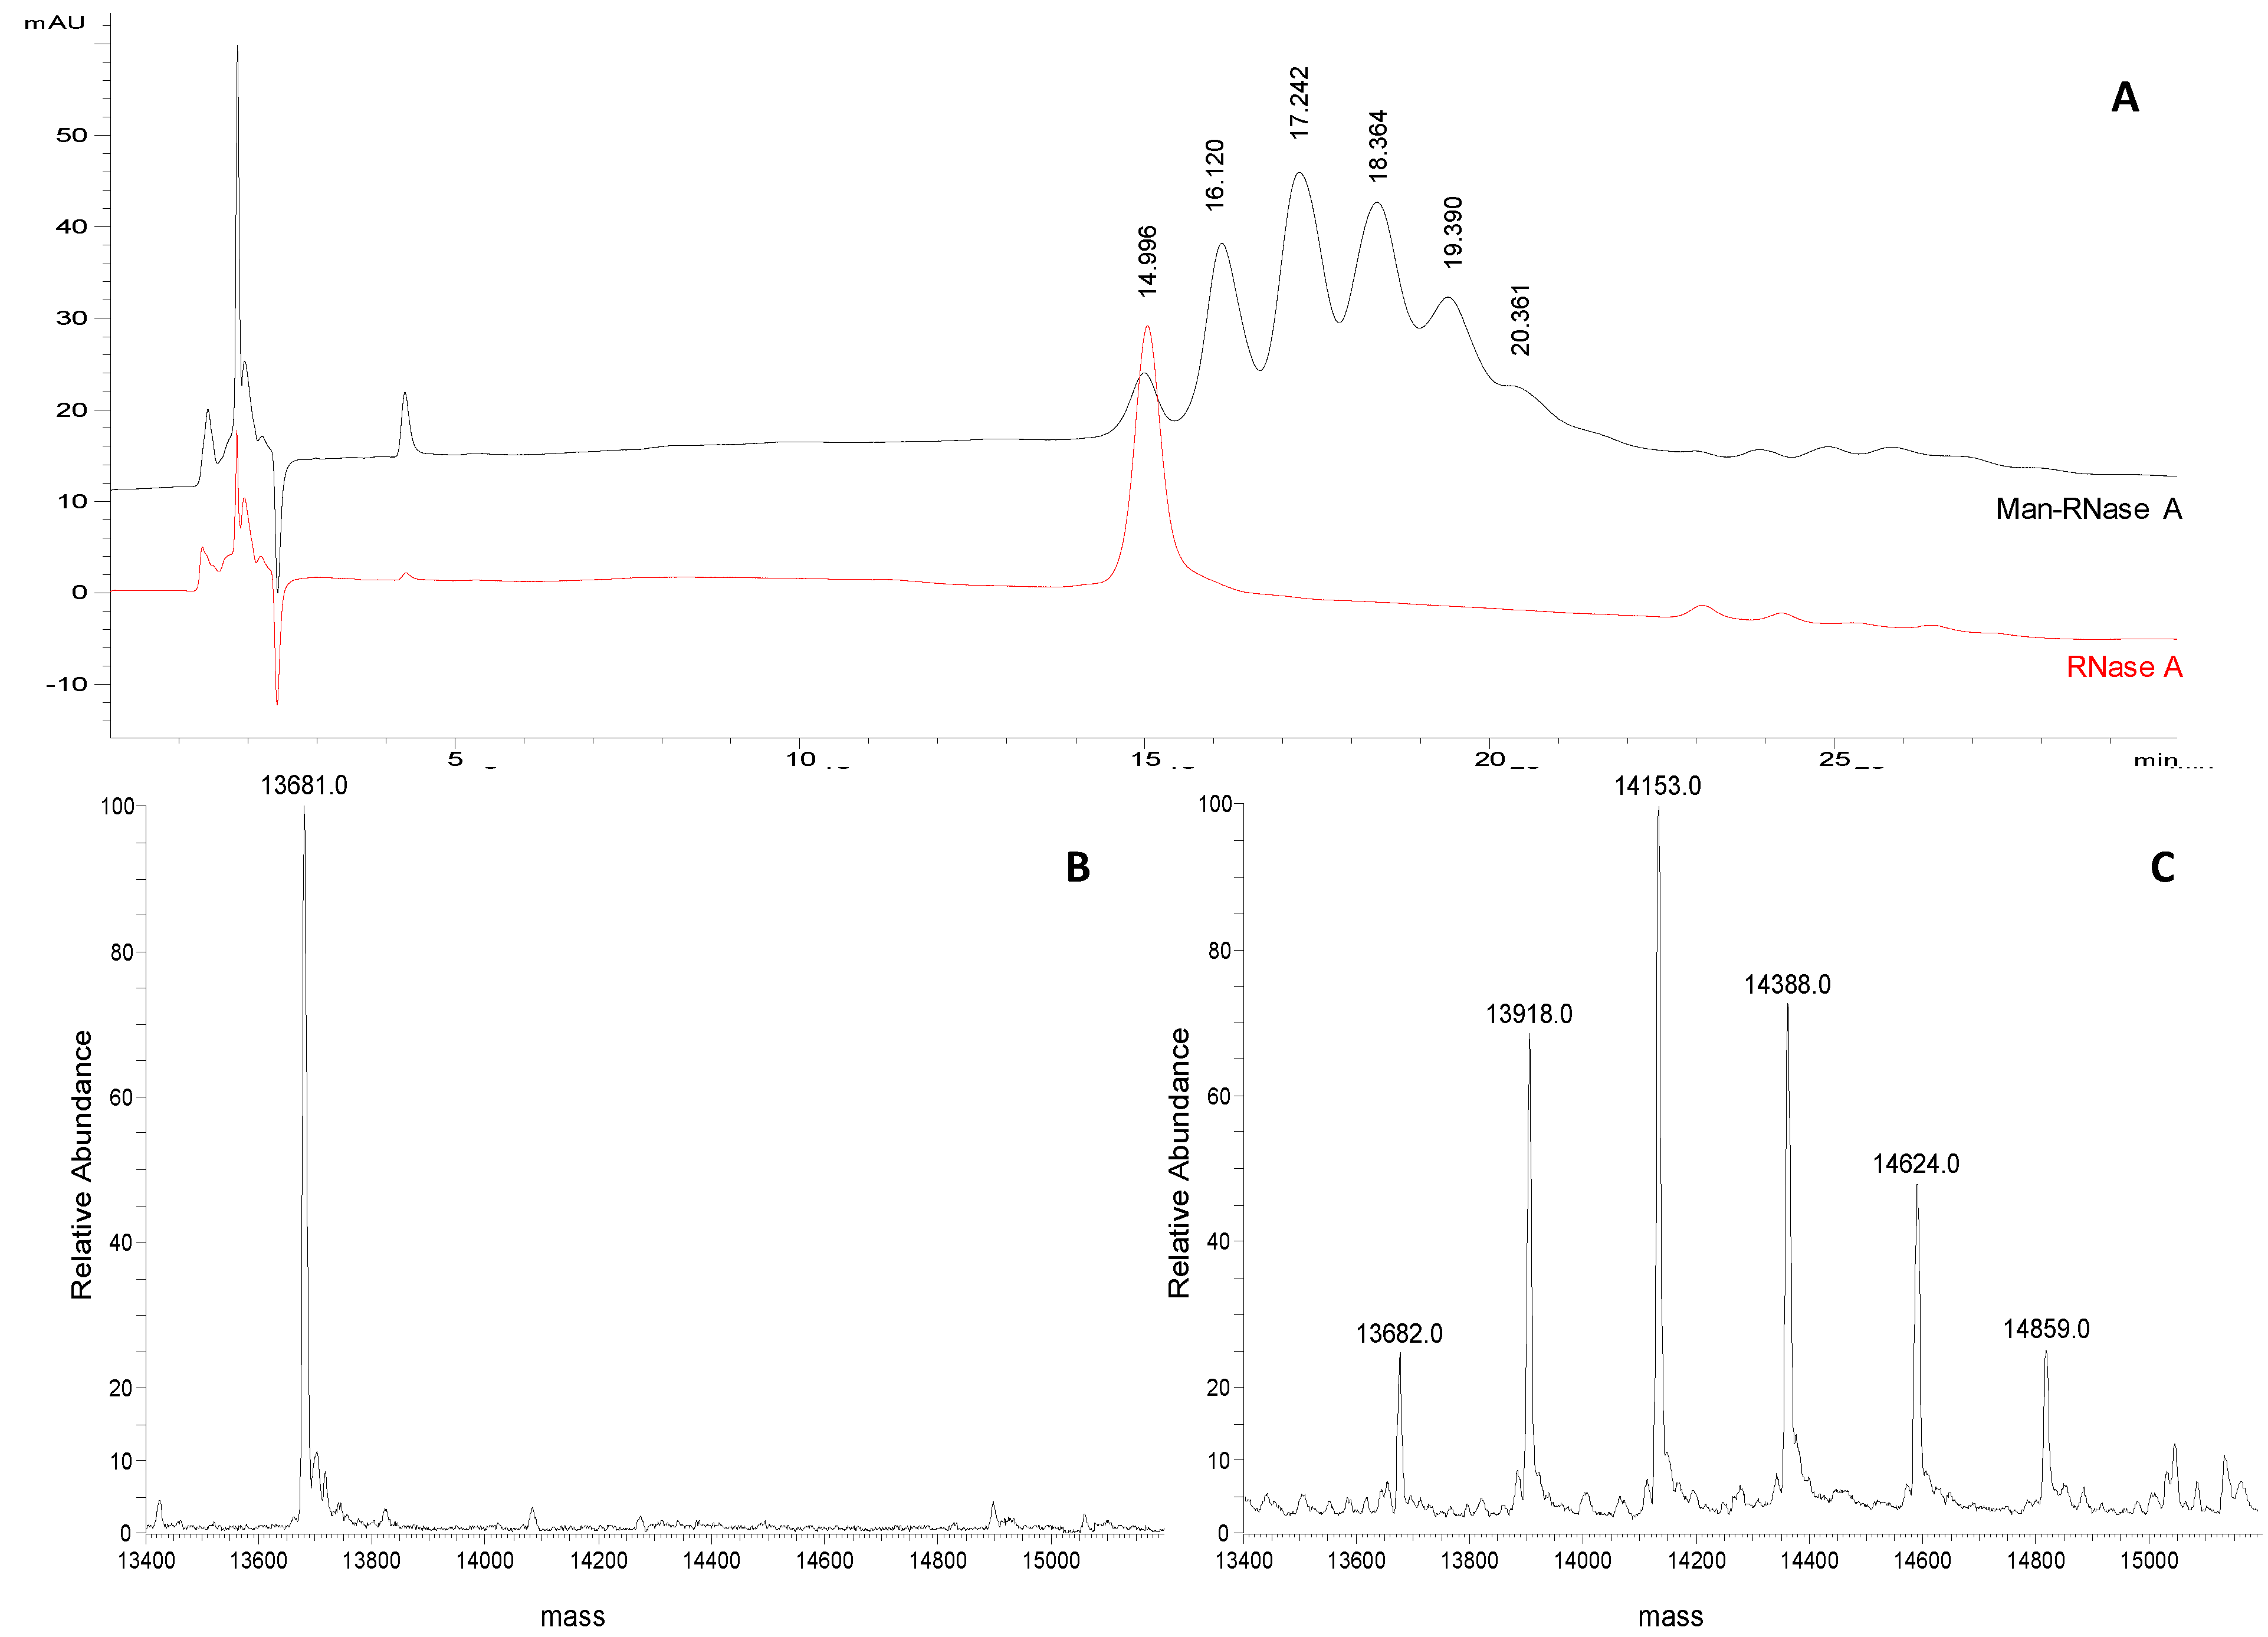
A representative chromatographic profile obtained for purified sample 1 (
Table 1) is given in
Figure 2A. A cluster of six partially resolved peaks can be observed in the chromatogram suggesting the occurrence of several glycoforms in the final product. The first eluting peak (mean
tR 15.1 ± 0.1 min,
n = 3) was attributed to unmodified RNase A by comparing the
tR to that of the pure standard protein (
Figure 1B). The following peaks, at 16.2 ± 0.1 min, 17.4 ± 0.1 min, 18.6 ± 0.2 min, 19.6 ± 0.1 min and 20.3 ± 0.1 min, likely represent the individual glycoforms of the resulting mannosylated RNase. Considering their
tR it might be hypothesised that they correspond to glycoforms carrying from 1 to 5 mannose units, as the mean Δ
tR between the
neo-glycoforms is the same as is observed for standard RNase B glycoforms (1.0 min in both) in which the same structural change,
i.e., one mannose unit, occurs. This hypothesis was corroborated using FIA-ESI-MS data. The ESI-MS spectrum of the same sample (
Figure 2C) resulted in an overlapping
neo-glycoprotein profile composition. The presence of unreacted RNase A was confirmed by the presence of the 13,682 Da signal (
Figure 2B,C), as well as the consecutive glycoforms bearing from 1 to 5 mannose units (+ 235 Da per IME-activated monosaccharide unit). The same correspondence between both semi-quantitative methods was seen in all the glycosylation experiments monitored (sample 1, and sample 2 in
Table 1) (
Figure 3A).
Figure 2.
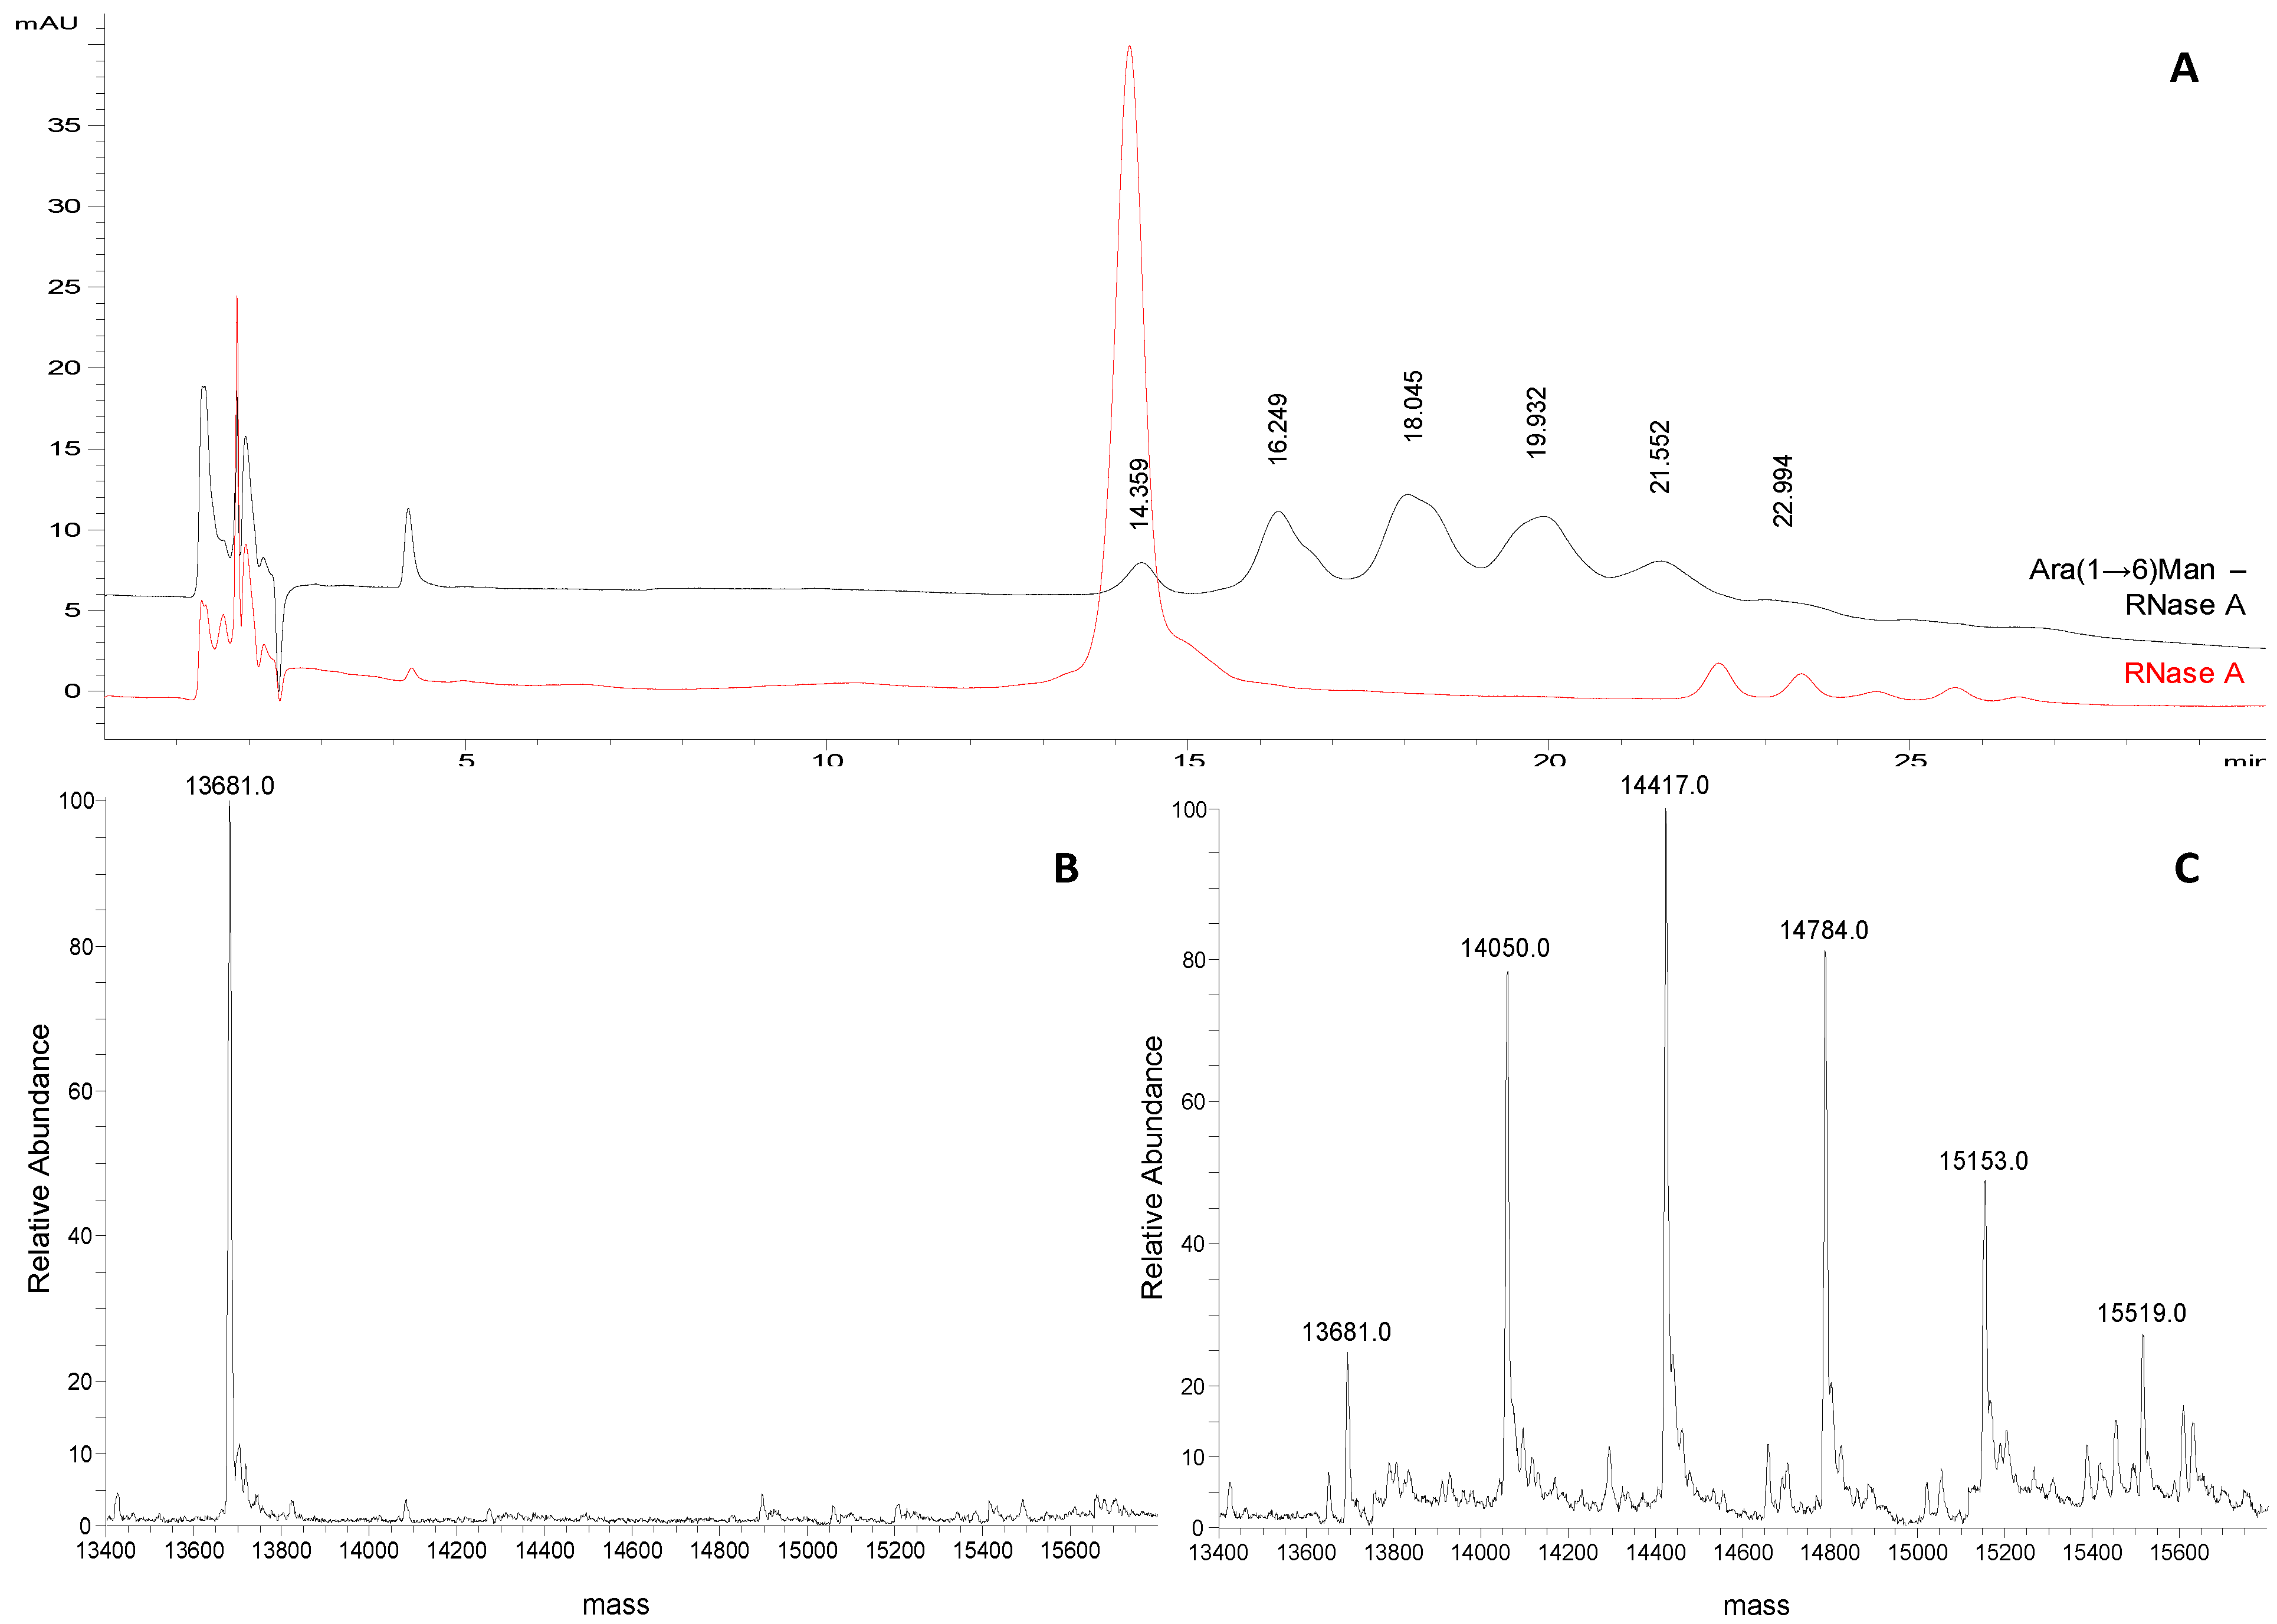
(A) Representative chromatograms of Man-RNase A and RNase A (1 mg/mL and 0.25 mg/mL, respectively; acetonitrile/water 50:50, v/v) obtained applying the selected chromatographic conditions (see experimental section). (B) Deconvoluted ESI-LTQ-MS spectrum for RNase A (13,681 Da). (C) Deconvoluted ESI-LTQ-MS spectrum for Man-RNase A (RNase A 13,681 Da, + 235 Da per mannose unit added).
Figure 2.
(A) Representative chromatograms of Man-RNase A and RNase A (1 mg/mL and 0.25 mg/mL, respectively; acetonitrile/water 50:50, v/v) obtained applying the selected chromatographic conditions (see experimental section). (B) Deconvoluted ESI-LTQ-MS spectrum for RNase A (13,681 Da). (C) Deconvoluted ESI-LTQ-MS spectrum for Man-RNase A (RNase A 13,681 Da, + 235 Da per mannose unit added).
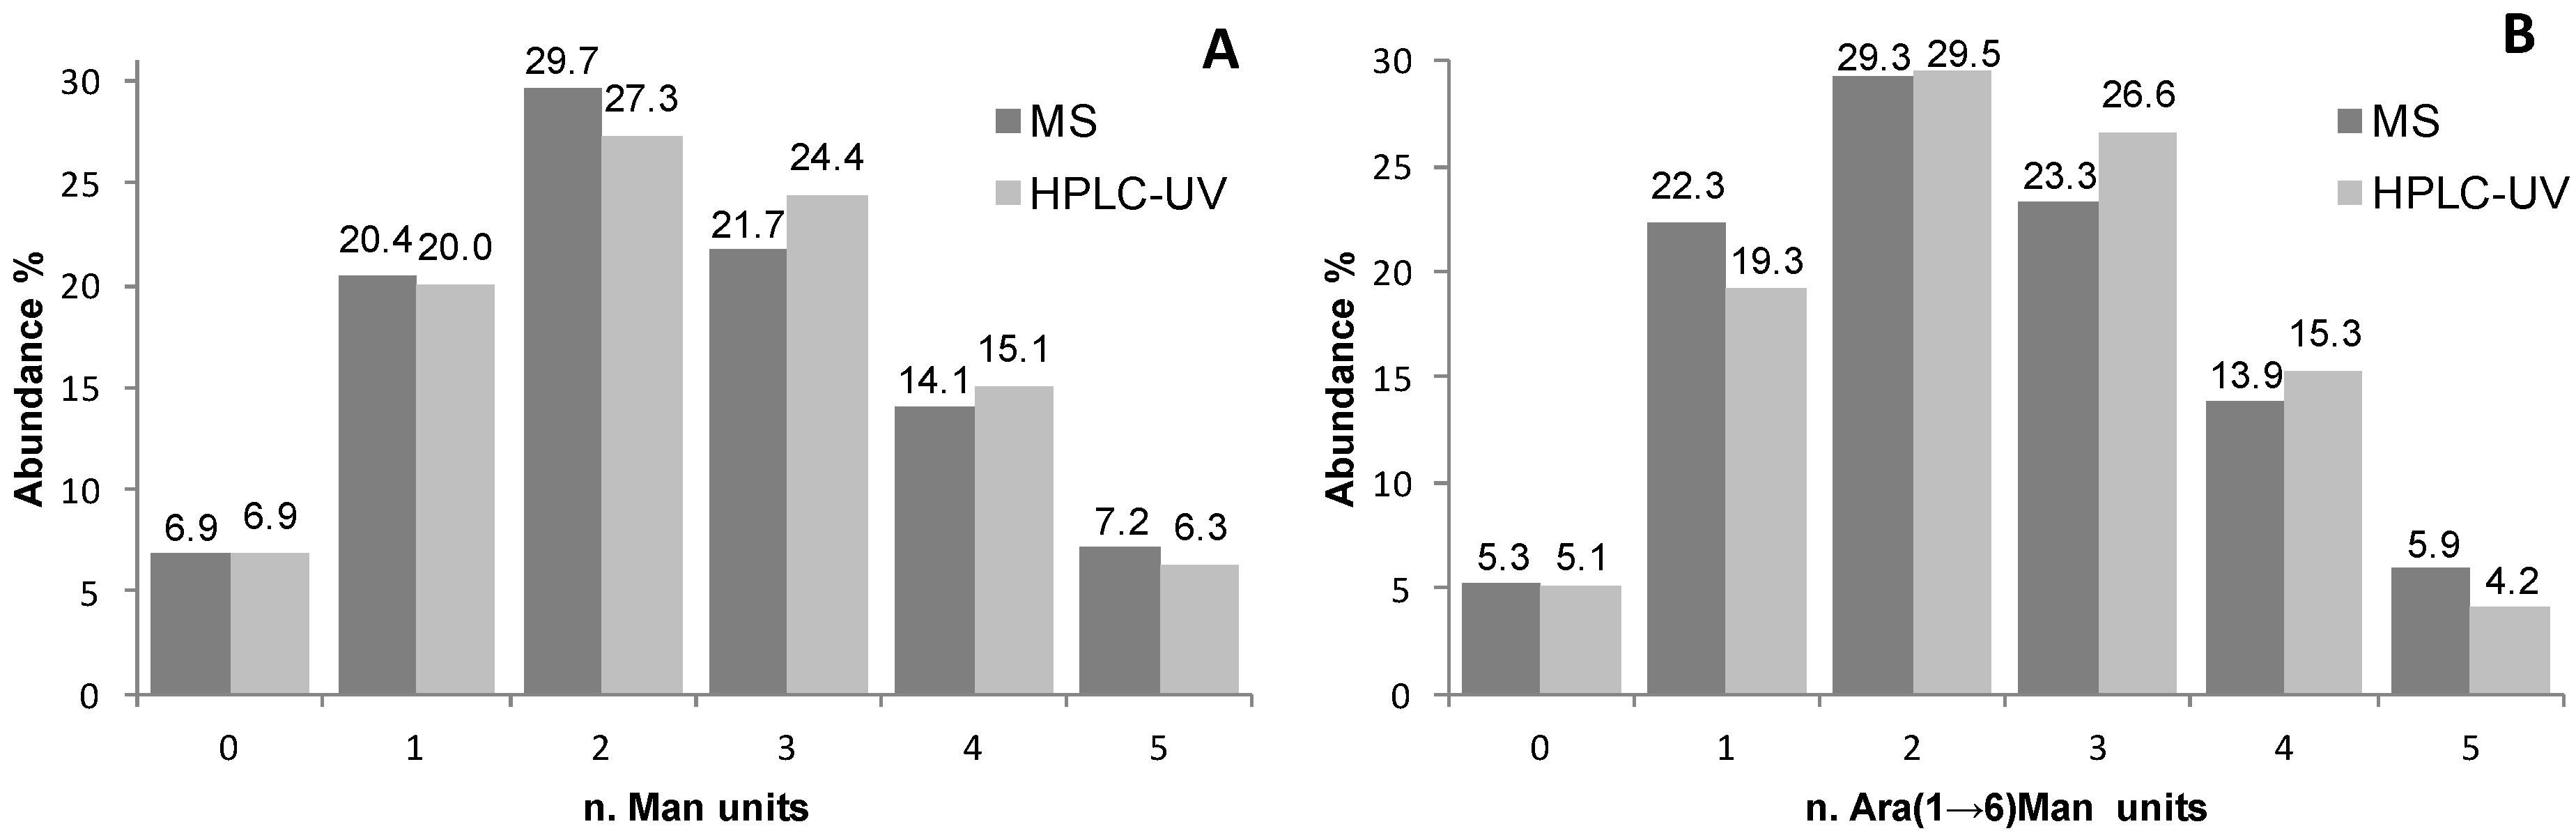
Figure 3.
Graphical representation of the glycoform distributions (as abundance percentage) as calculated by relative abundance in MS spectra and peak heights (A) and peak areas (B) in HILIC-UV chromatograms for samples (A) Man-RNase A and (B) Ara(1→6)Man-RNase A.
Figure 3.
Graphical representation of the glycoform distributions (as abundance percentage) as calculated by relative abundance in MS spectra and peak heights (A) and peak areas (B) in HILIC-UV chromatograms for samples (A) Man-RNase A and (B) Ara(1→6)Man-RNase A.
Ara(1→6)Man-IME glycoconjugates obtained with the same reaction protocol were also analyzed. A representative chromatographic profile is given in
Figure 4A, where the non-modified protein (
tR 14.359 min) and the five glycoderivatives elute showing almost baseline separation. Four replicate analysis were carried out and the consecutive glycoforms elute at mean
tRof 16.1 ± 0.3 min; 17.9 ± 0.3 min; 19.8 ± 0.3 min; 21.4 ± 0.2 min; 22.9 ± 0.2 min, respectively. From the data obtained, two main observations were made: first, the mean Δ
tR between the consecutive glycoforms increases from 1.0 min to 1.75 min compared to the mannose derivatives. This is in accordance with the different length of the attached glycan, proving the HILIC mechanism. Secondly, the peak shapes of the Ara(1→6)Man derivatives are neither symmetric nor regular. This problem might be related to glycosylation site heterogeneity, that is more evident when the saccharide chain length increases.
For this reason in the quantitative measurements peak areas instead of peak heights were compared to the relative abundances of the different products calculated from the ESI-MS of the same samples (Figures 3B and 4C). Also in this case, the same semi-quantitative data (
Figure 3B) and structural information (
Figure 4A–C) can be derived from both techniques, cross validating each-other.
Figure 4.
(A) Representative chromatograms of Ara(1→6)Man-RNase A and RNase A (1 mg/mL and 0.25 mg/mL, respectively; acetonitrile/water 50:50, v/v) obtained applying the selected chromatographic conditions (see experimental section). (B) Deconvoluted ESI-LTQ-MS spectrum for RNase A (13,681 Da). (C) Deconvoluted ESI-LTQ-MS spectrum for Ara(1→6)Man-RNase A (RNase A 13,681 Da + 367 Da per Ara(1→6)Man unit added).
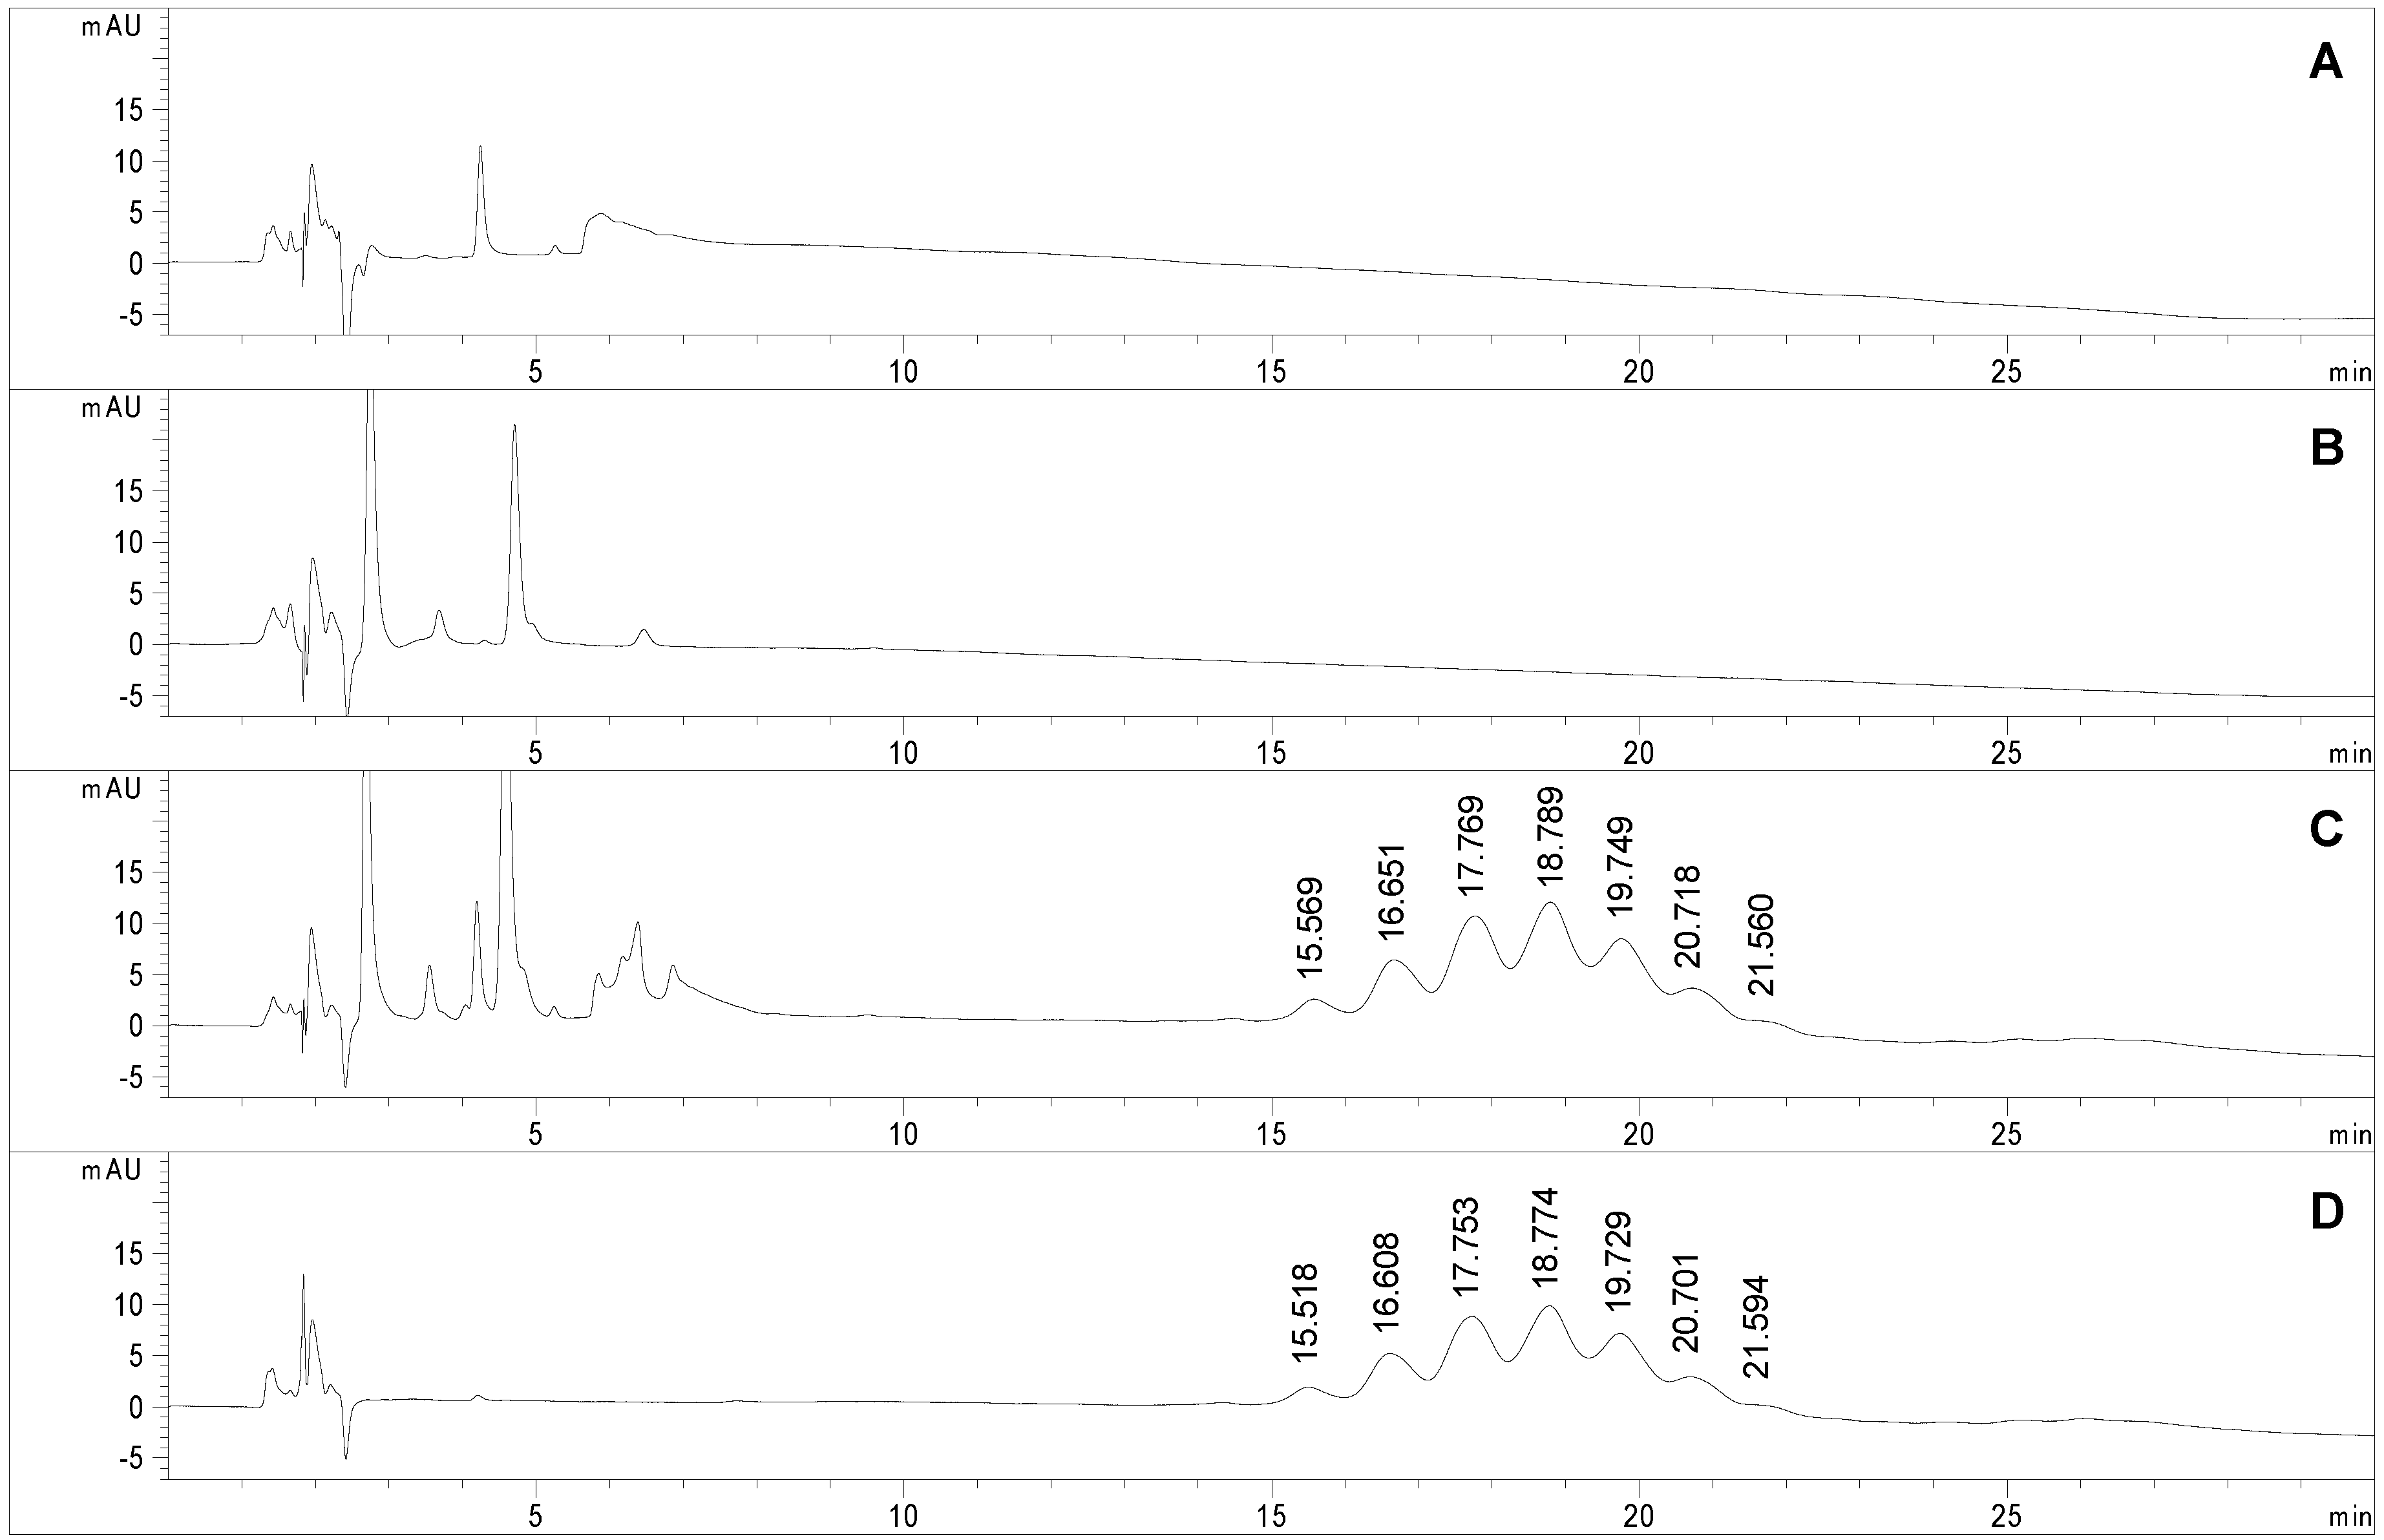
At the present state of the art in glycoprotein analysis, one of the main bottlenecks limiting analysis throughput is the sample preparation step. In the case of protein glycosylation, as already stated, a 2 h sample clean-up is required to remove reagents and salts after the coupling reaction. This step is mandatory prior to any FIA-ESI-MS analysis due to the presence of non volatile salts, while the HILIC-UV method could avoid the time consuming purification step. A study was carried out to assess the chromatographic profile of each component of the coupling reaction mixture to verify method selectivity.
Figure 5 reports the chromatographic profiles obtained upon injection of the reaction buffer (trace A), the Man-IME reagent (trace B) and the final reaction product (namely sample 2,
Table 1) before (trace C) and after (trace D) the purification protocol. All solvents and chemical reagents elute in the first part of the chromatogram without interfering with the macromolecules. No significant effect on the
tR of the glycoforms occurred, the Δ
tR between consecutive glycoforms was estimated to 1.00 min in the non purified sample, and 1.01 min in the purified one. This demonstrates that the presence of high amounts of Man-IME reagent (trace C) does not affect the selectivity of the stationary phase.
Also the semi-quantitative data on crude samples were highly consistent with those obtained with the purified samples (sample 2,
Table 1): indeed, glycoform composition of the raw sample (trace C) was estimated as 5.1% (Man1), 13.6% (Man2), 22.8% (Man3), 26.1% (Man4), 19.1% (Man5), 9.5% (Man6), 3.7% (Man7).
Figure 5.
Chromatograms obtained applying the selected conditions (see experimental section) to the analyses of (A) sodium tetraborate buffer (100 mM, brought to pH 6 with HCl and diluted 1:2 with acetonitrile), (B) Man-IME (1 mg/mL in acetonitrile/water 50:50, v/v); (C) non-purified and (D) purified Man-RNase A (0.4 mg/mL in acetonitrile/water 50:50, v/v).
Figure 6.
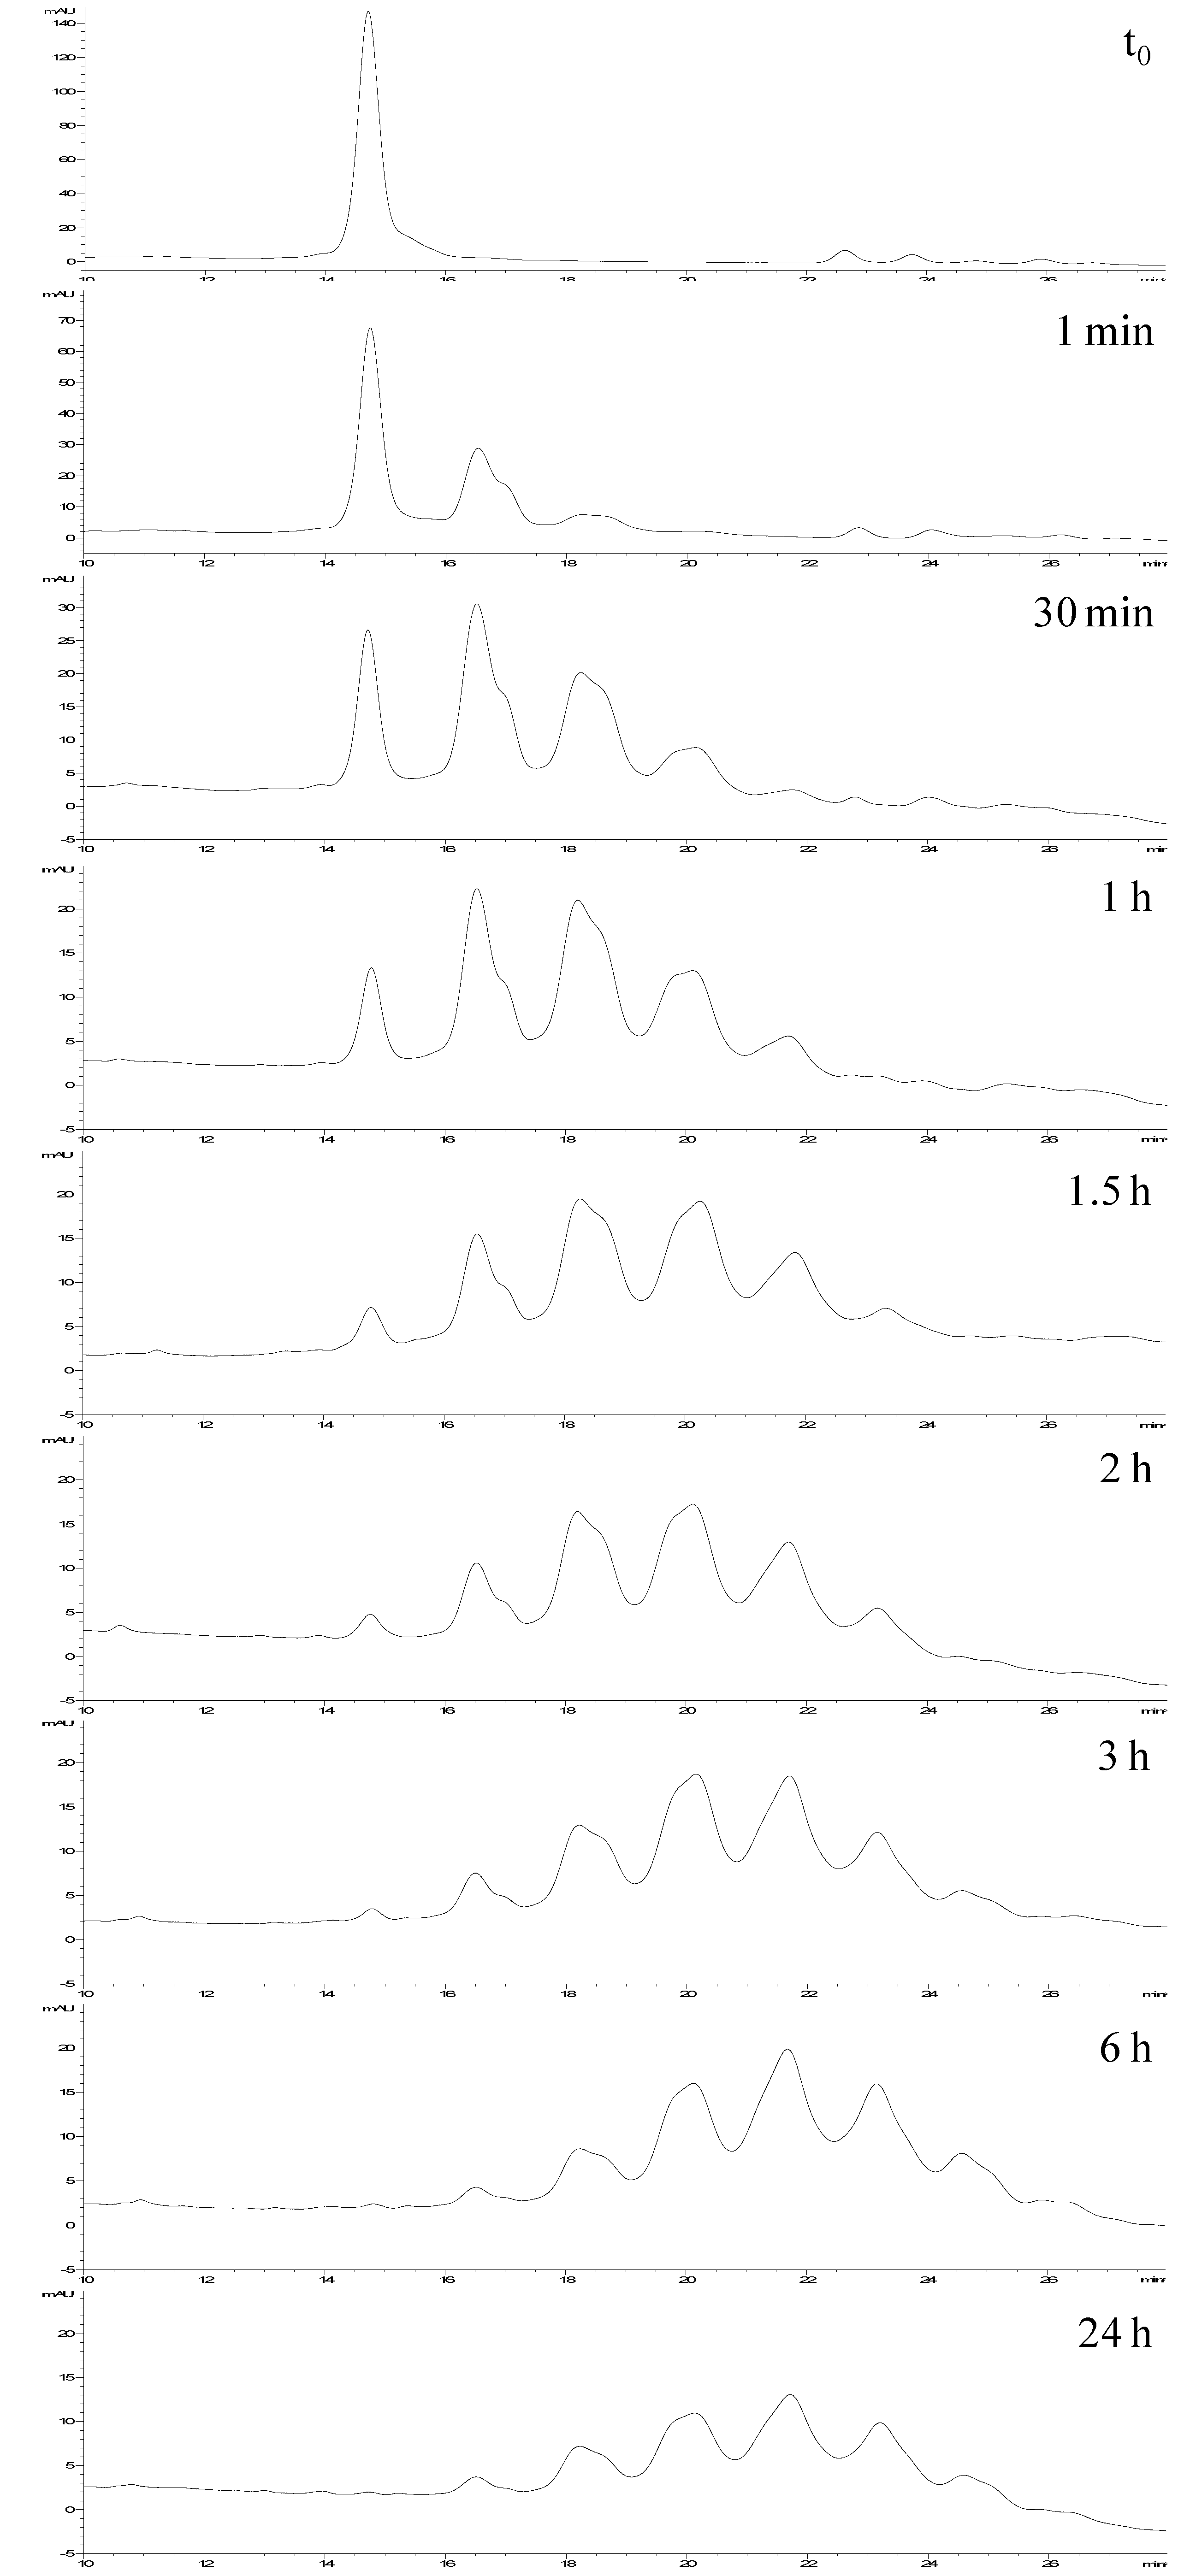
Monitoring of the synthesis of neo-glycoconjugates by coupling Ara(1→6)Man-IME with RNase A.
Figure 6.
Monitoring of the synthesis of neo-glycoconjugates by coupling Ara(1→6)Man-IME with RNase A.
2.3. Application of the HILIC-UV Method to Conjugation Reaction Monitoring
When a neo-glycoprotein is prepared via a semi-synthetic route reaction monitoring is by measuring the consumption of the reagents, in this case the non modified protein, from which the reaction yield can be assessed. Additionally, the capability to separate and quantify the individual glycoderivatives produced allows much better control over the actual conversion to the desired product. The analysis of intact protein/neo-glycoproteins at the end or during the coupling reaction represents a rapid alternative to peptide mapping. In addition, the omission of sample preparation step guarantees little sample consumption and high analysis throughput.
For these reasons the selected HILIC-UV method was applied to investigate the kinetics of the conjugation process by monitoring the reaction of RNase A with the disaccharide Ara(1→6)Man-IME.
The reaction was carried out according to protocol (
Section 3.2) at 25 °C for 24 h and samples were collected at scheduled times (1 min, every 30 min for the first 3 h, at 4 h, 6 h, 8 h and the end of the reaction). Each sample was brought to pH 5–6 to stop the glycosylation reaction and injected in the HPLC system without purification (as described in
Section 3.3.2).
Figure 6 shows representative chromatograms of this reaction monitoring. At each analyzed time, the HPLC-UV analysis allowed us to determinate the conjugation conversion (by the % of non-reacted protein) and the number as well as distribution of the generated glycoforms.
Additionally, it was interesting to prove that, under these experimental conditions, after 6 h the reaction is complete, resulting in a stable product with well-defined composition (see time 6 h
vs. 24 h). Parallel to LC-UV analysis, ESI-MS direct infusion analyses of the same samples were carried out, and showed that the relative abundances of the detected species were fully in agreement with the HILIC-UV results (
Table 2).
These results demonstrate that this HILIC-UV method represents an option easier and quicker than FIA-ESI-MS for accurate monitoring of the chemical coupling of glycans with the selected protein.
In an attempt to elucidate the origin of the asymmetric peak shape for the Ara(1→6)Man
neo-glycoproteins a sample from
t = 1 min was analysed, at this time the reaction mixture contained almost only RNase A and the species with one incorporated Ara(1→6)Man residue. This sample was purified and digested with chymotrypsin and the glycopeptides were analysed by the HPLC-MS
n method reported in
Section 3.7. Representative MS/MS and MS
3 spectra of two selected glycopeptides are reported in
Figure S4 (Supporting Information).
Table 2.
Ara(1→6)Man-RNase A glycoform distribution (percentage abundance), conjugation conversion (%C) and Ara(1→6)Man/protein ratio (mole/mole) as calculated by relative abundance in MS spectrum and peak areas in HILIC-UV chromatogram.
Table 2.
Ara(1→6)Man-RNase A glycoform distribution (percentage abundance), conjugation conversion (%C) and Ara(1→6)Man/protein ratio (mole/mole) as calculated by relative abundance in MS spectrum and peak areas in HILIC-UV chromatogram.
| Reaction Time | Analysis | N. Ara(1→6)Man Units (%) | %C | Ara(1→6)Man/Protein Ratio (mol/mol) |
|---|
| 0 | 1 | 2 | 3 | 4 | 5 | 6 | 7 |
|---|
| 0 min | MS | 100.0 | n.d. | n.d. | n.d. | n.d. | n.d. | n.d. | n.d. | 0.0 | 0.0 |
| HPLC-UV | 100.0 | n.d. | n.d. | n.d. | n.d. | n.d. | n.d. | n.d. | 0.0 | 0.0 |
| 1 min | MS | 50.5 | 37.5 | 12.0 | n.d. | n.d. | n.d. | n.d. | n.d. | 49.5 | 0.6 |
| HPLC-UV | 53.3 | 36.6 | 10.0 | n.d. | n.d. | n.d. | n.d. | n.d. | 46.7 | 0.6 |
| 30 min | MS | 21.2 | 38.0 | 27.3 | 13.6 | n.d. | n.d. | n.d. | n.d. | 78.8 | 1.3 |
| HPLC-UV | 18.8 | 37.8 | 30.5 | 12.8 | n.d. | n.d. | n.d. | n.d. | 81.2 | 1.4 |
| 1 h | MS | 12.7 | 29.8 | 28.6 | 19.6 | 9.3 | n.d. | n.d. | n.d. | 87.3 | 1.8 |
| HPLC-UV | 8.7 | 26.7 | 34.6 | 22.1 | 7.9 | n.d. | n.d. | n.d. | 91.3 | 1.9 |
| 1.5 h | MS | 5.8 | 18.3 | 26.3 | 25.6 | 16.3 | 7.7 | n.d. | n.d. | 94.2 | 2.5 |
| HPLC-UV | 3.9 | 17.0 | 28.2 | 28.6 | 16.9 | 5.4 | n.d. | n.d. | 96.1 | 2.5 |
| 2 h | MS | 4.2 | 13.7 | 24.2 | 27.2 | 20.4 | 10.3 | n.d. | n.d. | 95.8 | 2.8 |
| HPLC-UV | 2.6 | 12.1 | 26.4 | 29.7 | 22.1 | 7.1 | n.d. | n.d. | 97.4 | 2.8 |
| 3 h | MS | 3.7 | 8.4 | 18.6 | 24.8 | 22.5 | 14.0 | 7.9 | n.d. | 96.3 | 3.3 |
| HPLC-UV | 1.3 | 6.7 | 17.3 | 27.5 | 25.6 | 16.3 | 5.4 | n.d. | 98.7 | 3.4 |
| 6 h | MS | n.d. | 4.9 | 13.3 | 21.2 | 24.1 | 19.5 | 12.8 | 4.3 | 100.0 | 4.0 |
| HPLC-UV | n.d. | 2.6 | 10.6 | 22.2 | 27.9 | 22.8 | 10.5 | 3.4 | 100.0 | 4.0 |
| 24 h | MS | n.d. | 5.2 | 14.0 | 21.7 | 23.6 | 19.0 | 12.6 | 3.9 | 100.0 | 3.9 |
| HPLC-UV | n.d. | 3.6 | 12.7 | 22.7 | 27.9 | 20.6 | 8.9 | 3.5 | 100.0 | 3.9 |
Table 3.
List of glycopeptides identified by LC-ESI-MSn from the chymotryptic digestion of sample t = 1 min in the monitoring of the synthesis of Ara(1→6)Man-RNase A.
Table 3.
List of glycopeptides identified by LC-ESI-MSn from the chymotryptic digestion of sample t = 1 min in the monitoring of the synthesis of Ara(1→6)Man-RNase A.
| tR (min) | m/z | Charge State | Theor. Mass (Da) | Exper. Mass (Da) | Position | Glycosylation Site | Area % |
|---|
| 5.96 | 558.64 | 2 | 1115.26 | 1115.28 | M30-L35 | K31 | 6.78 |
| 6.10 | 617.17 | 2 | 1232.34 | 1232.34 | K1-F8 | K1 or K7 | 50.03 |
| 1233.71 | 1 | 1232.71 |
| 6.44 | 493.08 | 2 | 984.06 | 984.16 | K31-L35 | K31 | 7.09 |
| 6.89 | 788.08 | 3 | 2362.50 | 2361.24 | S80-Y97 | K91 | 26.23 |
| 1181.75 | 2 | 2361.50 |
| 8.35 | 675.82 | 3 | 2025.18 | 2024.46 | S59-Y73 | K61 or K66 | 9.88 |
| 1012.63 | 2 | 2023.26 |
The obtained data revealed the presence in the sample of at least four glycoforms with different conjugation sites, namely Lys 1 or 7 (50.0%), Lys 31 (13.9%), Lys 61 or 66 (9.9%) and Lys 91 (26.2%) (
Table 3). This experimental evidence supports the hypothesis that the non-Gaussian peak shape is related to the co-elution of different
neo-glycoprotein isomers.


 ,
, 

