Methods of Increasing the Performance of Radionuclide Generators Used in Nuclear Medicine: Daughter Nuclide Build-Up Optimisation, Elution-Purification-Concentration Integration, and Effective Control of Radionuclidic Purity

Abstract
:
1. Introduction
2. Theoretical Approach and Method Development
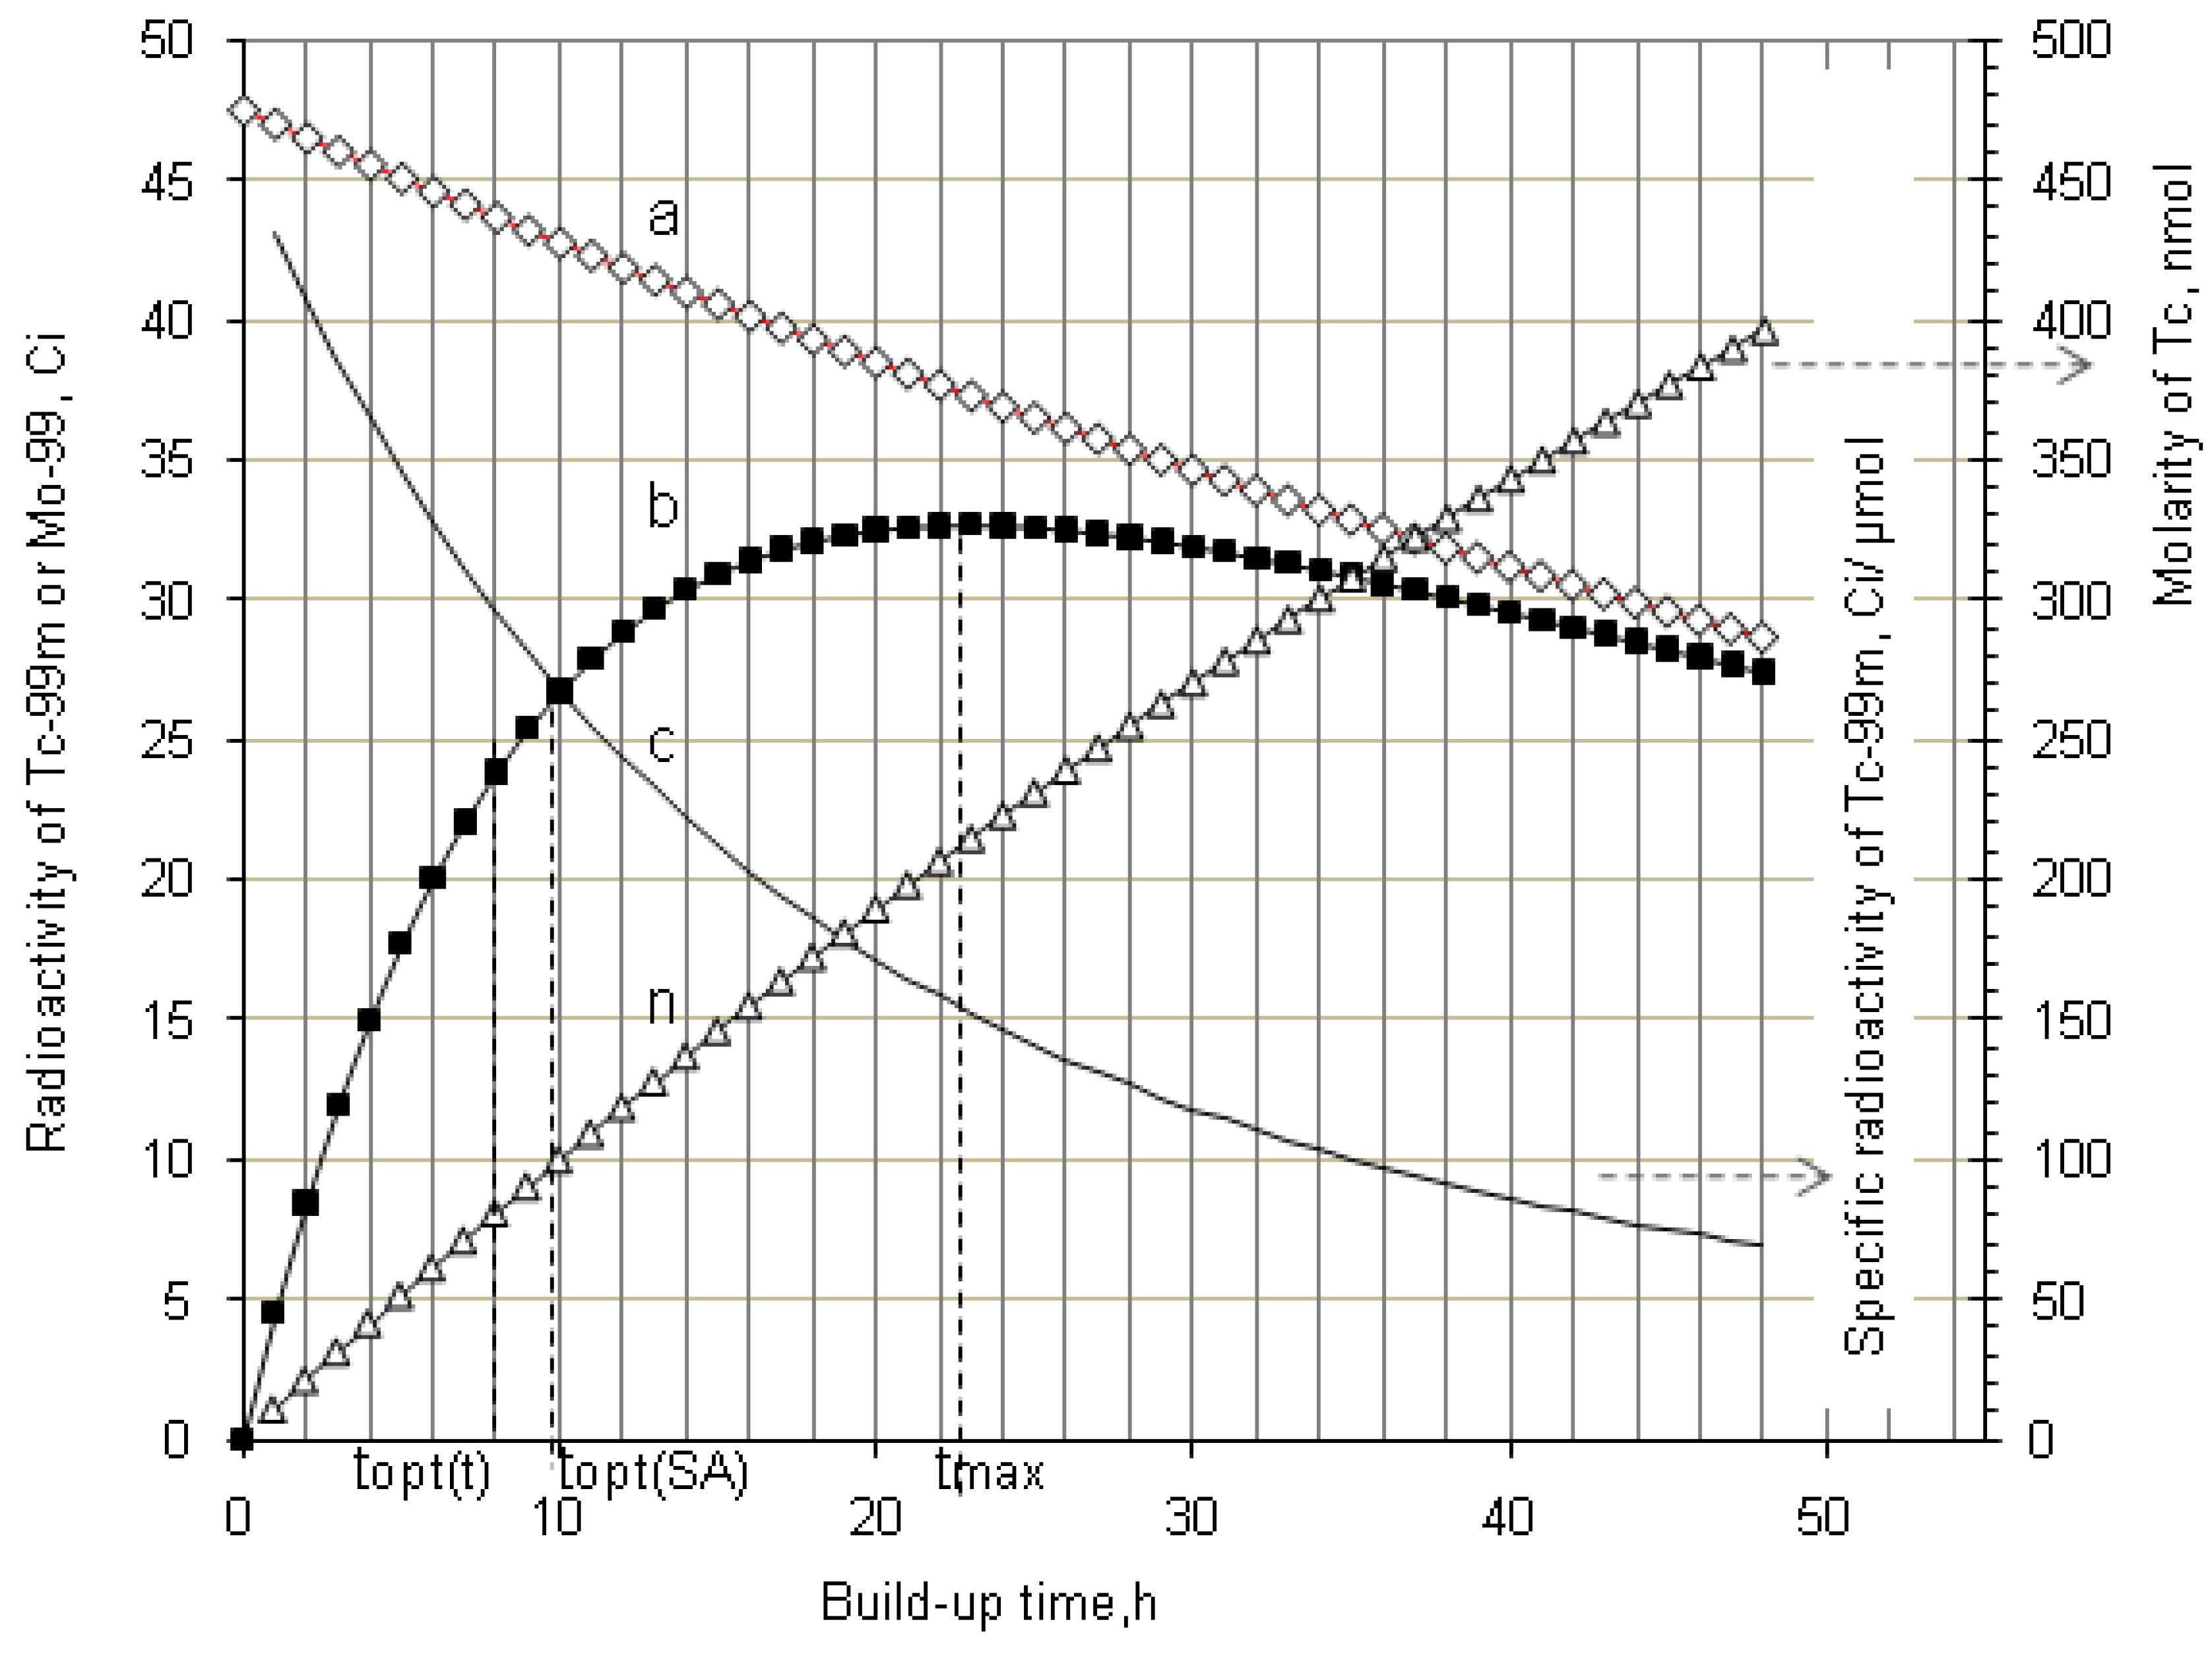
2.1. Daughter Nuclide Build-Up Optimisation for Improvement of Production Yield and Specific Radioactivity
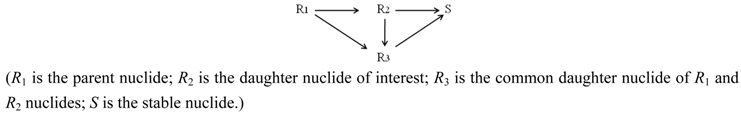

- If R2 ≠ R3 ≠ S (R2, R3 and S are the nuclides of different chemical elements) then R2 and R3 are radionuclides available in a carrier-free state and their elemental specific radioactivity (SA) is invariable for all the time. In this case, the SA value can be evaluated without acknowledgement of the atom numbers of given nuclide using the following equation [11].SACarrier-free = 6.022 × 10²³ × λRi (Bq/Mol)
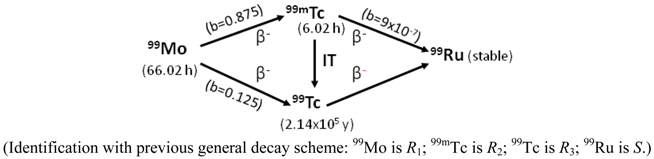
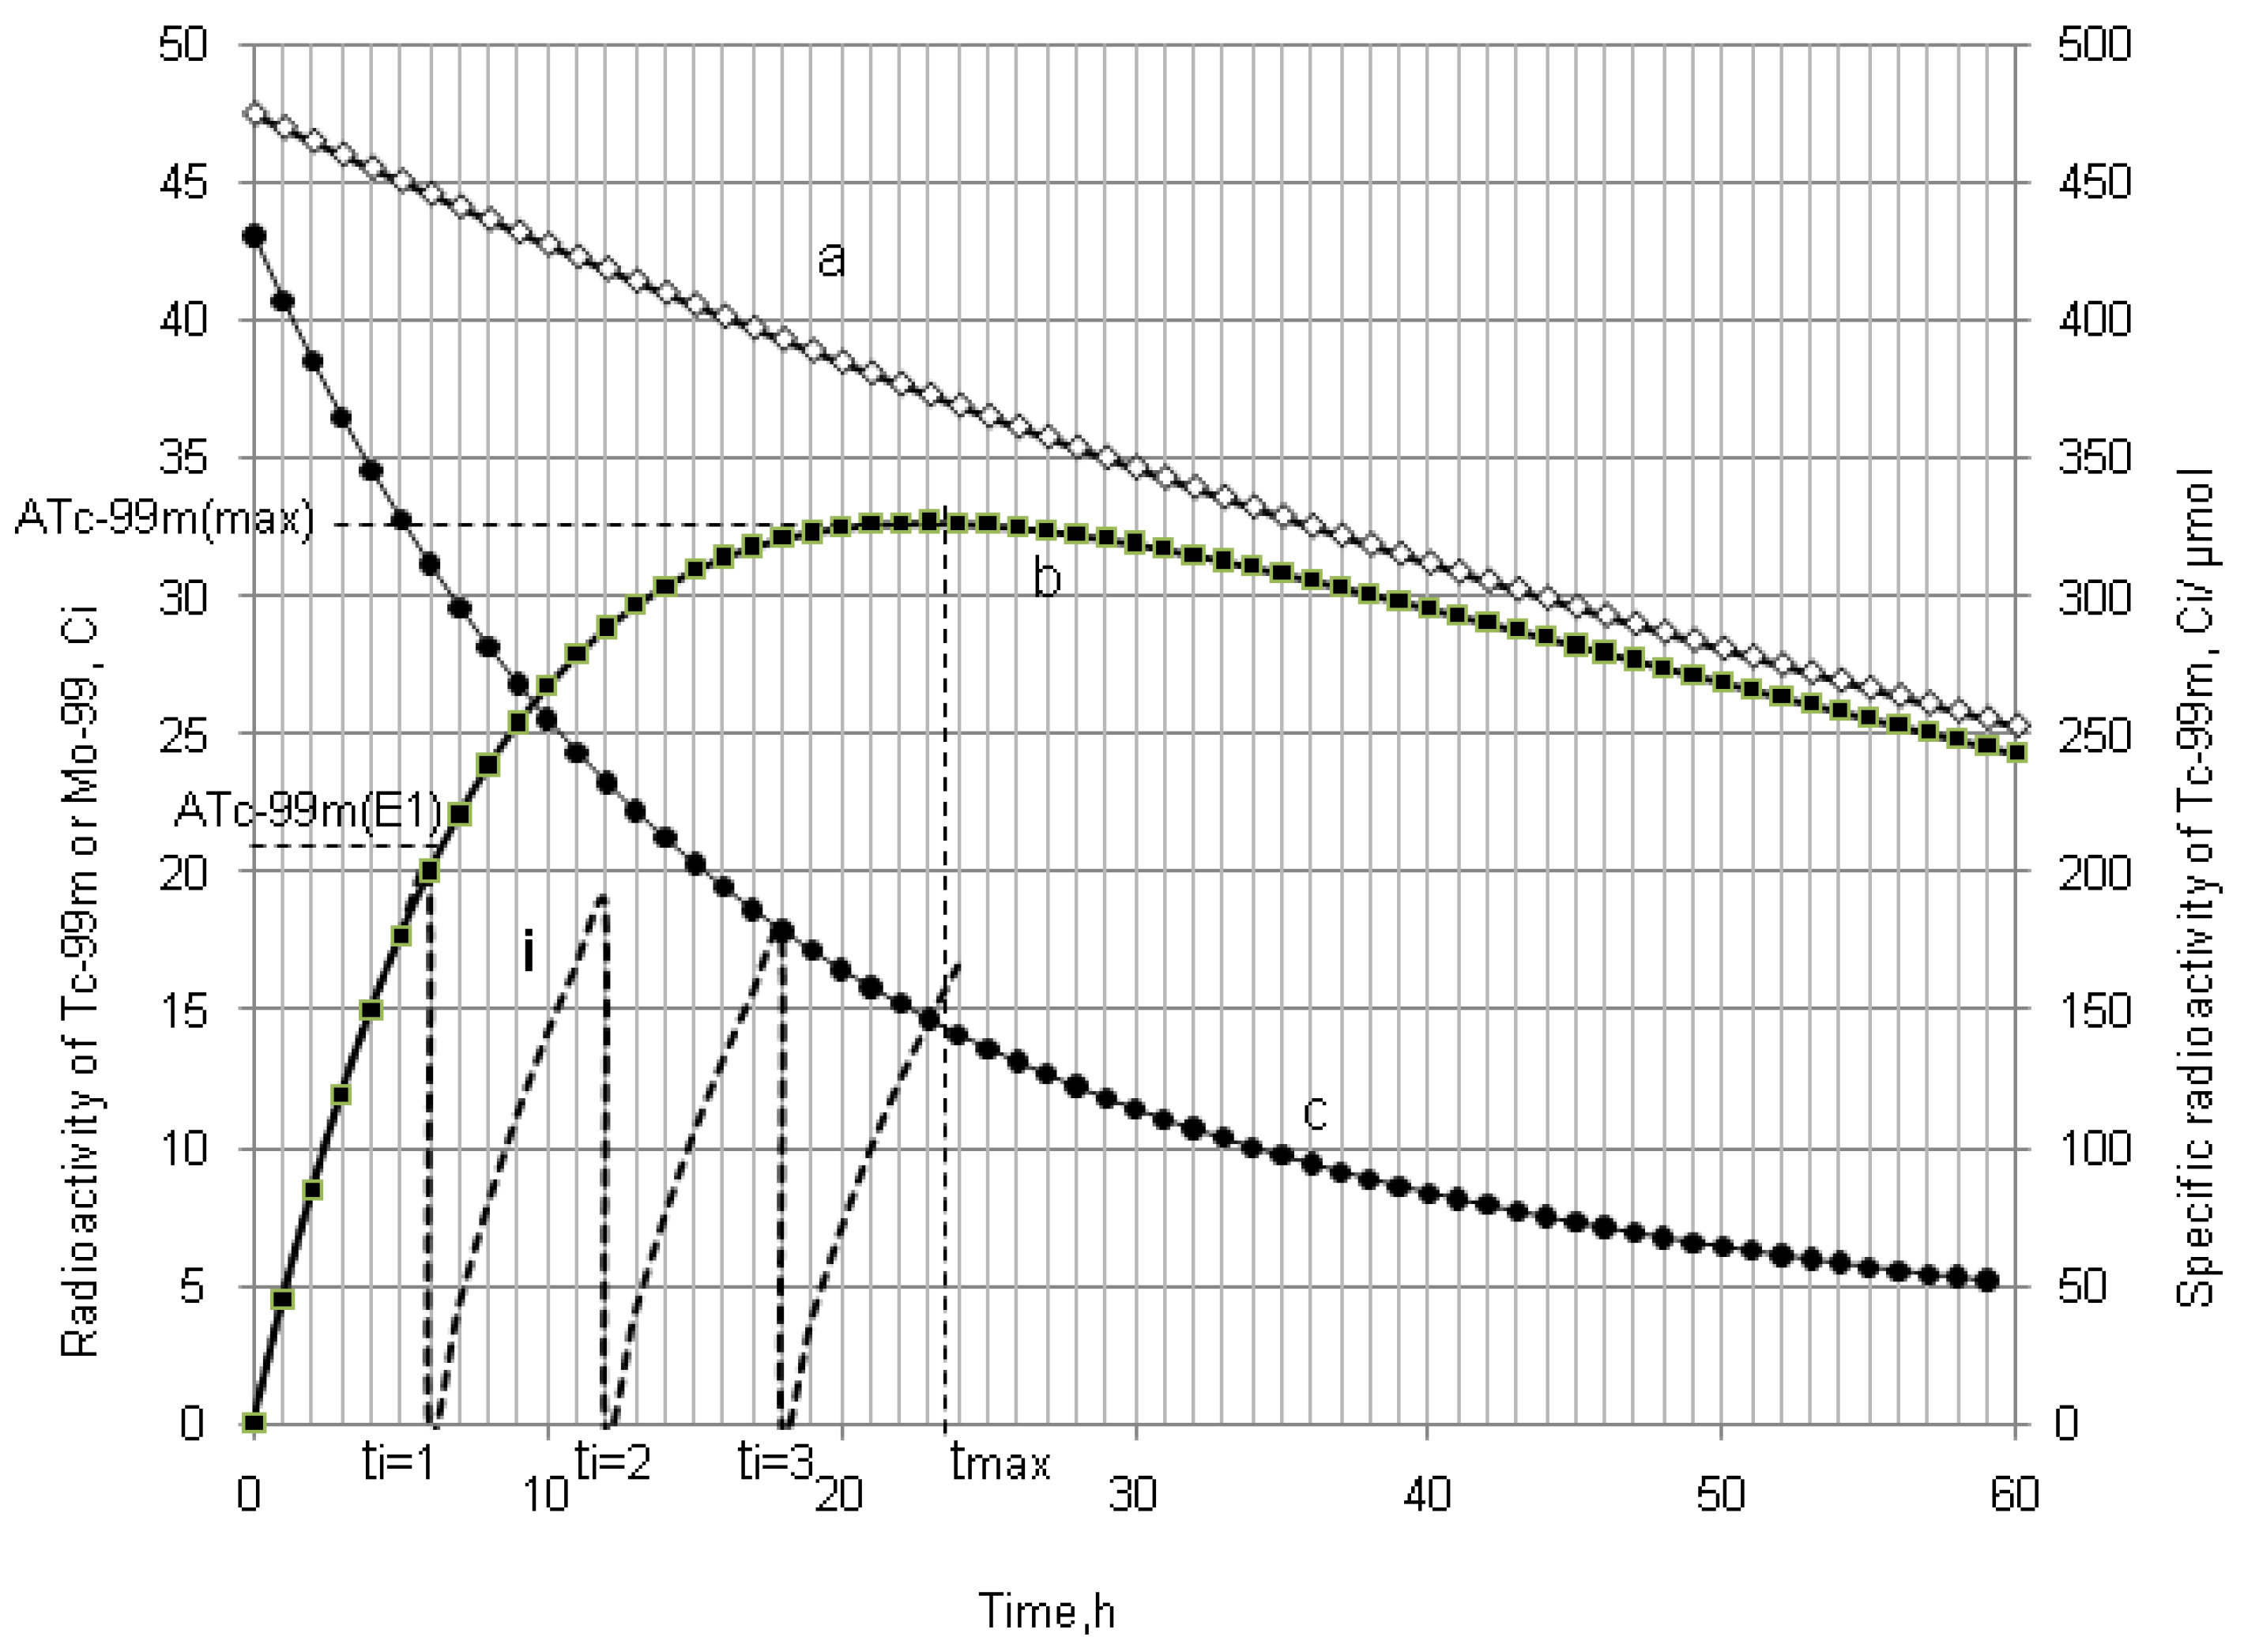
- In the case of R2 ≡ R3 ≠ S (R2 and R3 are the radionuclides of the same chemical element; S is a stable nuclide of another element), both the R2 and R3 radionuclides are available in a carrier-included state and their elemental specific radioactivity is variable with the build-up time (99Mo/99mTc system shown below as an example). With an assumption of ignoring the insignificant amount of stable nuclide S formed in the system, the atom numbers (N) of all daughter radionuclides R2 and R3 generated from the parent nuclide R1 isThis N value will be used for the calculation of elemental specific radioactivity in the following process of optimisation assessment.N = NR2 + NR3 = N1,0 − N1 = N1,0 × (1 − e−λ1·t)
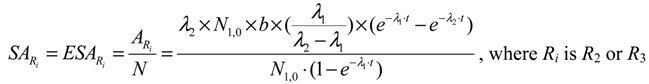
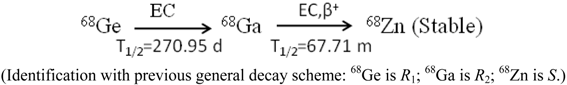
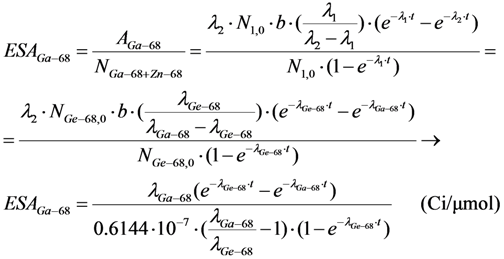
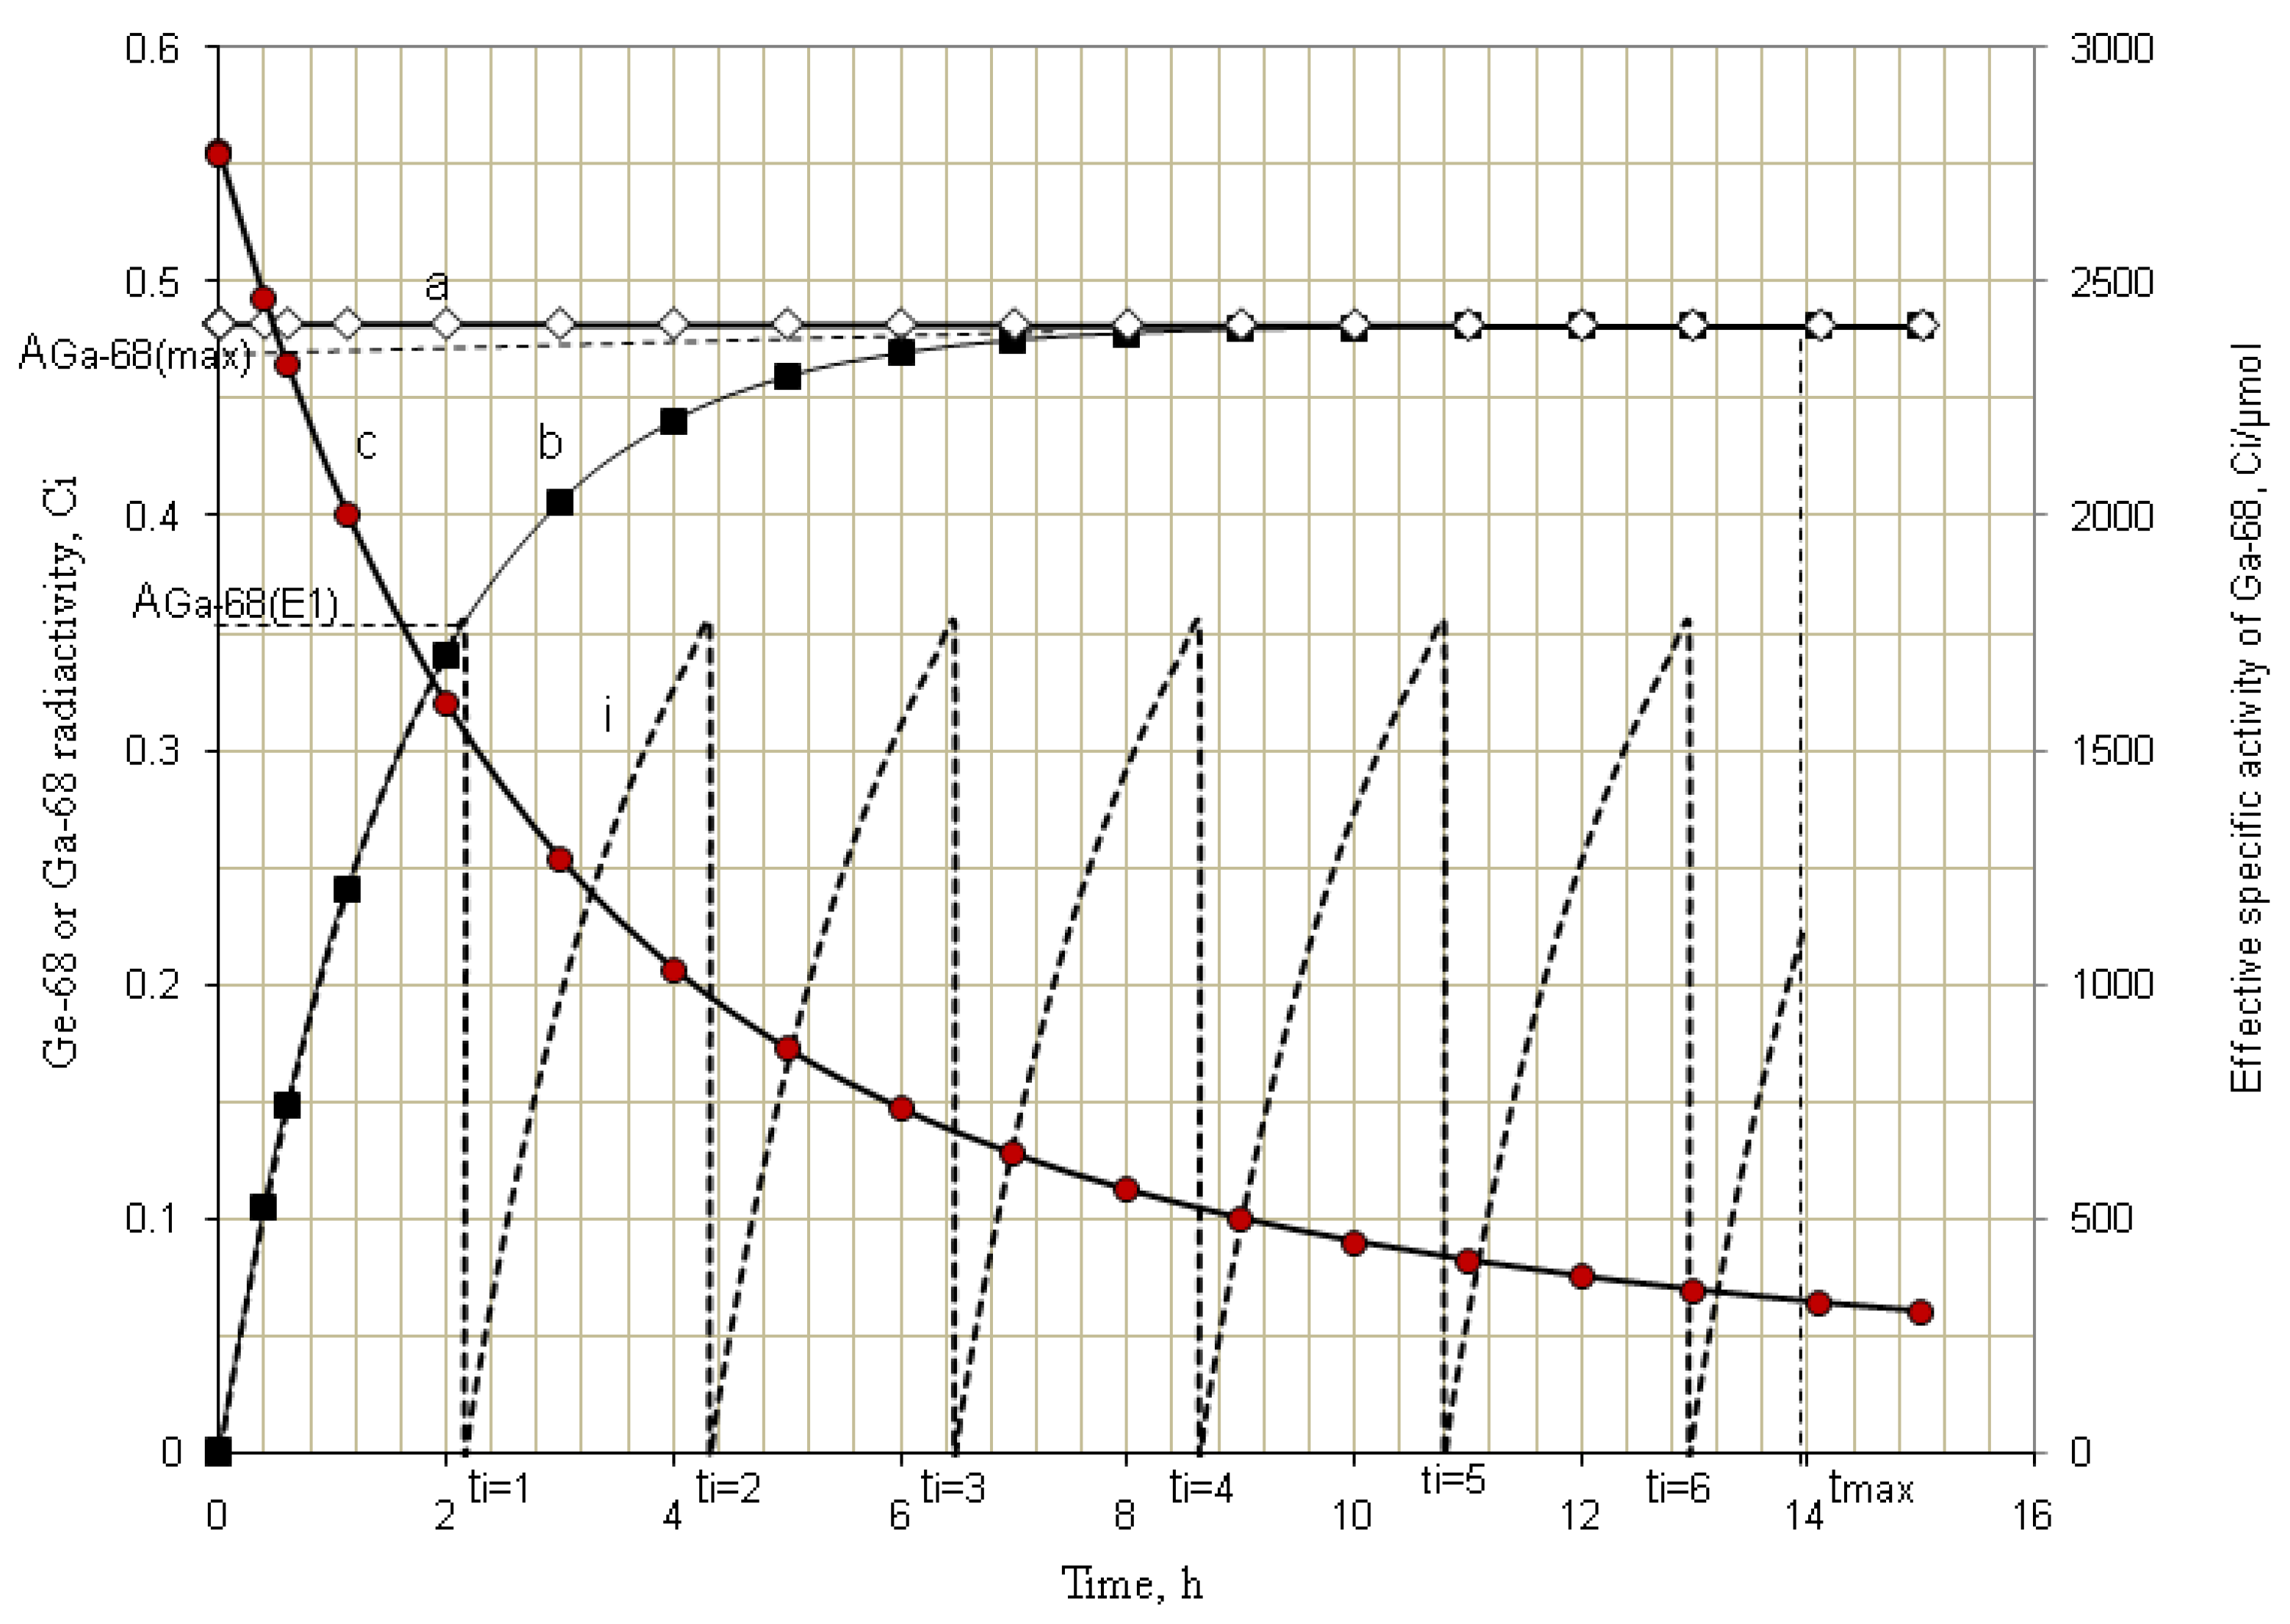
- In the case of R2 ≈ R3 ≈ S (R2, R3 and S are the isotopes of different chemical elements which have a similar chemical property of interest for a specific application such as the coordinative radiolabelling of radiopharmaceuticals, the R2 and R3 radionuclides are available in a non-elemental carrier-included state and the specific radioactivity of radionuclide R2, named as “Effective Specific Radioactivity” (ESA), is variable with the build-up time (68Ge/68Ga system shown below as an example). The effective specific radioactivity is conveniently defined as the radioactivity of a specified radioactive daughter nuclide (R2 or R3) per the total atom numbers of three nuclides R2, R3, and S. The atom numbers (N) of all related daughter nuclides which are generated from the parent nuclide R1 isThis N value will also be used for the calculation of ESA values in the following process of optimisation assessment.N = NR2 + NR3 + NS = N1,0 − N1 = N1,0 × (1 − e−λ1·t)


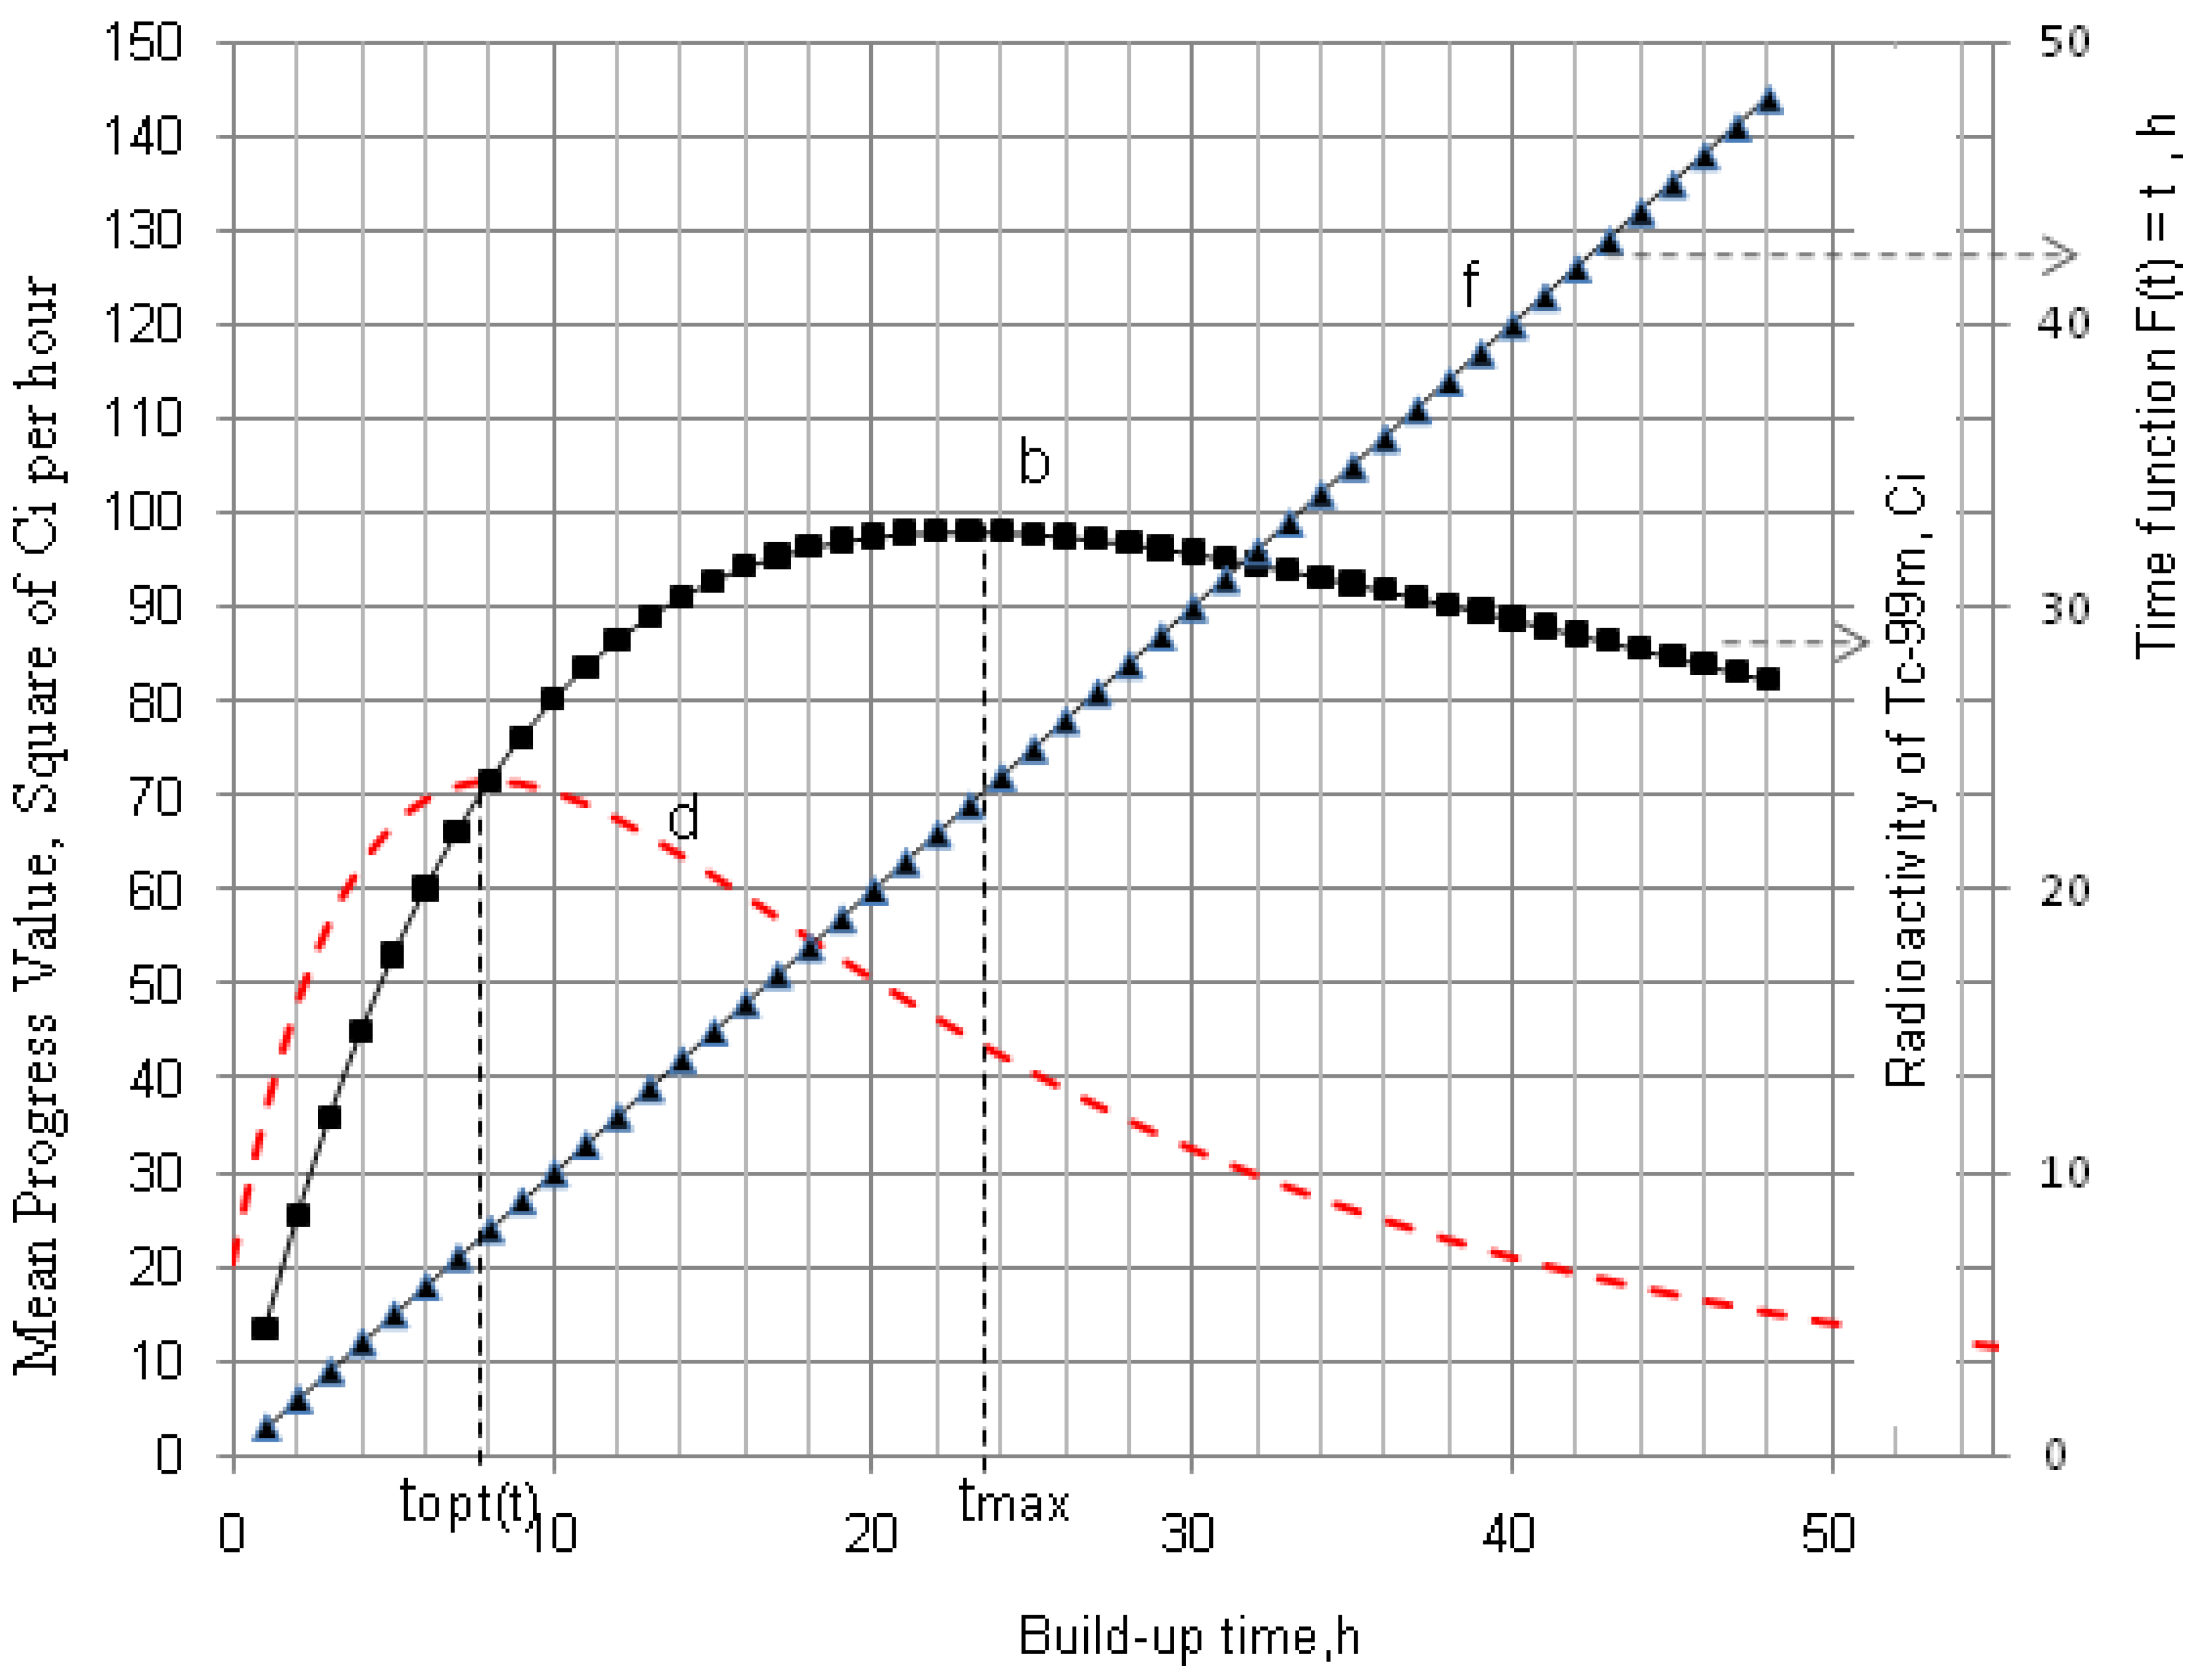
2.1.1. Mean Progress Function for Optimisation of the Daughter Nuclide Build-up versus Buildup Time (or Standby Time)


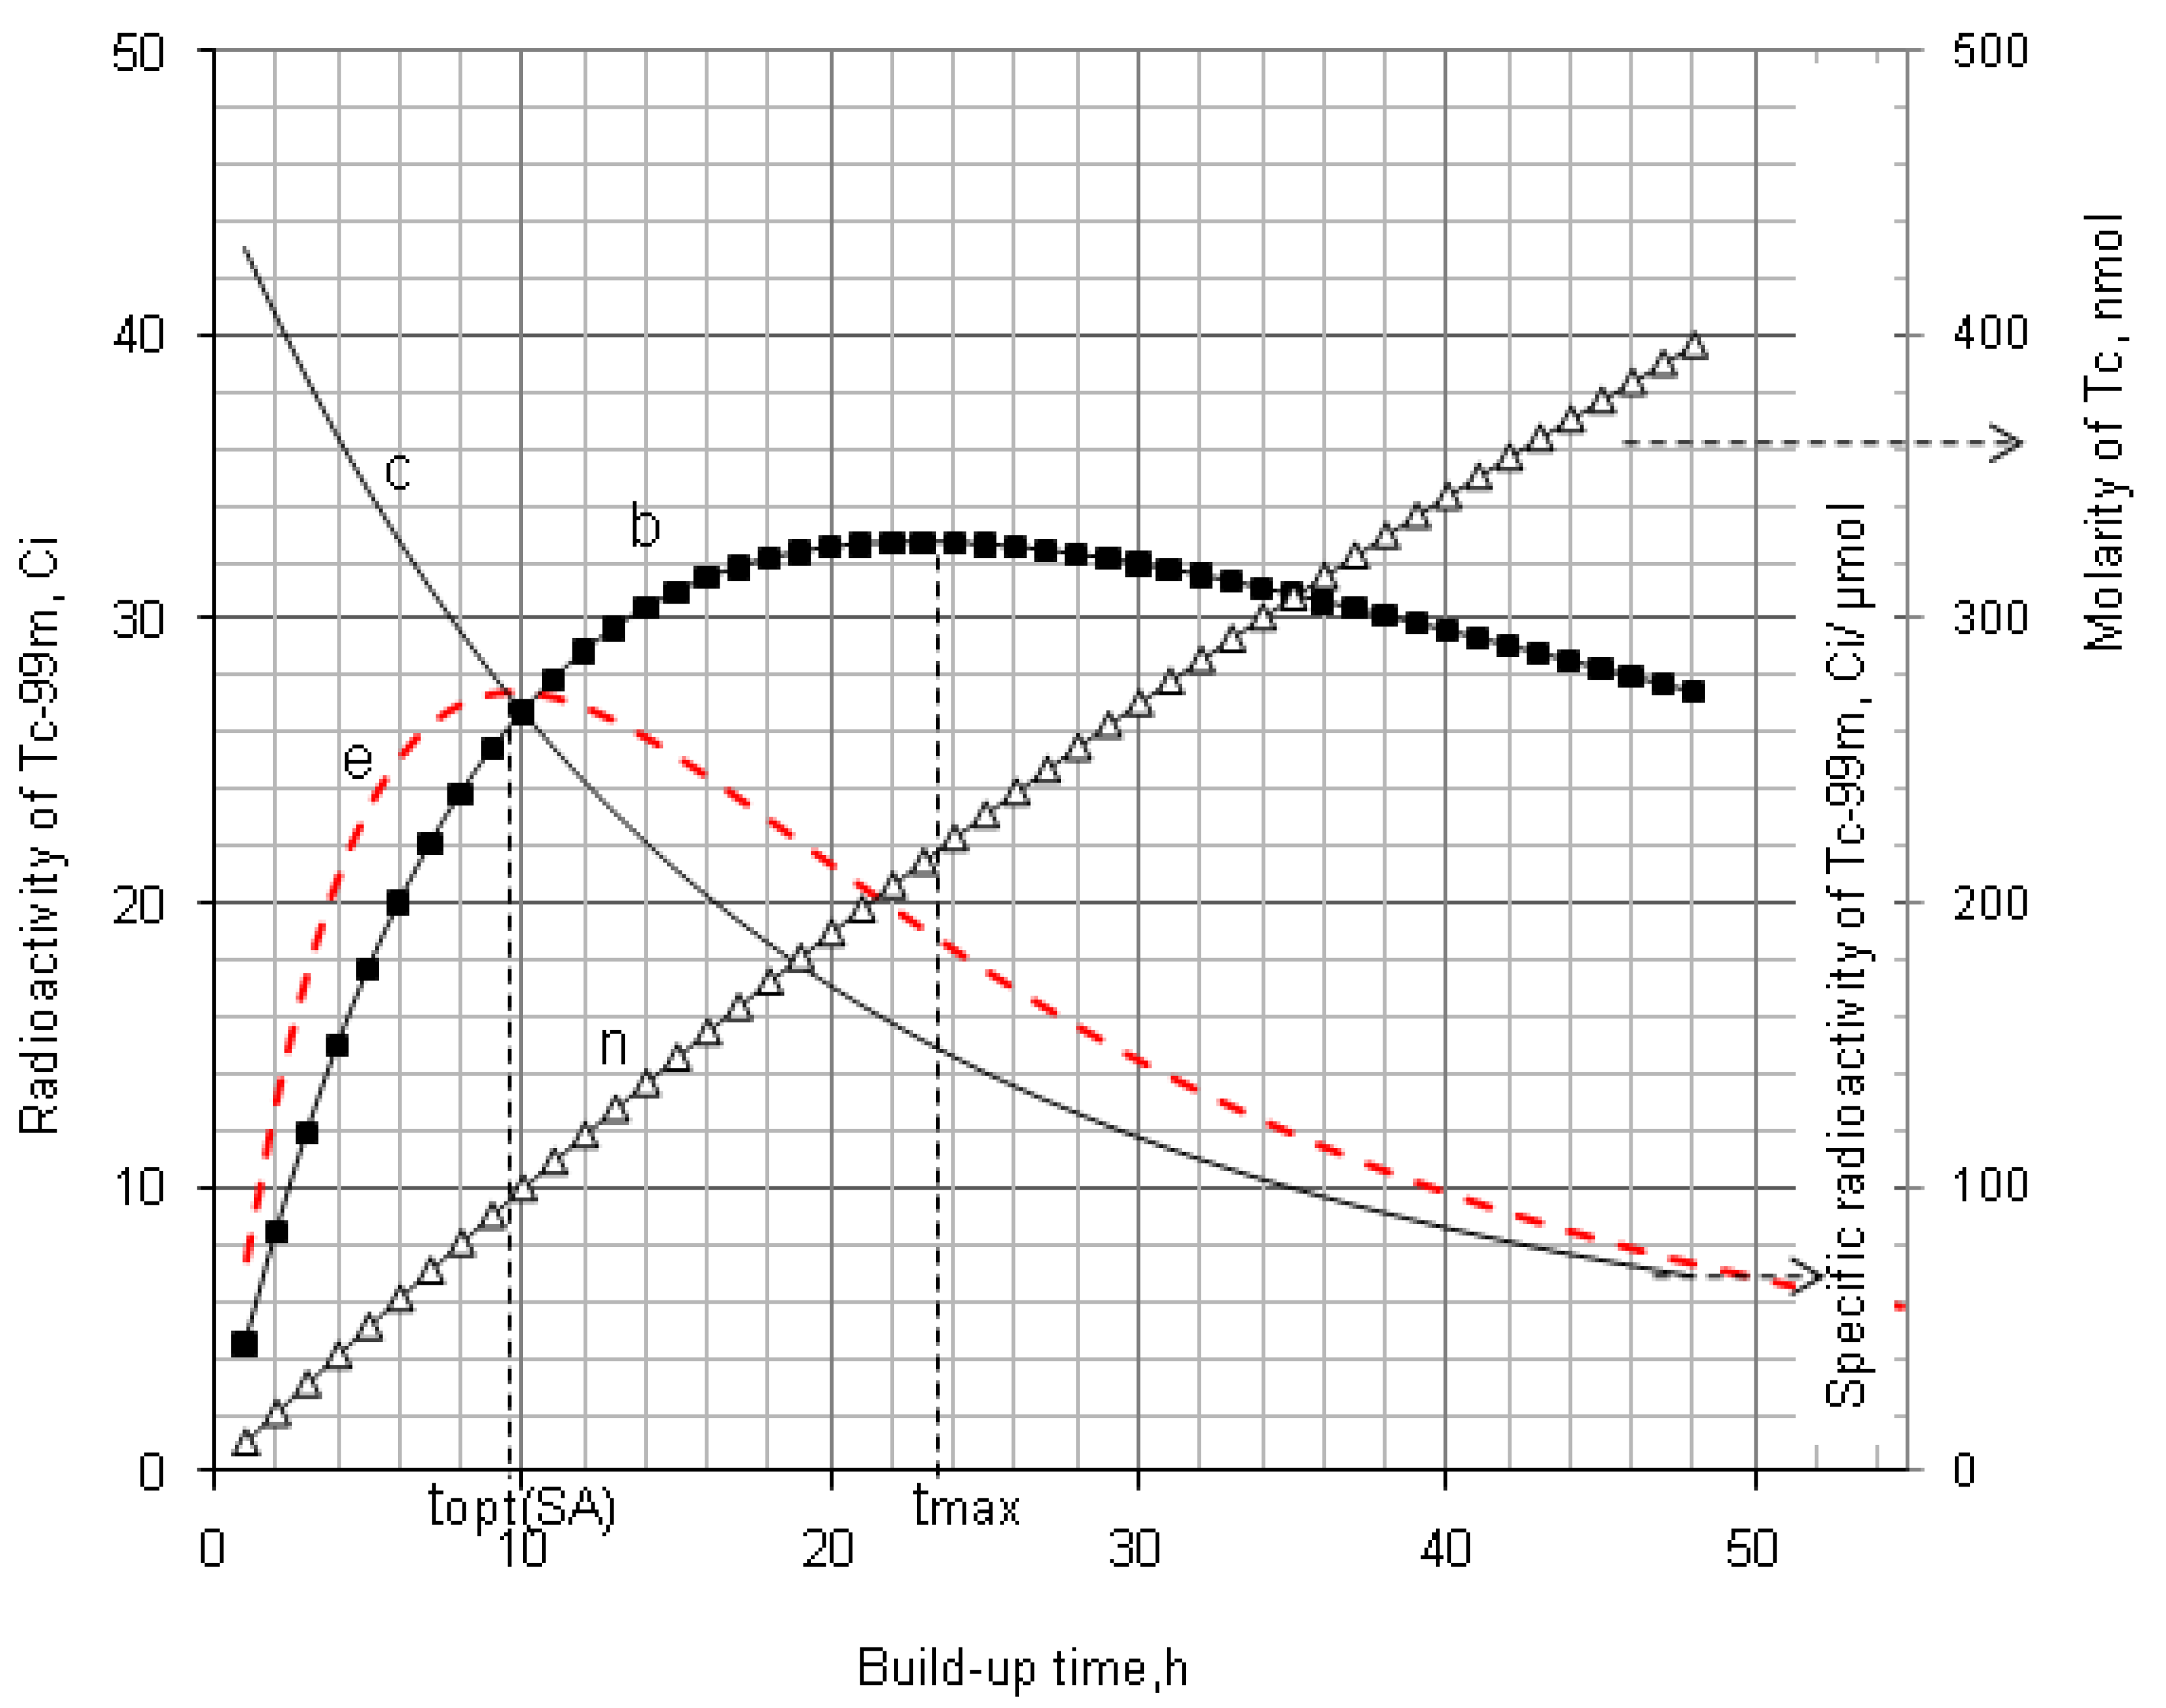
2.1.2. Mean Progress Function for Optimisation of the Daughter Nuclide Build-up versus Specific Activity


2.1.3. Method of Early Elution Schedule for Increasing the Daughter Nuclide Production Yield and Effective Utilisation of Parent Nuclide


2.2. Method of Radioisotope Concentrator Design for Use in the Optimisation of Generator Elution to Increase the Performance of Radionuclide Generators: Concentrating 99mTc Solution Eluted from 99Mo/99mTc Generator as a Case


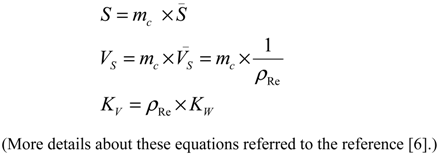

- S is the surface area of the sorbent (m2);
- Vs is the volume of the dry resin (mL);
- mc is the weight of the dry resin/sorbent loaded in the column (g);
- S is the specific surface area of the sorbent (m2/g);
- Vs is the specific volume of the resin (mL/g);
- ρRe is the weight density of the resin (g/mL).


2.3. Effective Control of Radionuclidic Purity: Relationship between Detection Limit, Required Radionuclidic Impurity Limit and Measurement Certainty for the Optimisation of Decay Time and Sample Activity Used for Post-Delivery Quality Control
2.3.1. Impure Radionuclide Detection Limit Is Invariable with QC Sample Activity which Has Influence on the Gamma-Ray Spectrometric Measurement of Impure Radionuclide Activity due to 511 keV Photo-Peak Overlap, 68Ge in 68Ga and 44Ti in 44Sc Product as the Cases


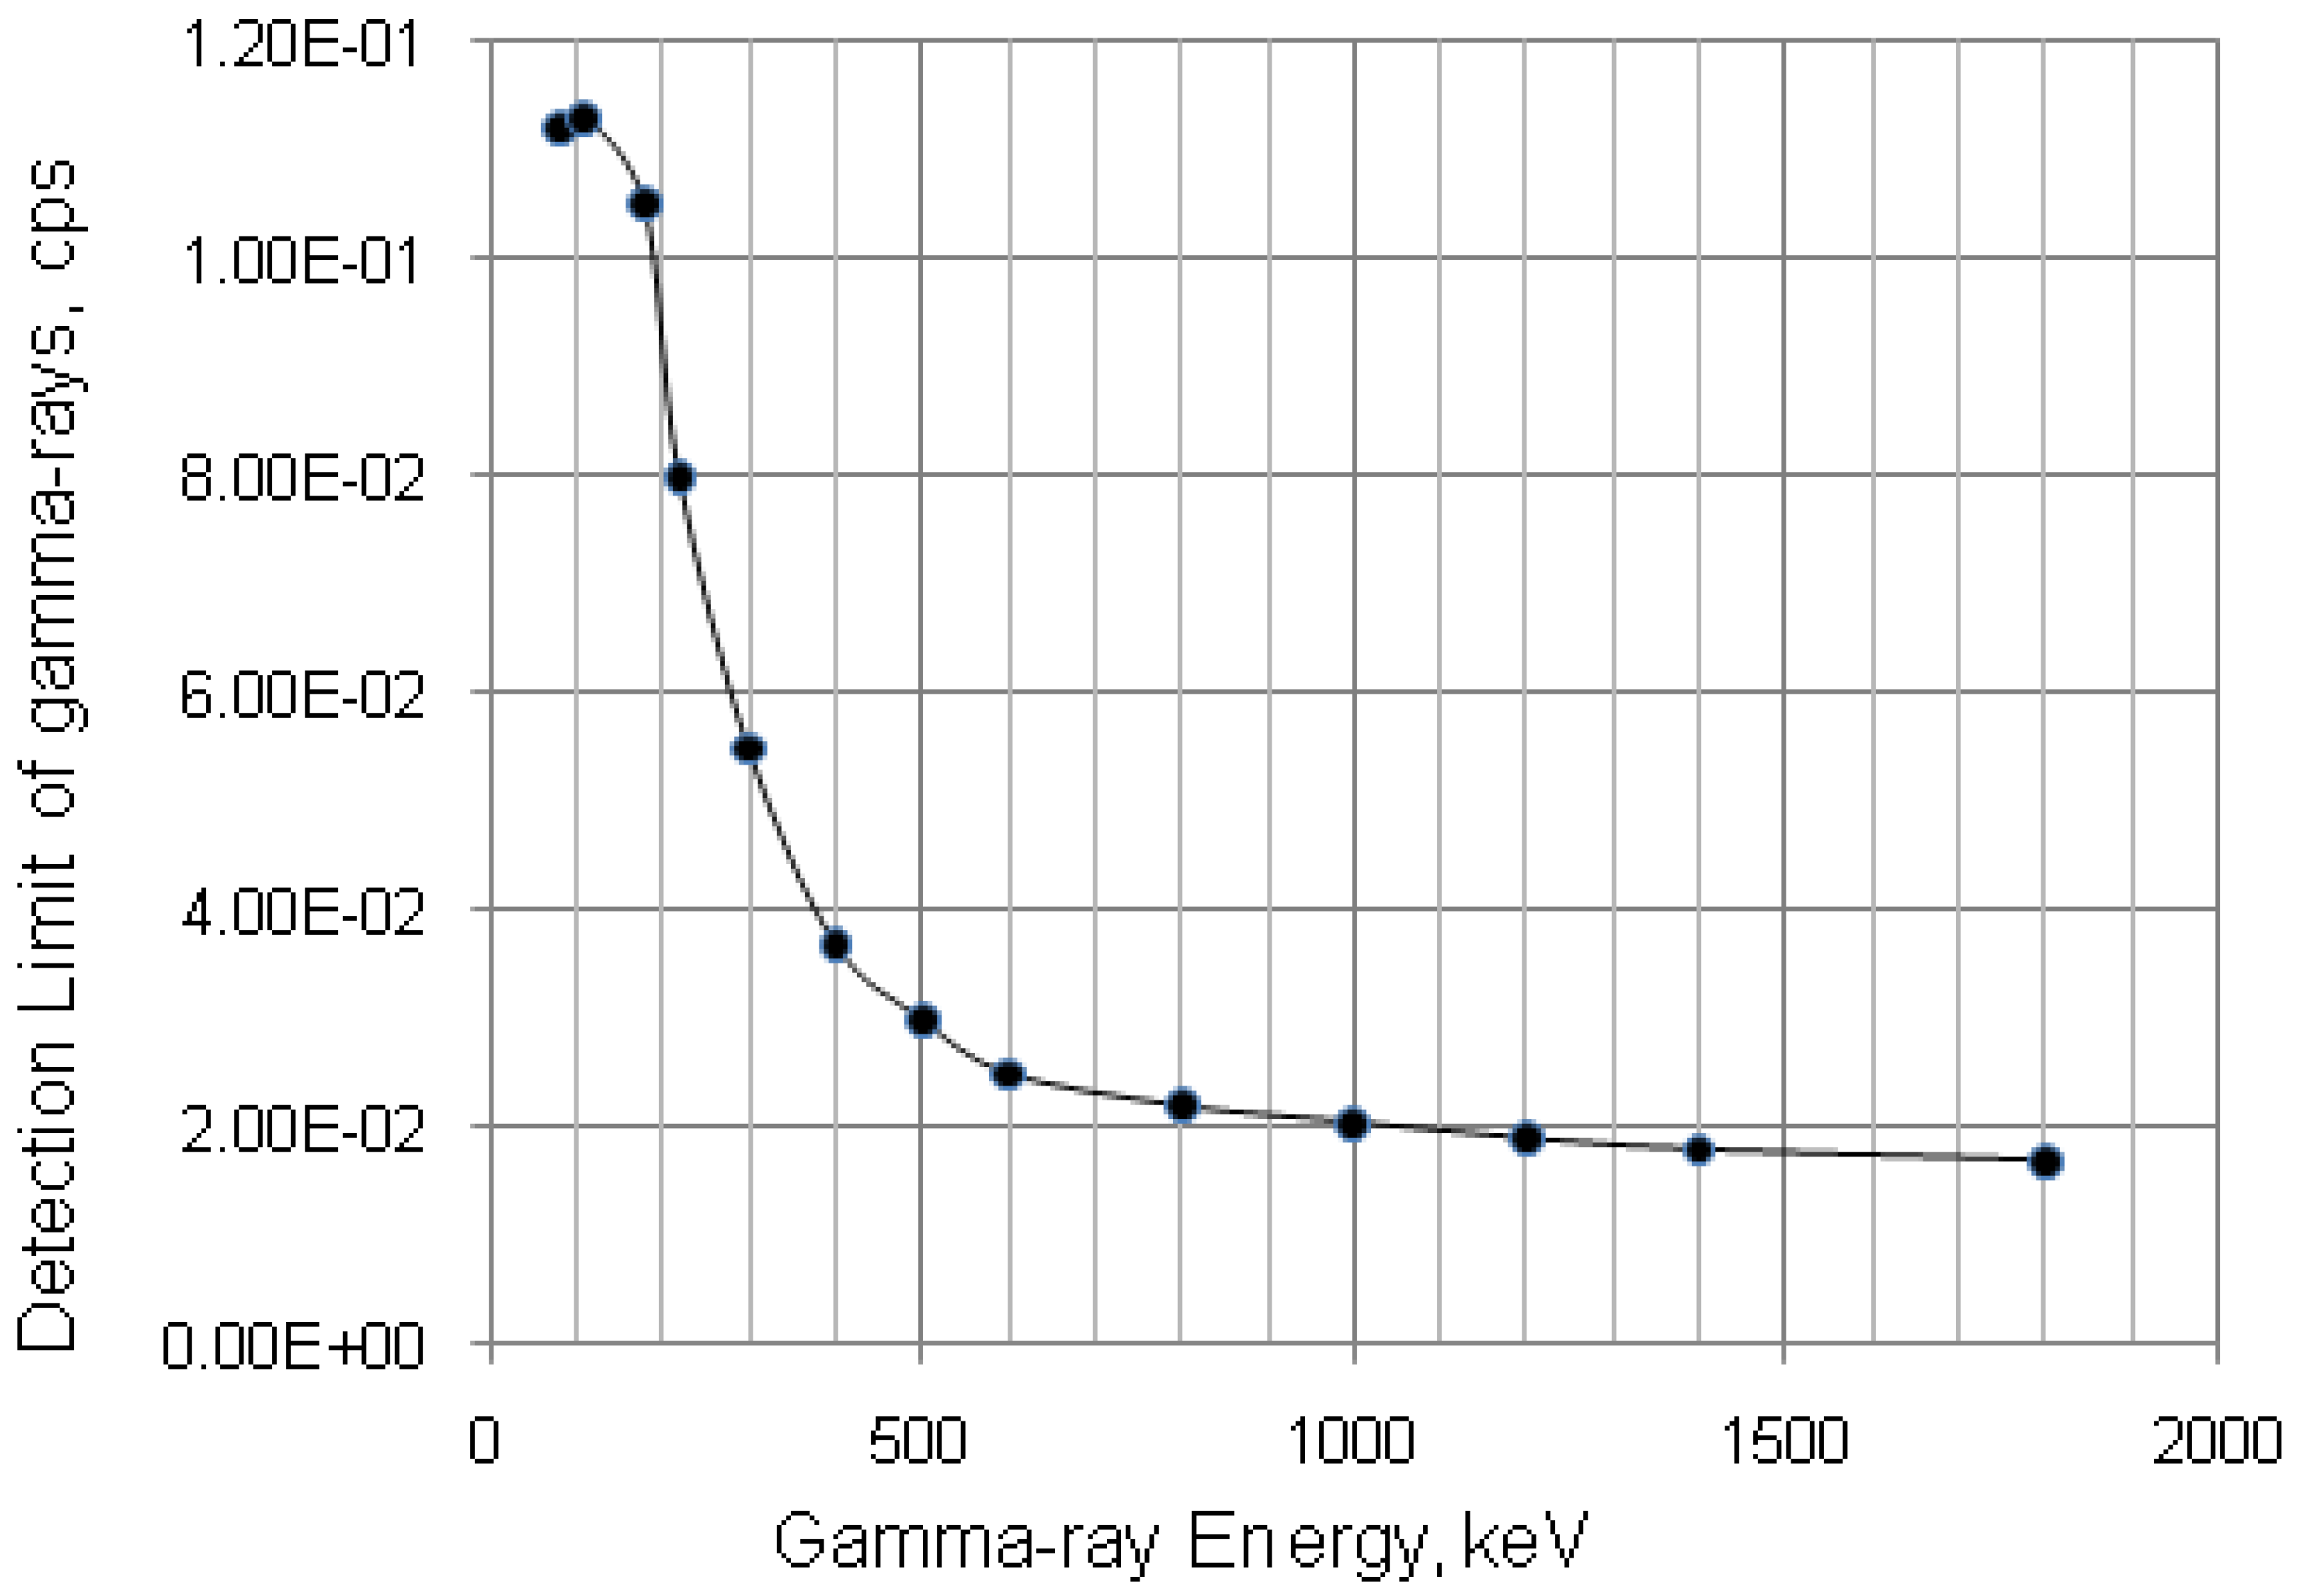
2.3.2. Impure Radionuclide Detection Limit Is Variable with the Activity of QC Sample which Has Radionuclides of Well-Separated Gamma-Ray Photo-Peaks, the Measurement of Different Impure Radionuclides in 99mTc Product as a Case
 , the above equation is rewritten as:


2.3.3. Impure Radionuclide Detection Limit Is Variable with the Radioactivity of QC Sample which Has Influence on the Gamma-Ray Spectrometric Measurement of the Impure Radionuclide Activity due to the Overlap of Major Photo-Peaks Emitted from both the Impure and Product Radionuclides, the Measurement of 88Zr/88Y Impurities in 89Zr Product as a Case


3. Experimental
3.1. Materials and Radioactivity Measurement
3.2. Radioisotope Generator Integrated Systems for Study on the Optimisation Assessment of the Daughter Nuclide Build-up and Production Yield


3.3. Determination of Gamma-Ray Spectrometric Detection Limit (LD) for the Certainty Assessment of Effective Radionuclidic Purity Test
| Critical limit, | LC (counts) = 1.645 × [B (1 + n/2m)]1/2 |
| LC (cps) = (LC/t); LC (Ci) = [C × LC (cps)] | |
| Upper limit, | LU (counts) = A + 1.645 × [A + B (1 + n/2m)]1/2 |
| LU (cps) = (LU/t); LU (Ci) = [C × LU (cps)] | |
| Detection limit, | LD (counts) = 2.71 + 3.29 × [B (1 + n/2m)]1/2 |
| LD (cps) = (LD/t); LD (Ci) = [C × LD (cps)] |
- -
- Channel numbers of the peak region: n
- -
- Gross counts in the peak region of n channels: G
- -
- Channel number on the right side of peak region: m
- -
- Counts belongs to m channels: s1
- -
- Channel number on the left side of peak region: m
- -
- Counts belongs to m channels: s2
4. Results and Discussion
4.1. Optimisation for Improvement of Production Yield and Specific Radioactivity
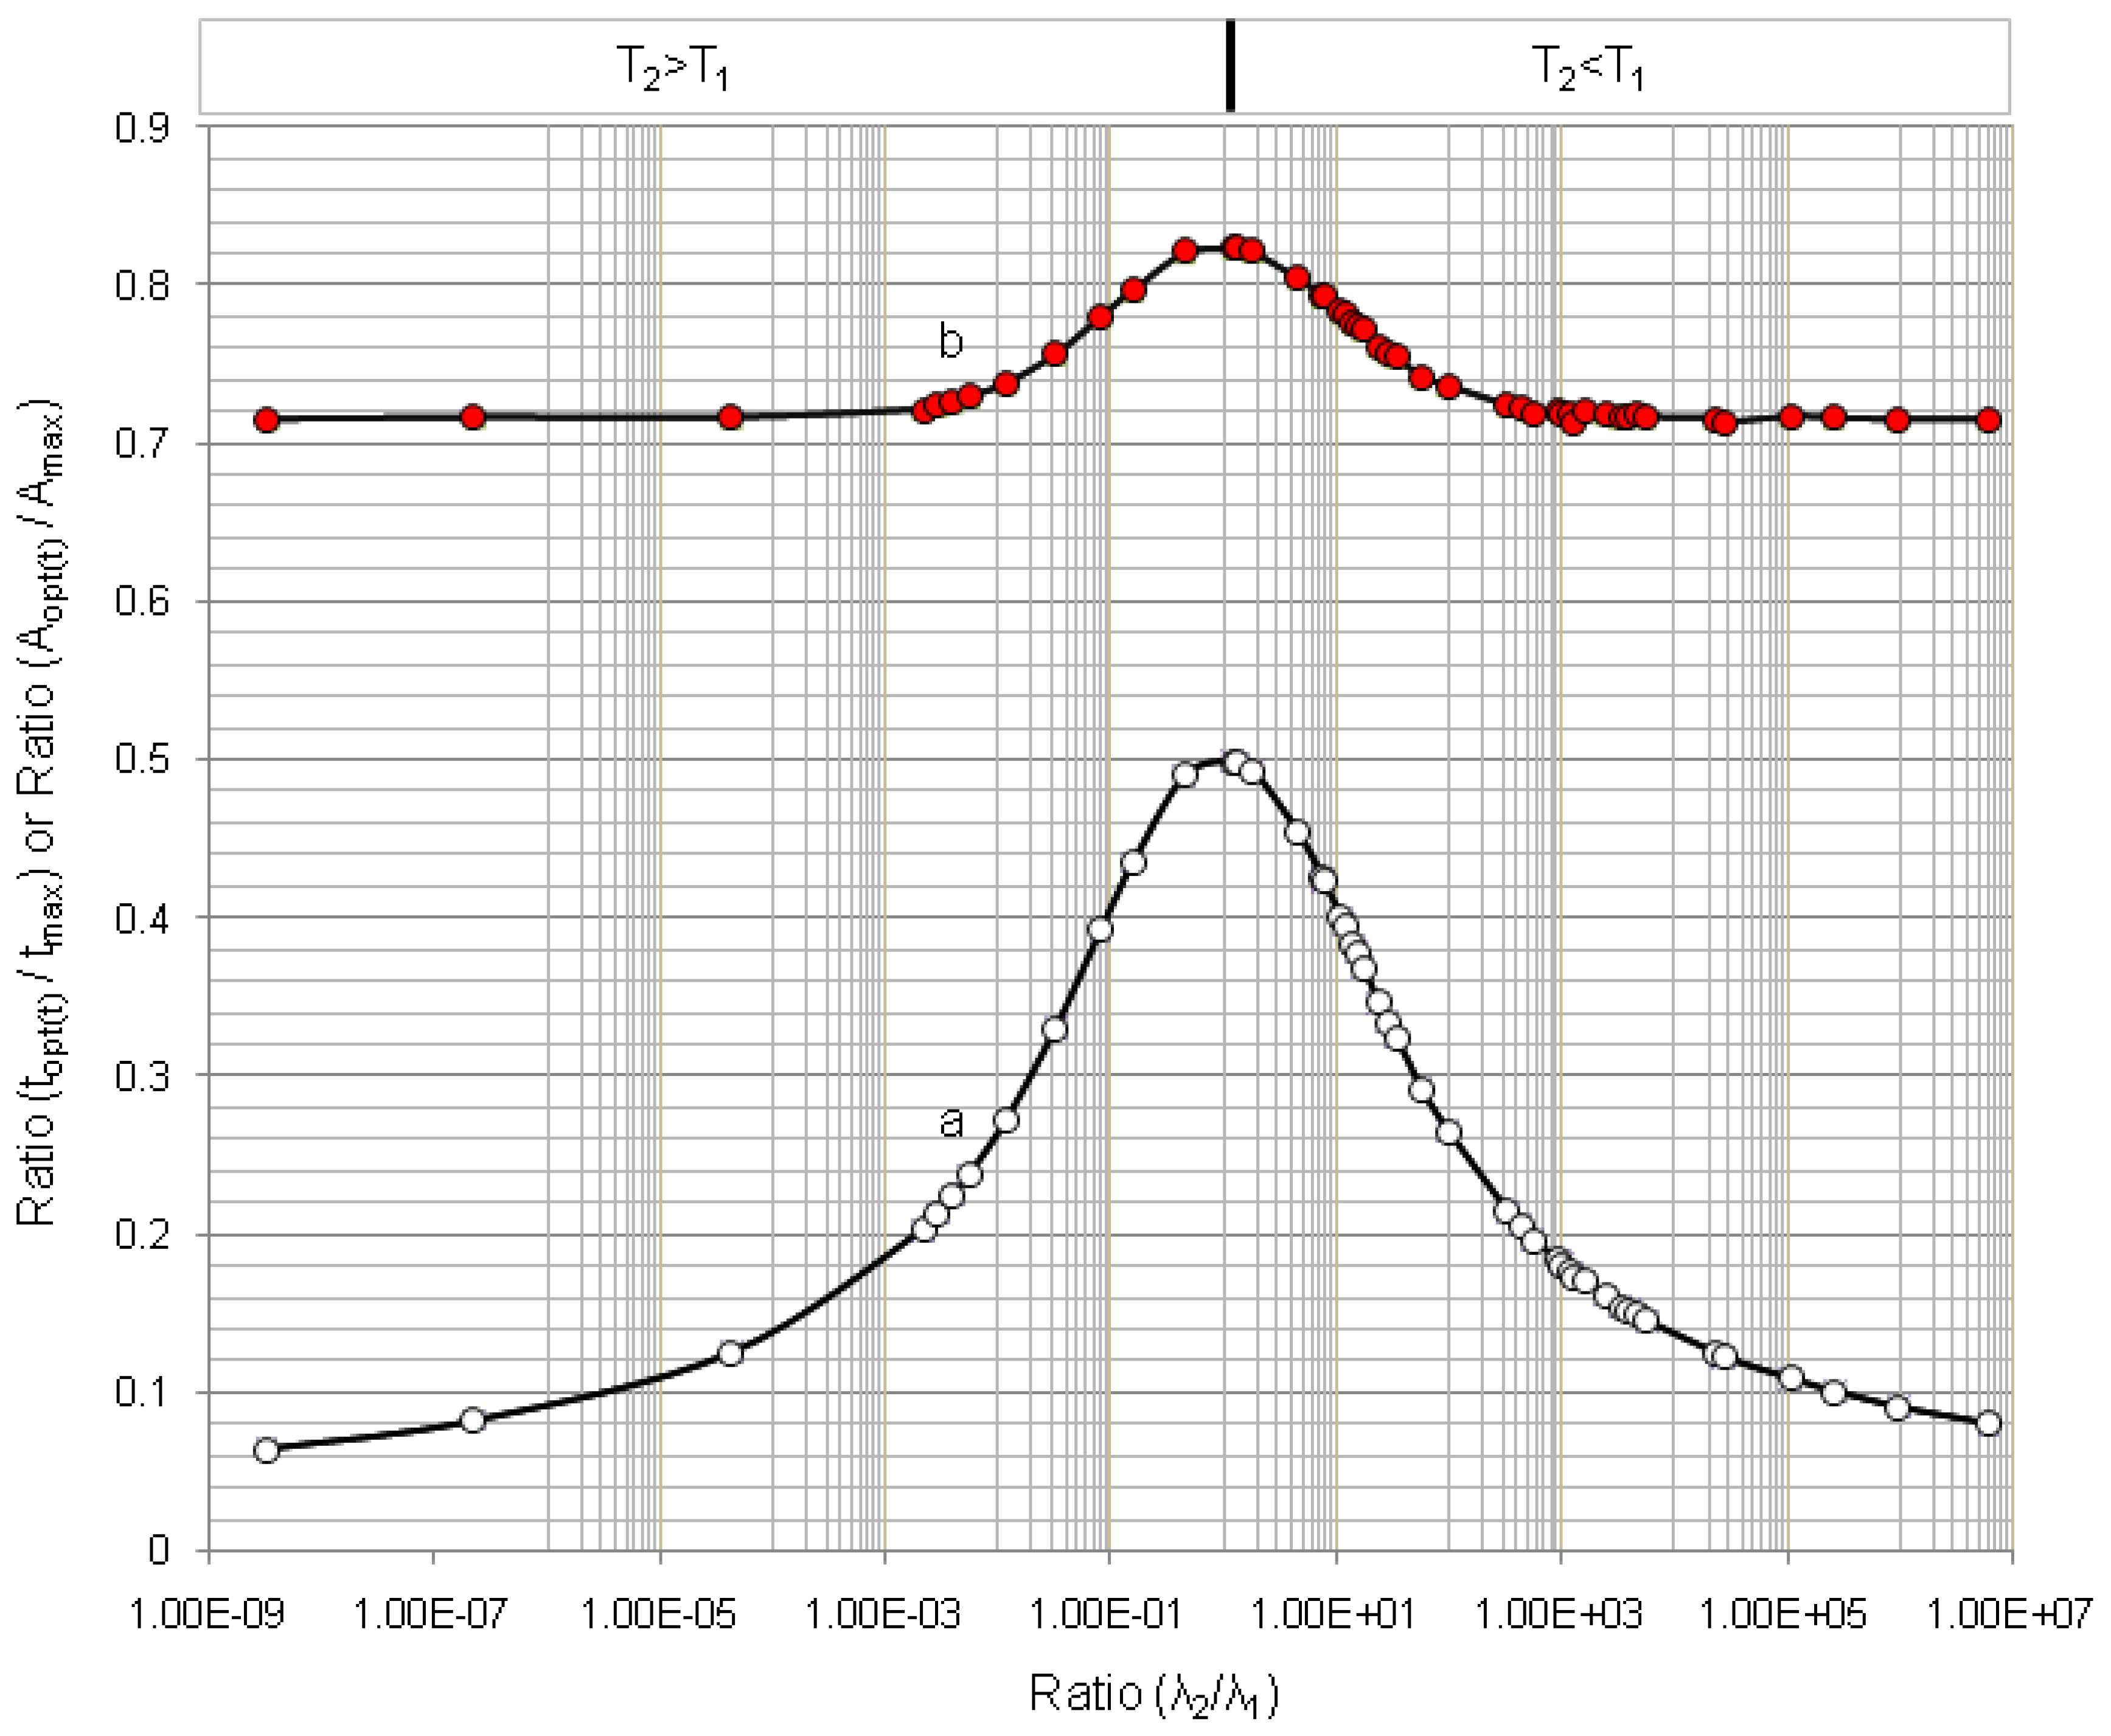
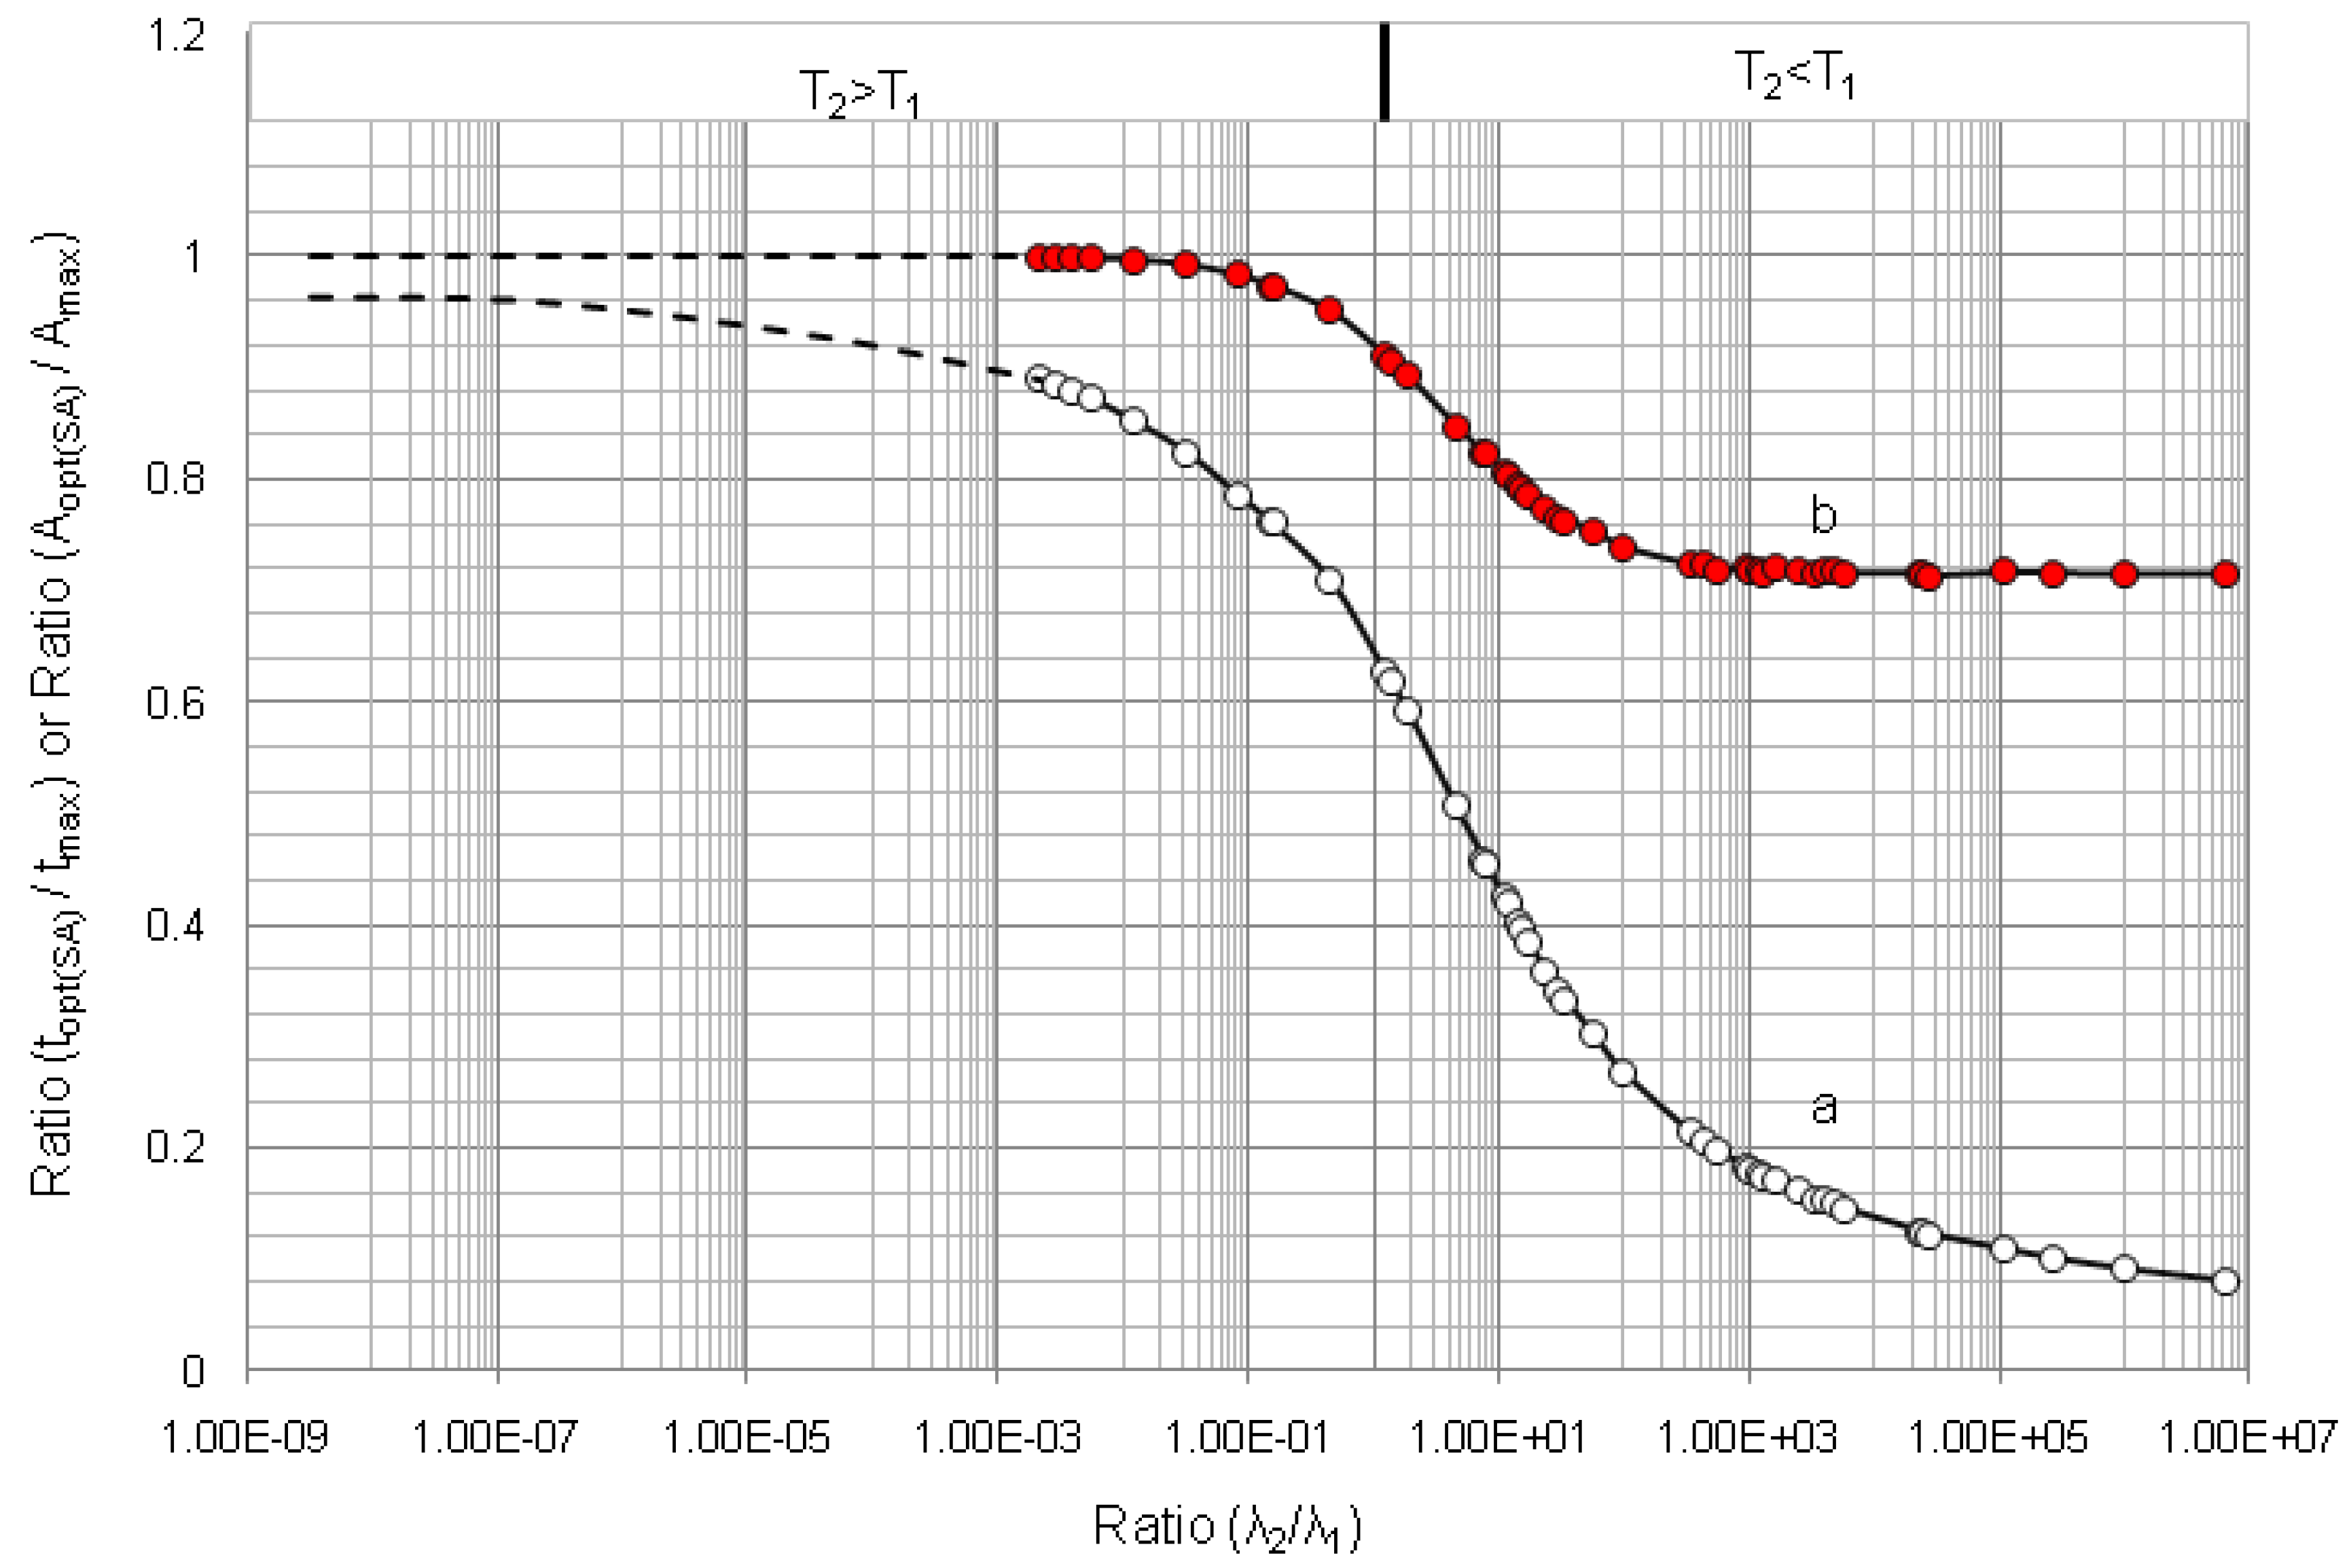
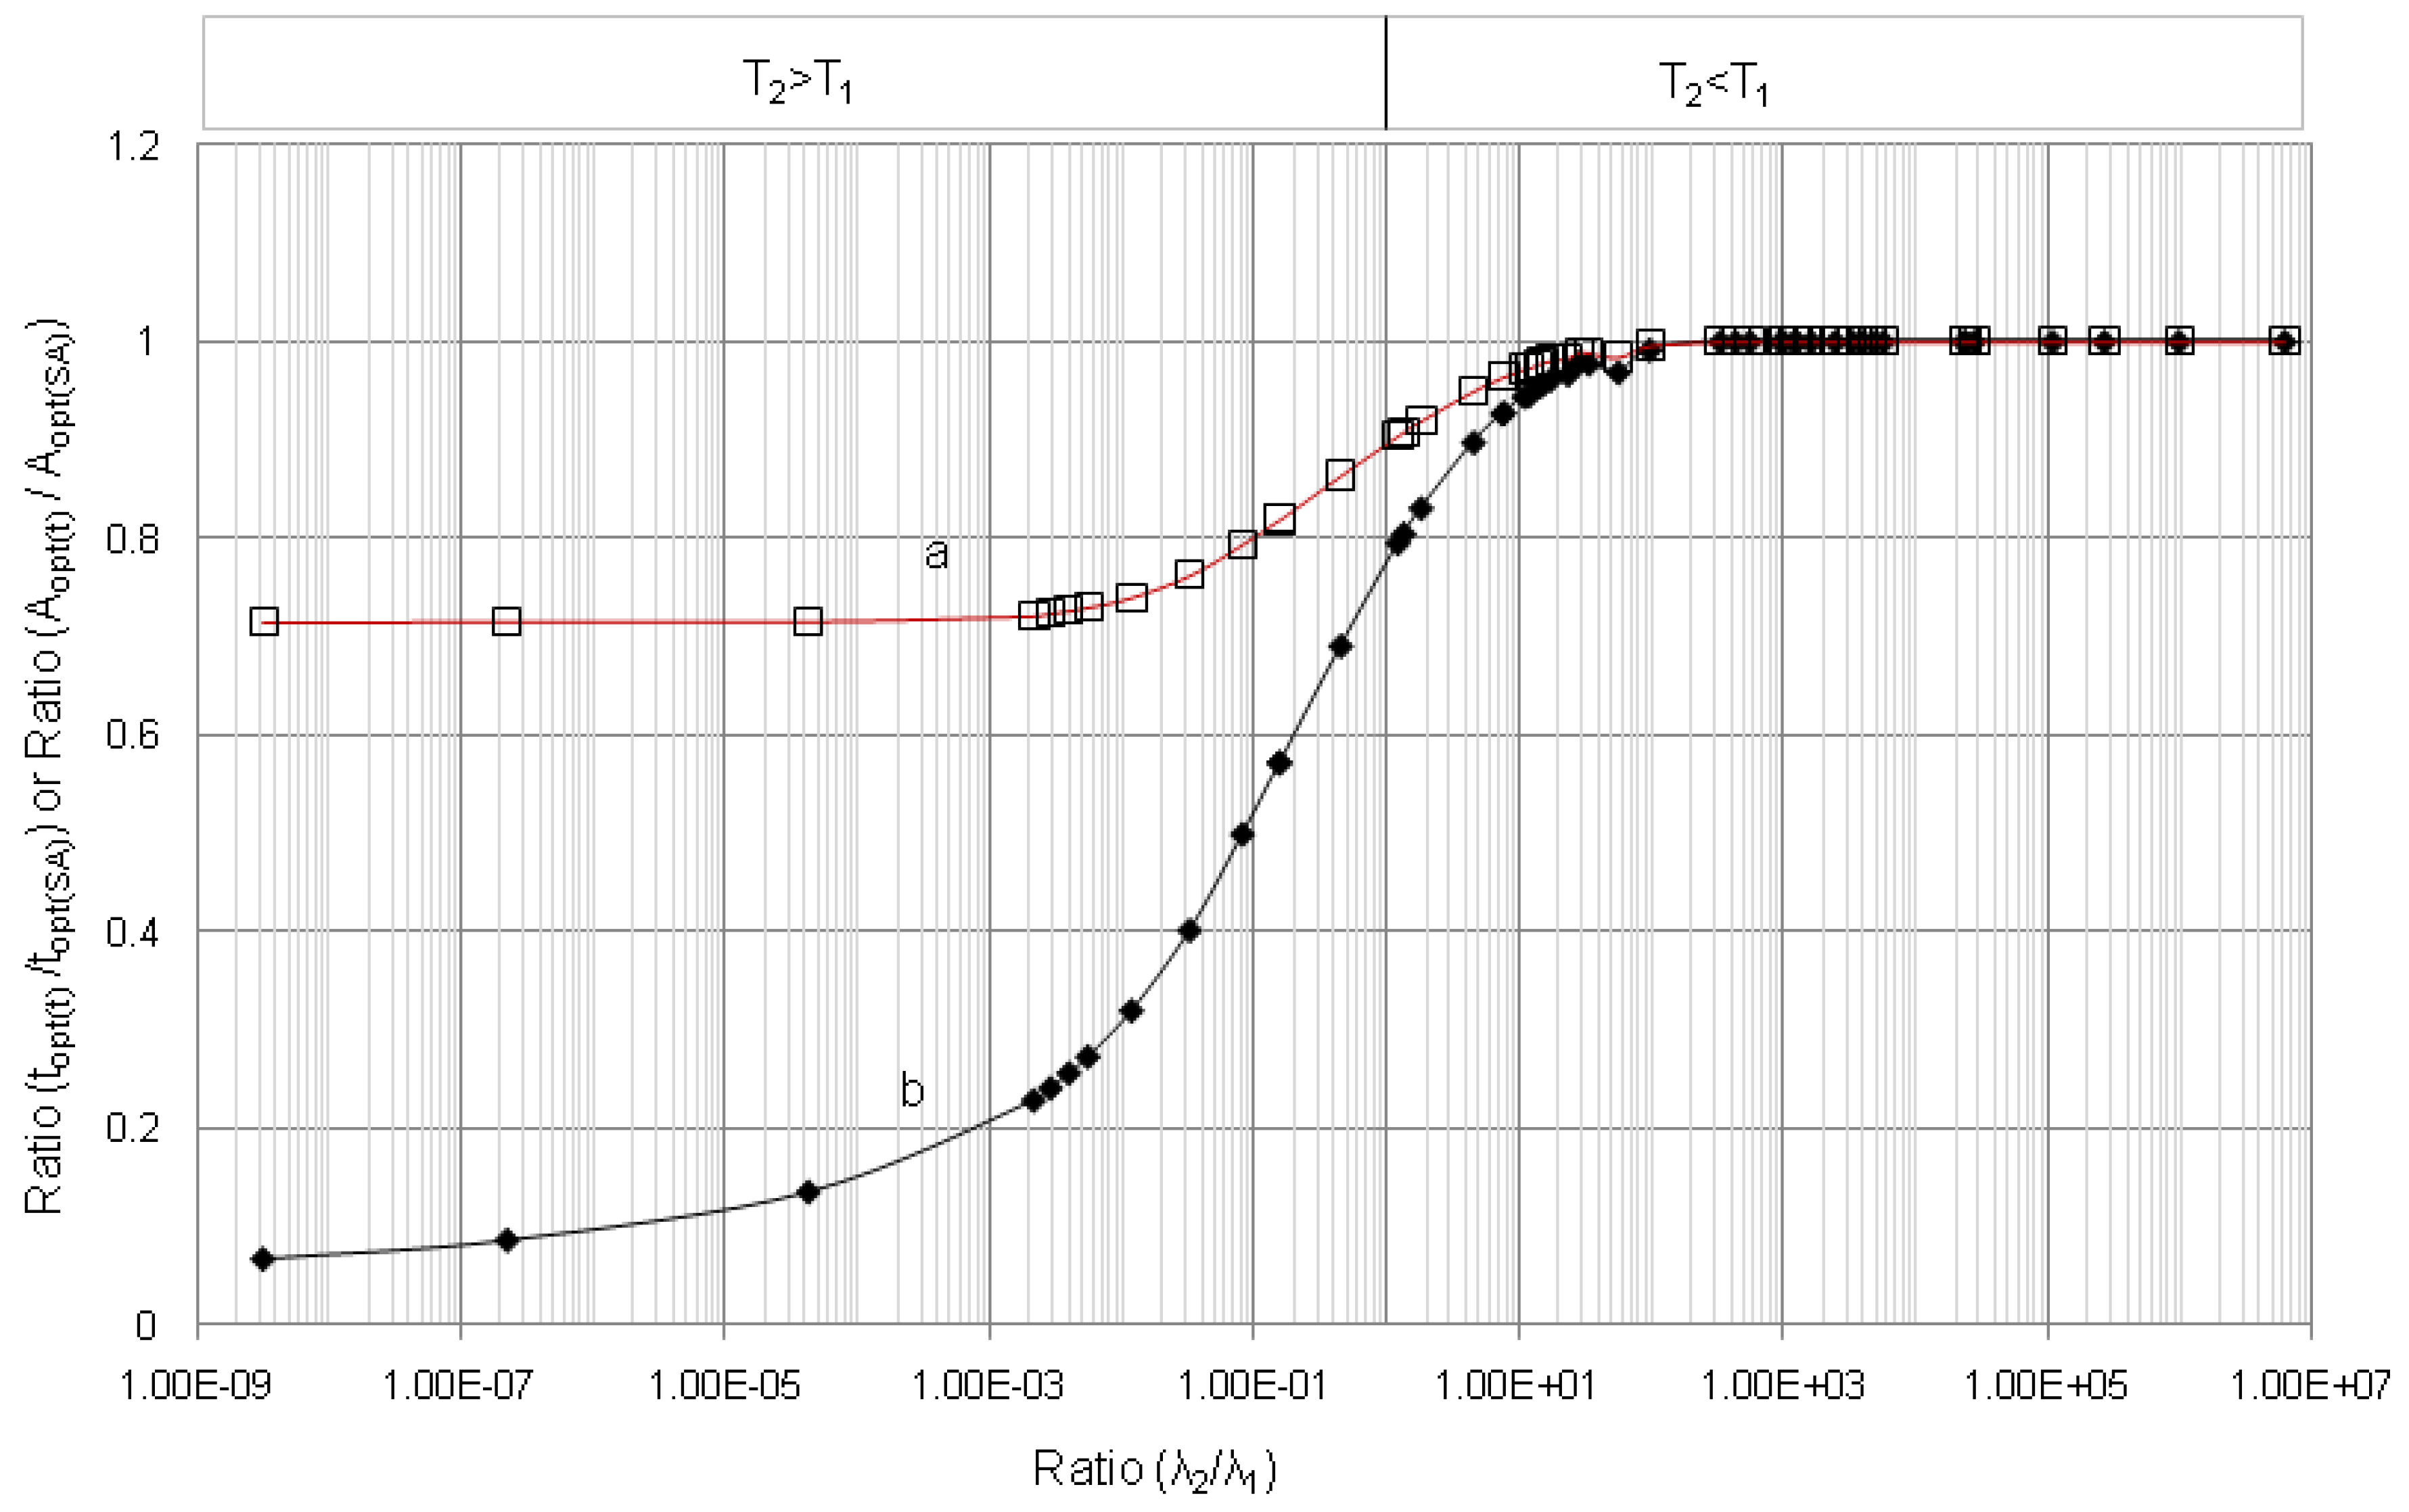
4.1.1. Daughter Nuclide Build-up Optimisation and New Characteristic Parameter of Formation-Decay Kinetics of Parent/Daughter Nuclide System (Referred to Section 2.1.1 and Section 2.1.2)

| Radioisotope
Parent R1-Daughter R2 | Half life | λ2/λ1 | tmax | topt(t) | (topt(t)/tmax) | (A2,opt(t)/A2,max) | topt(SA) | (topt(SA)/tmax) | (A2,opt(SA)/A2,max) | |
|---|---|---|---|---|---|---|---|---|---|---|
| Parent Nuclide T1 | Daughter Nuclide T2 | |||||||||
| 99mTc–99Tc | 6.02 h | 214000 y | 3.21 × 10⁻⁹ | 170.09 | 10.91 | 0.064 | 0.714 | - | - | - |
| 93mMo–93Mo | 6.9 h | 3500 y | 2.25 × 10⁻⁷ | 152.14 | 12.51 | 0.082 | 0.715 | - | - | - |
| 83mSr–83Sr | 5.0 s | 1.35 d | 4.27 × 10⁻⁵ | 0.0201 | 0.0025 | 0.125 | 0.715 | - | - | - |
| 131Te–131I | 25 min | 192.96 h | 2.16 × 10⁻³ | 3.6984 | 0.75 | 0.203 | 0.721 | 3.29 | 0.889 | 0.999 |
| 82mBr–82Br | 6.13 min | 35.3 h | 2.90 × 10⁻³ | 0.8641 | 0.184 | 0.219 | 0.723 | - | - | - |
| 67Ge–67Ga | 18.7 min | 78.26 h | 3.98 × 10⁻³ | 2.4955 | 0.56 | 0.224 | 0.725 | 2.19 | 0.877 | 0.998 |
| 57Ni–57Co | 36.16 h | 270.9 d | 5.56 × 10⁻³ | 272.10 | 64.73 | 0.238 | 0.729 | 237.5 | 0.872 | 0.998 |
| 125Xe–125I | 17 h | 59.89 d | 1.18 × 10⁻² | 110.13 | 30 | 0.272 | 0.737 | 94 | 0.853 | 0.996 |
| 149Nd–149Pm | 1.73 h | 53.08 h | 3.26 × 10⁻² | 8.8358 | 2.92 | 0.330 | 0.756 | 7.28 | 0.823 | 0.992 |
| 95Ru–95Tc | 1.63 h | 20 h | 8.15 × 10⁻² | 6.4218 | 2.52 | 0.392 | 0.780 | 5.05 | 0.786 | 0.982 |
| 131mTe–131I | 30 h | 8.04 d | 1.55 × 10⁻¹ | 95.425 | 41.52 | 0.435 | 0.797 | 72.65 | 0.761 | 0.973 |
| 123Xe–123I | 2.08 h | 13.3 h | 1.56 × 10⁻¹ | 6.6033 | 2.87 | 0.435 | 0.797 | 5.02 | 0.760 | 0.973 |
| 52Ti–52V | 1.7 min | 3.76 min | 4.52 × 10⁻¹ | 0.0592 | 0.029 | 0.489 | 0.821 | 0.042 | 0.709 | 0.950 |
| 131Ba–131Cs | 11.8 d | 9.69 d | 1.22 | 369.75 | 184.5 | 0.499 | 0.823 | 232.1 | 0.627 | 0.911 |
| 47Ca–47Sc | 4.536 d | 3.351 d | 1.35 | 134.63 | 67 | 0.498 | 0.823 | 83.25 | 0.618 | 0.906 |
| 95Zr–95Nb | 64.05 d | 34.98 d | 1.83 | 1613.3 | 795.1 | 0.493 | 0.821 | 957.2 | 0.593 | 0.893 |
| 38S–38Cl | 169.7 min | 37.24 min | 4.56 | 1.7401 | 0.79 | 0.454 | 0.804 | 0.88 | 0.505 | 0.847 |
| 14°Ba–14°La | 12.74 d | 40.272 h | 7.59 | 135.65 | 57.61 | 0.425 | 0.793 | 62.16 | 0.458 | 0.823 |
| 72Se–72As | 8.4 d | 26 h | 7.76 | 88.231 | 37.3 | 0.423 | 0.792 | 40.2 | 0.455 | 0.821 |
| 99Mo–99mTc | 66.02 h | 6.007 h | 11.00 | 22.849 | 9.145 | 0.400 | 0.783 | 9.685 | 0.423 | 0.805 |
| 115Cd–115mIn | 53.46 h | 4.486 h | 11.90 | 17.460 | 6.9 | 0.395 | 0.781 | 7.3 | 0.418 | 0.803 |
| 97Zr–97Nb | 16.9 h | 72.1 min | 14.10 | 4.9339 | 1.89 | 0.383 | 0.776 | 1.98 | 0.401 | 0.794 |
| 8°mBr–8°Br | 4.42 h | 17.4 min | 15.20 | 1.2196 | 0.461 | 0.378 | 0.774 | - | - | - |
| 125Sb–125mTe | 2.77 y | 58 d | 17.40 | 6090.6 | 2245 | 0.368 | 0.771 | 2335 | 0.383 | 0.786 |
| 52Fe–52mMn | 8.3 h | 21.1 min | 23.60 | 1.6755 | 0.58 | 0.346 | 0.761 | 0.6 | 0.358 | 0.774 |
| 87Y–87mSr | 80.3 h | 2.8 h | 28.60 | 14.069 | 4.7 | 0.334 | 0.757 | 4.8 | 0.341 | 0.765 |
| 132Te–132I | 78.2 h | 2.3 h | 34.10 | 12.063 | 3.91 | 0.324 | 0.754 | 4 | 0.331 | 0.762 |
| 62Zn–62Cu | 9.2 h | 9.7 min | 56.90 | 0.9595 | 0.28 | 0.292 | 0.741 | 0.289 | 0.301 | 0.753 |
| 188W–188Re | 69.4 d | 16.98 h | 98.20 | 113.49 | 30.1 | 0.265 | 0.736 | 30.35 | 0.267 | 0.739 |
| 122Xe–122I | 20.1 h | 3.6 min | 3.35 × 10² | 0.5049 | 0.108 | 0.214 | 0.723 | 0.108 | 0.213 | 0.723 |
| 1°3Pd–1°3mRh | 16.96 d | 56.12 min | 4.37 × 10² | 8.2235 | 1.69 | 0.205 | 0.722 | 1.69 | 0.205 | 0.722 |
| 28Mg–28Al | 20.91 h | 2.24 min | 5.60 × 10² | 0.3415 | 0.067 | 0.196 | 0.718 | 0.067 | 0.196 | 0.718 |
| 128Ba–128Cs | 2.4 d | 3.6 min | 9.58 × 10² | 0.5950 | 0.109 | 0.183 | 0.720 | 0.109 | 0.183 | 0.720 |
| 1°3Ru–1°3mRh | 39.35 d | 56.12 min | 1.01 × 10³ | 9.3456 | 1.692 | 0.181 | 0.718 | 1.692 | 0.181 | 0.718 |
| 1°9Pd–1°9mAg | 13.43 h | 39.8 s | 1.21 × 10³ | 0.1133 | 0.02 | 0.176 | 0.718 | 0.02 | 0.176 | 0.718 |
| 81Rb–81mKr | 4.6 h | 13.1 s | 1.27 × 10³ | 0.0375 | 0.0065 | 0.173 | 0.713 | 0.0065 | 0.173 | 0.713 |
| 113Sn–113mIn | 115.1 d | 1.7 h | 1.62 × 10³ | 18.146 | 3.1 | 0.171 | 0.720 | 3.1 | 0.170 | 0.720 |
| 118Te–118Sb | 6 d | 3.5 min | 2.47 × 10³ | 0.6577 | 0.106 | 0.161 | 0.718 | 0.106 | 0.161 | 0.718 |
| 178W–178Ta | 21.5 d | 9.3 min | 3.33 × 10³ | 1.8148 | 0.28 | 0.155 | 0.715 | 0.28 | 0.154 | 0.715 |
| 9°Sr–9°Y | 28.82 y | 64 h | 3.95 × 10³ | 763.72 | 116 | 0.152 | 0.717 | 116 | 0.151 | 0.717 |
| 195mHg–195mAu | 40 h | 30.6 s | 4.71 × 10³ | 0.1037 | 0.0155 | 0.149 | 0.718 | 0.0155 | 0.149 | 0.718 |
| 68Ge–68Ga | 271 d | 68.3 min | 5.71 × 10³ | 14.211 | 2.063 | 0.145 | 0.716 | 2.063 | 0.145 | 0.716 |
| 42Ar–42K | 32.9 y | 12.36 h | 2.34 × 10⁴ | 179.43 | 22.4 | 0.125 | 0.715 | 22.4 | 0.124 | 0.715 |
| 144Ce–144Pr | 284.9 d | 17.28 min | 2.37 × 10⁴ | 4.1869 | 0.522 | 0.125 | 0.715 | 0.522 | 0.124 | 0.715 |
| 82Sr–82Rb | 25 d | 1.3 min | 2.77 × 10⁴ | 0.3198 | 0.039 | 0.122 | 0.712 | 0.039 | 0.121 | 0.712 |
| 44Ti–44Sc | 48.2 y | 3.9 h | 1.09 × 10⁵ | 65.068 | 7.07 | 0.109 | 0.716 | 7.07 | 0.108 | 0.716 |
| 191Os–191mIr | 15.4 d | 4.96 s | 2.68 × 10⁵ | 0.0248 | 0.0025 | 0.101 | 0.715 | 0.0025 | 0.100 | 0.715 |
| 1°9Cd–1°9mAg | 453 d | 39.8 s | 9.82 × 10⁵ | 0.2201 | 0.02 | 0.091 | 0.714 | 0.02 | 0.090 | 0.714 |
| 137Cs–137mBa | 30.14 y | 2.552 min | 6.20 × 10⁶ | 0.9599 | 0.077 | 0.080 | 0.714 | 0.077 | 0.080 | 0.714 |


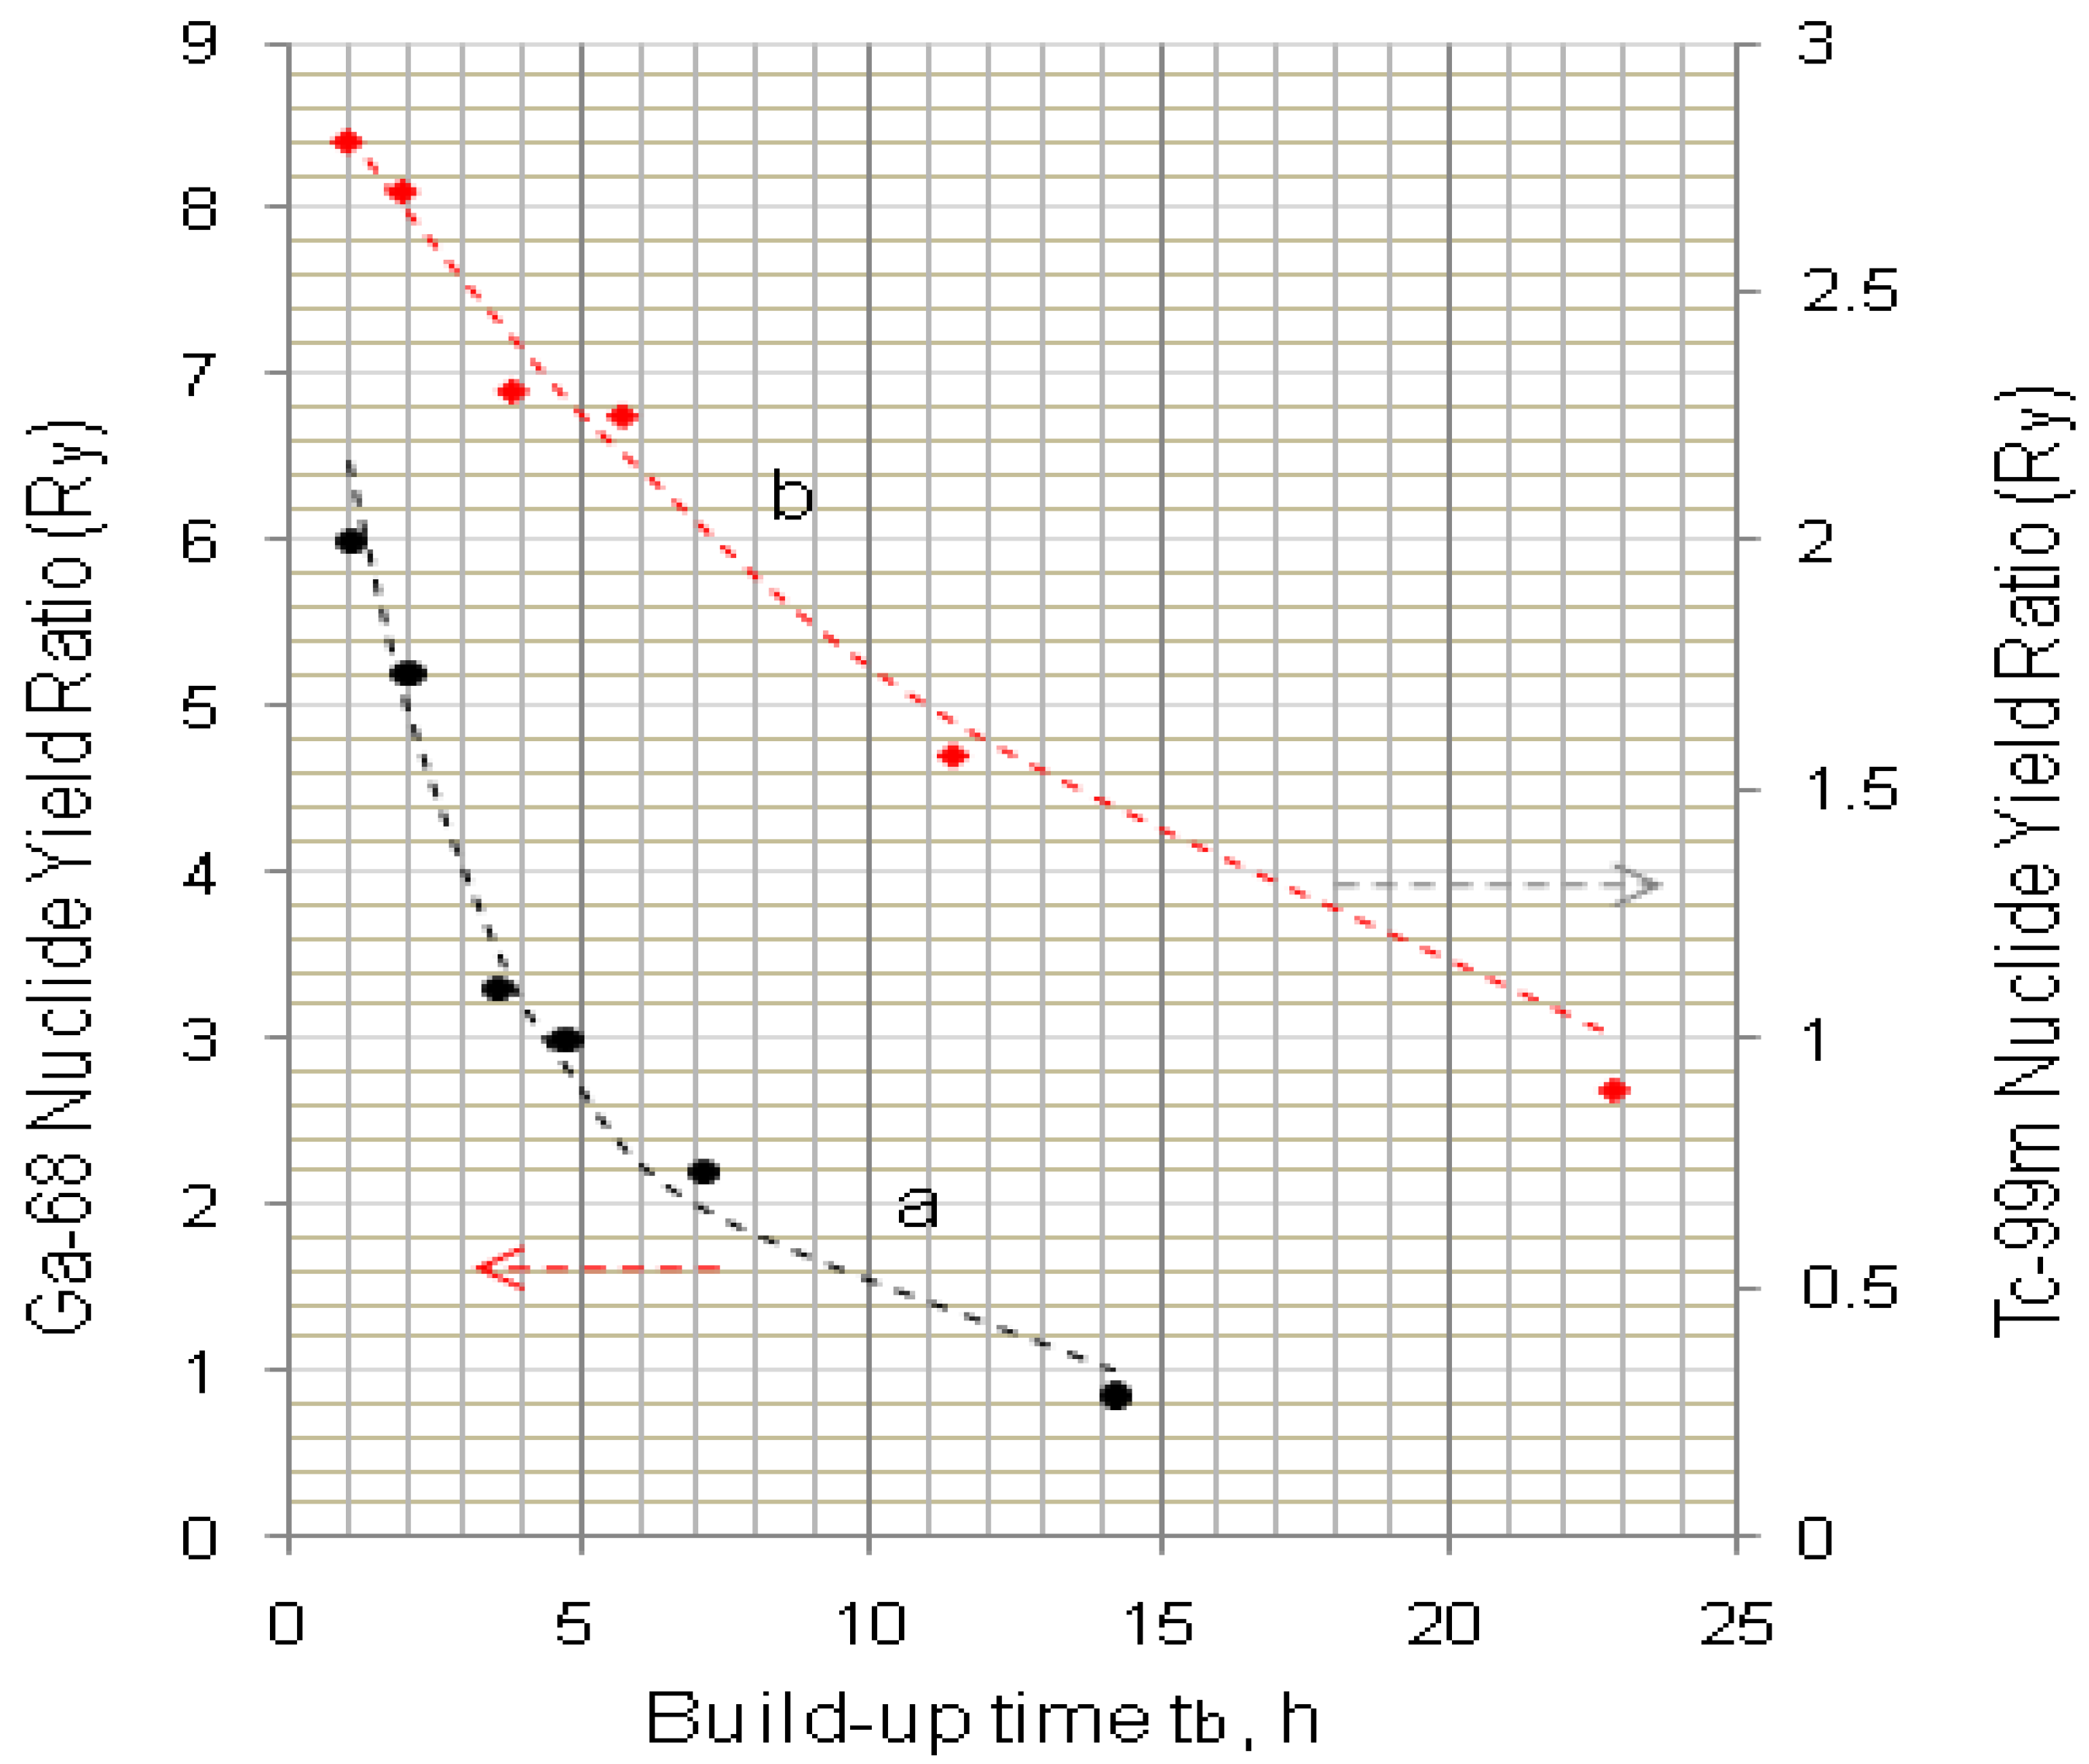
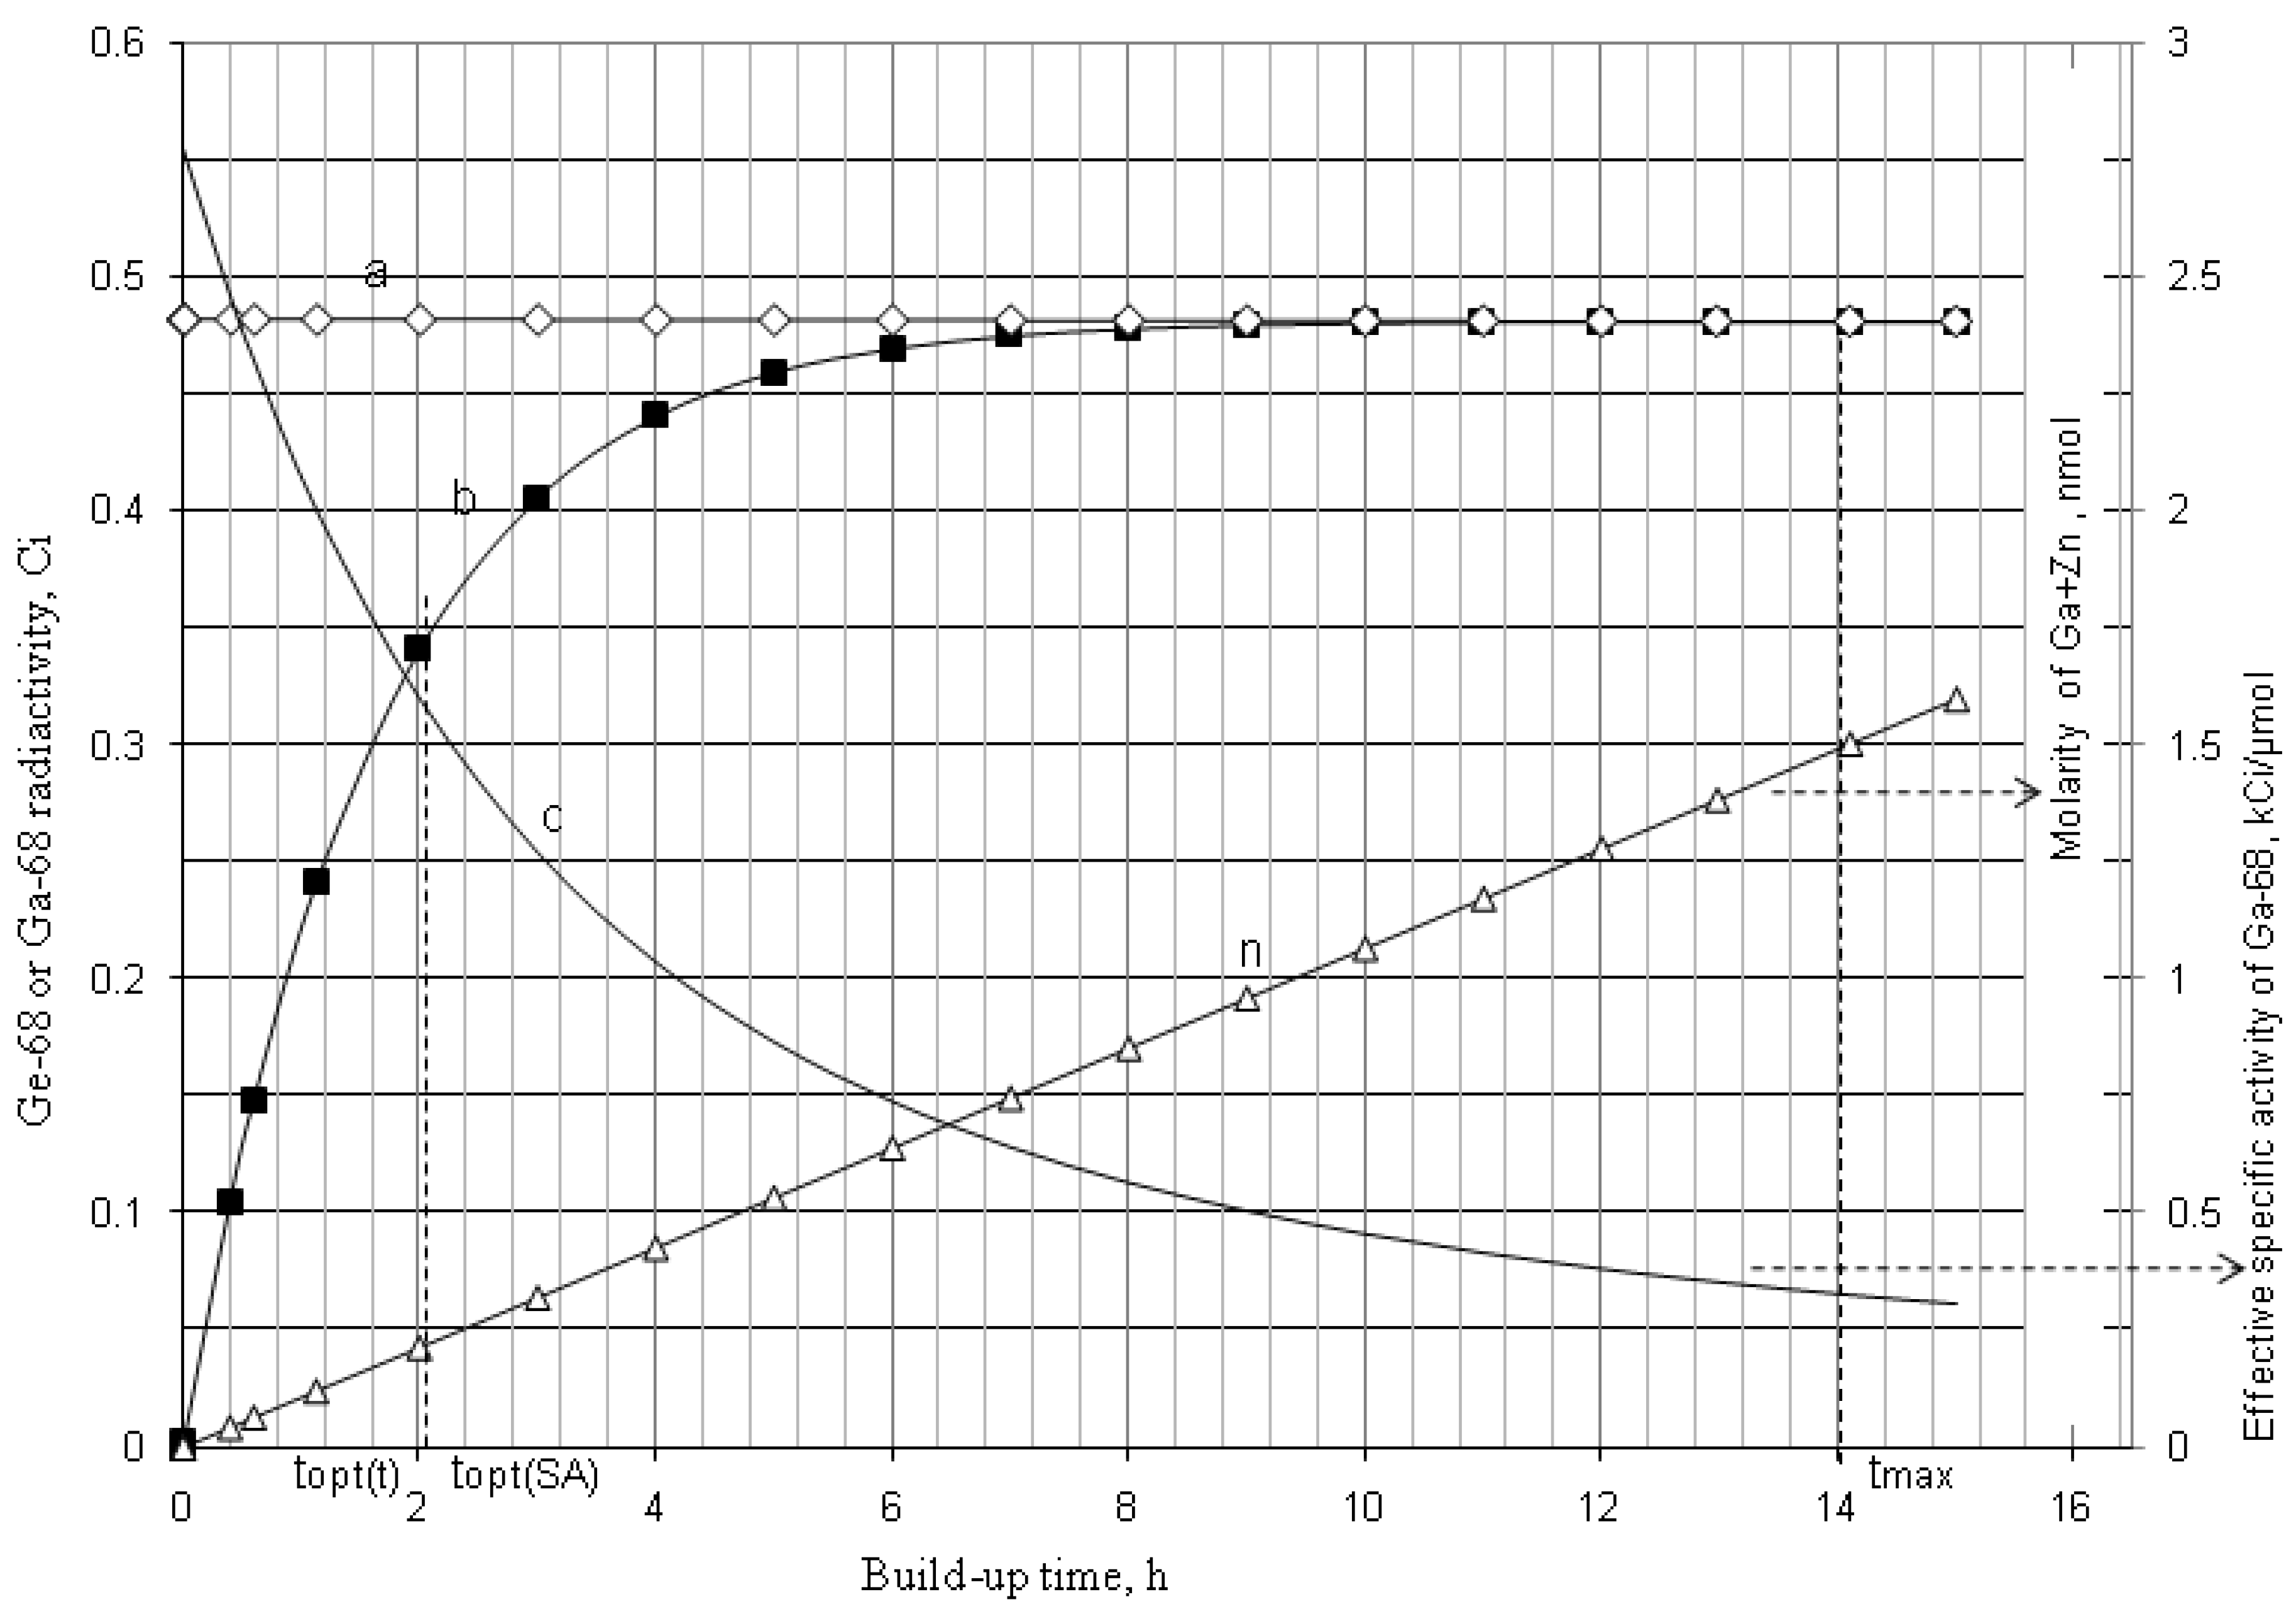
4.1.2. Early Elution Schedule for Improvement of Daughter Nuclide Production Yield and Specific Radioactivity, Elution of 99Mo/99mTc and 68Ge/68Ga Generator-Concentrator Systems as the Cases
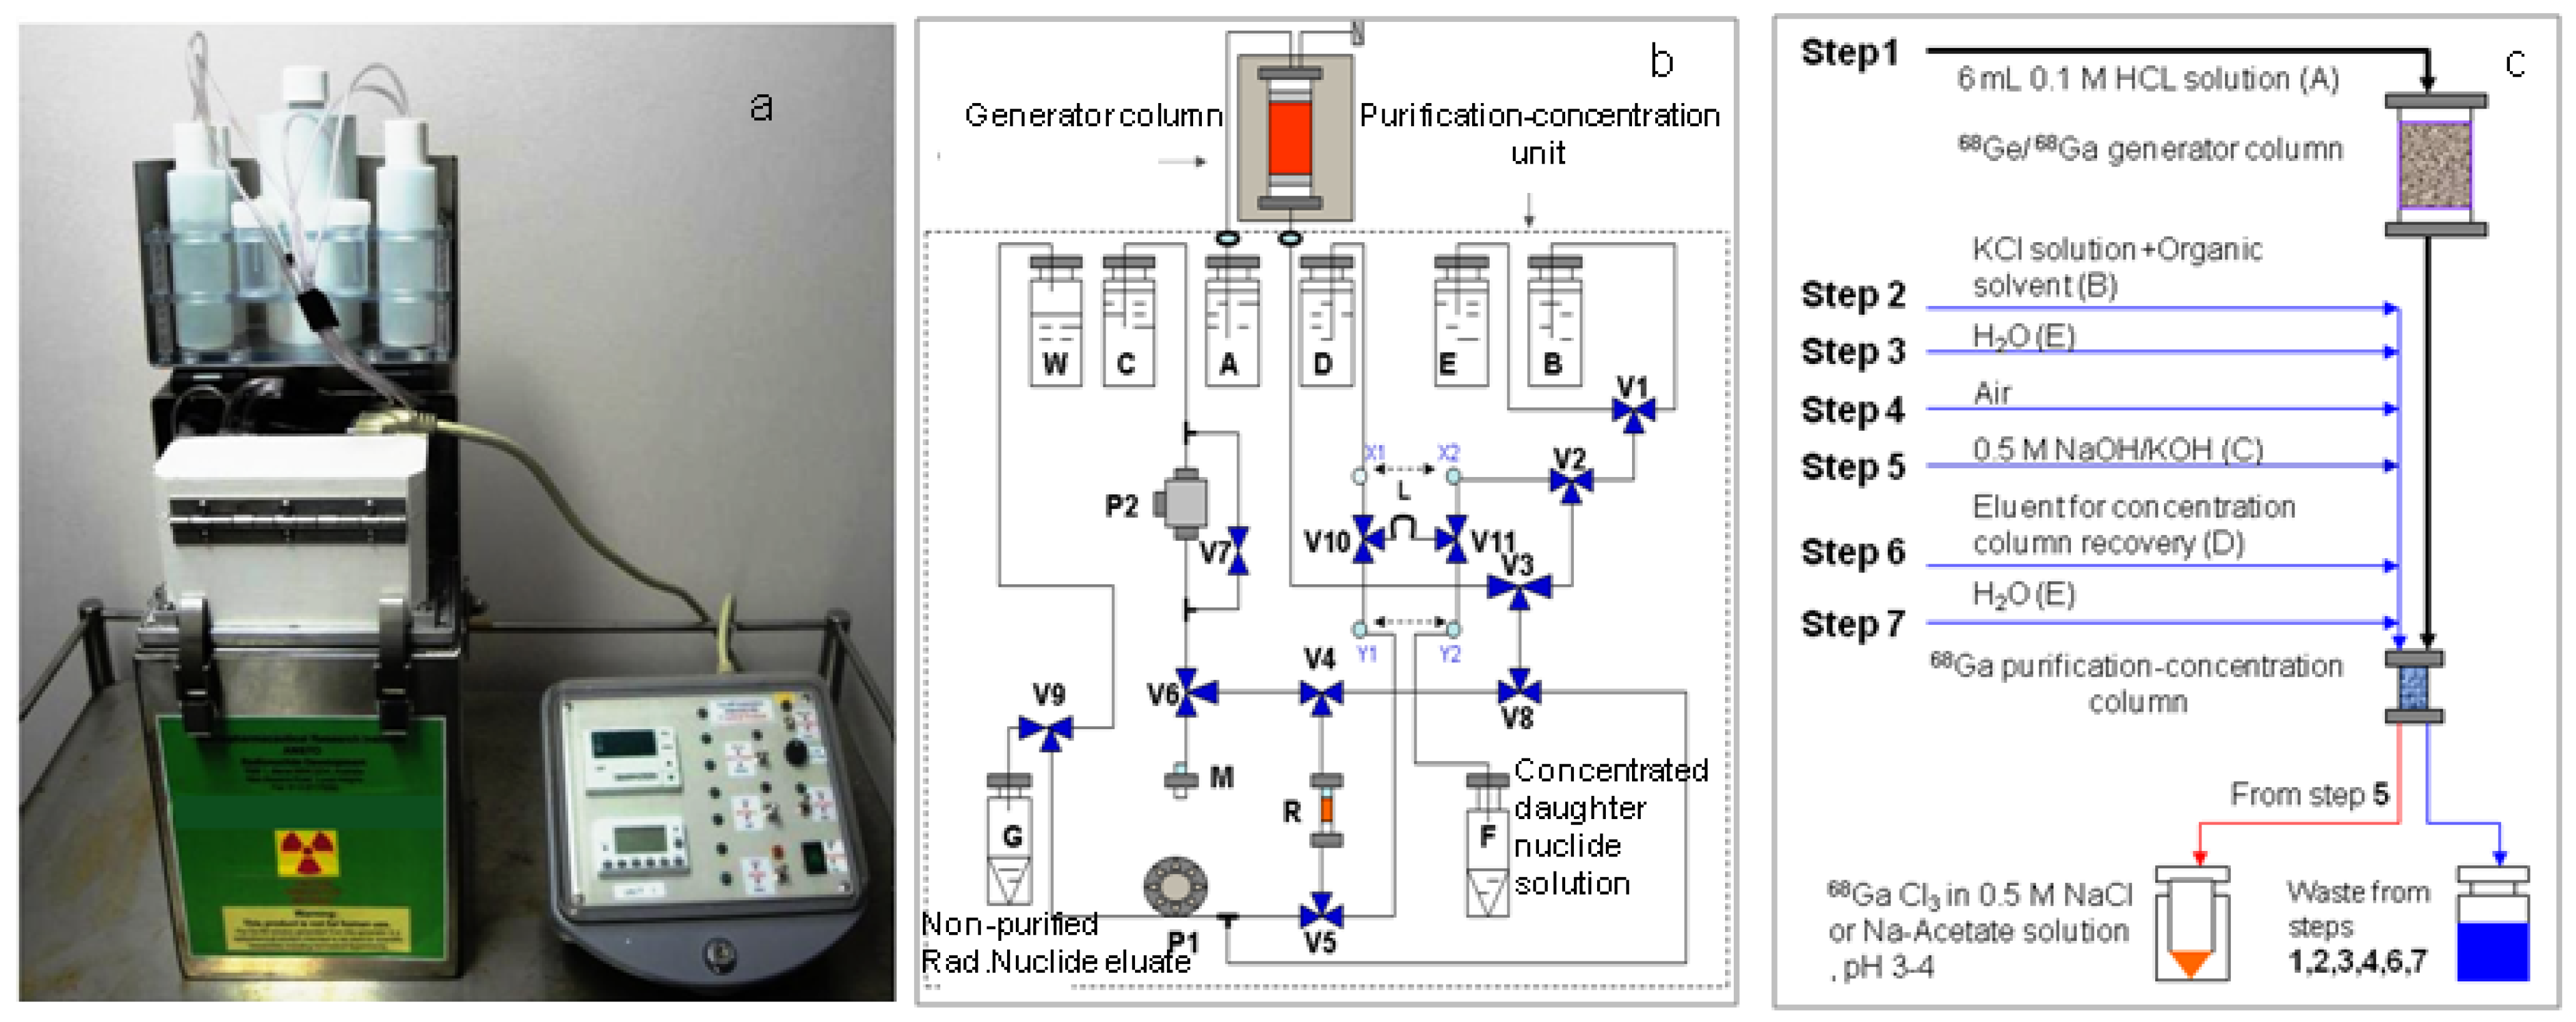
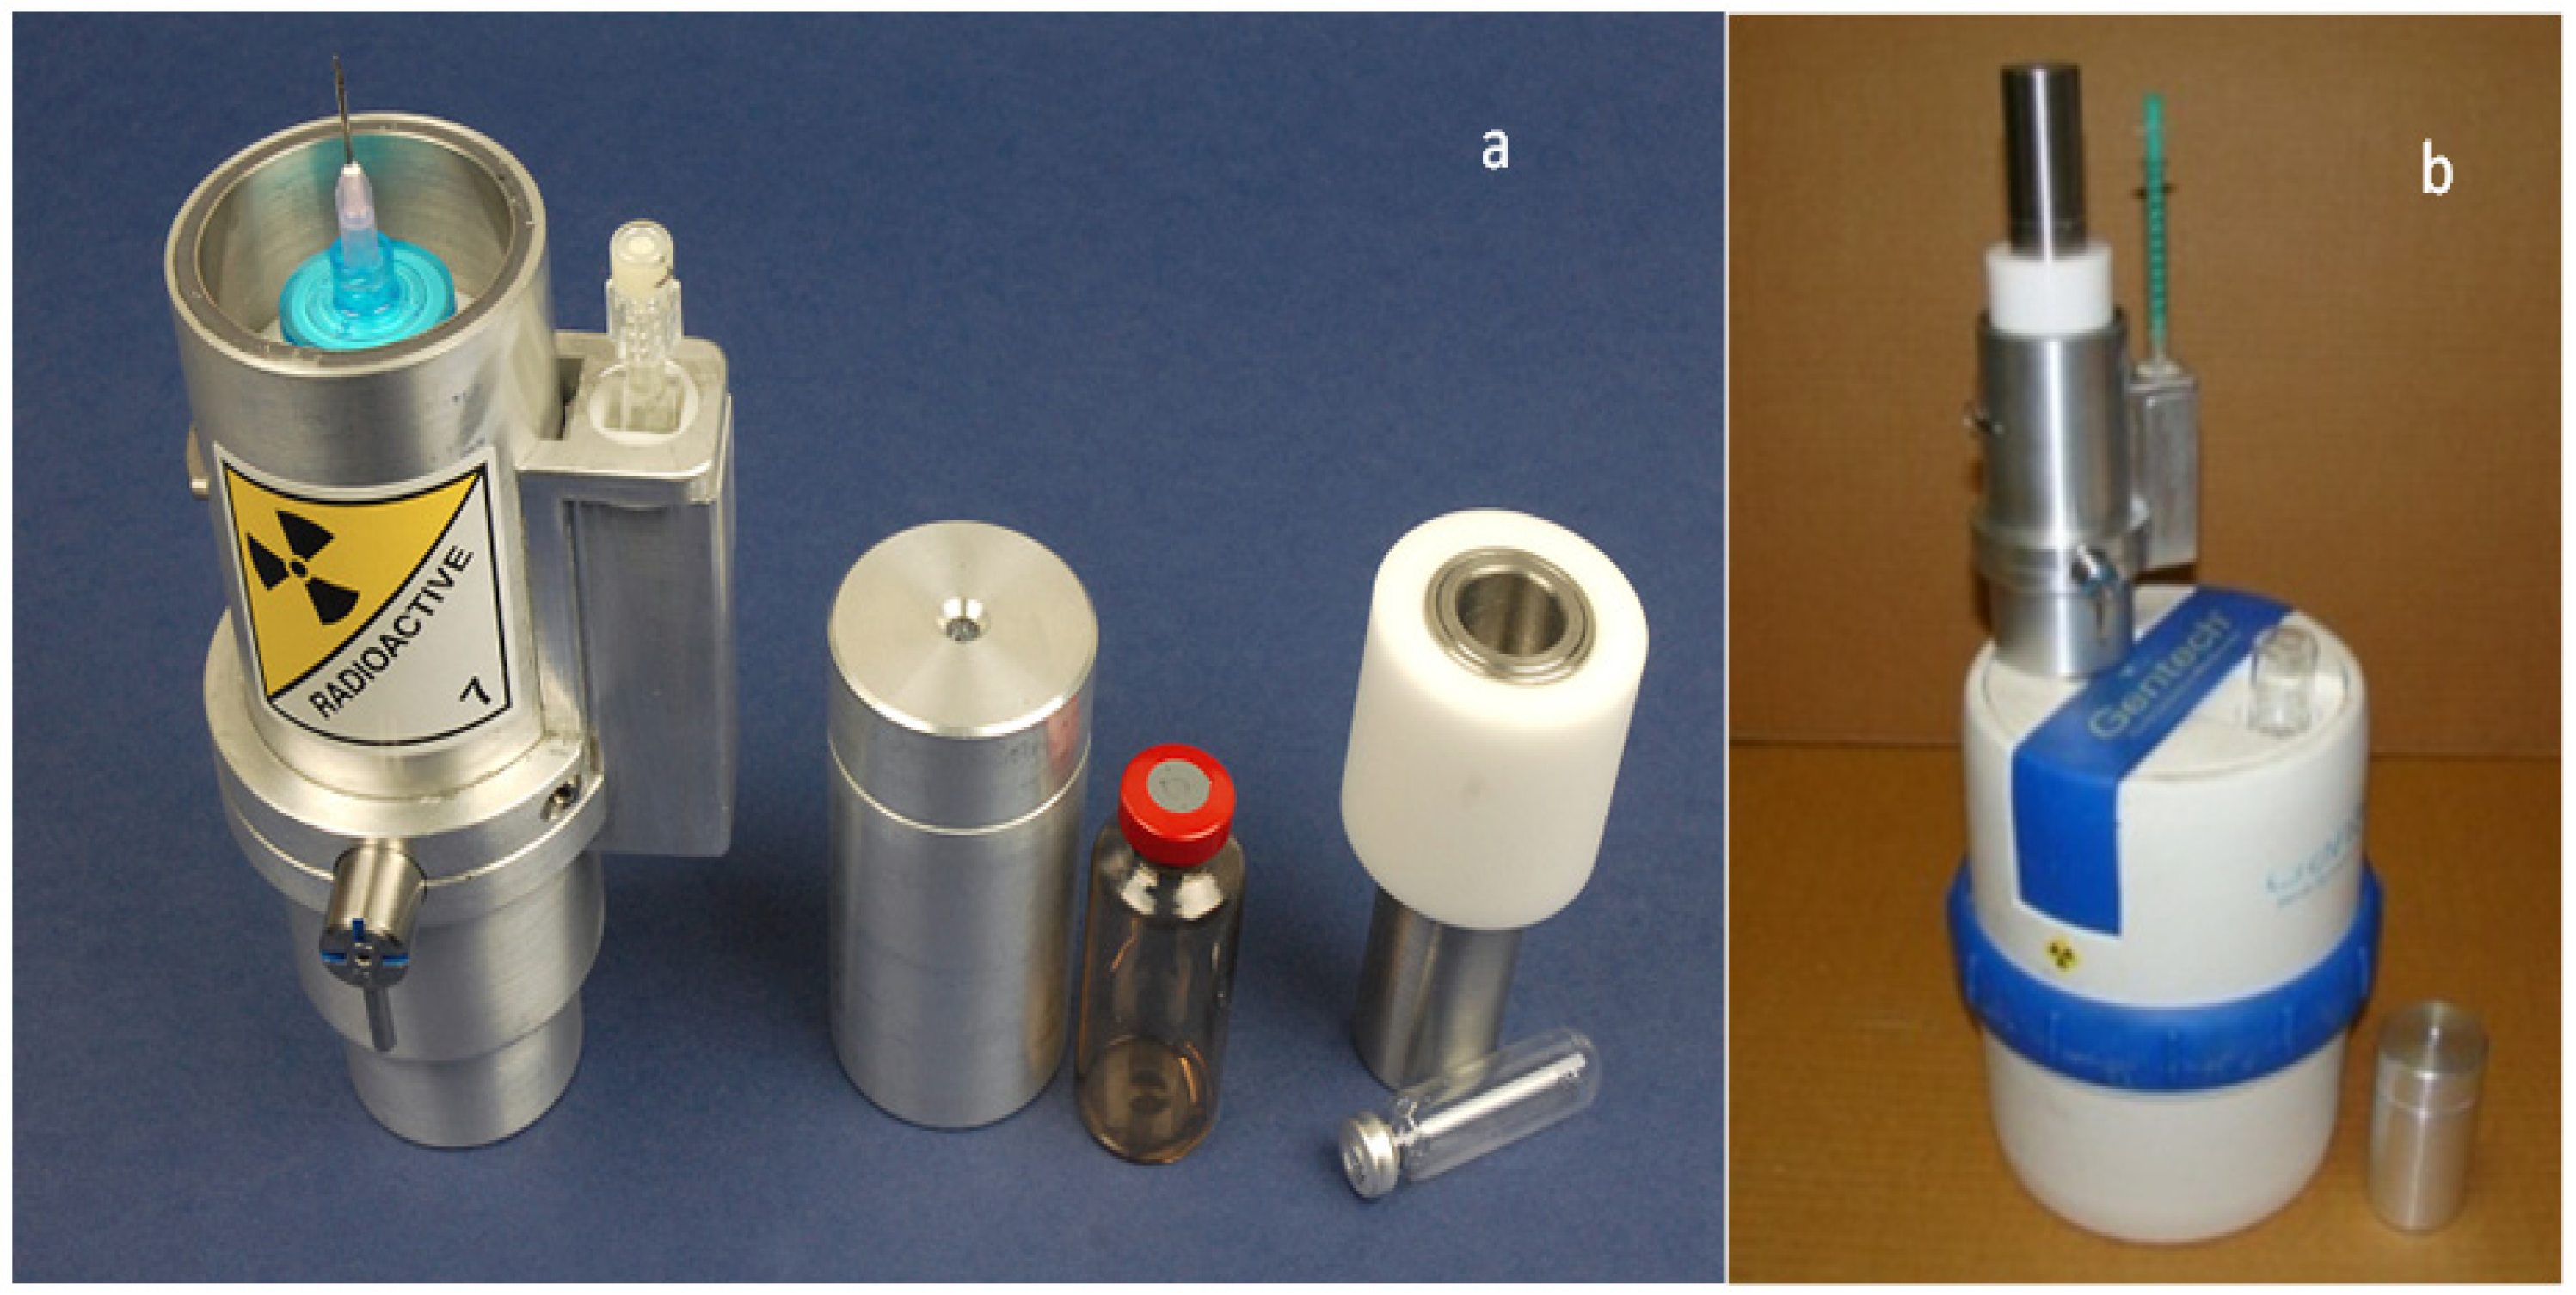
4.2. Use of Daughter Nuclide Concentration Process in Combination with Methods of Build-up Time Optimisation and Early Elution Schedule for Increasing the Effectiveness of Generator Utilisation, 99Mo/99mTc and 68Ge/68Ga Generator-Concentrator Systems as the Cases (Referred to Section 2.1.1, Section 2.1.2 and Section 2.1.3 and Section 2.2 and Section 3.2)
| Elution Time | 8 am | Day 1 | Day 3 | Day 6 | |
|---|---|---|---|---|---|
| Early elution schedule of 6 h 99mTc-buidup time
(4 elutions/day) performed with support of the radioisotope concentrator ULTRALUTE® | 99mTc-concentration (mCi/mL) | 410 | 200–155 | 120–95 | 57–44 |
| Total yield of generator elutions per day (mCi) | 415.1 | 683.5 | 420.0 | 197.1 | |
| Elution at maximal 99mTc-buildup time (tmax = 22.86 h) (One elution/day) 99mTc-elution efficiency: >95% | 99mTc-concentration (mCi/mL) | 41.5 | 31.5 | 19.4 | 9.1 |
| Total yield of generator elution per day (mCi) | 415.1 | 315.0 | 194.0 | 91.1 | |
| Elution Time | 8 am | 10 am | 12 am | 14 pm | 16 pm | 18 pm | 20 pm | Total 68Ga-Activity Produced | |
|---|---|---|---|---|---|---|---|---|---|
| Early elution schedule of 2.0 h 68Ga -buid-up time
(6 elutions/day) performed with support of RADIGIS-68Ga system | 68Ga-concentration (mCi/mL) | 22.8 | 16.5 | 16.4 | 16.5 | 16.6 | 16.4 | 16.4 | - |
| The yield of generator elution at 2-h build-up time (mCi) | 17.1 | 12.4 | 12.3 | 12.4 | 12.5 | 12.3 | 12.3 | 91.3 | |
| Elution at maximal 68Ga-build-up time without concentrating process (* An elution at 12 h (instead of tmax = 14.1h) build-up time applied with an error of 5%) | 68Ga-concentration (mCi/mL) | 3.4 | - | - | - | - | - | 3.3 | - |
| Total yield of generator elution at maximal 68Ga-build-up time, mCi | 17.1 | - | - | - | - | - | * 16.8 | 33.9 | |
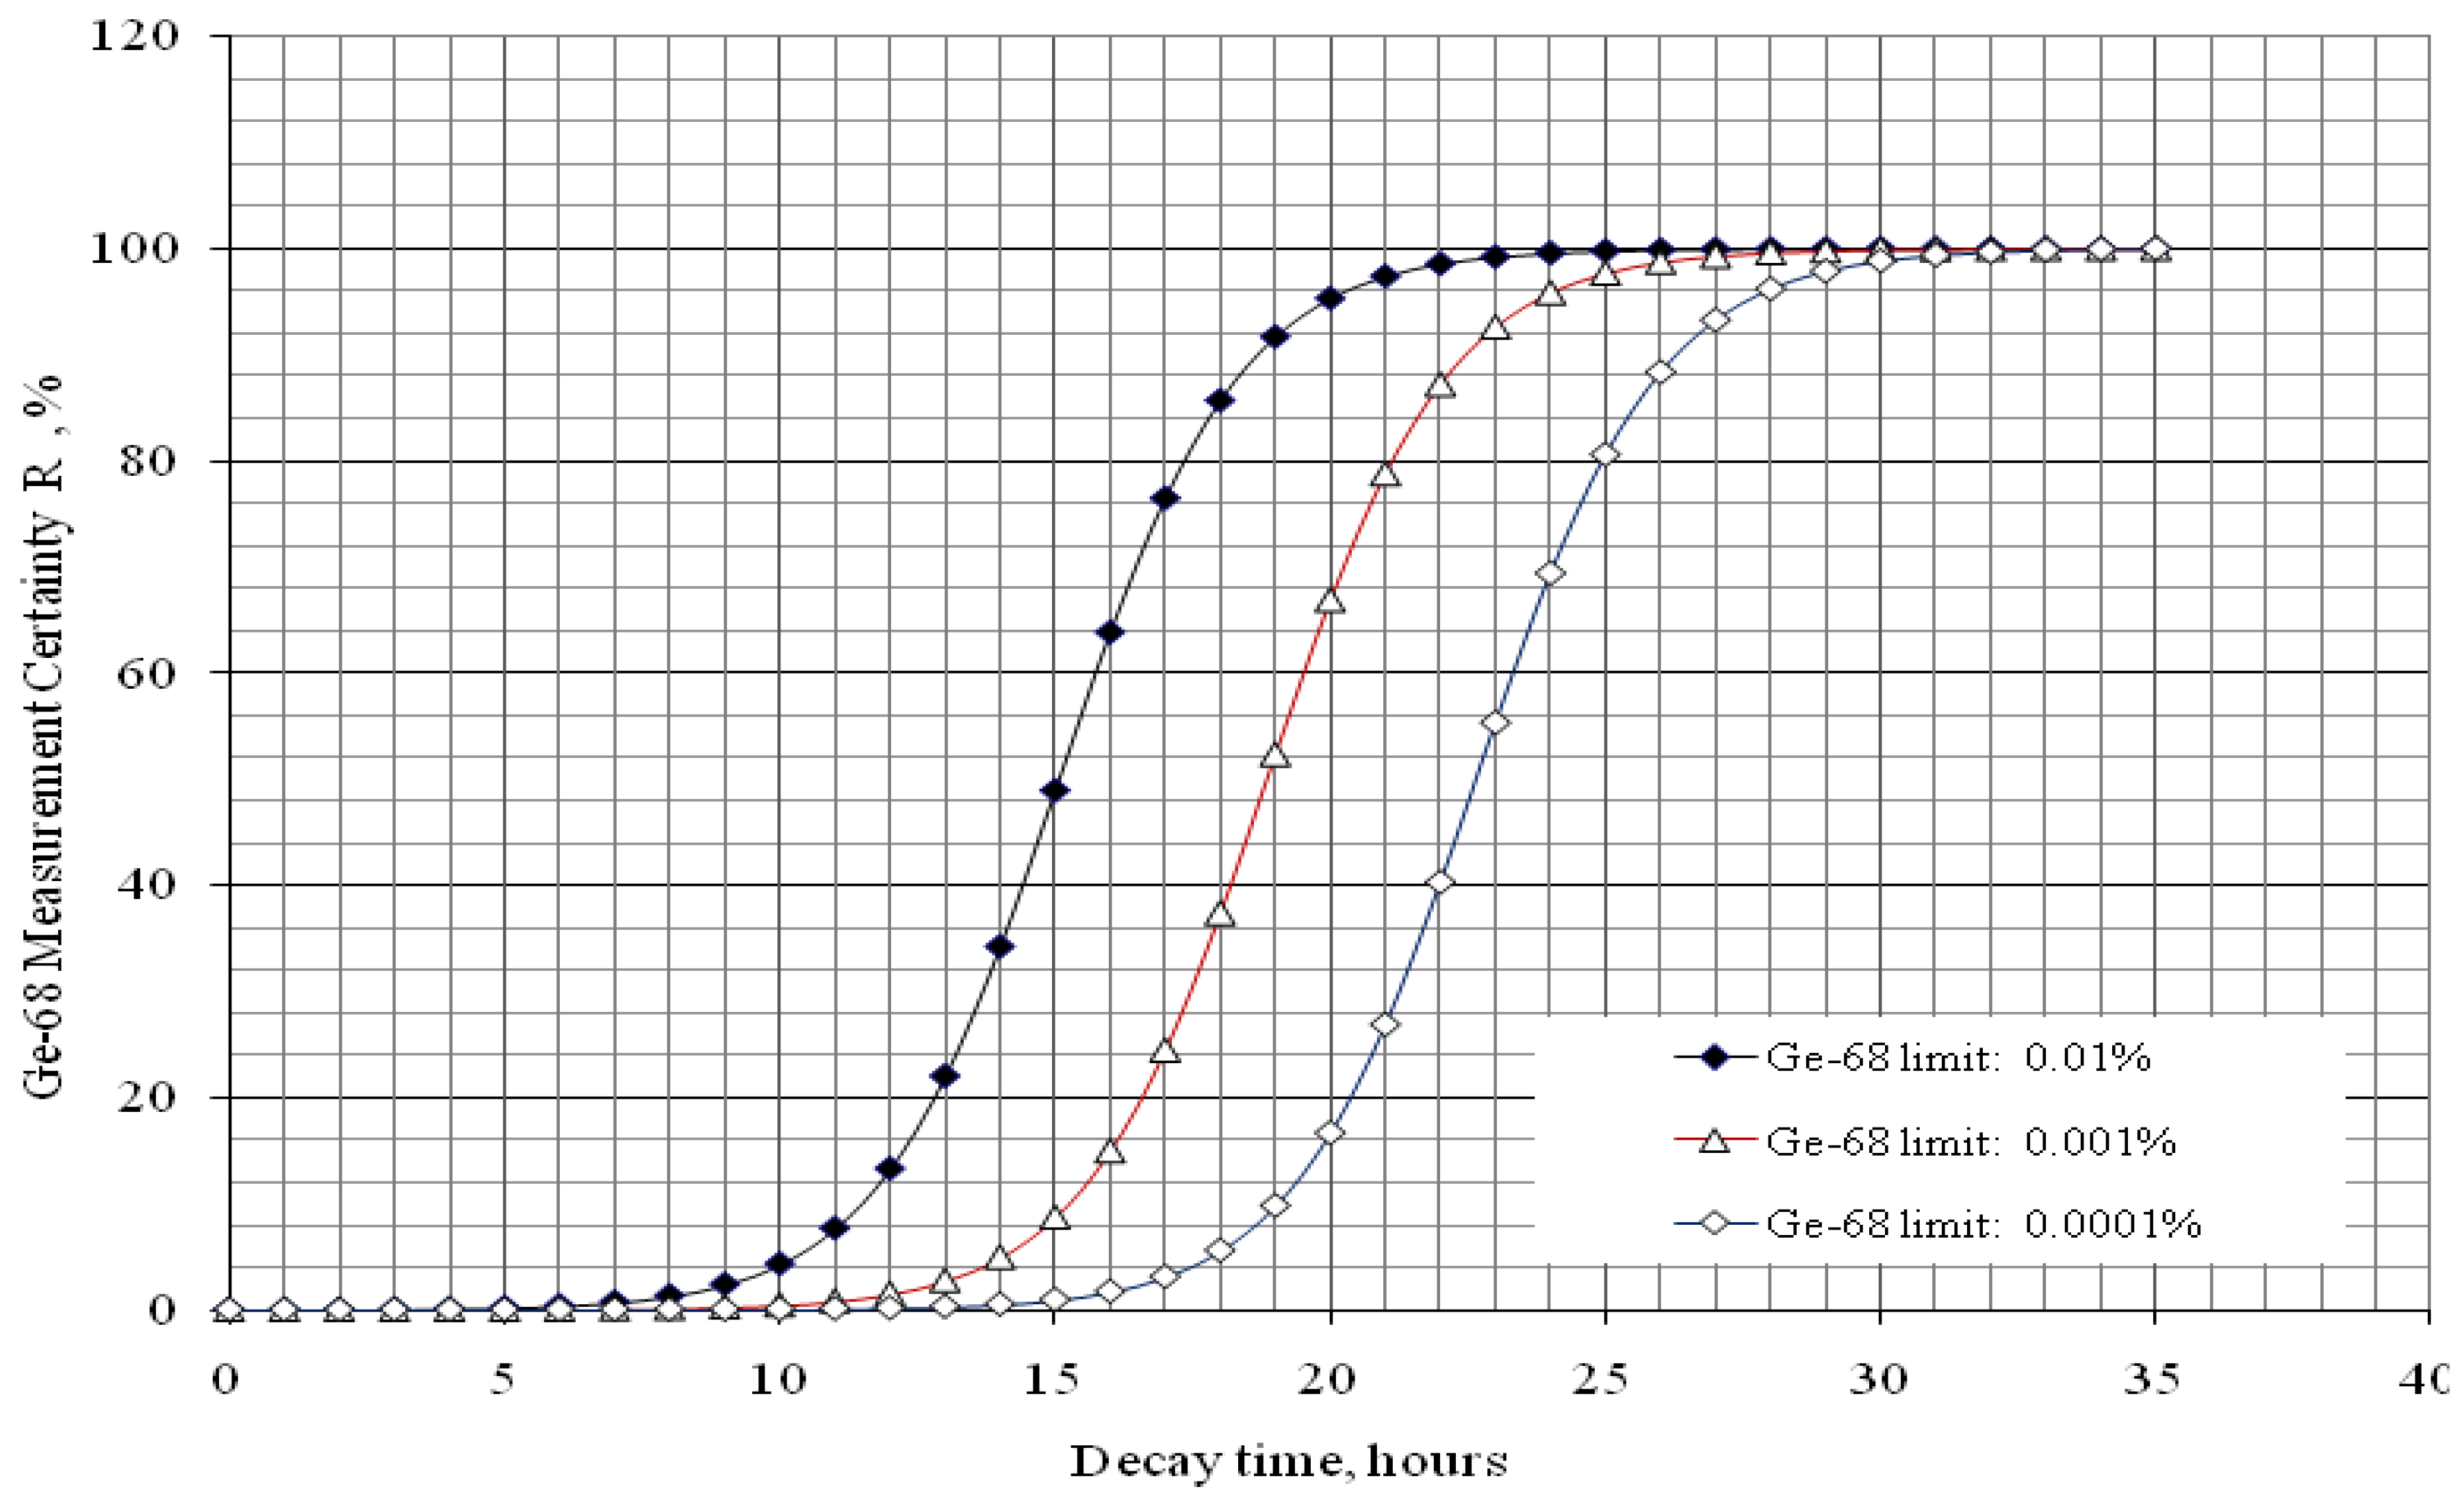
4.3. Effective Control of Radionuclidic Purity: Relationship between Detection Limit, Required Radionuclidic Impurity Limit, Measurement Certainty for the Optimisation of Decay Time and QC Sample Radioactivity Used for Post-Delivery Quality Control, Quality Control of 68Ga Solution as a Case (Referred to Section 2.3)
 with error < 8.77% for count numbers > 500; R(%) = 100 × (Activity of 68Ge/(Activity of 68Ge + Activity of 68Ga).
with error < 8.77% for count numbers > 500; R(%) = 100 × (Activity of 68Ge/(Activity of 68Ge + Activity of 68Ga).
with error < 8.77% for count numbers > 500; R(%) = 100 × (Activity of 68Ge/(Activity of 68Ge + Activity of 68Ga).
 with error < 8.77% for count numbers > 500. R(%) = 100 × (Activity of 68Ge / (Activity of 68Ge + Activity of 68Ga).
| Required radionuclidic impurity limit L, % | Required certainty degree R, % | Required decay time t, hours | Activity of 68Ga–sample taken out from 68Ga–product solution at the product delivery time point (Measurement: 640 min counting for collecting 1000 counts; Error 6.2%) | Activity of 68Ga–sample taken out from 68Ga–product solution at the product delivery time point (Measurement: 30 min counting for collecting 1000 counts; Error 6.2%) |
|---|---|---|---|---|
| 0.01 | 98 | 21.43 | 0.55 μCi | 11.74 μCi |
| 0.001 | 98 | 25.20 | 5.51 μCi | 117.55 μCi |
| 0.0001 | 98 | 28.96 | 55.17 μCi | 1176.96 μCi |
| Note: Counting rate (cps) at 511 keV = (Detection limit × Gamma ray yield × Counting efficiency) = 2.035 Bqs × 1.78 × 0.0072 = 0.026 cps.
Counting time, t = 1000 counts/0.026 cps = 640 min | Note: Proportional increase in sample activity can be used to reduce measurement time | |||


5. Conclusions
Acknowledgments
Author Contributions
Conflicts of Interests
References
- Mushtaq, A.; Vandegrift, G.; Cristini, P. Molybdenum-99 (99Mo): Past, present, and future. Sci. Technol. Nucl. Install. 2014. [Google Scholar] [CrossRef]
- Genka, T. Development of PZC-based Tc-99m Generator. In Proceedings of the Forum for Nuclear Cooperation in Asia (FNCA), Tokyo, Japan, 7–9 February 2007; pp. 1–10.
- Le, V.S.; Morcos, N.; Bogulski, Z. Development of multiple-elution cartridge-based radioisotope concentrator device for increasing the 99mTc and 188Re concentration and the effectiveness of 99mTc/99Mo utilization. J. Radioanal. Nucl. Chem. 2014, in press. [Google Scholar]
- Le, V.S.; Morcos, N.; McBrayer, J. A Radioisotope Concentrator. International Patent Application Published under Patent Cooperation Treaty (PCT), World Intellectual Property Organisation (WIPO) International Publication Number WO 2014/063198 A1, 1 May 2014. [Google Scholar]
- Le, V.S. 99mTc generator preparation using (n,γ)99Mo produced ex-natural molybdenum. In Proceedings of the FNCA 2001 Workshop on the Utilization of Research Reactors, Beijing, China, 5–9 November 2001.
- Le, V.S. 99mTc Generator Development: Up-to-date 99mTc-recovery technologies for increasing the effectiveness of 99Mo utilization. Sci. Technol. Nucl. Install. 2014. [Google Scholar] [CrossRef]
- Le, V.S. Gallium-68 Generator Integrated System: Elution-purification-concentration integration. Rec. Res. Can. Res. 2013, 194, 43–75. [Google Scholar] [CrossRef]
- Le, V.S.; Le, M.K. Multifunctional Sorbent Materials and Uses Thereof. Australia Patent Application AU2013903629, 20 September 2013. [Google Scholar]
- Le, V.S. Gallium-68 Purification. U.S. Patent Application Publication U.S. 2013/0055855 A1, 7 March 2013. [Google Scholar]
- Le, V.S. Sorbent Material. U.S. Patent Application Publication U.S. 2013/0048568 A1, 28 February 2013. [Google Scholar]
- Le, V.S. Specific Radioactivity of Neutron Induced Radioisotopes: Assessment Methods and Application for Medically Useful 177Lu Production as a case. Molecules 2011, 16, 818–846. [Google Scholar] [CrossRef]
- Oehlke, E.; Le, V.S.; Lengkeek, N.; Pellegrini, P.; Jackson, T.; Greguric, I.; Weiner, R. Influence of Metal ions on the Ga-68-labeling of DOTATATE. Appl. Radiat. Isot. 2013, 82, 232–238. [Google Scholar]
- Le, V.S.; Nguyen, C.D.; Bui, V.C.; Vo, C.H. Preparation of Inorganic Polymer Sorbents and Their Application in Radionuclide Generator Technology. In Therapeutic Radionuclide Generators: 90Sr/90Y and 188W/188Re Generators; International Atomic Energy Agency: Vienna, Austria, 2009; Chapter 20. [Google Scholar]
- Le, V.S.; Nguyen, C.D.; Pellegrini, P.; Bui, V.C. Polymeric Titanium Oxychloride Sorbent for 188W/188Re Nuclide Pair separation. Sep. Sci. Technol. 2009, 44, 1074–1098. [Google Scholar] [CrossRef]
- Le, V.S.; Lambrecht, R.M. Development of alternative Technologies for a gel-type chromatographic 99mTc Generator. J. Label. Compd. Radiopharm. 1994, 35, 270–272. [Google Scholar]
- Le, V.S. Preparation of chromatographic and solid-solvent extraction 99mTc generator using gel-type targets. In Proceedings of the 1999 Workshop on the Utilization of Research Reactors, Tokai & Mito, Japan, 25 November–2 December 1999.
- Longworth, G. Radiochemical Manual, 1st ed.; AEA Technology plc, Analytical Services Group: Harwell, Oxfordshire, UK, 1998. [Google Scholar]
- Glimore, G.; Hemingway, J.D. Practical Gamma-Ray Spectrometry, 1st ed.; John Wiley & Sons: Chichester, UK, 2004. [Google Scholar]
- Parrington, J.R.; Knox, H.D.; Breneman, S.L.; Baum, E.M.; Feiner, F. Nuclides and Isotopes, 15th ed.; Lockheed Martin, GE Nuclear Energy: San Jose, CA, USA, 1996. [Google Scholar]
- Firestone, R.B. Table of Isotopes, 8th ed.; Wiley-Interscience: New York, NY, USA, 1996. [Google Scholar]
- European Association of Nuclar Medicine EANM-Monograph 2464. Gallium-Chloride (68Ga) solution for radiolabelling. Pharmeuropa 2011, 23, 507–509. [Google Scholar]
- United States Pharmacopeial Convention. US Pharmacopeia 32 & National Formulary 27; United States Pharmacopeial Convention: Rockvile, MD, USA, 2009. [Google Scholar]
- Sample Availability: Not available.
© 2014 by the authors. licensee MDPI, Basel, Switzerland. This article is an open access article distributed under the terms and conditions of the Creative Commons Attribution license ( http://creativecommons.org/licenses/by/3.0/).
Share and Cite
Le, V.S.; Do, Z.P.-H.; Le, M.K.; Le, V.; Le, N.N.-T. Methods of Increasing the Performance of Radionuclide Generators Used in Nuclear Medicine: Daughter Nuclide Build-Up Optimisation, Elution-Purification-Concentration Integration, and Effective Control of Radionuclidic Purity. Molecules 2014, 19, 7714-7756. https://doi.org/10.3390/molecules19067714
Le VS, Do ZP-H, Le MK, Le V, Le NN-T. Methods of Increasing the Performance of Radionuclide Generators Used in Nuclear Medicine: Daughter Nuclide Build-Up Optimisation, Elution-Purification-Concentration Integration, and Effective Control of Radionuclidic Purity. Molecules. 2014; 19(6):7714-7756. https://doi.org/10.3390/molecules19067714
Chicago/Turabian StyleLe, Van So, Zoe Phuc-Hien Do, Minh Khoi Le, Vicki Le, and Natalie Nha-Truc Le. 2014. "Methods of Increasing the Performance of Radionuclide Generators Used in Nuclear Medicine: Daughter Nuclide Build-Up Optimisation, Elution-Purification-Concentration Integration, and Effective Control of Radionuclidic Purity" Molecules 19, no. 6: 7714-7756. https://doi.org/10.3390/molecules19067714