One New and Nine Known Flavonoids from Choerospondias axillaries and Their in Vitro Antitumor, Anti-Hypoxia and Antibacterial Activities

Abstract
:
1. Introduction
2. Results and Discussion
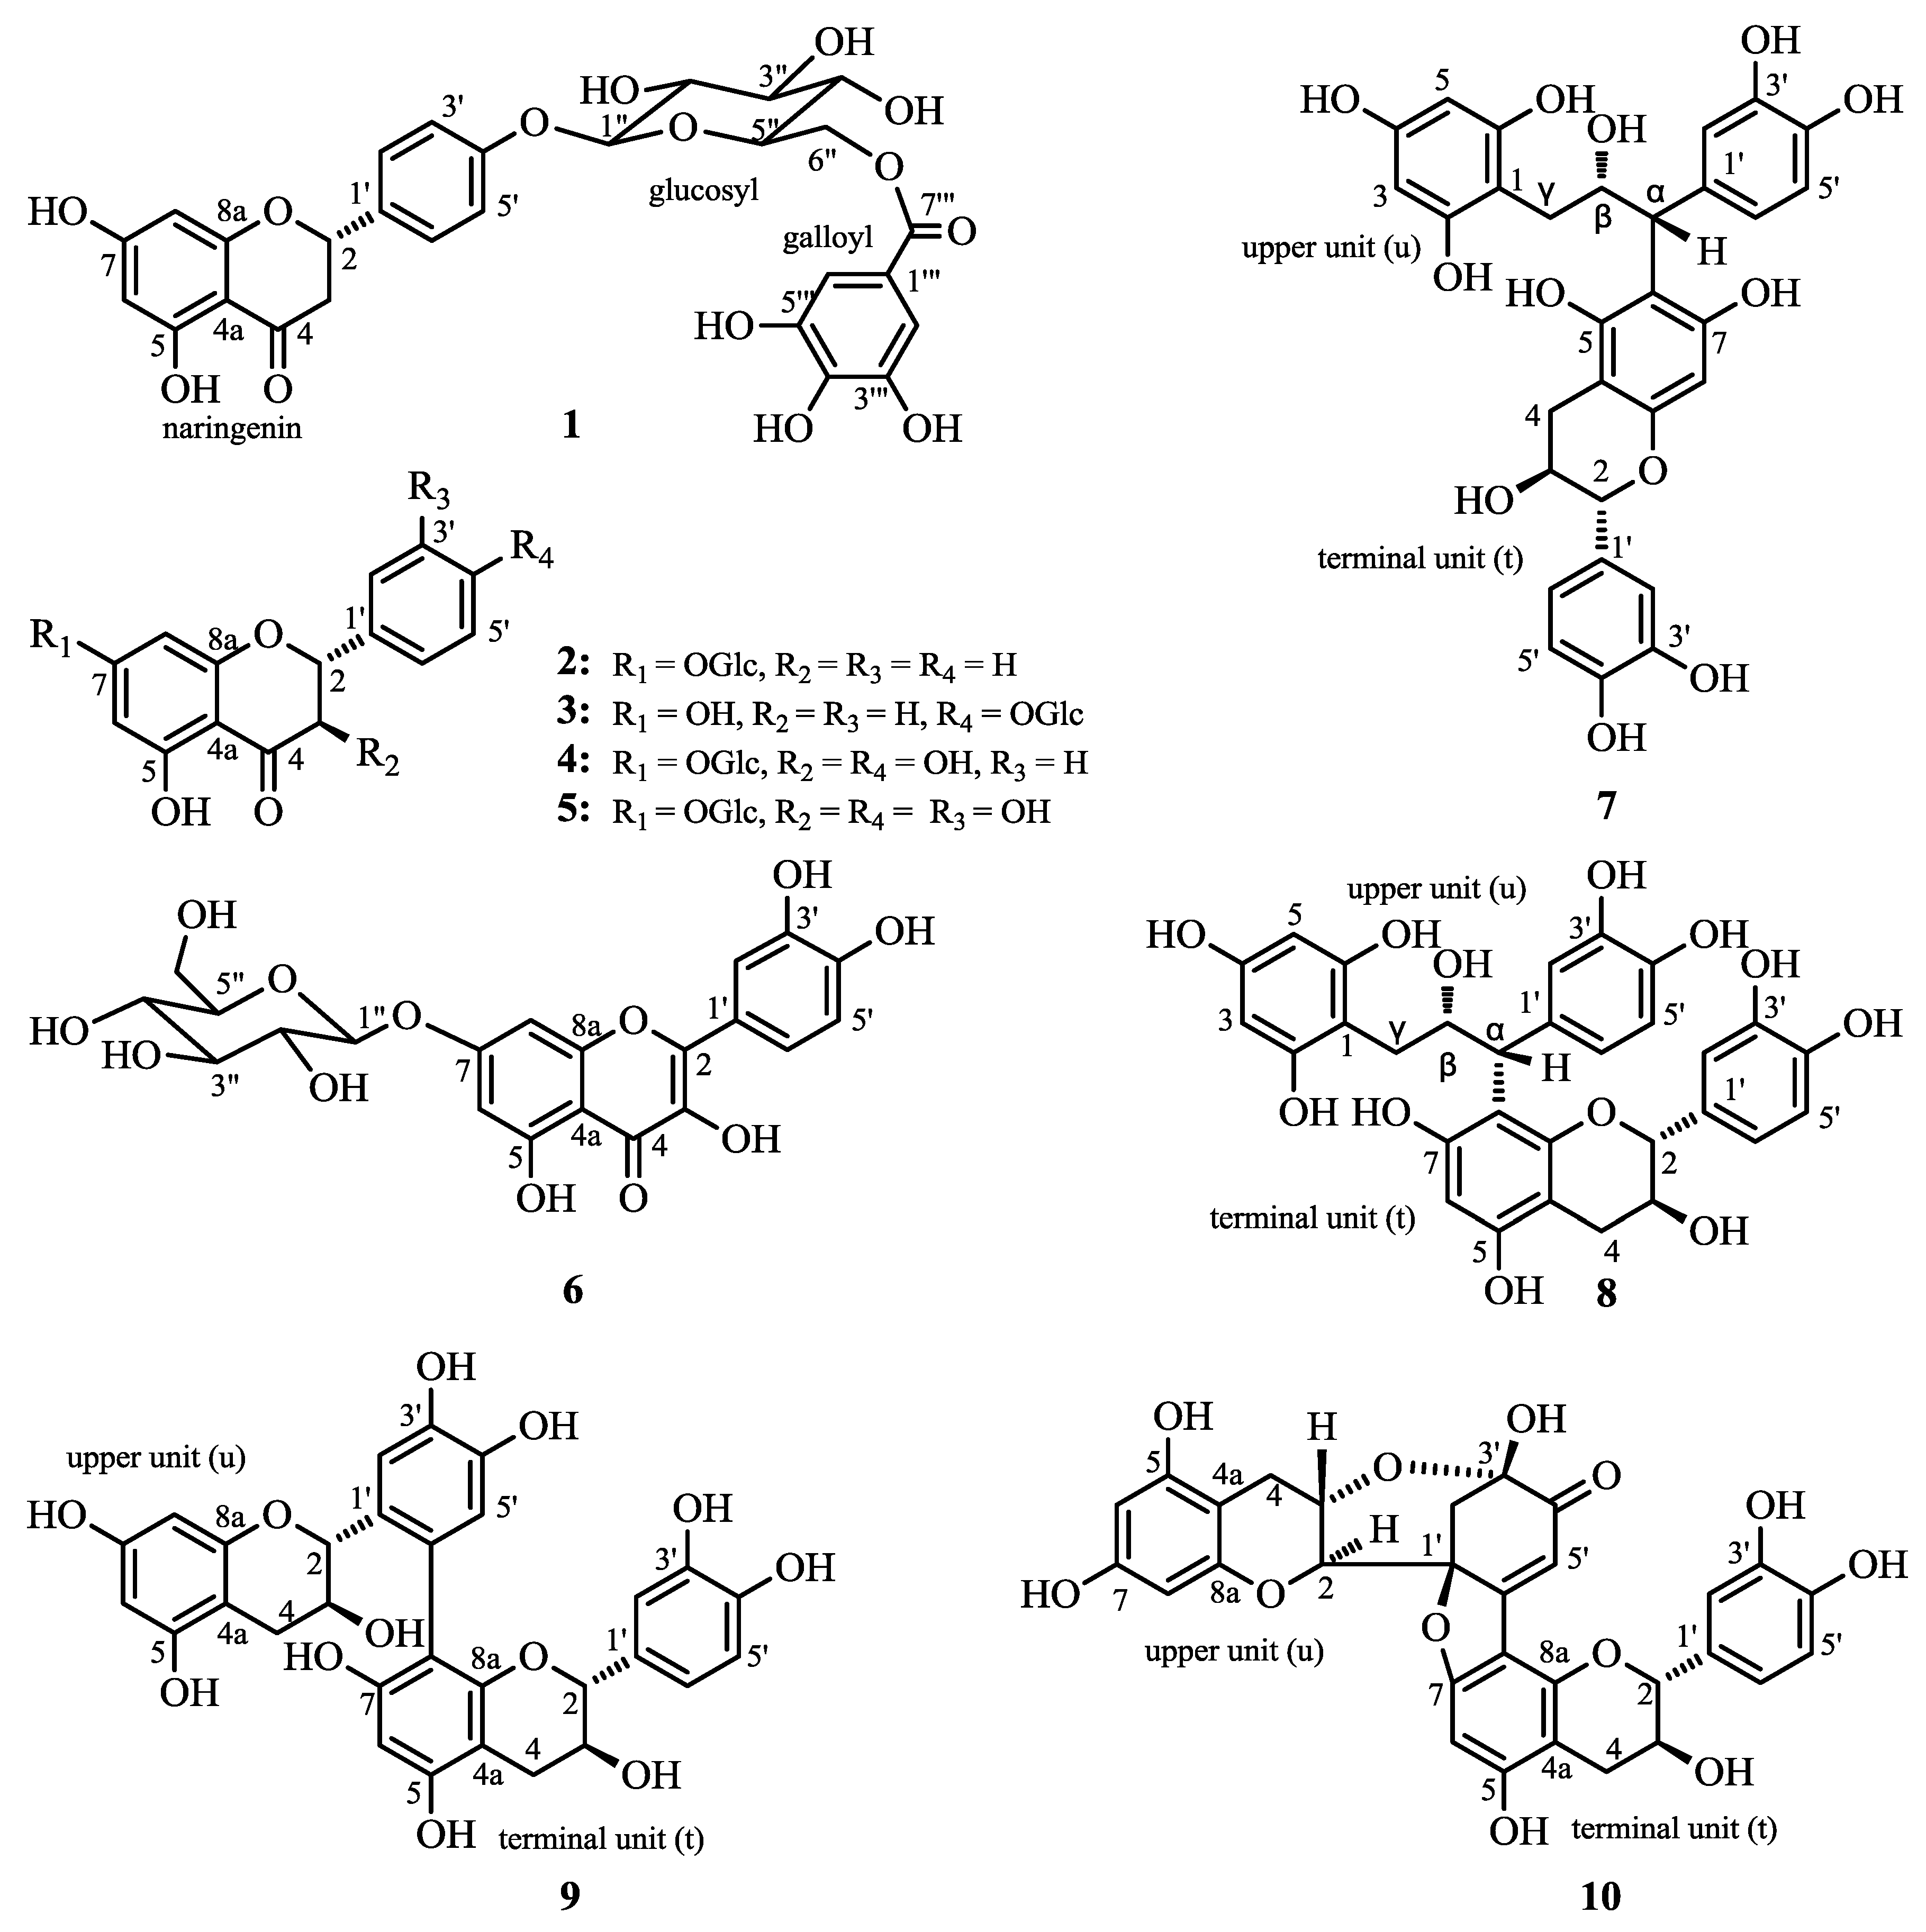
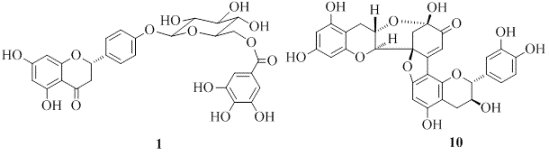
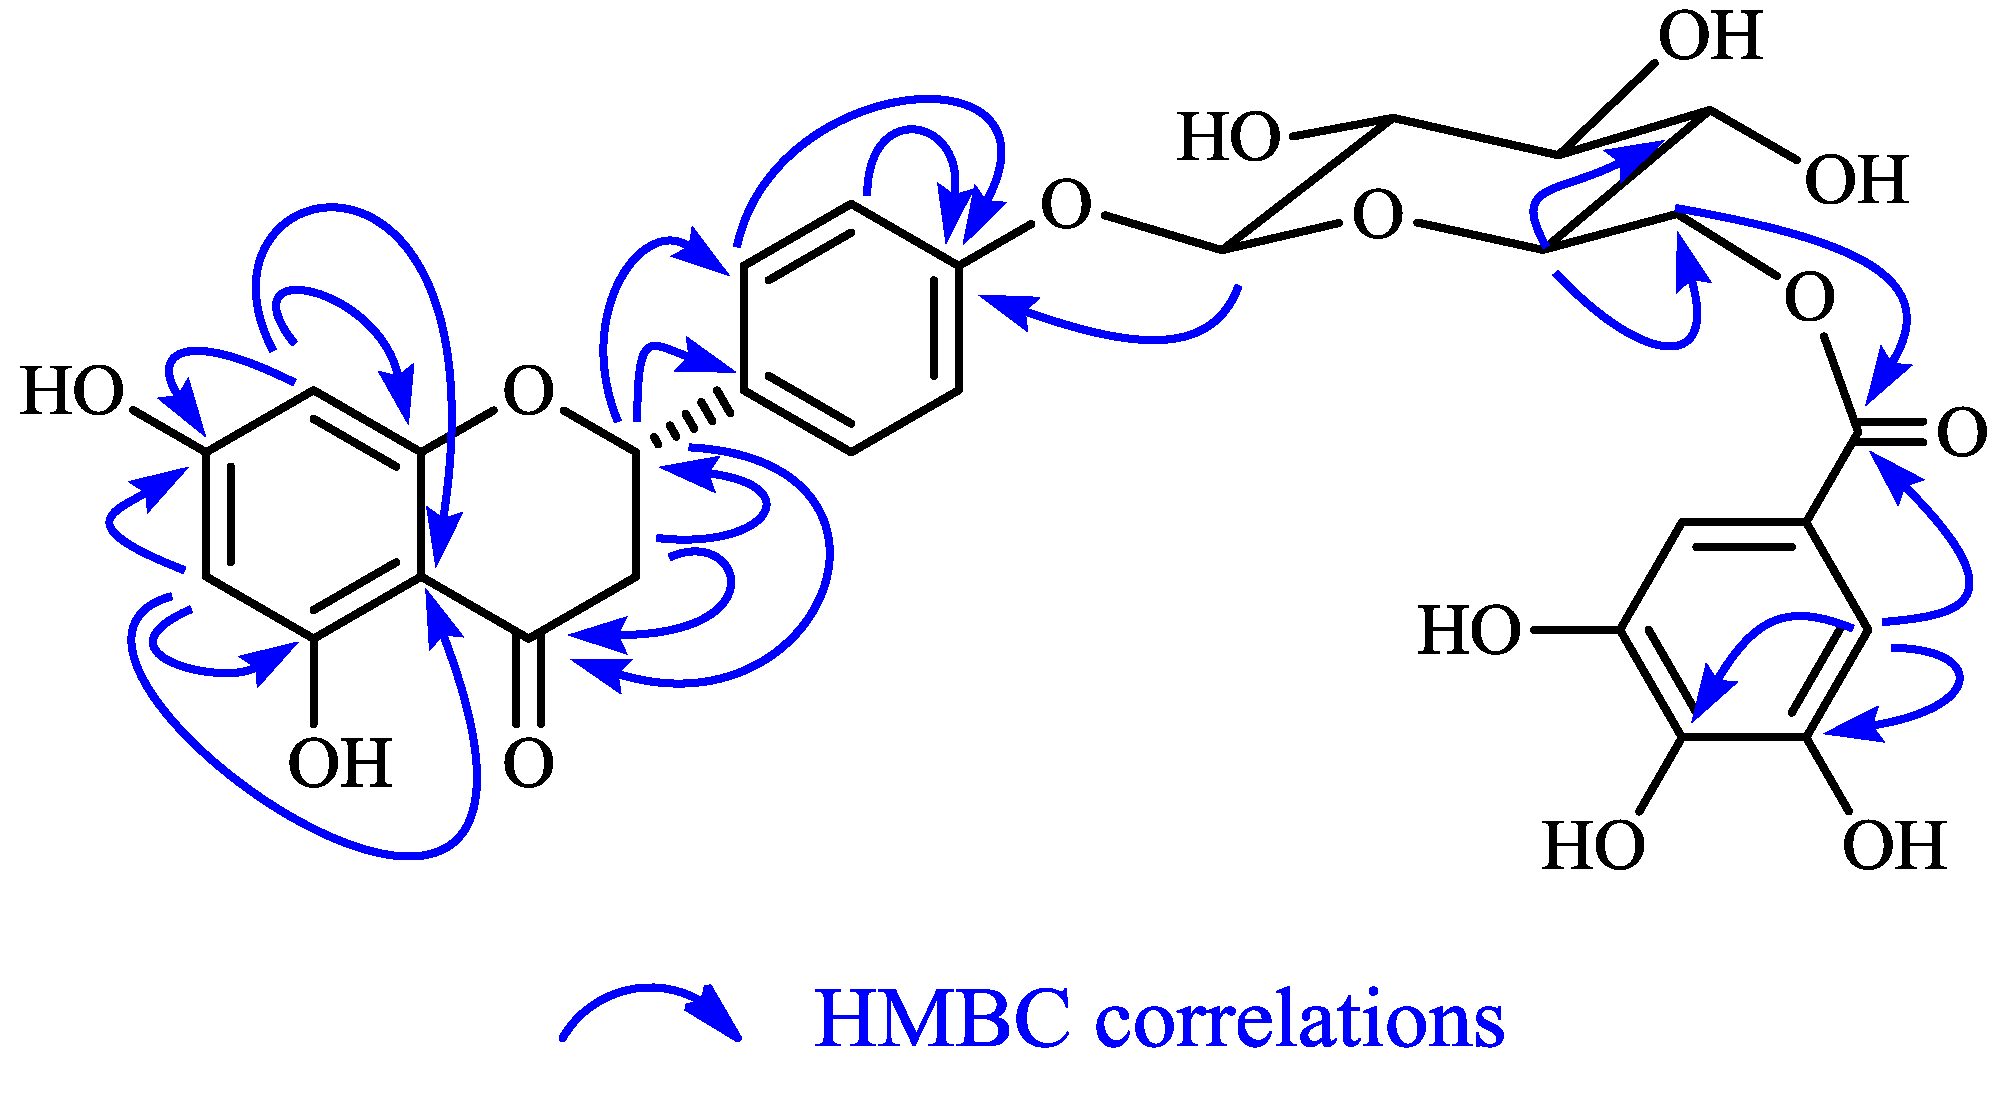
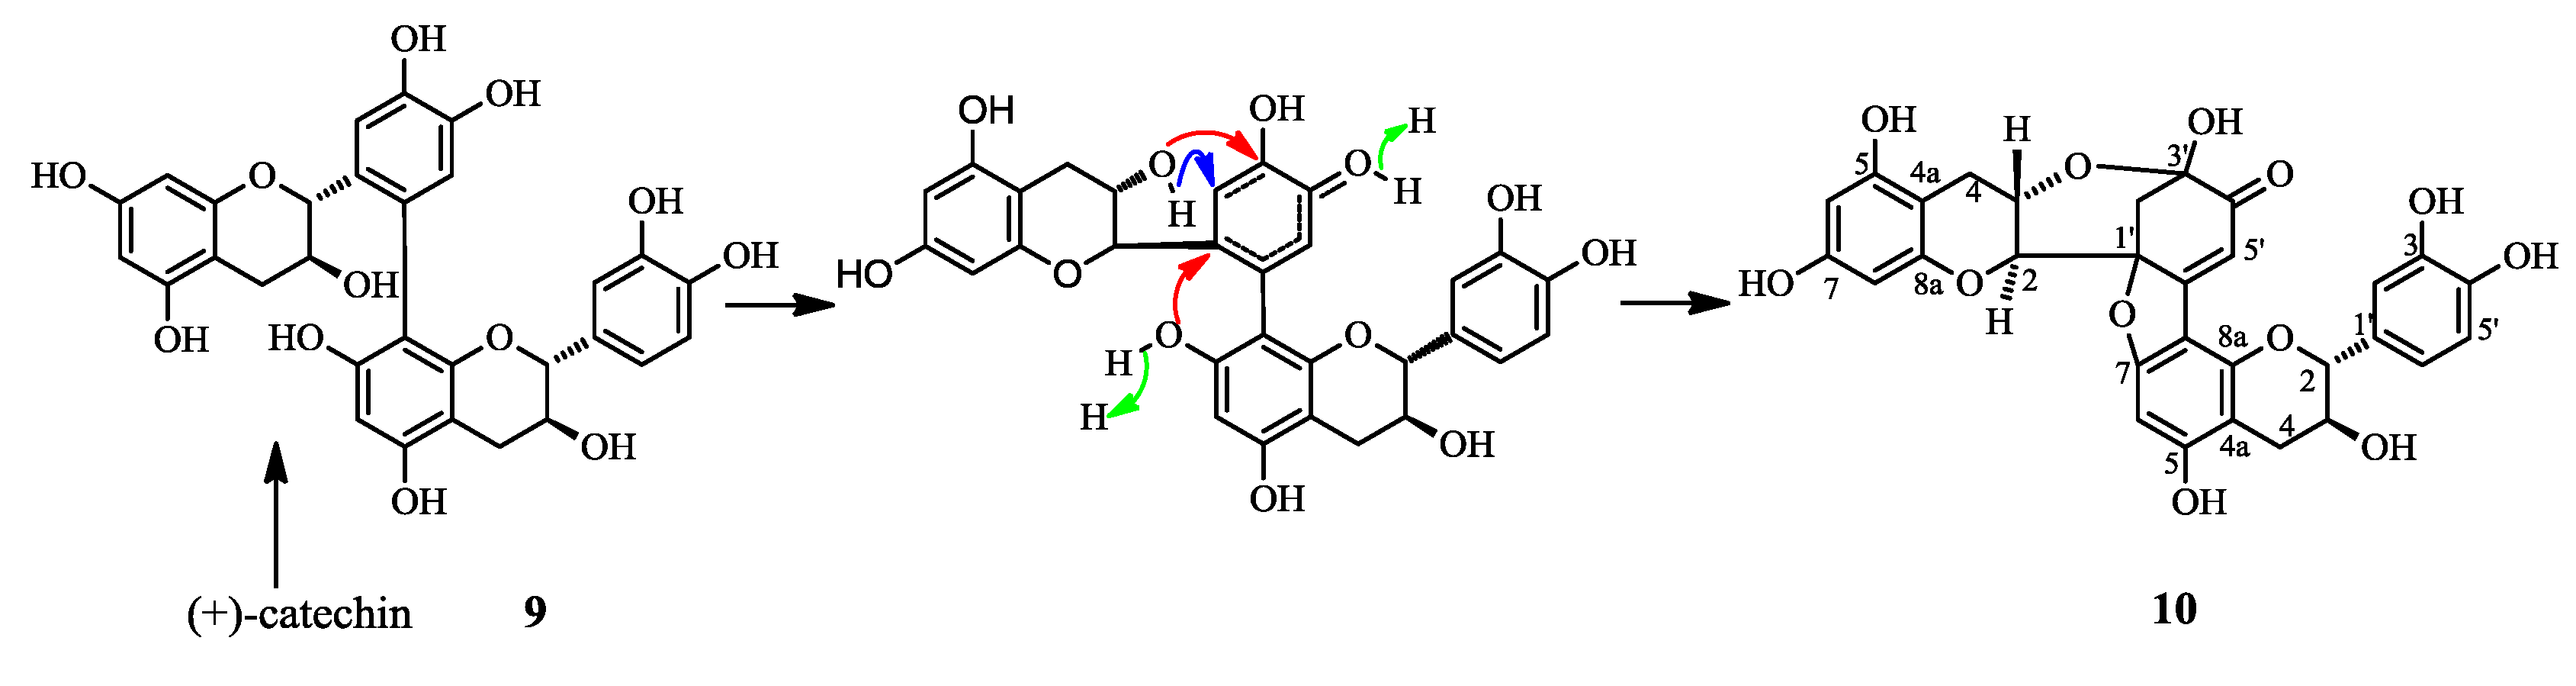
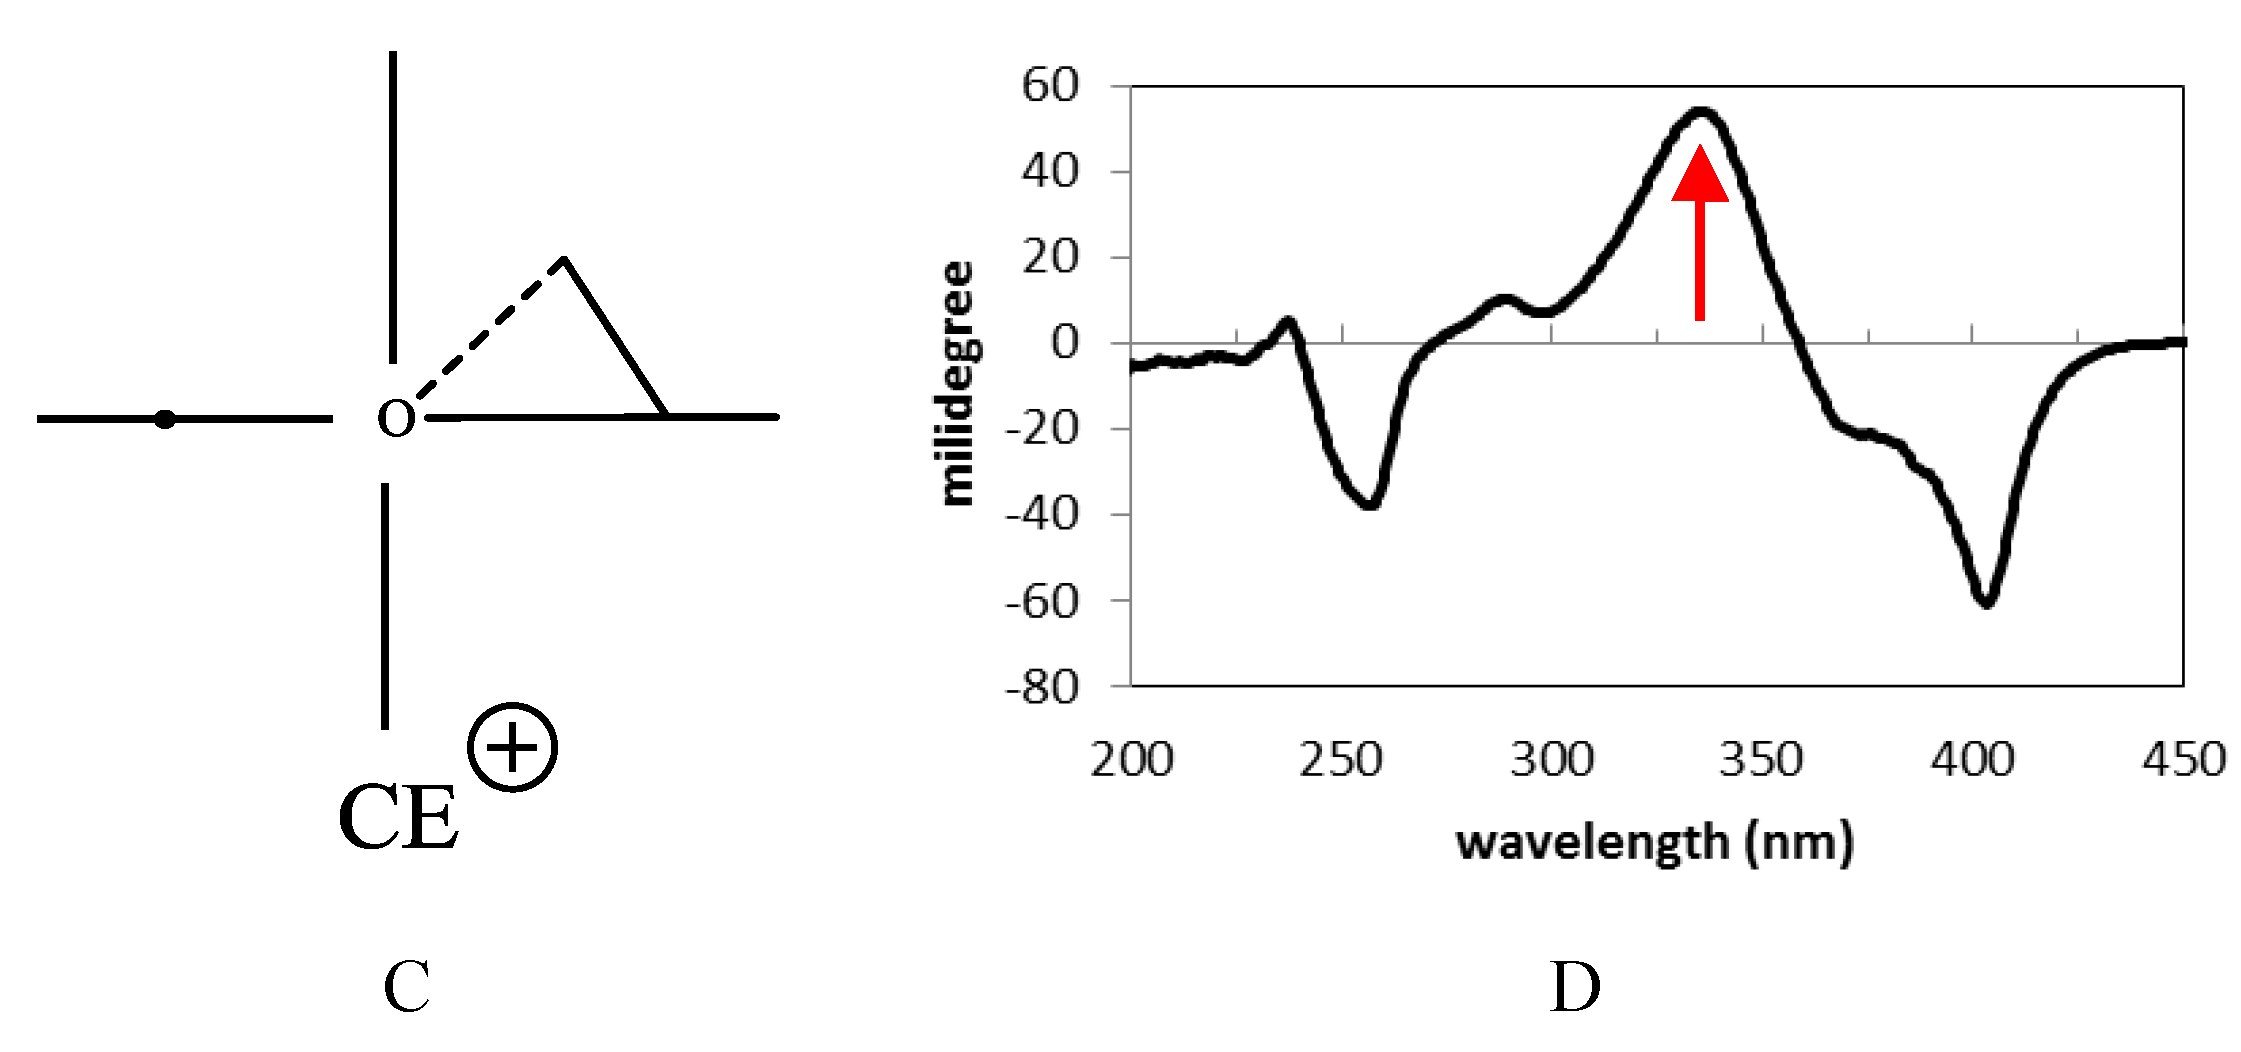
2.1. Structure Elucidation of 1 and Identification of 2–10


| Position | 1 ( in CD3OD) | 3 ( in DMSO- d6) | ||
|---|---|---|---|---|
| δH | δC | δH | δC | |
| narigenin | ||||
| 2 | 5.31 (1H, dd, J = 12.8, 2.8 Hz) | 79.7 | 5.53 (1H, dd, J = 12.4, 3.0 Hz) | 78.6 |
| 3 | 3.07 (1H, dd, J = 16.8, 12.8 Hz)2.66 (1H, dd, J = 16.8, 2.8 Hz) | 43.3 | Overlapped 2.74 (1H, dd, J = 17.2, 3.0 Hz) | 42.5 |
| 4 | 197.3 | 196.7 | ||
| 4a | 102.9 | 102.3 | ||
| 5 | 164.9 | 163.3 | ||
| 6 | 5.90 (1H, d, J = 2.0 Hz) | 96.6 | 5.90 (1H, d, J = 2.4 Hz) | 96.4 |
| 7 | 167.6 | 167.2 | ||
| 8 | 5.88 (1H, d, J = 2.0 Hz) | 95.8 | 5.89 (1H, d, J = 2.4 Hz) | 95.5 |
| 8a | 164.3 | 164.0 | ||
| 1′ | 133.5 | 132.4 | ||
| 2′ | 7.29 (1H, d, J = 8.4 Hz) | 128.4 | 7.44 (2H, d, J = 8.6 Hz) | 128.6 |
| 3′ | 7.06 (1H, d, J = 8.4 Hz) | 117.1 | 7.07 (2H, d, J = 8.6 Hz) | 116.7 |
| 4′ | 158.5 | 158.1 | ||
| 5′ | 7.06 (1H, d, J = 8.4 Hz) | 117.1 | 7.07 (2H, d, J = 8.6 Hz) | 116.7 |
| 6′ | 7.29 (1H, d, J = 8.4 Hz) | 128.4 | 7.44 (2H, d, J = 8.6 Hz) | 128.6 |
| 5-OH | 12.13 (1H, s) | |||
| 7-OH | 10.82 (1H, s) | |||
| glucosyl | ||||
| 1″ | 4.91 (1H, d, J = 7.6 Hz) | 101.5 | 4.89 (1H, d, J = 7.6 Hz) | 100.8 |
| 2″ | 3.49–3.54 (1H, m) | 74.3 | 3.13–3.49 (1H, m) | 73.7 |
| 3″ | 3.49–3.54 (1H, m) | 77.5 | 3.13–3.49 (1H, m) | 77.6 |
| 4″ | 3.42 (1H, m) | 71.5 | 3.13–3.49 (1H, m) | 70.2 |
| 5″ | 3.78 (1H, m) | 75.1 | 3.13–3.49 (1H, m) | 77.1 |
| 6″ | 4.38 (1H, dd, J = 12.0, 8.4 Hz)4.61 (1H, dd, J = 12.0, 2.0 Hz) | 64.4 | 3.13–3.49 (1H, m) 3.70 (1H, dd, J = 10.6, 4.0 Hz) | 61.2 |
| galloyl | ||||
| 1‴ | 120.8 | |||
| 2‴ | 7.10 (1H, s) | 109.8 | ||
| 3‴ | 146.0 | |||
| 4‴ | 139.4 | |||
| 5‴ | 146.0 | |||
| 6‴ | 7.10 (1H, s) | 109.8 | ||
| 7‴ (C=O) | 167.9 | |||

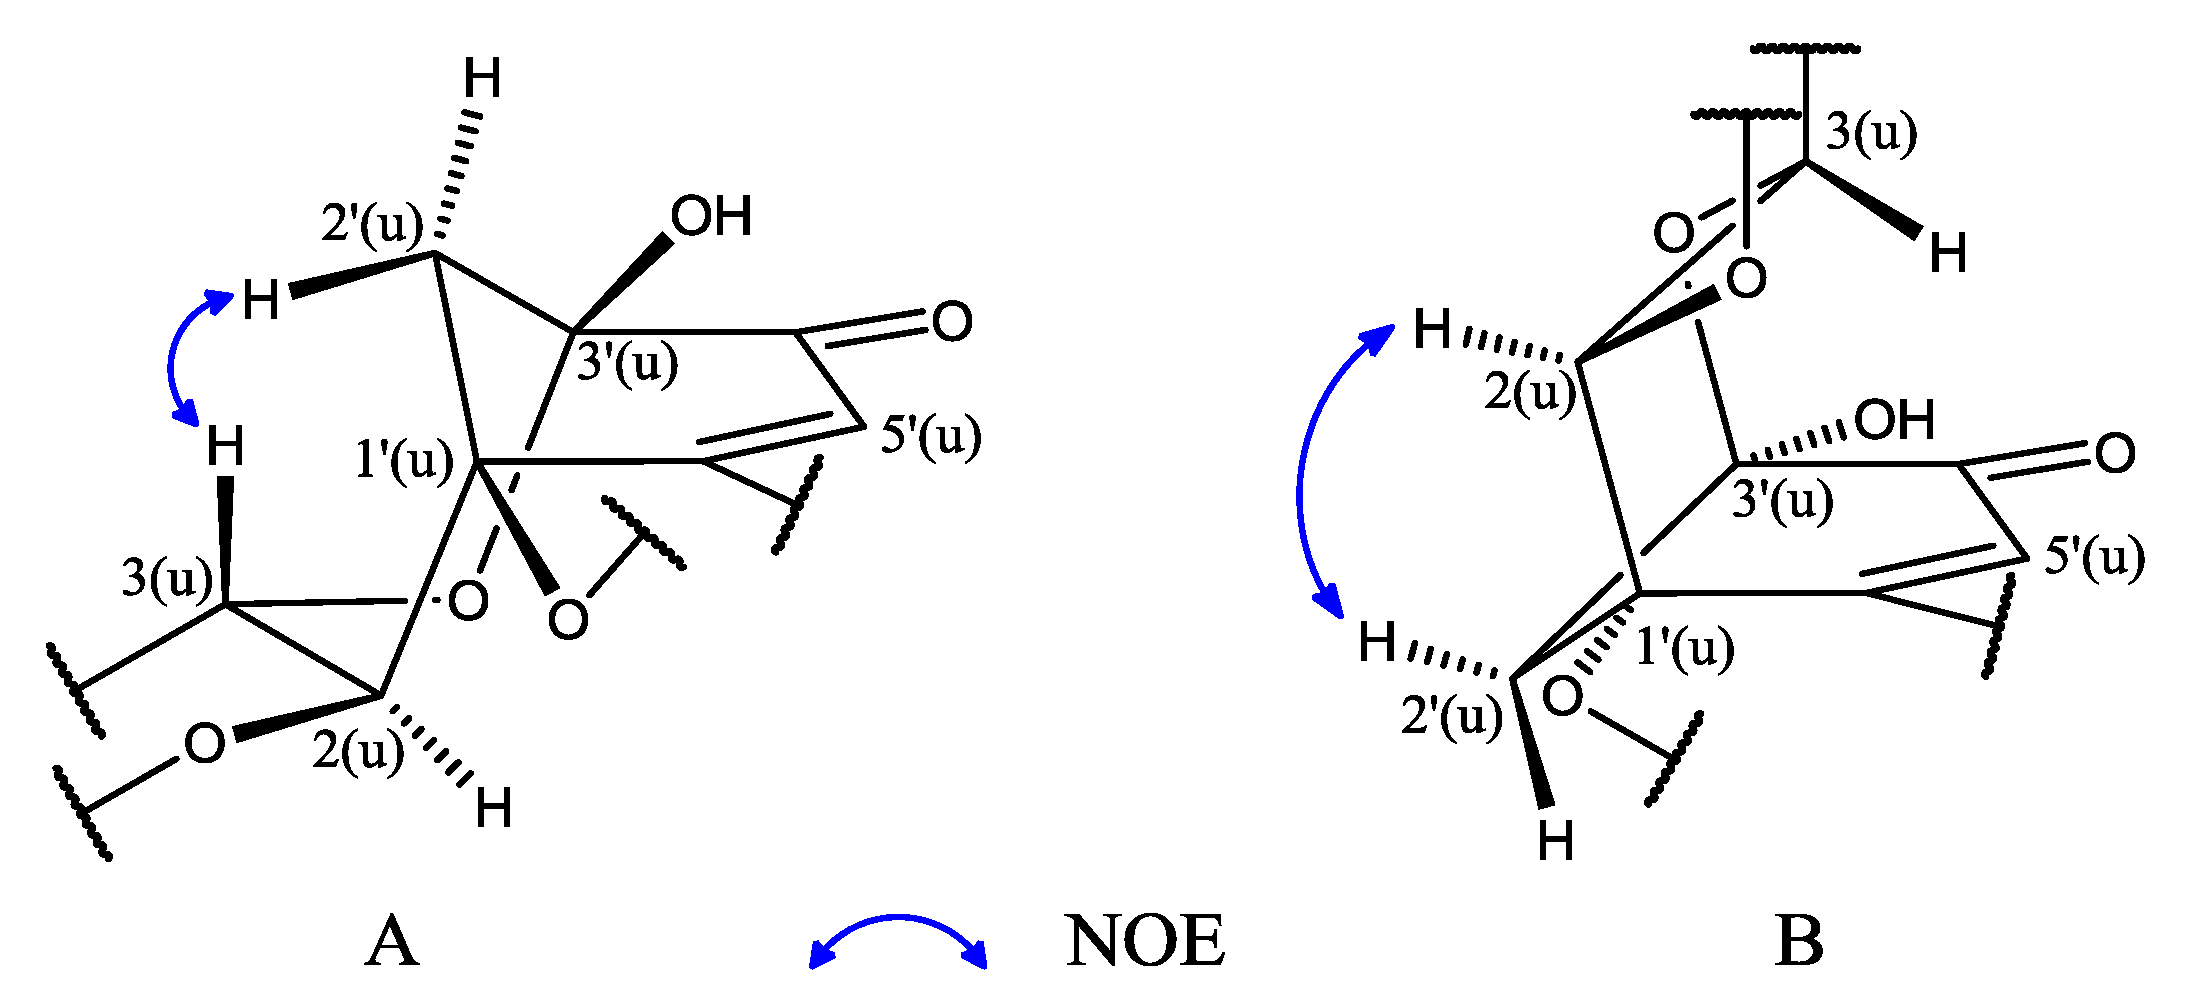
| Position | δH | 1H-1H COSY | δC | HMBC (H→C) | NOESY | ||
|---|---|---|---|---|---|---|---|
| 2(u) | 3.96 (1H, m) | 78.1 | C-3(u), 4(u), 6′(u) | 4(u)-Hb | |||
| 3(u) | 3.96 (1H, m) | 4(u)-H | 65.5 | C-2(u), 4(u), 1′(u) | 4(u)-Ha, 2′(u)-Ha | ||
| 4(u) | Ha:2.52 (1H, dd,
J = 9.0,14.4 Hz) Hb:2.92 (1H, dd, J = 5.8,14.4 Hz) | 3(u)-H 3(u)-H | 27.0 | C-2(u), 3(u), 4a(u), 5(u) | 3(u), 4(u)-Hb 2(u), 4(u)-Ha | ||
| 4a(u) | 99.1 | ||||||
| 5(u) | 155.0 c | ||||||
| 6(u) | 5.52 (1H, d, J = 2.6 Hz) b | 8(u) | 94.4 d | C-4a(u), 5(u),7(u), 8(u) | |||
| 7(u) | 156.4 c | ||||||
| 8(u) | 5.89 (1H, d, J = 2.6 Hz) b | 6(u) | 95.7 d | C-4a(u), 6(u), 7(u), 8a(u) | |||
| 8a(u) | 156.7 c | ||||||
| 1′(u) | 88.5 | ||||||
| 2′(u) | Ha:2.67 (1H, d,
J = 11.6 Hz) Hb:2.48 (1H, d, J = 11.6 Hz) | 44.3 | C-2(u),1′(u),3′(u),6′(u) | 3(u), 2′(u)-Hb 2′(u)-Ha | |||
| 3′(u) | 94.0 | ||||||
| 4′(u) | 192.8 | ||||||
| 5′(u) | 6.41 (1H, s) | 111.5 | C-2′(u),1′(u),3′(u),6′(u) | ||||
| 6′(u) | 162.8 | ||||||
| 2(t) | 4.92 (1H, d, J = 7.5Hz) | 3(t)-H | 82.1 | C-3(t), 4(t), 1′(t), 2′(t),6′(t),8a(t) | 4(t)-Ha | ||
| 3(t) | 4.11 (1H, td, J = 7.5,5.2 Hz) | 2(t)-H, 4(t)-H | 66.5 | C-4a(t) | 4(t)-Hb | ||
| 4(t) | Ha:2.59 (1H, dd, J = 7.5,16.4 Hz) Hb:2.85 (1H, dd, J = 5.2,16.4 Hz) | 3(t)-H 3(t)-H | 26.5 | C-2(t), 3(t), 4a(t), 5(t), 8a(t) | 2(t), 4(t)-Hb 3(t), 4(t)-Ha | ||
| 4a(t) | 102.6 | ||||||
| 5(t) | 164.9 | ||||||
| 6(t) | 6.11 (1H, s) | 89.6 | C-5(t), 8(t) | ||||
| 7(t) | 166.7 | ||||||
| 8(t) | 104.3 | ||||||
| 8a(t) | 153.8 | ||||||
| 1′(t) | 129.9 | ||||||
| 2′(t) | 6.84 (1H, d, J = 2.2 Hz) | 5′(t) | 113.5 | C-2(t), 4′(t), 6′(t) | 2(t), 3(t) | ||
| 3′(t) | 145.0 e | ||||||
| 4′(t) | 145.2 e | ||||||
| 5′(t) | 6.78 (1H, d, J = 8.0 Hz) | 2′(t), 6′(t) | 115.0 | C-1′(t), 3′(t) | |||
| 6′(t) | 6.73 (1H, dd, J =2.2,8.0 Hz) | 5′(t) | 118.4 | C-2(t), 2′(t), 4′(t) | 2(t), 3(t) | ||


2.2. Biological Activities of 1–10
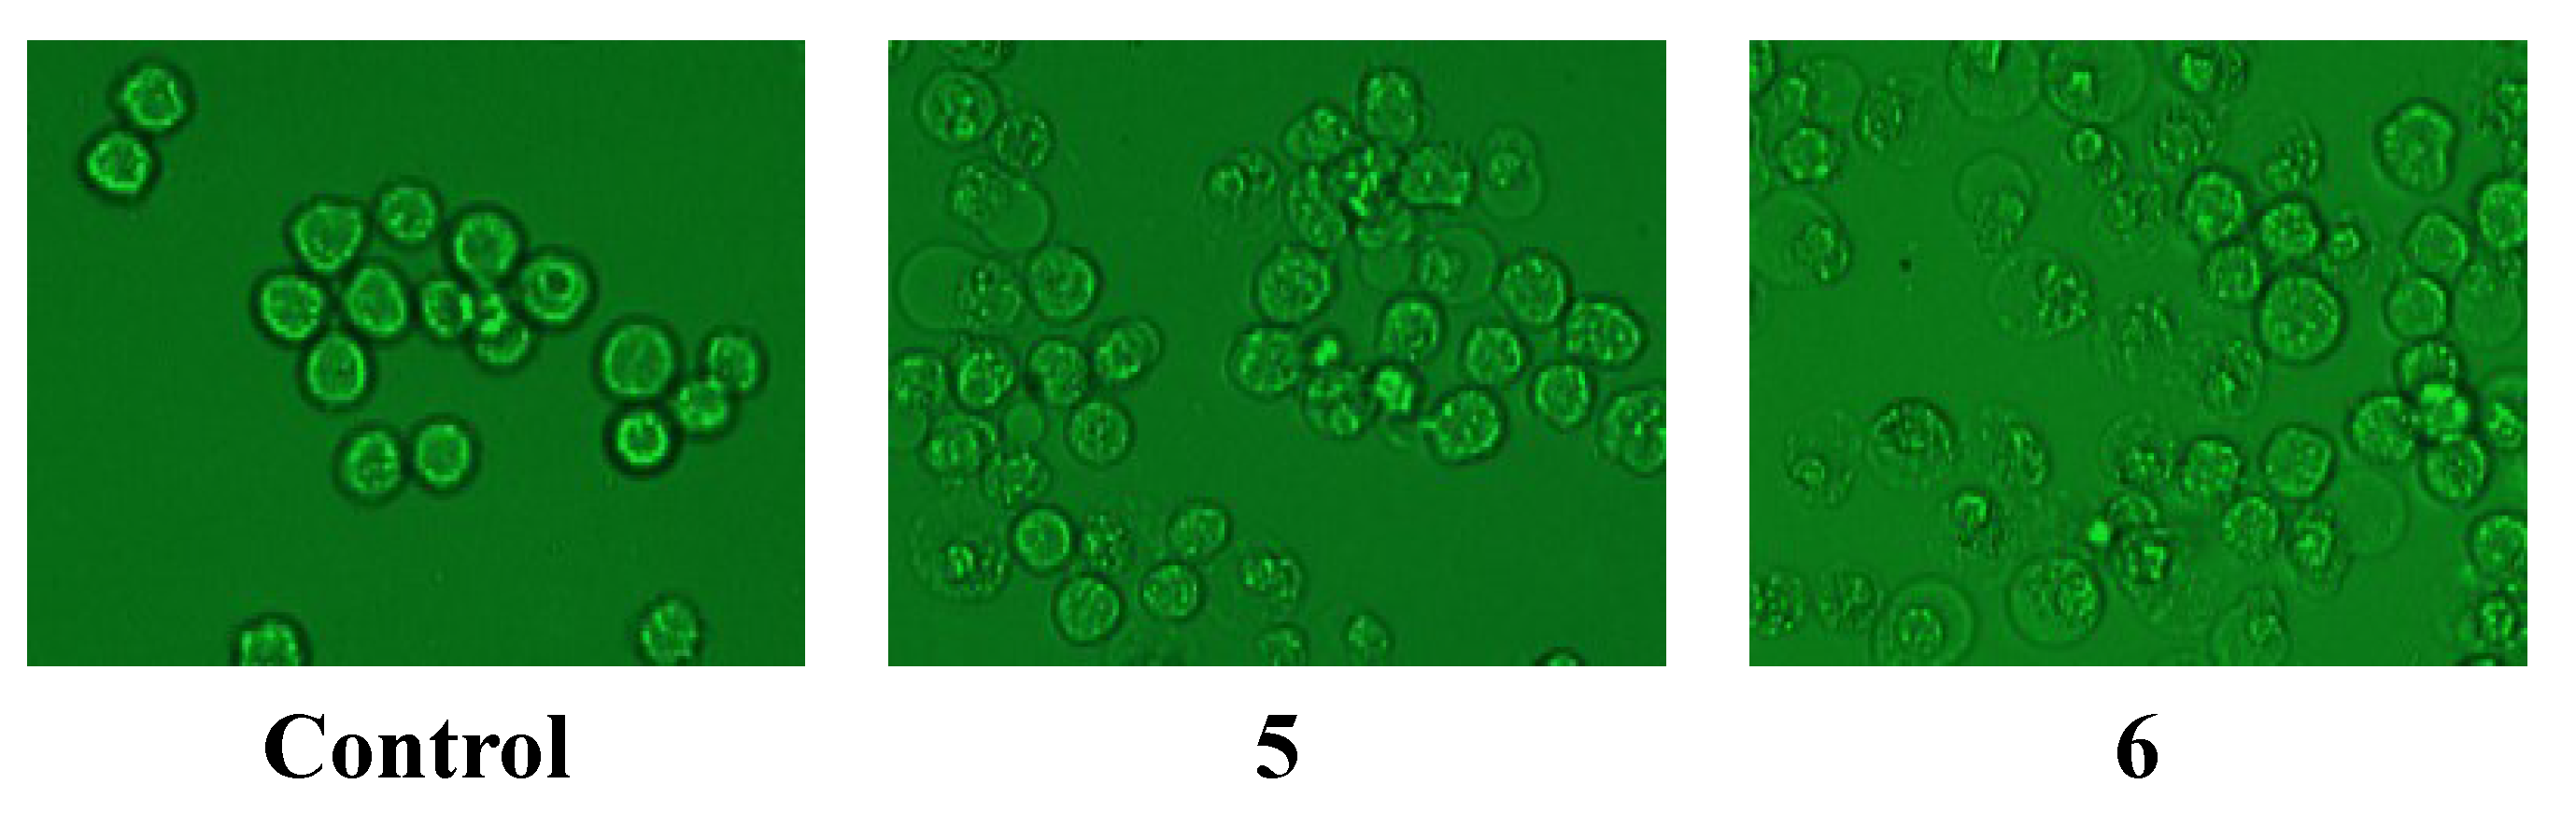
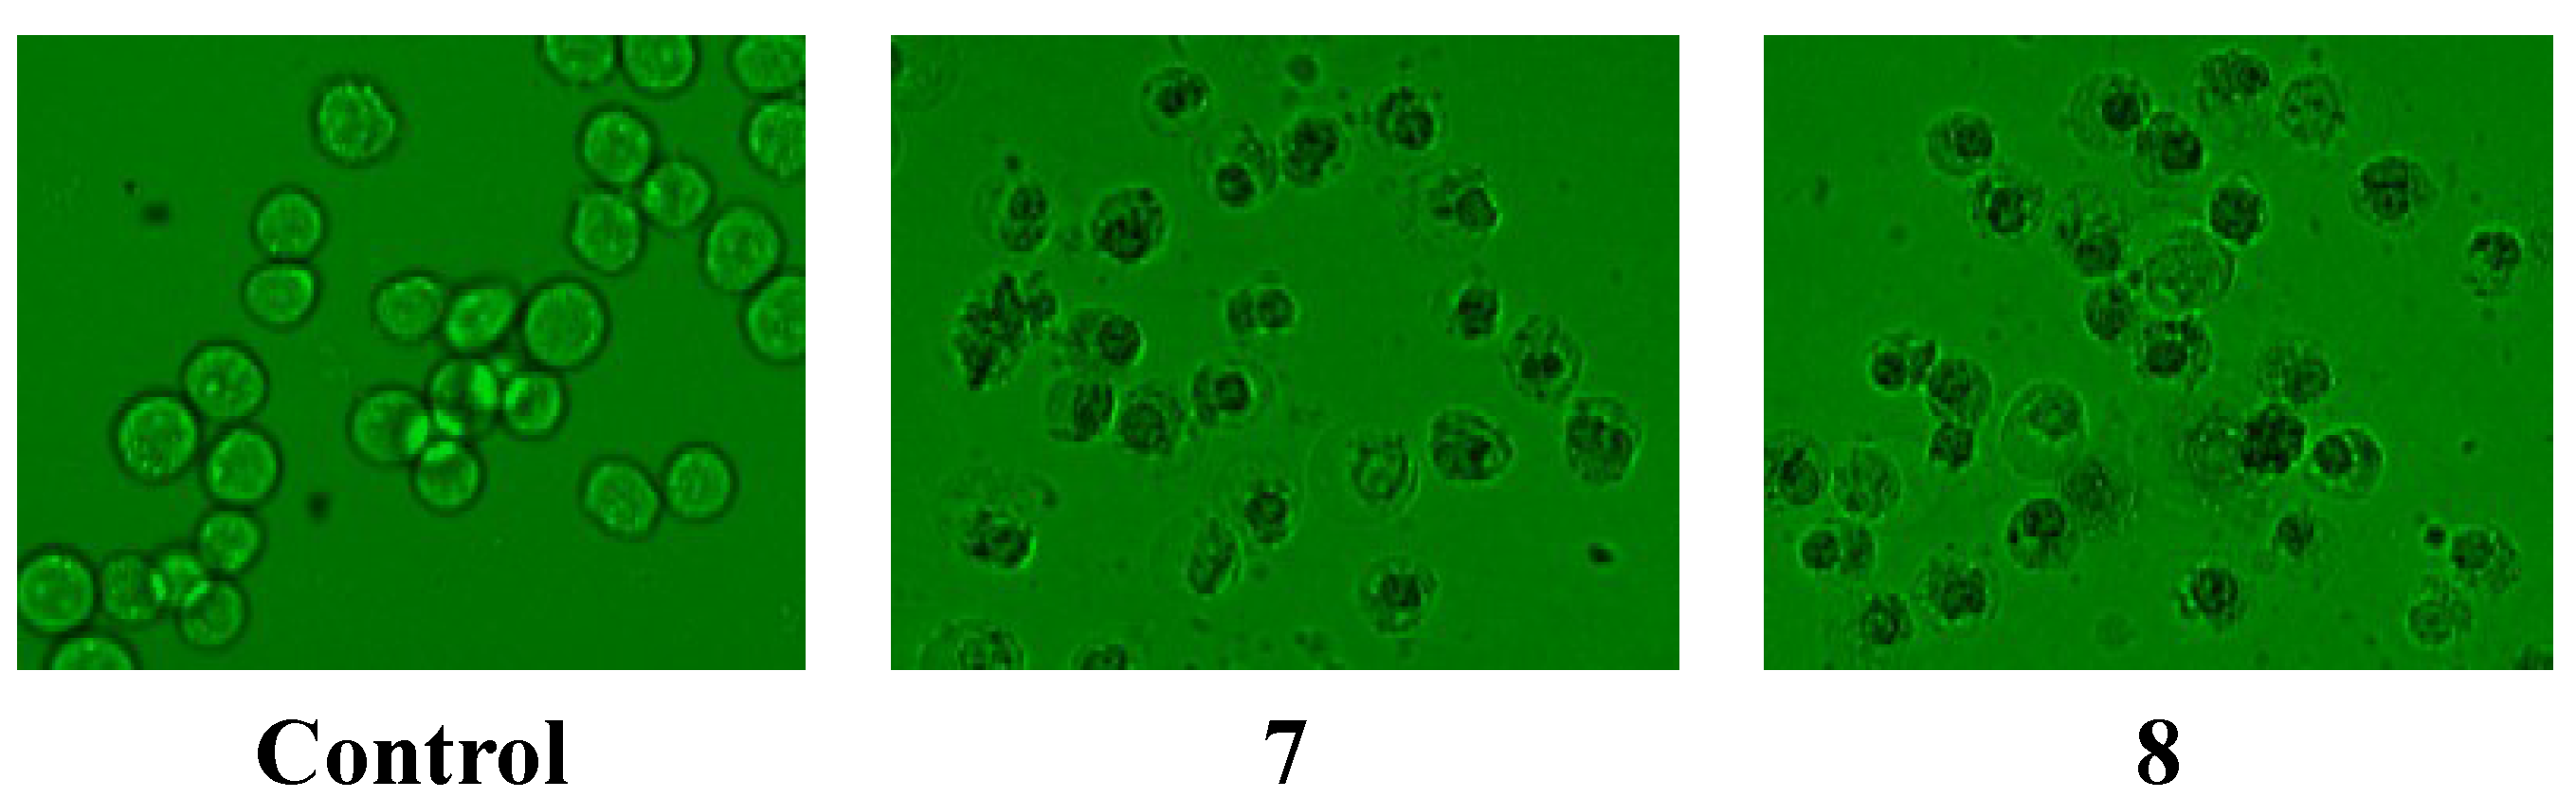
2.2.1. Antitumor Activity
2.2.2. Anti-Hypoxia Effects
| Samples | Tested Cells | Cell Viabilities (mean value ± SD%, n = 10) | |
|---|---|---|---|
| Control Group | Test Group | ||
| 1 | PC12 | 90.0 ± 6.1 | 131.4 ± 15.3 ** |
| 2 | ECV304 | 22.6 ± 0.1 | 17.1 ± 1.2 |
| 3 | ECV304 | 22.6 ± 0.1 | 27.8 ± 1.5 |
| 4 | ECV304 | 36.1 ± 1.7 | 46.4 ± 1.0 * |
| 5 | ECV304 | 36.1 ± 1.7 | 51.9 ± 0.9 *** |
| 6 | PC12 | 82.8 ± 5.3 | 108.1 ± 6.5 ** |
| 7 | PC12 | 85.9 ± 4.0 | 174.0 ± 8.7 ** |
| 8 | PC12 | 85.9 ± 4.0 | 155.6 ± 14.4 ** |
| 9 | PC12 | 90.0 ± 6.1 | 120.8 ± 9.8 ** |
| 10 | PC12 | 90.0 ± 6.1 | 122.7 ± 7.1 ** |
2.2.3. Anti-Bacterial Activity
2.3. Discussion
3. Experimental Section
3.1. General Experiment Procedures
3.2. Plant Material
3.3. Extraction and Isolation
3.4. Physicochemical Properties and Spectra Data
3.5. Bioassays
3.5.1. Cell Line and Cell Culture
3.5.2. Cell Proliferation Assay
3.5.3. Anti-Hypoxia Assay
3.5.4. Antibacterial Effect Test
4. Conclusions
Supplementary Materials
Acknowledgments
Author Contributions
Conflicts of Interest
References
- China Pharmacopoeia Committee. Pharmacopoeia of the People’s Republic of China; China Medical Science Press: Beijing, China, 2010; Volume I, p. 41. [Google Scholar]
- Li, C.-W.; Cui, C.-B.; Cai, B.; Yao, Z.-W. The research progress of Choerospondias axillaries. Pharm. J. Chin. PLA 2008, 24, 231–234. [Google Scholar]
- Li, C.-W.; Cui, C.-B.; Cai, B.; Han, B.; Dou, D.-Q.; Chen, Y.-J. Aromatic chemical constituents of Choerospondias axillaries and their in vitro antitumor activity. Chin. J. Med. Chem. 2005, 15, 138–147. [Google Scholar]
- Li, C.-W.; Cui, C.B.; Cai, B.; Han, B.; Li, M.-M.; Fan, M. Flavanoidal constituents of Choerospondias axillaries and their in vitro antitumor and anti-hypoxia activities. Chin. J. Med. Chem. 2009, 19, 48–51, 64. [Google Scholar]
- Barakat, H.H.; Souleman, A.M.; Hussein, S.A.M.; Ibrahiem, O.A.; Nawwar, M.A.M. Flavonoid galloyl glucosides from the pods of Acacia farnesiana. Phytochemistry 1999, 51, 139–142. [Google Scholar]
- Slade, D.; Ferreira, D.; Marais, J.P.J. Circular dichroism, a powerful tool for the assessment of absolute configuration of flavonoids. Phytochemistry 2005, 66, 2177–2215. [Google Scholar]
- Guyot, S.; Vercauteren, J.; Cheynier, V. Structural determination of colourless and yellow dimers resulting from (+)-catechin coupling catalysed by grape polyphenoloxidase. Phytochemistry 1996, 42, 1279–1288. [Google Scholar]
- Snatzk, G. Circular dichroism and absolute conformation: Application of qualitative MO theory to chiroptical phenomen. Angew. Chem. Int. Ed. Engl. 1979, 18, 363–377. [Google Scholar]
- Fang, S.-M.; Cui, C.-B.; Li, C.-W.; Wu, C.-J.; Zhang, Z.-J.; Li, L.; Huang, X.-J.; Ye, W.-C. Purpurogemutantin and purpurogemutantidin, new drimenyl cyclohexenone derivatives produced by a mutant obtained by diethyl sulfate mutagenesis of a marine-derived Penicillium purpurogenum G59. Mar. Drugs 2012, 10, 1266–1287. [Google Scholar]
- Dong, Y.Q.; Shi, H.; Yang, H.S.; Peng, Y.H.; Wang, M.Y.; Li, X.B. Antioxidant phenolic compounds from the stems of Entada phaseoloides. Chem. Biodivers. 2012, 9, 68–79. [Google Scholar]
- Shang, X.Y.; Li, S.; Wang, S.J.; Yang, Y.C.; Shi, J.G. Chemical constituents of Bauhinia aurea. J. Asian Nat. Prod. Res. 2012, 14, 966–972. [Google Scholar]
- Hammami, S.; Ben Jannet, H.; Bergaoui, A.; Ciavatta, L.; Cimino, G.; Mighri, Z. Isolation and structure elucidation of a flavanone, a flavanone glycoside and vomifoliol from Echiochilon Fruticosum growing in Tunisia. Molecules 2004, 9, 602–608. [Google Scholar]
- Shimoda, K.; Kubota, N.; Taniuchi, K.; Sato, D.; Nakajima, N.; Hamada, H.; Hamada, H. Biotransformation of naringin and naringenin by cultured Eucalyptus perriniana cells. Phytochemistry 2010, 71, 201–205. [Google Scholar]
- Foo, L.Y.; Karchesy, J.J. Polyphenolic glycosides from douglas fir inner bark. Phytochemistry 1989, 28, 1237–1240. [Google Scholar]
- Saito, N.; Cheng, J.; Lchimura, M.; Yokoi, M.; Abe, Y.; Honda, T. Flavonoids in the acyanic flowers of Pharbitis nil. Phytochemistry 1994, 35, 687–691. [Google Scholar]
- Taniguchi, S.; Kuroda, K.; Doi, K.; Tanabe, M.; Shibata, T.; Yoshida, T.; Hatano, T. Dimeric flavans from gambir and their structural correlations with (+)-catechin. Heterocycles 2008, 76, 1171–1180. [Google Scholar]
- Taniguchi, S.; Kuroda, K.; Doi, K.; Tanabe, M.; Shibata, T.; Yoshida, T.; Hatano, T. Revised Structures of Gambiriins A1, A2, B1, and B2, Chalcane-Flavan Dimers from Gambir (Uncaria gambir Extract). Chem. Pharm. Bull. 2007, 55, 268–272. [Google Scholar]
- Mamta, G.; Bansal, Y.K.; Sandhu, S.S. Recent patents on flavonoids. Recent Pat. Biotechnol. 2013, 7, 179–196. [Google Scholar]
- Ferreyra, M.L.F.; Rius, S.P.; Casati, P. Flavonoids: Biosynthesis, biologicalfunctions, and biotechnological applications. Front. Plant Sci. 2012, 3, 1–15. [Google Scholar]
- Zhang, Y.J.; Abe, T.; Tanaka, T.; Yang, C.R.; Kouno, I. Two new acylated flavanone glycosides from the leaves and branches of Phyllanthus emblica. Chem. Pharm. Bull. 2002, 50, 841–843. [Google Scholar]
- Liu, R.N.; Wang, W.; Ding, Y.; Xie, W.D.; Ma, C.; Du, L.J. A new flavonol glycoside and activity of compounds from the flower of Nymphaea candida. J. Asian Nat. Prod. Res. 2007, 9, 333–338. [Google Scholar]
- Kim, J.E.; Jung, M.J.; Jung, H.A.; Woo, J.J.; Cheigh, H.S.; Chung, H.Y.; Choi, J.S. A new kaempferol 7-O-triglucoside from the leaves of Brassica juncea L. Arch. Pharmacal. Res. 2002, 25, 621–624. [Google Scholar]
- Nishimura, T.; Wang, L.Y.; Kusano, K.; Kitanaka, S. Flavonoids That Mimic Human Ligands from the Whole Plants of Euphorbia lunulata. Chem. Pharm. Bull. 2005, 53, 305–308. [Google Scholar]
- Masuda, T.; Iritani, K.; Yonemori, S.; Oyama, Y.; Takeda, Y. Isolation and antioxidant activity of galloyl flavonol glycosides from the seashore plant, Pemphis acidula. Biosci. Biotechnol. Biochem. 2001, 65, 1302–1309. [Google Scholar]
- Okamura, H.; Mimura, A.; Niwano, M.; Takahara, Y.; Yasuda, H.; Yoshida, H. Two acylated flavonol glycosides from Eucalyptus rostrata. Phytochemistry 1993, 33, 512–514. [Google Scholar]
- Foo, L.Y.; Lu, Y.R.; Wong, H. Biphenyl-linked biflavanoids from grape pomace. Phytochemistry 1998, 47, 1137–1140. [Google Scholar]
- Sang, S.M.; Tian, S.Y.; Wang, H.; Stark, R.E.; Rosen, R.T.; Yang, C.S.; Ho, C.T. Chemical studies of the antioxidant mechanism of tea catechins: Radical reaction products of epicatechin with peroxyl radicals. Bioorg. Med. Chem. 2003, 11, 3371–3378. [Google Scholar]
- He, F.; Pan, Q.H.; Shi, Y.; Duan, C.Q. Biosynthesis and genetic regulation of proanthocyanidins in plants. Molecules 2008, 13, 2674–2703. [Google Scholar]
- Yan, G.Q.; Li, S.P.; Hu, J.; Zhai, X.Y.; Ma, W.; Li, N.; Wang, K.J. Phenolic constituents from the roots of Rosa laevigata (Rosaceae). Biochem. Syst. Ecol. 2014, 52, 23–26. [Google Scholar]
- Sample Availability: Samples of all the compounds are available from the authors.
© 2014 by the authors. Licensee MDPI, Basel, Switzerland. This article is an open access article distributed under the terms and conditions of the Creative Commons Attribution license ( http://creativecommons.org/licenses/by/4.0/).
Share and Cite
Li, C.-W.; Cui, C.-B. One New and Nine Known Flavonoids from Choerospondias axillaries and Their in Vitro Antitumor, Anti-Hypoxia and Antibacterial Activities. Molecules 2014, 19, 21363-21377. https://doi.org/10.3390/molecules191221363
Li C-W, Cui C-B. One New and Nine Known Flavonoids from Choerospondias axillaries and Their in Vitro Antitumor, Anti-Hypoxia and Antibacterial Activities. Molecules. 2014; 19(12):21363-21377. https://doi.org/10.3390/molecules191221363
Chicago/Turabian StyleLi, Chang-Wei, and Cheng-Bin Cui. 2014. "One New and Nine Known Flavonoids from Choerospondias axillaries and Their in Vitro Antitumor, Anti-Hypoxia and Antibacterial Activities" Molecules 19, no. 12: 21363-21377. https://doi.org/10.3390/molecules191221363