Article

Alteration of N-glycans and Expression of Their Related Glycogenes in the Epithelial-Mesenchymal Transition of HCV29 Bladder Epithelial Cells

1
The Key Laboratory of Carbohydrate Chemistry & Biotechnology, Ministry of Education, School of Biotechnology, Jiangnan University, Wuxi 214122, China
2
Wuxi Medical School, Jiangnan University, Wuxi 214122, China
*
Author to whom correspondence should be addressed.
Molecules 2014, 19(12), 20073-20090; https://doi.org/10.3390/molecules191220073
Submission received: 31 October 2014 / Revised: 23 November 2014 / Accepted: 24 November 2014 / Published: 1 December 2014
(This article belongs to the Special Issue Lectins)

Abstract

:
The epithelial-mesenchymal transition (EMT) is an essential step in the proliferation and metastasis of solid tumor cells, and glycosylation plays a crucial role in the EMT process. Certain aberrant glycans have been reported as biomarkers during bladder cancer progression, but global variation of N-glycans in this type of cancer has not been previously studied. We examined the profiles of N-glycan and glycogene expression in transforming growth factor-beta (TGFβ)-induced EMT using non-malignant bladder transitional epithelium HCV29 cells. These expression profiles were analyzed by mass spectrometry, lectin microarray analysis, and GlycoV4 oligonucleotide microarray analysis, and confirmed by lectin histochemistry and real-time RT-PCR. The expression of 5 N-glycan-related genes were notably altered in TGFβ-induced EMT. In particular, reduced expression of glycogene man2a1, which encodes α-mannosidase 2, contributed to the decreased proportions of bi-, tri- and tetra-antennary complex N-glycans, and increased expression of hybrid-type N-glycans. Decreased expression of fuca1 gene, which encodes Type 1 α-L-fucosidase, contributed to increased expression of fucosylated N-glycans in TGFβ-induced EMT. Taken together, these findings clearly demonstrate the involvement of aberrant N-glycan synthesis in EMT in these cells. Integrated glycomic techniques as described here will facilitate discovery of glycan markers and development of novel diagnostic and therapeutic approaches to bladder cancer.

1. Introduction

Glycans play important roles in protein folding, cell-cell adhesion, host-pathogen interactions, and cell signaling. The study of glycans is inherently more complicated than that of nucleic acids and proteins, due to their more complicated structures [1]. Unlike the situation for nucleic acids and proteins, there is neither practical automatic synthesis nor high throughput sequencing techniques available for glycans, despite the great efforts and advances made in the synthetic/analytical chemistry of glycans. The sequencing of glycan structures has been focused on high resolution mass spectrometry (MS), which has produced an enormous amount of information on glycomics [2,3,4], however, the currently available structural information is often partial and detailed analysis requires significant instrumentation and expertise. Lectins, a class of proteins found in plants, bacteria, fungi, and animals that are known to bind specific oligosaccharide moieties, were used for the structural elucidation of mammalian glycans on glycoproteins [5]. The applications of lectins, including affinity enrichment, microarrays, immunohistochemistry, blotting, electrophoresis, and ELISA have been developed and used widely in the last decade [6,7,8,9,10].
Many studies have demonstrated that aberrant expression of glycosyltransferases is a common phenomenon in bladder cancer; e.g., expression of GnT-V and β,1-6-branched N-linked oligo-saccharides is related to low malignant potential [11,12]; ST3 β-galactoside α-2,3-sialyltransferase 1 (St3Gal1) plays a major role in the initial oncogenic transformation [13]. Glycan profiles, including composition and expression of glycoproteins, proteoglycans, and glycosphingolipids, show distinct differences between normal and cancer cells, and certain glycans are involved in signal transduction processes related to the cancer transformation and progression [14,15,16,17,18]. No studies to date have examined the global profile of N-glycans and related glycogene expression in bladder cancer.
The process of epithelial-to-mesenchymal transition (EMT) plays an important role in the invasion and metastasis of solid cancer cells. During EMT, cells acquire malignant properties and become more migratory and invasive [19,20,21]. Aberrant expression and functional roles of glycans and glycogenes in various types of cancer cells undergoing EMT have been documented in many studies; e.g.,: expression of β3GalT4 gene and its product gangliotetraosylceramide (Gg4) is reduced in normal mouse mammary epithelial cells (NMuMG) [22]; Mgat5 gene, which encodes GnT-V and generates β1,6-GlcNAc-branched N-glycans, is required for EMT [23]; N-acetylglucosaminyltransferase-III (GnT-III) affects TGFβ-induced EMT through prolongation of E-cadherin turnover and suppression of β-catenin/pSmad complex formation [24]; O-glycosylation of oncofetal fibronectin (onfFN) plays an important role during TGFβ-induced EMT in human prostate epithelial cell lines [25].
Here, we apply glycomic analysis to profile the global variation of N-glycans and their related genes during TGFβ-induced EMT in non-malignant bladder transitional epithelium HCV29 cells, using various high-throughput techniques. Altered expression of N-glycans was analyzed using lectin microarrays and MALDI-TOF-MS. Glycogene transcription levels were analyzed using glycogene microarrays. Integrated glycomic analysis revealed that several aberrant N-glycosylations are involved in TGFβ-induced EMT of HCV29 cells. Our findings are expected to facilitate the discovery of new glycan biomarkers for bladder cancer.

2. Results and Discussion

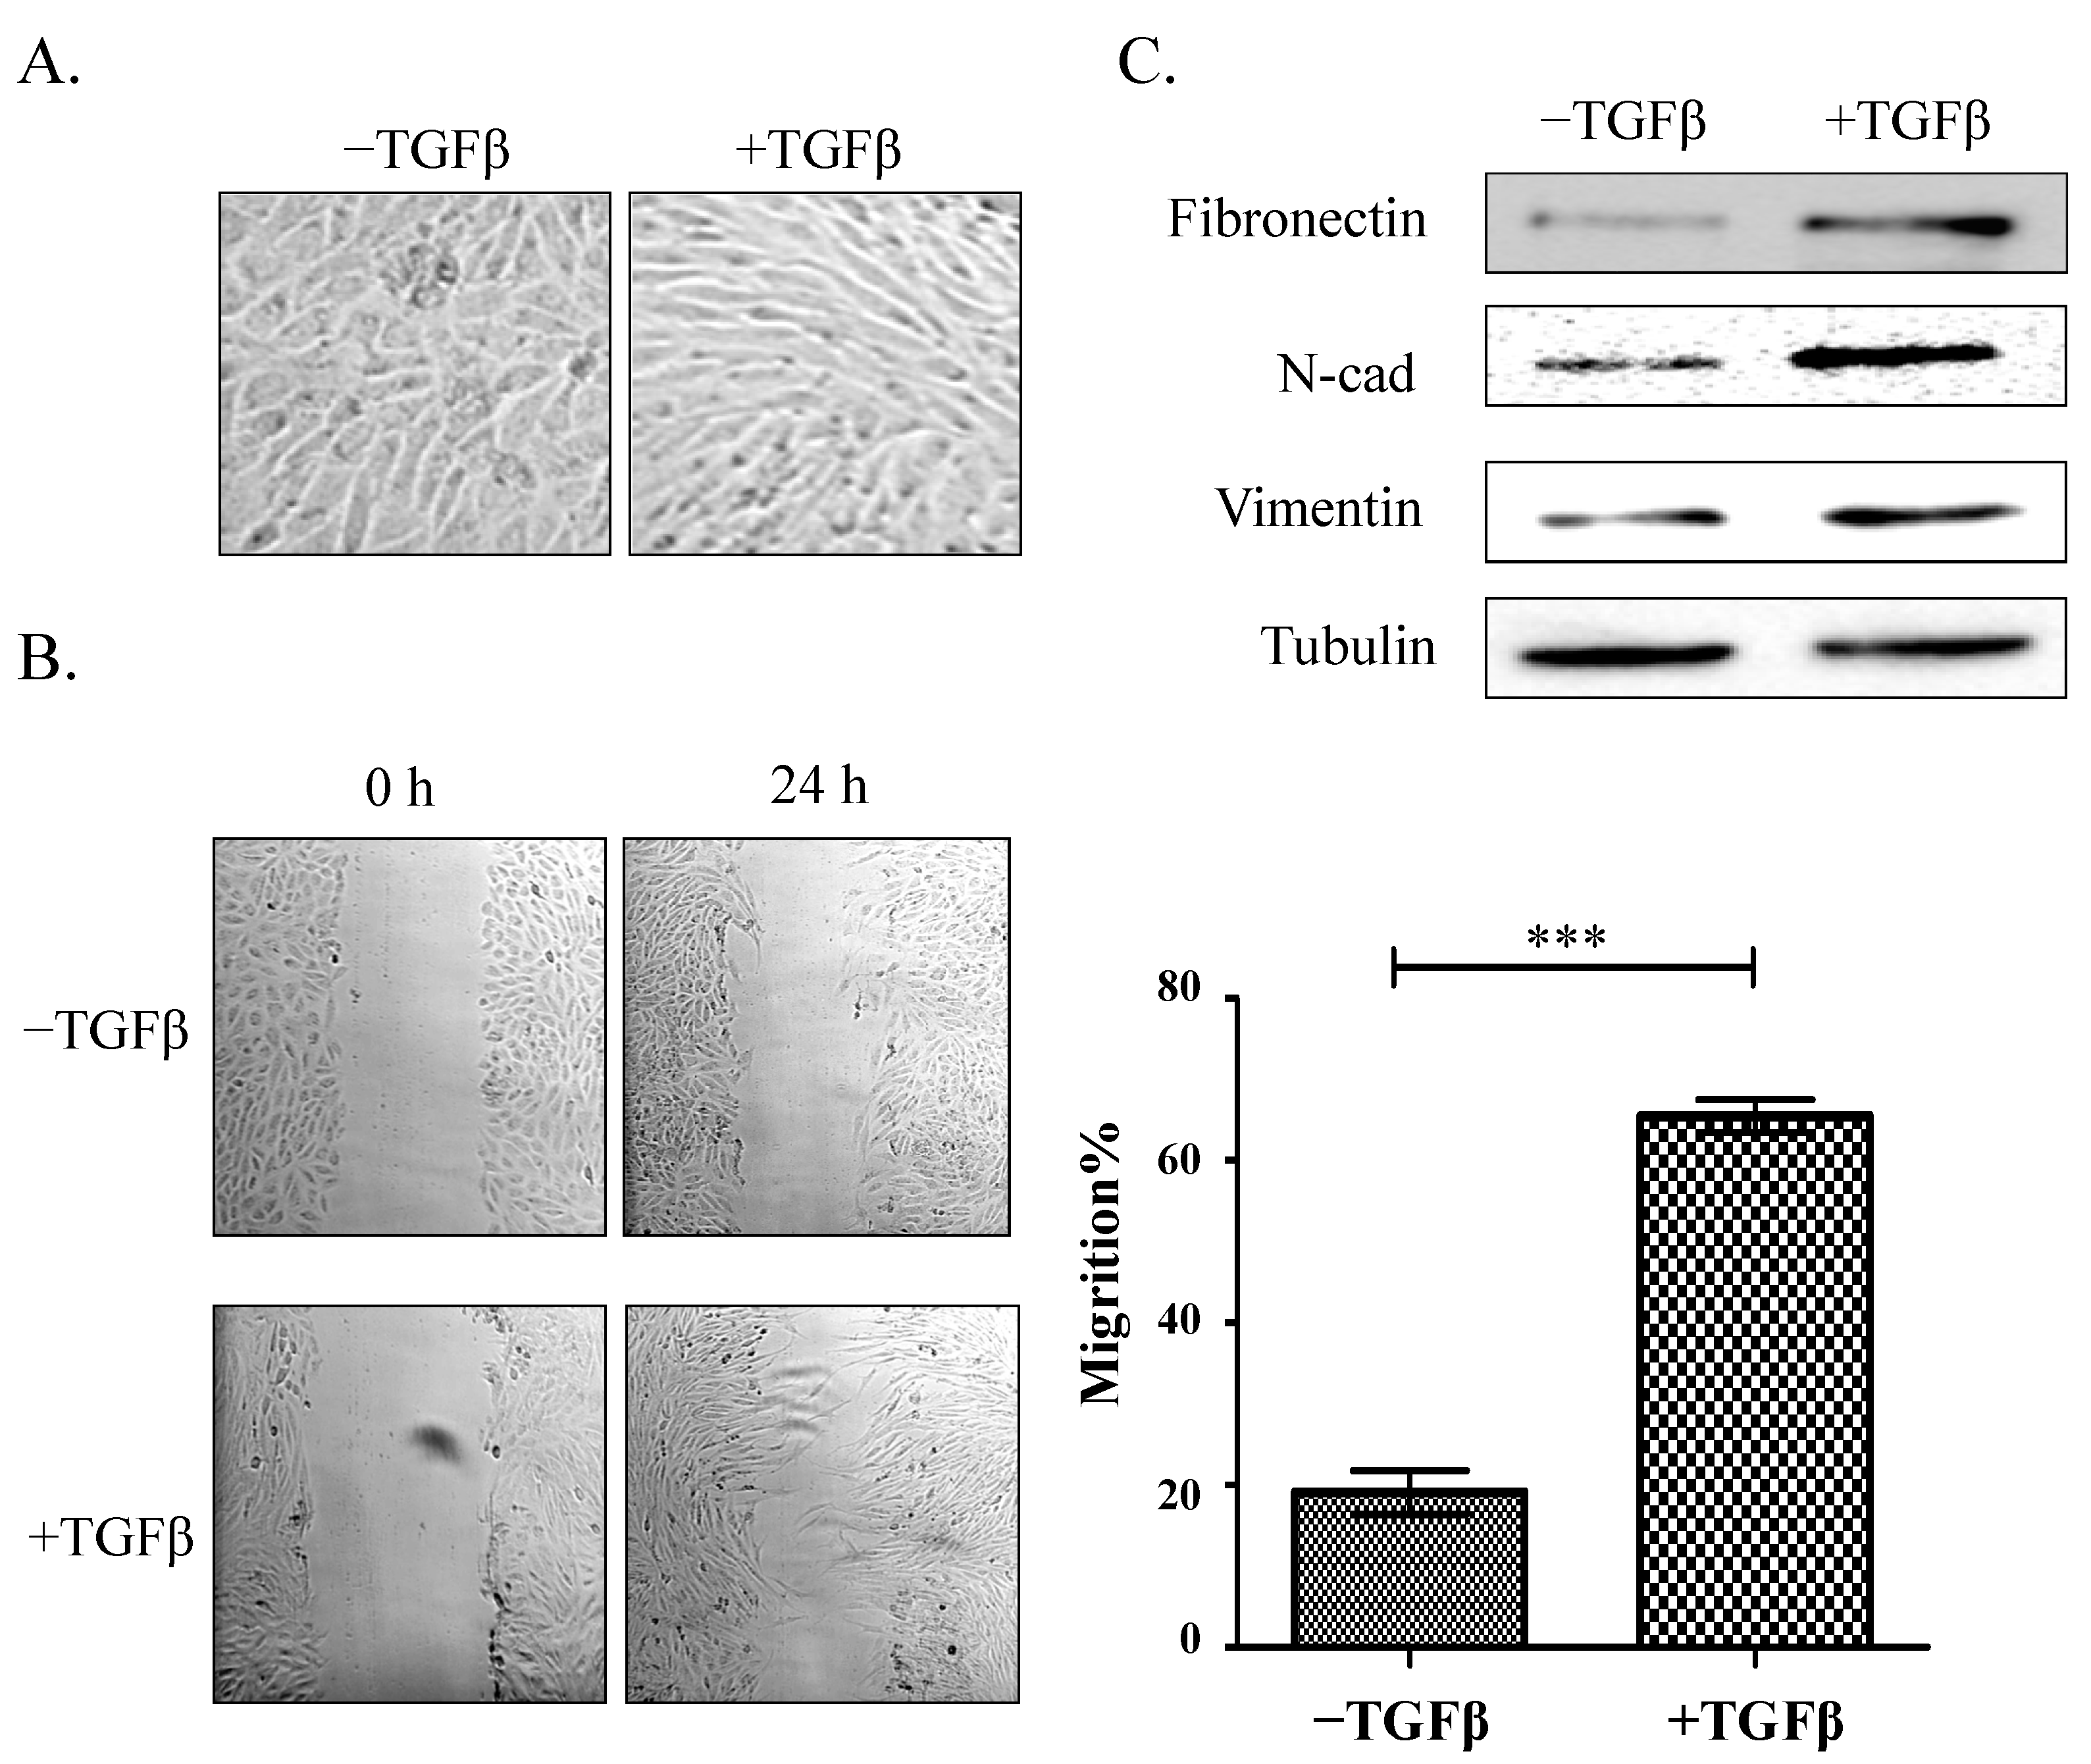
2.1. Establishment of a Model of TGFβ-Induced EMT

During EMT, cells undergo a morphological change and enhancement of motility [19,21]. HCV29 in normal medium had flattened epithelial morphology, while TGFβ-treated cells were converted to fibroblastic morphology (Figure 1A). Wound assays showed that motility was enhanced in TGFβ-treated cells relative to control cells, as expected (Figure 1B).
Loss of epithelial marker expression and increased expression of mesenchymal markers are the characteristic events of EMT [19,20,21]. We showed previously [22] that HCV29 cells express low levels of the mesenchymal markers N-cadherin, vimentin, and fibronectin and an undetectable level of the typical epithelial marker E-cadherin. In the present study, treatment of HCV29 cells with TGFβ resulted in significantly increased expression of N-cadherin, vimentin, and fibronectin relative to control cells (Figure 1C). Thus, TGFβ-treated HCV29 cells provide a useful model of TGFβ-induced EMT.

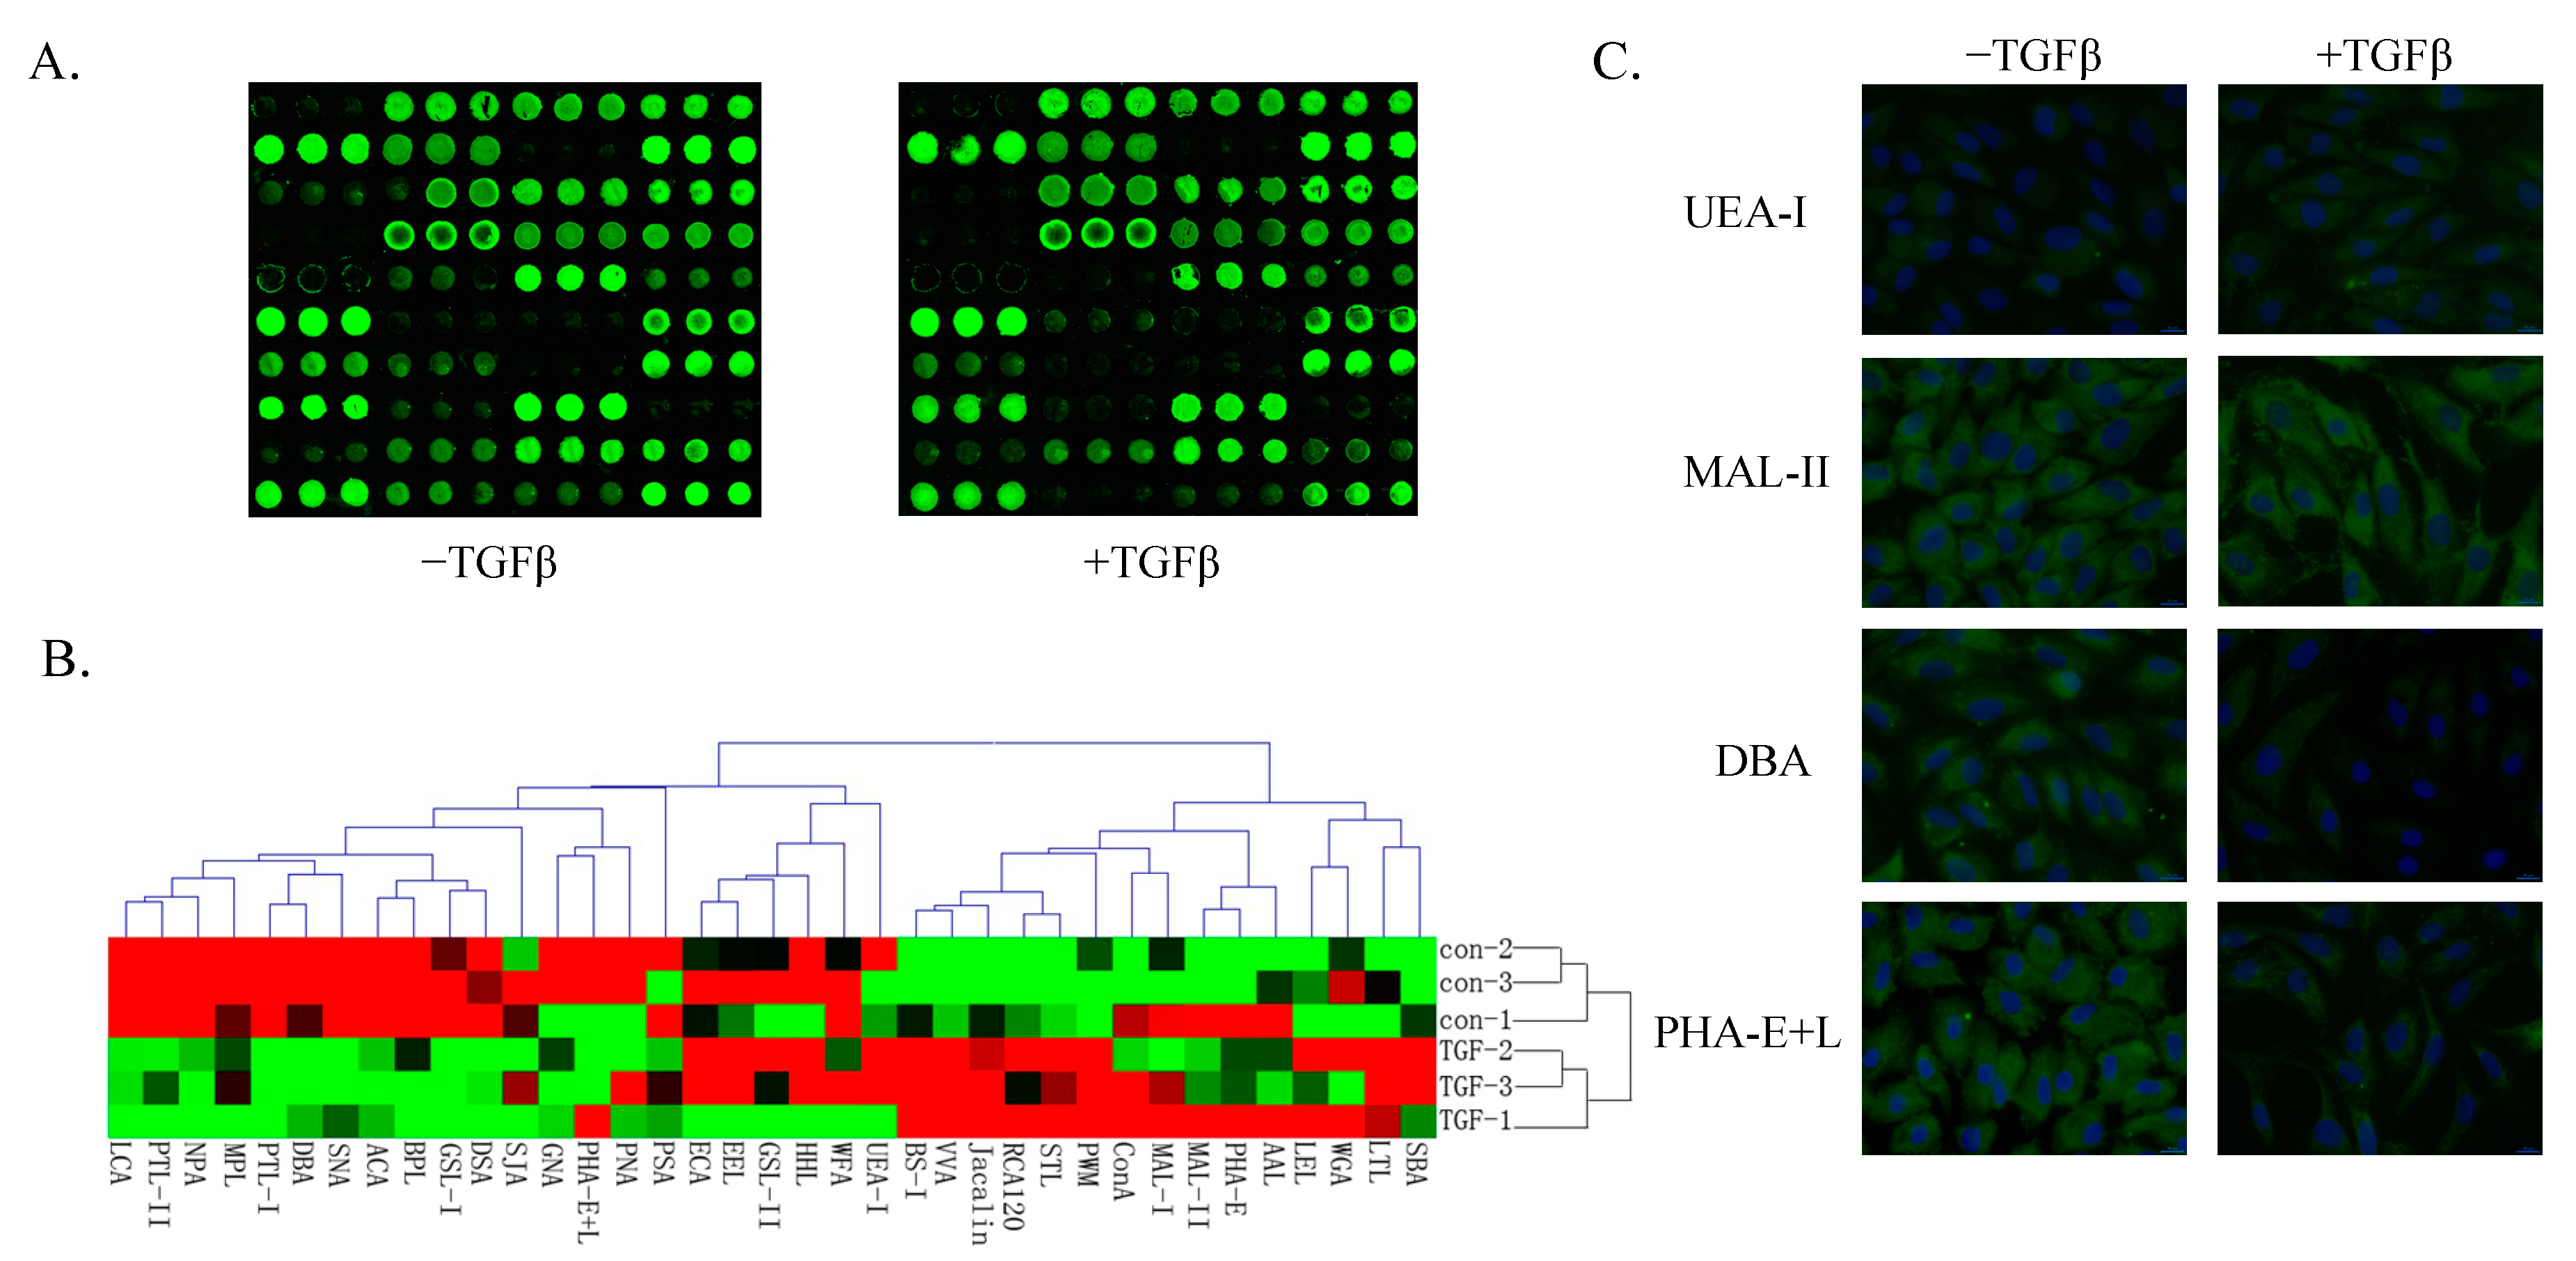
2.2. Glycosylation Analysis Using a Lectin Microarray during EMT in HCV29 Cells

Cell surface glycans are major components of cell membranes and play important roles in cell-cell and cell-extracellular matrix interactions. Aberrant glycosylation, catalyzed by glycosyltransferases and glycosidases, is often associated with malignant transformation and tumor progression [14,15,16,26]. In different bladder cancer cell lines, the N-glycosylation pattern of cadherin was related to the stage of invasiveness [27]; bi-, tri- and tetra-antennary structures were widely expressed in subunits of integrin α3β1, while high-mannose type structures were rare in HCV29 cells [28]; comparison the different glycosylation between HCV29 and bladder transitional cell carcinoma T24 treated with swainsonine (an inhibitor of Golgia-mannosidase II) showed that β1-6 branched tri- and tetraantennary complex-type glycans played an important role in the metastatic process [29]. However, no global glycan profiles have been studied in bladder cancer. Therefore, we combined lectin microarray analysis, MALDI-TOF-MS and glycogene microarray analysis, to elucidate the expression of glycans and glycogenes during TGFβ-induced EMT in HCV29 cells.
Figure 1. Effect of TGFβ treatment on HCV29 cell morphology, motility, and expression of EMT markers. (A) Morphological effects. Cells were cultured in 6-well plates and treated with 2 ng/mL TGFβ for 48 h. Photos were taken under phase-contrast microscopy; (B) Cell motility was assessed by wound assay. Image panels: cells were cultured in 24-well plates for 24 h and then treated with TGFβ for 48 h. Control and treated cells were scratched with a 200 μL pipette tip at the marked position. Cell were washed twice with fresh serum-free medium and then cultured in fresh culture medium without serum. Wounds were photographed at the marked position at 0 h and after 24 h incubation under phase-contrast microscopy. Right panel: migration ability analyzed by Scion Image program. ***, p ≤ 0.001; (C) Expression of EMT markers in control and TGFβ-treated cells. 10 μg protein/well were subjected to SDS-PAGE and western blotting, and expression of the EMT markers N-cadherin, vimentin, and fibronectin was analyzed by western blotting as described in the Experimental Setion. Tubulin was used as a control.
Molecules 19 20073 g001
Lectin microarrays were performed for high-throughput analysis of glycan structures. Significant changes (>1.5-fold or <0.67-fold) of glycans were recognized by 15 different lectins during EMT (Table 1). Five glycan structures recognized by the lectins UEA-I, BS-I, MAL-II, RCA120 and PWM were up-regulated and 10 glycan structures recognized by the lectins PNA, GNA, SNA, NPA, PTL-II, DBA, PHA-E+L, DSA, PTL-I and GSL-I were down-regulated in the TGFβ-treated cells relative to control cells (Figure 2A; Table 1). Complete hierarchical clustering and visualization were performed using the Hierarchical Clustering Explorer 3.0 software program [30] (Figure 2B). Consistent with microarray findings, TGFβ-treated cells showed significantly increased binding signals with UEA-I and MAL-II and decreased binding signals with DBA and PHA-E+L by histochemical assays (Figure 2C).
Table 1. Variation of glycans determined by lectin microarray analysis of control vs. TGFβ-treated HCV29 cells.
LectinFold ChangeSpecificity
Up-regulated
UEA-I2.78107Fucα1-2Galβ1-4Glc(NAc)
BS-I2.73611α-Gal and α-GalNAc
MAL-II1.88948Sia2-3Galβ1-4Glc(NAc)
RCA1201.63778β-Gal
PWM1.63695GlcNAc
Down-regulated
PNA0.64744Galβ1-3GalNAcα-Ser/Thr(T)
GNA0.64599Terminal α-1,3 mannose
SNA0.62468Sia2-6Galβ1-4Glc(NAc)
NPA0.61967Non-substituted α-1,6Man
PTL-II0.32613Gal
DBA0.25435αGalNAc,GalNAcα-Ser/Thr (Tn) and αGal
PHA-E + L0.2388Bisecting GlcNAc and biantennary N-glycans and tetra-antennary complex-type N-glycans
DSA0.21933GlcNAc
PTL-I0.0513αGalNAc and Gal
GSL-I0.00542αGalNAc,GalNAcα-Ser/Thr (Tn) and αGal
Figure 2. Variation of glycans recognized by lectin microarrays during TGFβ-induced EMT. (A) Fine structure of glycans was revealed by lectin microarray analysis as described in Materials and Methods. Fluorescence intensities from control samples (left) and TGFβ-treated samples (right) were scanned; (B) Variation of expression of glycans recognized by 37 lectins is presented as a “heatmap”. Red: fluorescence signal activation. Green: signal inhibition. Black: no clear link. Gray: missing data; (C) Altered expression of glycans evaluated by lectin histochemistry. Four lectins (Ulex europaeus agglutinin I [UEA-I], Maackia amurensis lectin II [MAL-II], Dolichos biflorus agglutinin [DBA], and Phaseolus vulgaris agglutinin E+L [PHA-E+L]) were applied, and lectin histochemistry was performed as described in Materials and Methods. Signals from a merge image of Cy3-conjugated lectins and DAPI staining of nuclei in control (left) and TGFβ-treated cells (right) are indicated (magnification 60×).
Molecules 19 20073 g002
Lectin microarray analysis revealed a reduction of biantennary N-glycan structures and tetra-antennary complex-type N-glycans (recognized by PHA-E+L) in EMT. Similar changes in N-glycan structures have been reported in other cancers, e.g., and reduction of tri- and tetra-antennary N-glycan structures in hepatocellular carcinoma [31].

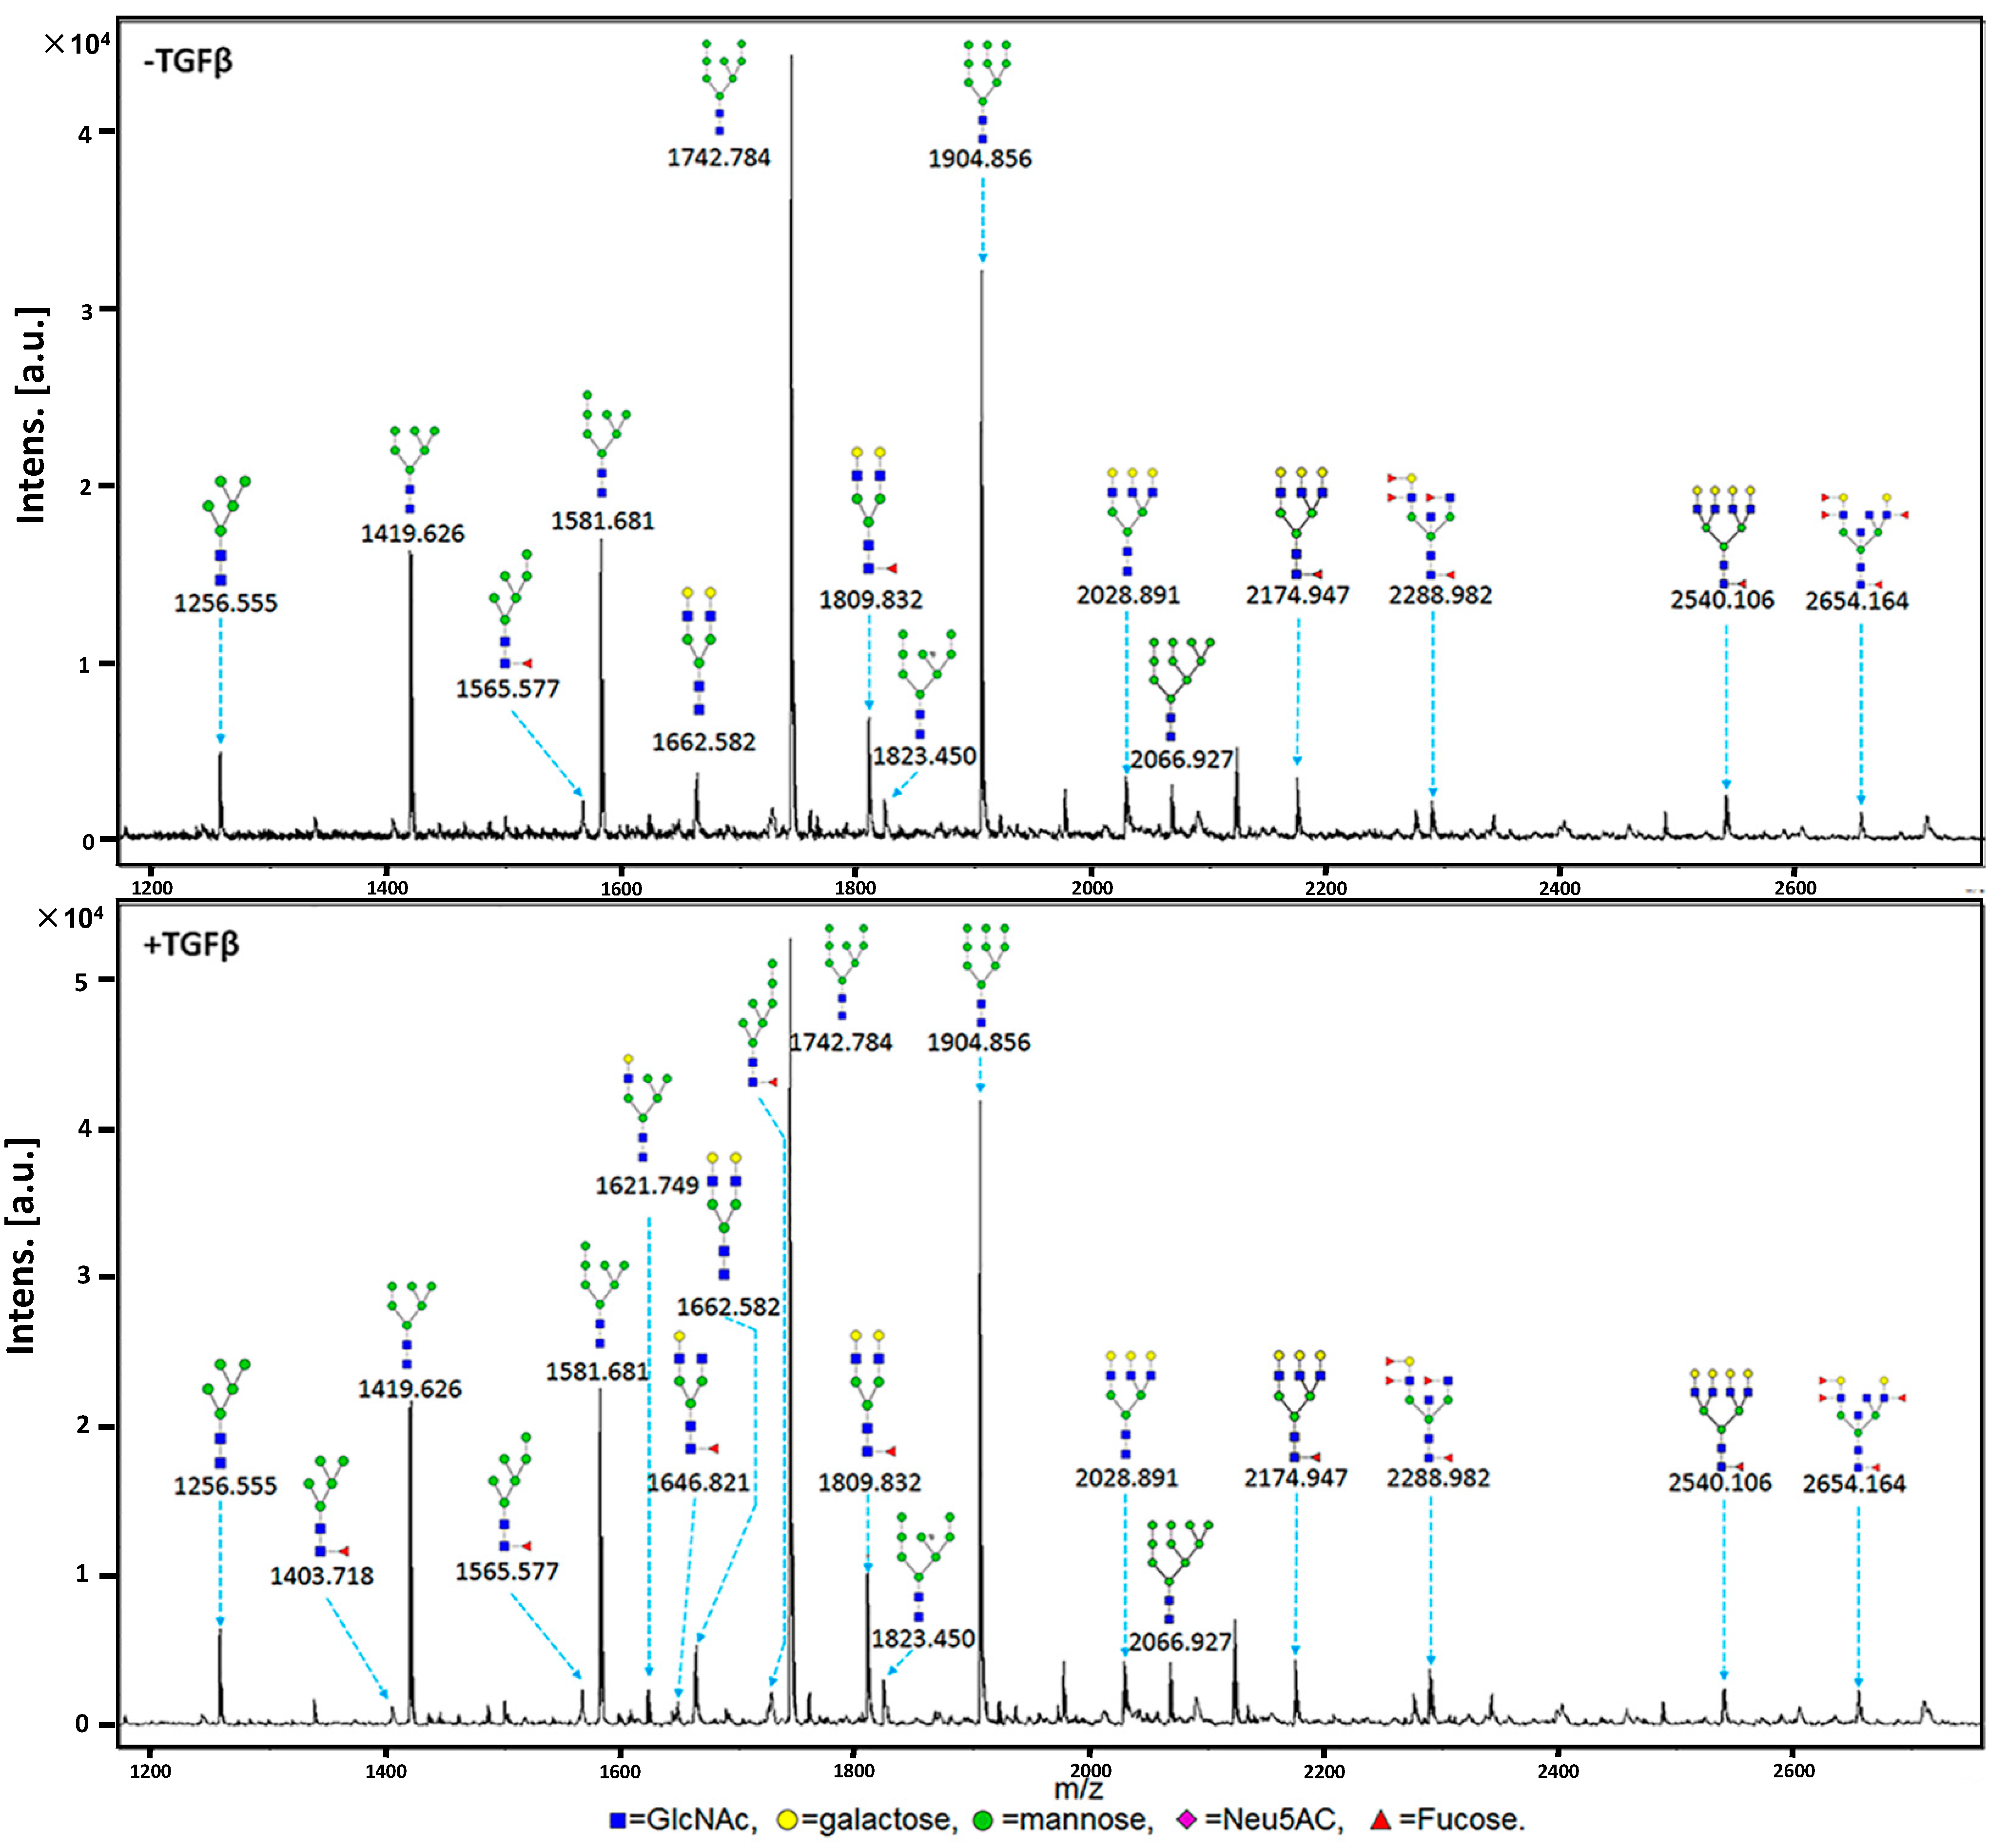
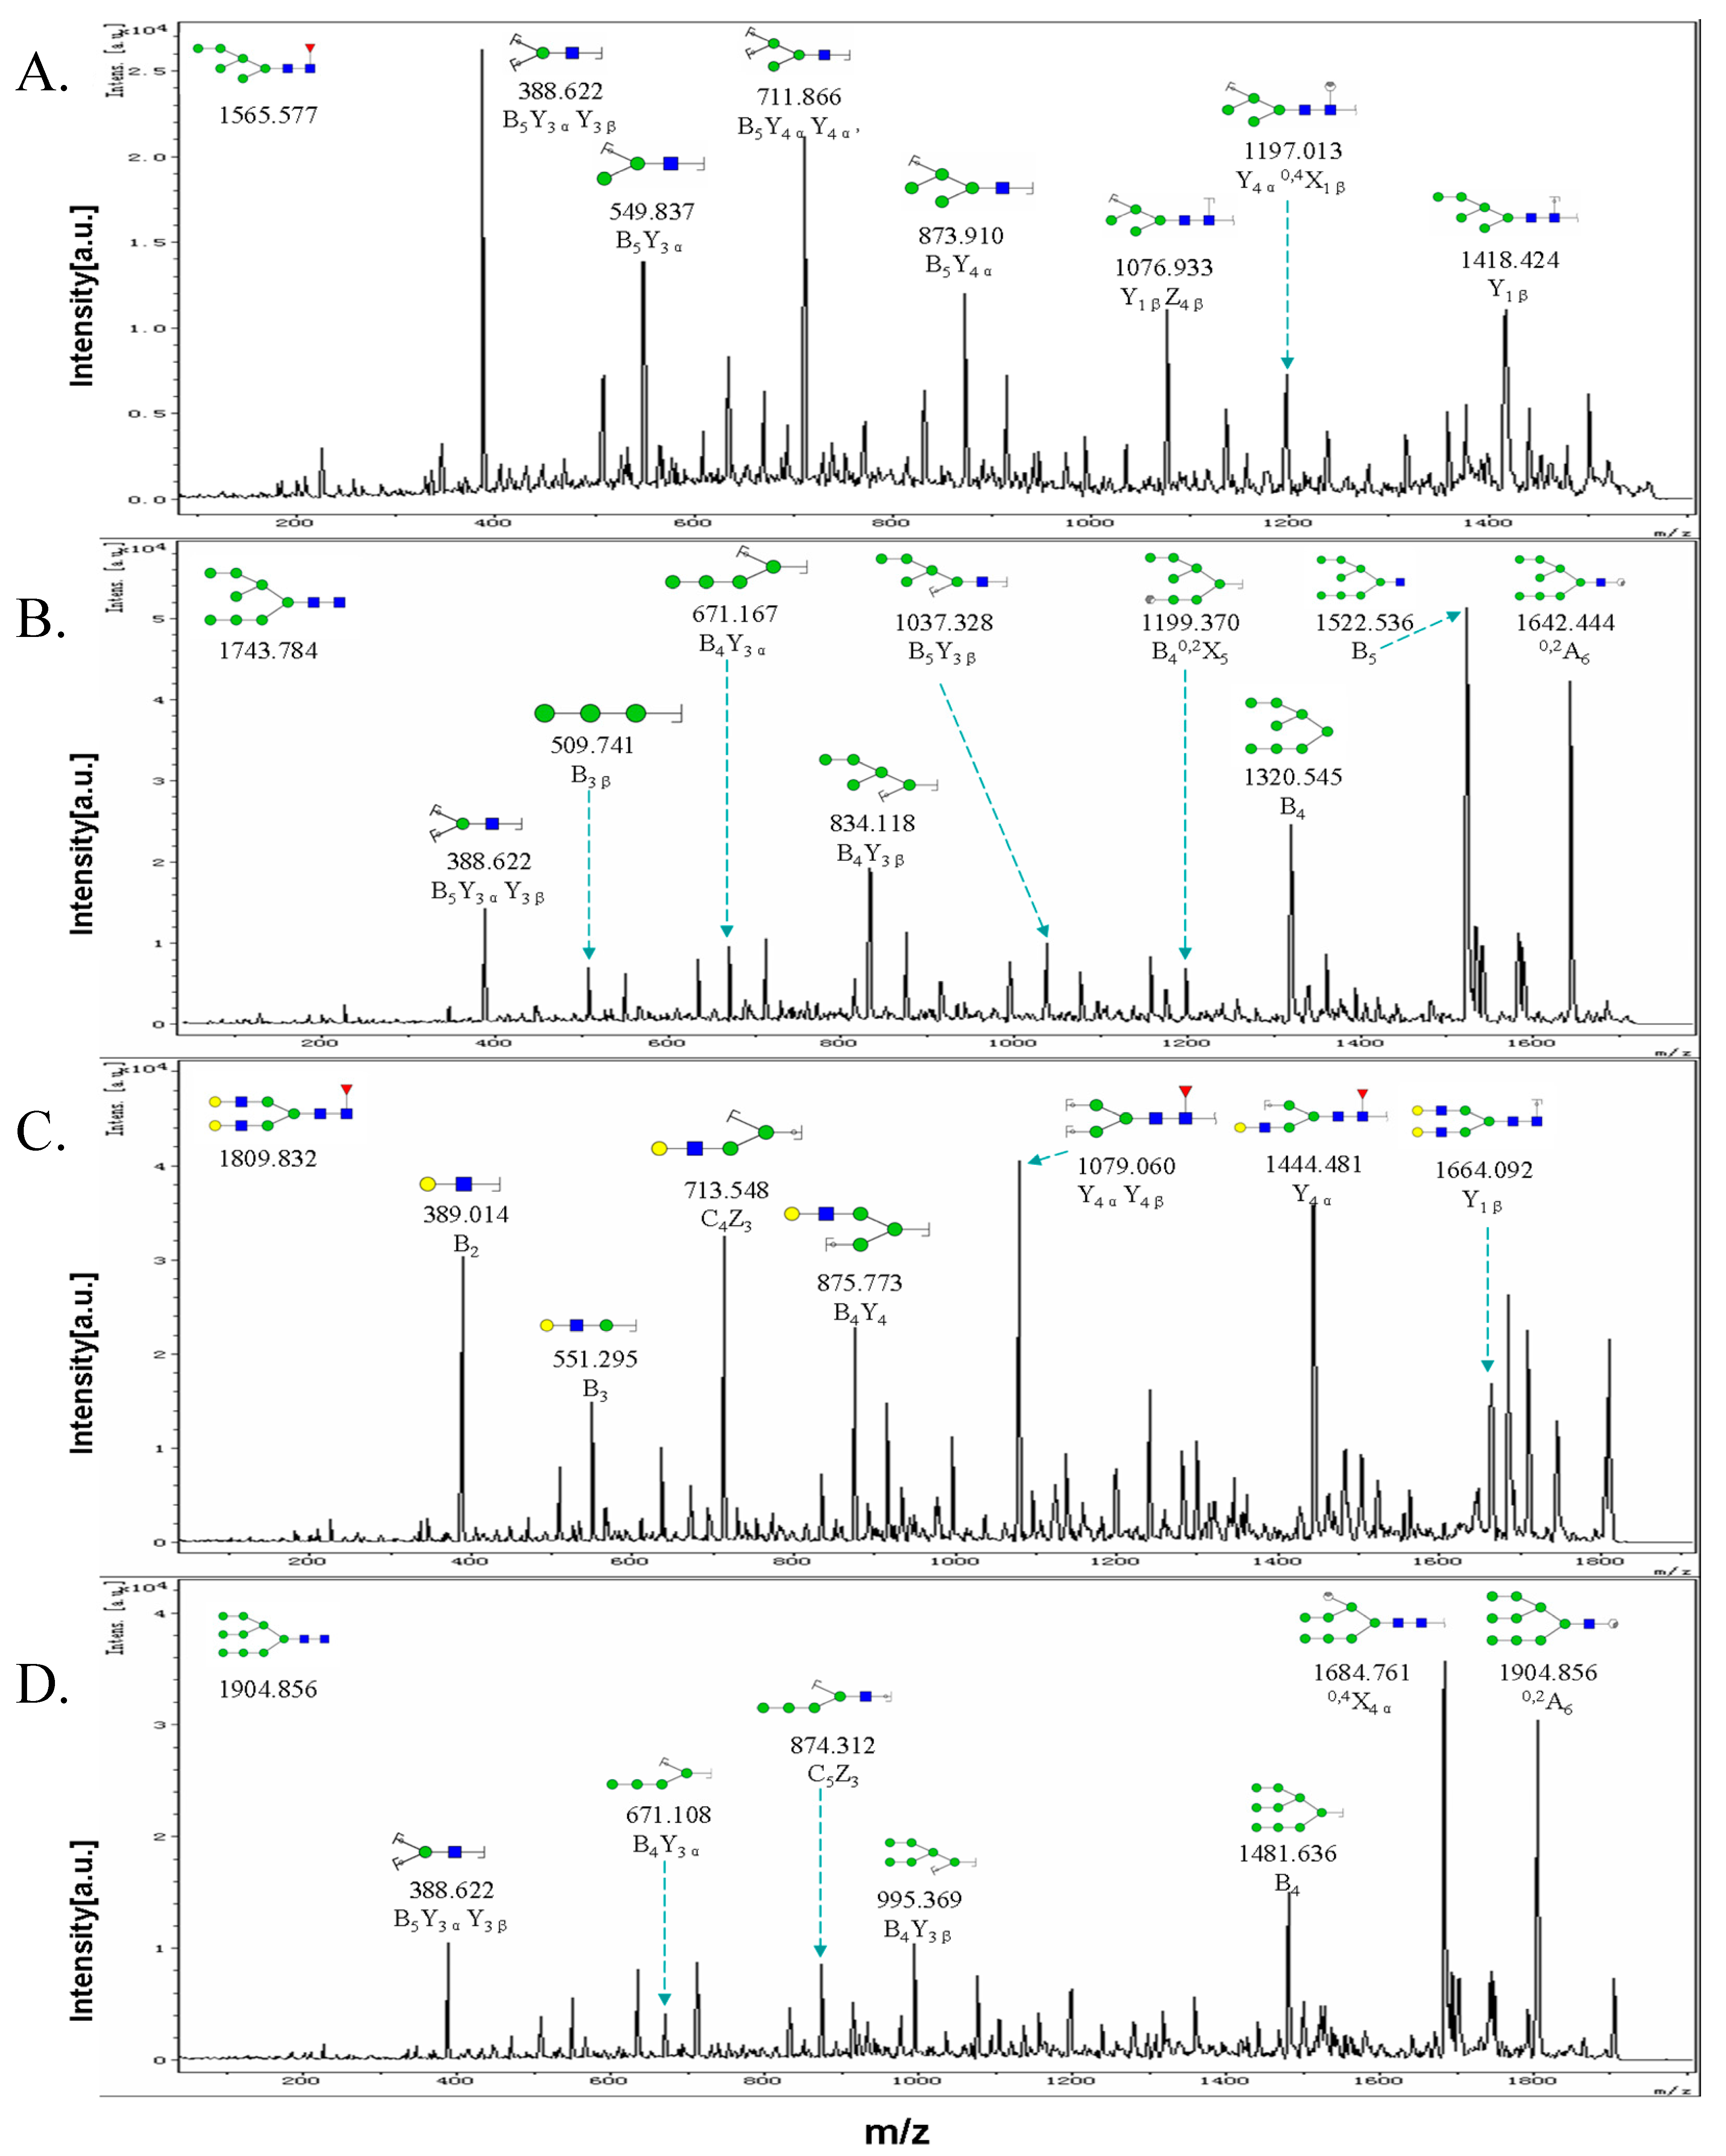
2.3. MALDI-TOF-MS Analysis of N-Glycan Profiles during EMT

N-glycosylation is involved in cell recognition, receptor activation, cell signaling, and cell adhesion in cancer [32]. Altered expression of N-glycans has been observed by mass spectrometry in many types of tumor cells. We applied MALDI-TOF/TOF-MS (tandem) to profile total N-glycans in TGFβ-treated cells as compared with control cells. Signal-to-noise ratios > 5 were the criterion for filtering distinct N-glycan peaks from the mass spectra, and N-glycans were annotated using GlycoWorkbench software [30]. Proposed N-glycan structures and their molecular weights are shown in Figure 3. 15 and 20 N-glycan structures were identified in control and TGFβ-treated cells, respectively. The 15 structures found in control cells were also present in TGFβ-treated cells, but with different intensities. Five structures were found only in TGFβ-treated cells (Table 2). Branching and linkage information for the N-glycan structures was obtained by MALDI-TOF/TOF-MS.
Two types of ions (B-,Y- and C-,Z-) were generated by glycosidic cleavages in tandem mass spectrometry, and cross-ring cleavages generated A-, X-type ions having greater energy. Tandem mass spectra of precursor ions with m/z 1565.577, 1743.784, 1809.832, and 1904.856 are shown in Figure 4. In the precursor ions with m/z 1743.784 and 1904.856, ion D (m/z 671.167) was identified as the most common fragment ion of high-mannose-type N-glycans, resulting from the loss of a 3-linked antenna and two reducing-end N-acetylglucosamine residues [33], e.g., B4Y. In the m/z 1809.832 ion, N-glycans were core fucosylated, as indicated by the fragment ions YY (m/z 1079.060) and Y (m/z 1664.092). Thus, MS in combination with MS/MS provided excellent insight into alteration of N-glycans during EMT.
Changes in the relative proportions of N-glycans detected in control and TGFβ-treated cells are summarized in Table 3. The proportion of complex-type N-glycan structures was lower in TGFβ-treated (40.0%) than in control cells (46.7%). In contrast, the proportions of high-mannose-type N-glycan (55.0% vs. 53.3%) and hybrid-type N-glycans (5.0% vs. 0.0%) were higher in TGFβ-treated than in control cells. The proportion of triantennary and tetra-antennary N-glycans were down-regulated in EMT. Fucosylation level was higher in EMT (50.0%) than in control cells (40.0%).

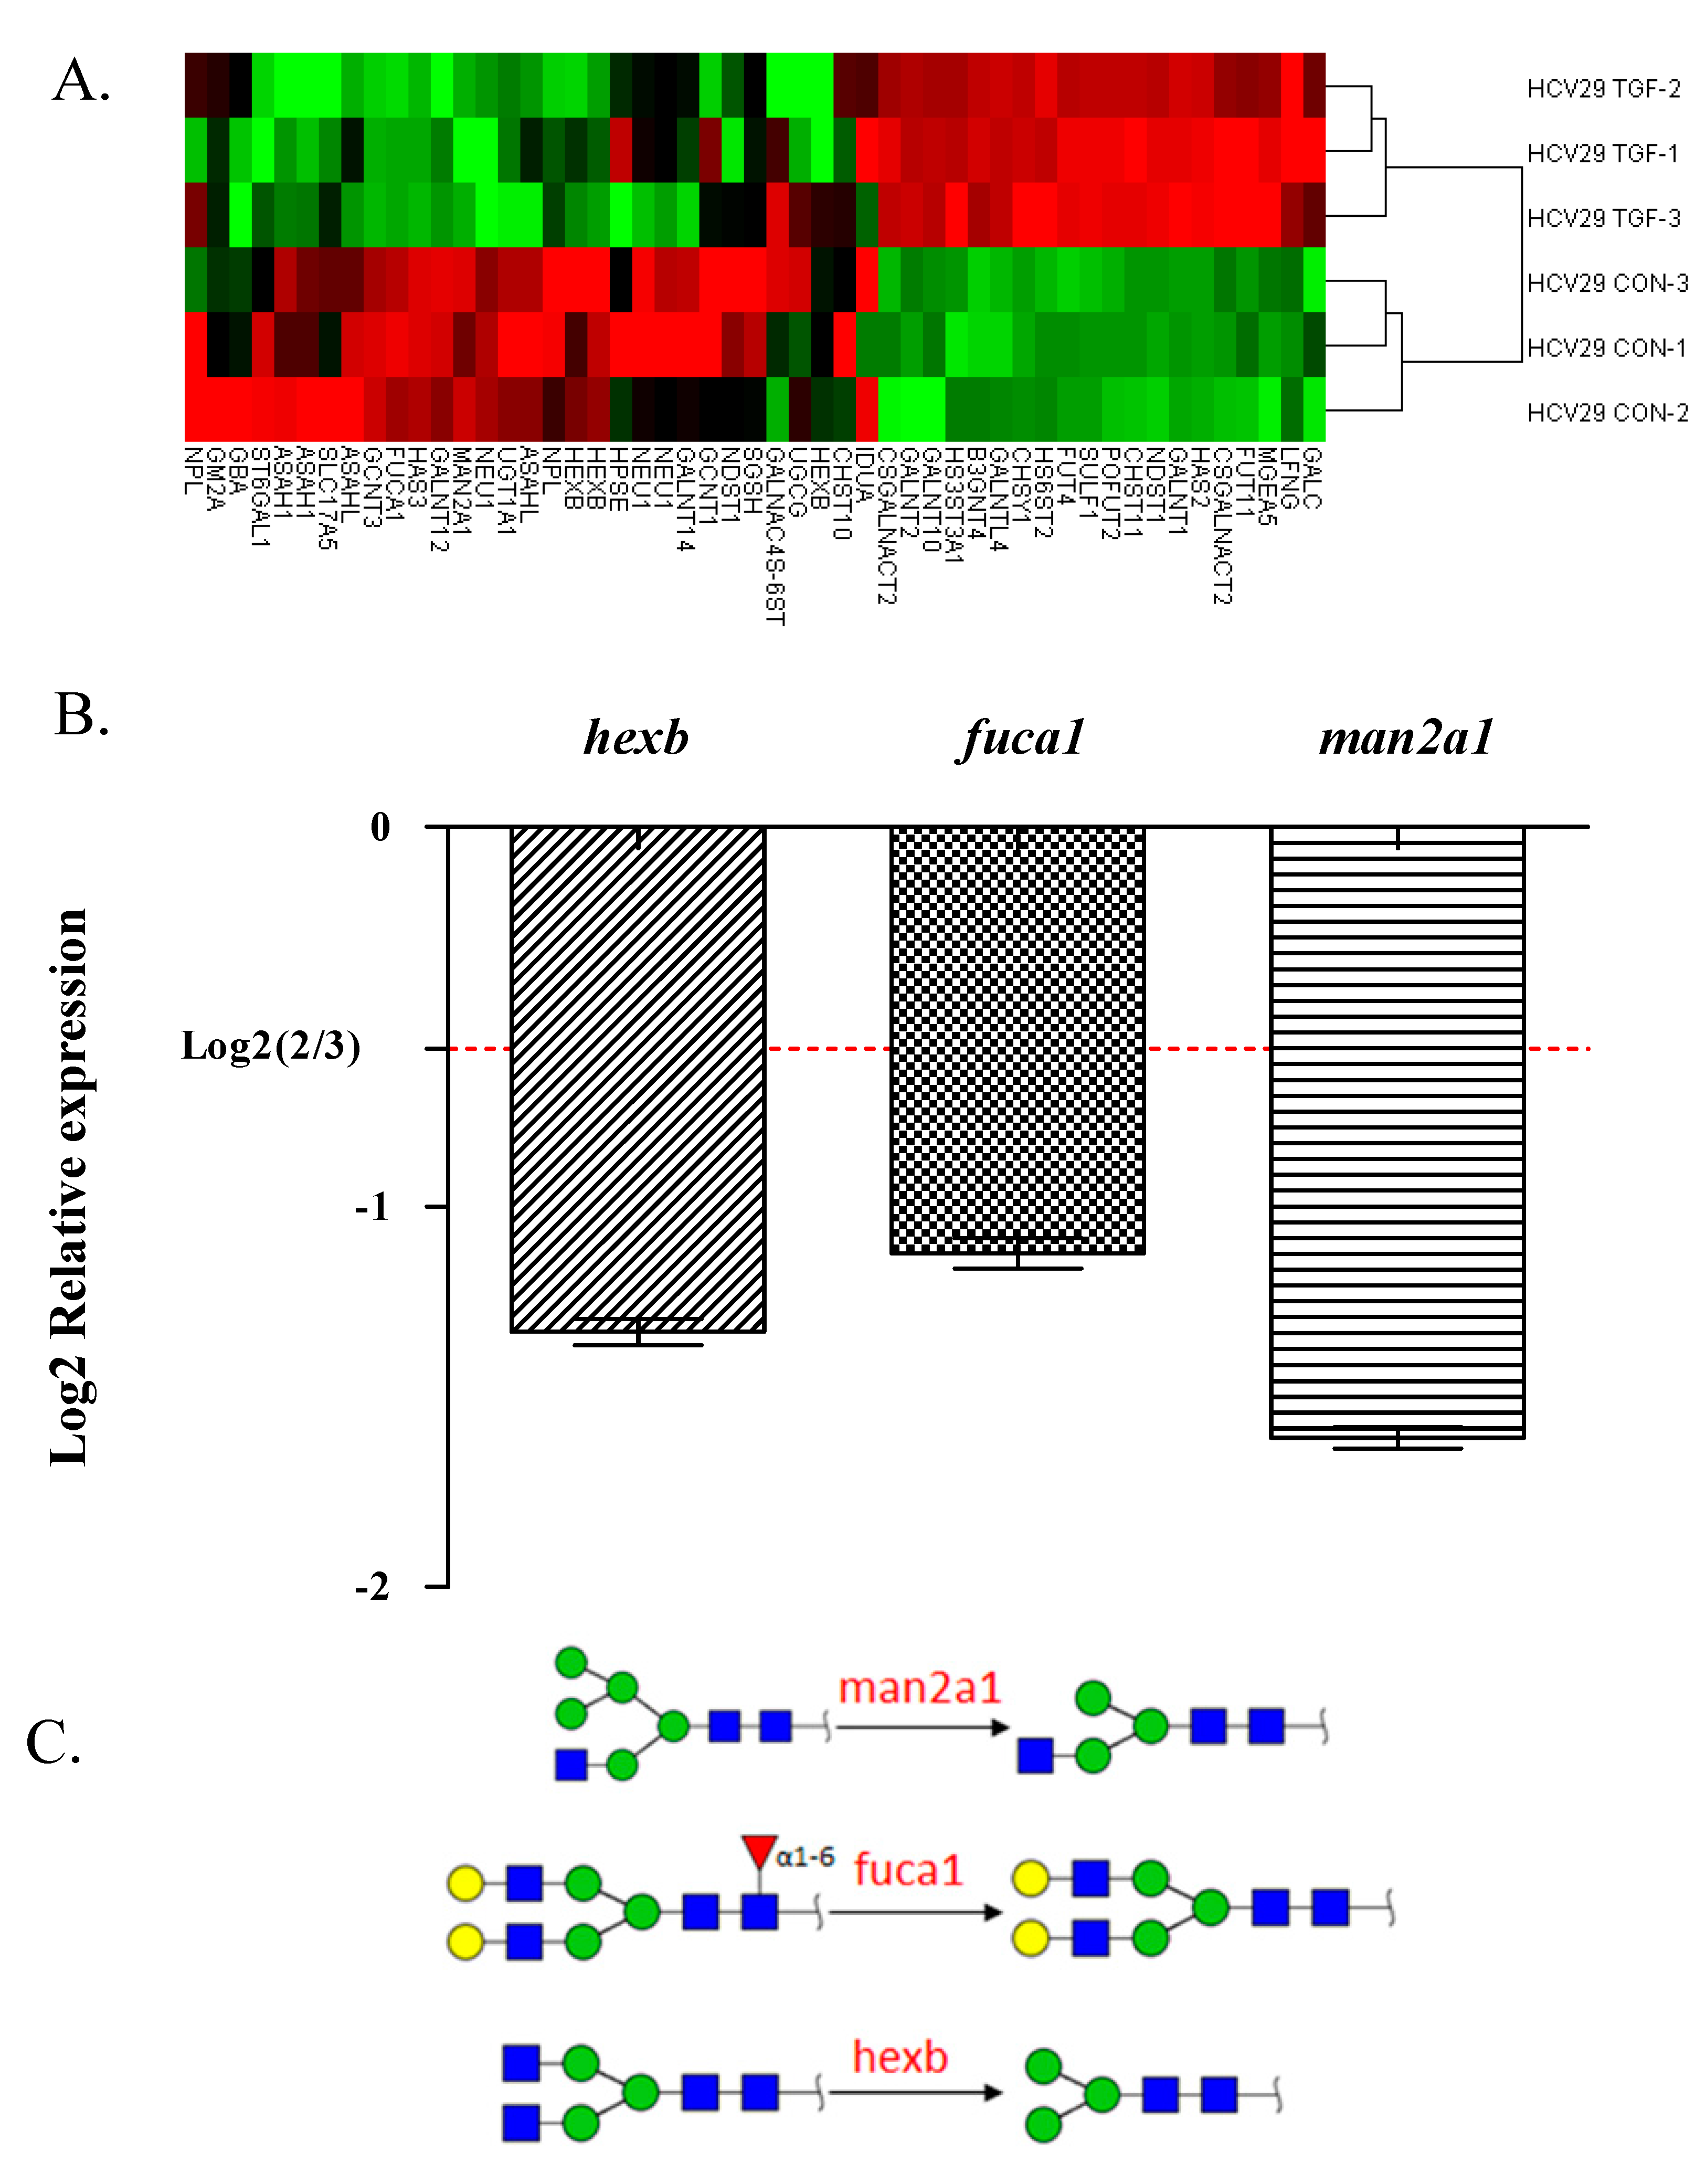
2.4. Glycogene Expression by Glycogene Microarray Analysis of TGFβ-Treated Cells

Among the 1260 human glycogenes covered by the GlycoV4 chip, a total of 178 were identified as differentially expressed following TGFβ treatment: 71 up-regulated genes and 107 down-regulated genes. To visualize the data, a “heatmap” was constructed using Cluster and Treeview software programs [30], and glycogenes from control and TGFβ-treated cells were clustered side-by-side in the dendrogram (Figure S1). Among the 178 differentially expressed genes, 51 were involved in glycan metabolism including 5 N-glycan-related genes (Table 4; Figure 5A), 42 were related to growth factors and their receptors, 18 were related to lectins and associated proteins, 10 were related to interleukins and associated receptors, and the remaining 57 were related to sulfotransferases, proteoglycans, glycoproteins, cytokines, adhesion molecules, or other molecules (Table S1).
Figure 3. MALDI-TOF-MS spectra of N-glycans. HCV29 cells were cultured in a 10 cm dish (Corning; New York, NY, USA), and N-glycans from control and TGFβ-treated cells were separated and desalted as described in the Experimental. Lyophilized N-glycans were dissolved in methanol/H2O, and an aliquot of the mixture with DHB solution was spotted on an MTP AnchorChip sample target and air-dried. MALDI-TOF-MS was performed in positive-ion mode. Experiments were performed in triplicate, and representative N-glycan spectra are shown. Peaks (signal-to-noise ratio > 5) were selected for relative proportion analysis. Detailed structures were analyzed using GlycoWorkbench software. Proposed structures are indicated by m/z value.
Molecules 19 20073 g003
Table 2. Proposed structures and their molecular ions in MALDI spectra of N-glycans from control and TGFβ-treated HCV29 cells.
NO.Calculated (m/z)Experimental (m/z)Glycan StructureRelative Intensity
ControlTGFβ-Treated
AverageCV(%)AverageCV(%)
11079.3771079.487 Molecules 19 20073 i001ND *ND1.500.47
21257.4231256.555 Molecules 19 20073 i0026.000.7311.000.55
31403.4811403.718 Molecules 19 20073 i003NDND1.330.43
41419.4761419.626 Molecules 19 20073 i00438.670.0843.670.23
51565.5331565.577 Molecules 19 20073 i0053.330.173.330.17
61581.5281580.681 Molecules 19 20073 i00638.330.0443.330.09
71622.5551621.749 Molecules 19 20073 i007NDND3.330.62
81647.5871646.821 Molecules 19 20073 i008NDND2.000
91663.5811662.582 Molecules 19 20073 i0095.330.2165.670.10
101727.5861726.976 Molecules 19 20073 i010NDND1.330.43
111743.5811742.784 Molecules 19 20073 i011100.000100.000
121809.6391809.832 Molecules 19 20073 i0128.330.5511.330.57
131823.5471823.450 Molecules 19 20073 i0134.0004.000.25
141905.6341904.856 Molecules 19 20073 i01464.000.0769.670.11
152028.7132028.891 Molecules 19 20073 i0155.000.564.000.35
162067.6872066.927 Molecules 19 20073 i0163.670.425.000.35
172174.7722174.947 Molecules 19 20073 i0174.000.663.670.69
182287.8192288.982 Molecules 19 20073 i0183.0004.000.35
192539.9042540.106 Molecules 19 20073 i0192.670.572.000.5
202652.9512654.164 Molecules 19 20073 i0202.0002.500.28
* ND: Not detected in the samples.
Figure 4. MALDI-TOF/TOF-MS/MS analysis of N-glycan precursor ions in MS spectra. Precursor ions were subjected to MS/MS analysis to obtain cleavages, including B, Y, C, and Z glycosidic cleavages and A and X cross-ring cleavages. Structures of cleavage ions and m/z values are shown in tandem mass spectra. Four major N-glycan peaks are indicated: m/z 1565.577 (A); 1743.784 (B); 1809.832 (C); and 1904.856 (D).
Molecules 19 20073 g004
Table 3. Relative expression (proportions) of various types of N-glycans in control and TGFβ-treated HCV29 cells.
Glycan TypeControlTGFβ-Treated Cells
High-mannose-type 53.3%55.0%
Hybrid-type0%5.0%
Complex-type46.7%40.0%
Biantennary20.0%20.0%
Tri- and Tetra-antennary26.7%20.0%
Fucosylated40.0%50.0%
Table 4. Differential expression of N-glycan-related genes.
Gene NameGenebank Acc.DescriptionFold Change
st6gal1NM_173216The encoded protein is a type II membrane protein that catalyzes the transfer of sialic acid from CMP-sialic acid to galactose-containing substrates.0.61
neu1NM_000434The encoded protein is a lysosomal enzyme that cleaves terminal sialic acid residues from substrates such as glycoproteins and glycolipids.0.54
hexbNM_000521Hexosaminidase B is the β-subunit of the lysosomal enzyme β-hexosaminidase that, together with the cofactor GM2 activator protein, catalyzes the degradation of ganglioside GM2 and other molecules containing terminal N-acetyl hexosamines.0.54
man2a1NM_002372The encoded protein is a member of family 38 of the glycosyl hydrolases.0.49
fuca1NM_000147The encoded protein is a lysosomal enzyme involved in the degradation of fucose-containing glycoproteins and glycolipids.0.47
To confirm the above results, we detected expression of three N-glycan-related genes (hexb, fuca1, man2a1) by real-time RT-PCR. Both techniques showed greatly reduced expression of hexb, fuca1, and man2a1 following TGFβ treatment (Figure 5B). These findings indicate that altered glycogene expression was involved in TGFβ-induced EMT in these cells. Increased glycan fucosylation was detected by UEA-I (which recognizes Fucα1-2Galβ1-4GlcNAc structure), corresponding to the down-regulated expression of fuca1 in glycogene microarray analysis and real-time RT-PCR. Bi- and tetra-antennary complex-type N-glycan structures recognized by PHA-E+L were decreased in accord with man2a1 expression (Figure 5C).
We compared N-glycan profiles of TGFβ-treated vs. control cells by MALDI-TOF/TOF-MS. Consistently with changes of man2a1 transcription levels, TGFβ-treated cells showed a greatly increased proportion of hybrid glycan structures and a reduced proportion of complex-type structures. man2a1 encodes α-mannosidase II, which hydrolyzes the terminal α-1,3 and -1,6 linked α-D-mannose residues of the high-mannose-type structure GlcNAcMan5GlcNAc2 [34,35,36,37]. In congenital dyserythropoietic anemia type II (HEMPAS; an autosomal recessive human genetic disorder), two glycoproteins termed bands 3 and 4.5 converted their biantennary complex-type oligosaccharides to hybrid-type structures with an M5 core, as a result of deficiency in either GlcNAc transferase II, β1,4-galactosyltransferase, or Golgi mannosidase II [38,39]. In Golgi mannosidase II-null mice, complex N-glycan structures on erythrocytes were reduced [40].
Figure 5. Gene expression during EMT revealed by glycogene microarray analysis. (A) Differentially expressed genes involved in the metabolism of glycoproteins, glycosphingolipids, and glycosaminoglycans in TGFβ-treated samples compared with control samples are shown as a “heatmap”. Red: genomic activation. Green: inhibition. Black: no clear link. Gray: missing data; (B) Gene expression of hexb, fuca1 and man2a1was analyzed by quantitative real-time RT-PCR as described in the Experimental. Experiments were performed in triplicate. Relative expression was analyzed using the 2−ΔΔCt method and expressed as fold change relative to control cells. Expression of genes below Log2 (2/3) was significantly down-regulated. ***, p ≤ 0.001; (C) The relationship between glyco-molecules and their synthetic pathways with enzymes.
Molecules 19 20073 g005
Our glycogene microarray analysis showed a clear reduction in transcription level of the fuca1 gene. fuca1 encodes type 1 α-l-fucosidase, which is involved in degradation of fucose-containing glycoproteins and glycolipids [41]. Fucosylation always occurs in the final step of glycoconjugate biosynthesis, and is related to malignant transformation, invasion, and metastasis [42,43]. Reduced expression of fuca1 leads to fucosidase deficiency and enhanced fucosylation in cells. In the present study, MALDI-TOF-MS analysis of N-glycan profiles demonstrated increased fucosylation in TGFβ-treated cells, and lectin microarray analysis showed that the Fucα1-2Galβ1-4GlcNAc structure which was recognized by UEA-I, was almost 2-fold higher in TGFβ-treated than in control cells. These findings indicate that reduced fuca1 expression contributes to increased fucosylation and that fucosylation plays an important role in TGFβ-induced EMT in bladder cancer.

3. Experimental Section

3.1. Cell Line and Culture

HCV29 cells were kindly donated by Dr. S. Hakomori (The Biomembrane Institute; Seattle, WA, USA). The cells were cultured in RPMI 1640 containing 10% fetal bovine serum (FBS; HyClone, Logan, UT, USA) and 1× penicillin/streptomycin (Gibco; Carlsbad, CA, USA) at 37 °C in 5% CO2 atmosphere.

3.2. Antibodies and Reagents

The antibodies used were mouse anti-N-cadherin IgG1 (Santa Cruz Biotechnology; Santa Cruz, CA, USA), rabbit anti-fibronectin IgG, mouse anti-vimentin IgG1, anti-gamma tubulin (Sigma-Aldrich; St. Louis, MO, USA), horseradish peroxidase (HRP)-labeled goat anti-mouse IgG, and HRP-labeled goat anti-rabbit IgG (Beyotime Institute of Biotechnology; Haimen, China). TGFβ was from BD Biosciences (San Jose, CA, USA). Other reagents were from Sigma unless described otherwise.

3.3. Total Protein Extraction and Western Blot Analysis

Cells were grown in regular medium for 24 h, the medium was then replaced by regular medium containing 2 ng/mL TGFβ, and cells were incubated for another 48 h. Cells were lysed with T-PER Tissue Protein Extraction Reagent (Thermo Scientific; San Jose, CA, USA). The solution was centrifuged at 12,000 rpm for 15 min. Protein concentration was determined using a BCA kit (Beyotime). Protein lysates were stored for western blot, lectin microarray, or N-glycan purification.

3.4. Wound Assay

Cells (2 × 10⁴/well) were cultured in 24-well plates overnight and treated with TGFβ. Three separate wounds were scratched in each well using a 200 μL pipette tip. Cells were rinsed twice with fresh serum-free medium and added with serum-free culture medium to eliminate cell proliferation. Wounds at the marked lines were photographed. After 24 h incubation, wounds at the marked lines were photographed again and the area occupied by moving cells was calculated [44].

3.5. Lectin Microarray Analysis and Data Analysis

Lectin microarray analysis and data analysis were performed as described previously [45,46]. In brief, lectin microarrays were produced by spotting 37 lectins from Vector Laboratories (Burlingame, CA, USA), Sigma-Aldrich, and Calbiochem Merck (Darmstadt, Germany) onto epoxysilane-coated slides. Glycoprotein samples labeled with the fluorescent dye Cy3 (GE Healthcare; Buckinghamshire, UK) were applied to the microarrays, which were then scanned with a GenePix 4000B confocal scanner (Axon Instruments; Union City, CA, USA). Normalized data for the experimental group and corresponding control group were compared to determine the relative change in protein glycosylation during EMT.

3.6. Lectin Histochemistry

Cells were cultured onto sterile coverslips in RPMI 1640 medium and treated with TGFβ for 48 h. The cells were then (i) fixed with 2% paraformaldehyde for 15 min and permeabilized with 0.2% Triton X-100 in PBS for 10 min; (ii) washed twice with PBS and blocked with 5% (w/v) BSA in PBS at 4 °C overnight; (iii) incubated with Cy3- labeled lectin (15–20 μg/mL) in 5% BSA for 3 h in the darkness and stained with DAPI (20 μg/mL) in PBS for 10 min; (iv) rinsed with PBS to remove extra dye; (v) mounted with Glycergel (DakoCytomation; Carpinteria, CA, USA) and observed using a fluorescence microscope (model Eclipse E600, Nikon; Tokyo, Japan).

3.7. Release and Purification of N-Glycans

Proteins were concentrated and desalted using a size-exclusion spin ultrafiltration unit (Amicon Ultra-0.5 10 KD device, Millipore; Billerica, MA, USA) [47] and denatured with 8 M urea, 10 mM DTT, and 10 mM IAM (Sigma-Aldrich, St. Louis, MO, USA). Denatured proteins were removed, and the samples in the ultrafiltration unit were further incubated with PNGase F (New England BioLabs; Ipswich, MA, USA) at 37 °C overnight to release N-glycans. N-glycans were eluted with Milli-Q water and desalted as described previously [47], dissolved in 1-butanol/methanol/H2O (5:1:1), and added into Sepharose 4B (Sigma-Aldrich) which was then equilibrated with methanol/H2O (1:1) and 1-butanol/methanol/H2O (5:1:1). After incubation for 45 min, N-glycans were washed with 1-butanol/methanol/H2O (5:1:1), eluted with methanol/H2O (1:1), and lyophilized.

3.8. MALDI-TOF/TOF-MS Analysis of N-Glycans

N-glycans were dissolved in 10 μL methanol/H2O (1:1), and spotted on an MTP AnchorChip sample target. Samples were air-dried, and 1 μL DHB solvent (20 mg/mL in methanol/H2O []) was added to recrystallize the glycans. N-glycans were analyzed by MALDI-TOF/TOF-MS (UltrafleXtreme, Bruker Daltonics; Bremen, Germany) in positive ion mode. m/z data were analyzed and annotated using GlycoWorkbench software.

3.9. Glycogene Microarray Analysis

RNA samples were prepared in the laboratory of Dr. S. Hakomori. GlycoV4 oligonucleotide chip analysis was performed by Gene Microarray Core E, Consortium for Functional Glycomics (CFG), Scripps Research Institute (La Jolla, CA, USA); results are available open-access at the CFG Functional Glycomics Gateway [48,49]. Differential expression of transcripts in TGFβ-treated vs. control cells was determined using cut-offs of fold change > 1.5, fold change < 0.67, and adjusted p-value < 0.05.

3.10. Real-Time RT-PCR

RNA was extracted using RNAPure Tissue Kit (CoWin Biotech; Beijing, China). The samples were treated with DNase I to rule out chromosomal DNA contamination. Each RNA sample (0.5 μg) was reversed transcribed using ReverTra Ace-α-® (Toyobo; Shanghai, China). Real-time RT-PCR was performed with thermocycle conditions 95 °C for 10 min, 40 cycles of 95 °C for 10 s and 60 °C for 1 min in a 15 μL reaction system using UltraSYBR Mixture (CoWin Biotech). DNA products were analyzed using a CFX Manager (Bio-Rad; Berkeley, CA, USA). The primers used are listed in Table S2.

4. Conclusions

Aberrant glycans are always involved in cancer development and progression and are considered as potential cancer biomarkers. To identify glycan markers for bladder cancer, we applied a combination of different glycomic approaches during TGFβ-induced EMT in HCV29 cells. In comparison with control cells, TGFβ-treated cells showed: (i) reduced man2a1 transcription, resulting in increased expression of hybrid-type glycans and reduced expression of complex-type glycan; and (ii) reduced fuca1 transcription, resulting in increased appearance of various fucosylated N-glycans. Further studies using integrated glycomic techniques as described here will facilitate discovery of glycan markers and development of novel diagnostic and therapeutic approaches to bladder cancer.

Supplementary Materials

Supplementary materials can be accessed at: https://www.mdpi.com/1420-3049/19/12/20073/s1.

Acknowledgments

This study was supported by the National Science Foundation for Young Scientists of China (No.81402115), the Natural Science Foundation of Jiangsu Province, China (No. BK20140172), Jiangsu Province Recruiting Plan for High-level, Innovative and Entrepreneurial Talents, Jiangsu Province “Six Summit Talent” Foundation (2013-SWYY-019), the 111 Project (No. 111-2-06), and the Fundamental Research Funds for the Central Universities (No. JUSRP51319B). The authors are grateful to S. Anderson for English editing.

Author Contributions

Feng Guan and Jia Guo conceived and designed the experiments; Jia Guo, Xiang Li and performed the experiments; Wei Lu analyzed the data; Zengqi Tan and Ganglong Yang contributed Mass spectrometry analysis; Jia Guo and Ganglong Yang wrote the paper.

Conflicts of Interest

The authors declare no conflict of interest.

References

  1. Cummings, R.D. The repertoire of glycan determinants in the human glycome. Mol. Biosyst. 2009, 5, 1087–1104. [Google Scholar] [CrossRef] [PubMed]
  2. Zaia, J. Mass spectrometry and the emerging field of glycomics. Chem. Biol. 2008, 15, 881–892. [Google Scholar] [CrossRef] [PubMed]
  3. North, S.J.; Hitchen, P.G.; Haslam, S.M.; Dell, A. Mass spectrometry in the analysis of N-linked and O-linked glycans. Curr. Opin. Struct. Biol. 2009, 19, 498–506. [Google Scholar] [CrossRef] [PubMed]
  4. Krishnamoorthy, L.; Mahal, L.K. Glycomic analysis: An array of technologies. ACS Chem. Biol. 2009, 4, 715–732. [Google Scholar] [CrossRef] [PubMed]
  5. Drake, R.R.; Schwegler, E.E.; Malik, G.; Diaz, J.; Block, T.; Mehta, A.; Semmes, O.J. Lectin capture strategies combined with mass spectrometry for the discovery of serum glycoprotein biomarkers. Mol. Cell. Proteomics 2006, 5, 1957–1967. [Google Scholar] [CrossRef] [PubMed]
  6. Jia, W.; Lu, Z.; Fu, Y.; Wang, H.P.; Wang, L.H.; Chi, H.; Yuan, Z.F.; Zheng, Z.B.; Song, L.N.; Han, H.H.; et al. A strategy for precise and large scale identification of core fucosylated glycoproteins. Mol. Cell. Proteomics 2009, 8, 913–923. [Google Scholar]
  7. Kaji, H.; Saito, H.; Yamauchi, Y.; Shinkawa, T.; Taoka, M.; Hirabayashi, J.; Kasai, K.-I.; Takahashi, N.; Isobe, T. Lectin affinity capture, isotope-coded tagging and mass spectrometry to identify N-linked glycoproteins. Nat. Biotechnol. 2003, 21, 667–672. [Google Scholar] [CrossRef] [PubMed]
  8. Kuno, A.; Uchiyama, N.; Koseki-Kuno, S.; Ebe, Y.; Takashima, S.; Yamada, M.; Hirabayashi, J. Evanescent-field fluorescence-assisted lectin microarray: A new strategy for glycan profiling. Nat. Methods 2005, 2, 851–856. [Google Scholar] [CrossRef] [PubMed]
  9. Ohtsu, I.; Nakanisi, T.; Furuta, M.; Ando, E.; Nishimura, O. Direct matrix-assisted laser desorption/ionization time-of-flight mass spectrometric identification of proteins on membrane detected by western blotting and lectin blotting. J. Proteome Res. 2005, 4, 1391–1396. [Google Scholar] [CrossRef] [PubMed]
  10. Kumada, Y.; Ohigashi, Y.; Emori, Y.; Imamura, K.; Omura, Y.; Kishimoto, M. Improved lectin ELISA for glycosylation analysis of biomarkers using Ps-tag-fused single-chain Fv. J. Immunol. Methods 2012, 385, 15–22. [Google Scholar] [CrossRef] [PubMed]
  11. Takahashi, T.; Hagisawa, S.; Yoshikawa, K.; Tezuka, F.; Kaku, M.; Ohyama, C. Predictive value of N-acetylglucosaminyltransferase-V for superficial bladder cancer recurrence. J. Urol. 2006, 175, 90–93. [Google Scholar] [CrossRef] [PubMed]
  12. Ishimura, H.; Takahashi, T.; Nakagawa, H.; Nishimura, S.; Arai, Y.; Horikawa, Y.; Habuchi, T.; Miyoshi, E.; Kyan, A.; Hagisawa, S.; et al. N-acetylglucosaminyltransferase V and beta1–6 branching N-linked oligosaccharides are associated with good prognosis of patients with bladder cancer. Clin. Cancer Res. 2006, 12, 2506–2511. [Google Scholar]
  13. Videira, P.A.; Correia, M.; Malagolini, N.; Crespo, H.J.; Ligeiro, D.; Calais, F.M.; Trindade, H.; Dall’Olio, F. St3gal.I sialyltransferase relevance in bladder cancer tissues and cell lines. BMC Cancer 2009. [Google Scholar] [CrossRef]
  14. Furukawa, K.; Takamiya, K.; Okada, M.; Inoue, M.; Fukumoto, S.; Furukawa, K. Novel functions of complex carbohydrates elucidated by the mutant mice of glycosyltransferase genes. Biochim. Biophys. Acta 2001, 1525, 1–12. [Google Scholar] [CrossRef] [PubMed]
  15. Fukuda, M. Possible roles of tumor-associated carbohydrate antigens. Cancer Res. 1996, 56, 2237–2244. [Google Scholar]
  16. Hakomori, S. Glycosylation defining cancer malignancy: New wine in an old bottle. Proc. Natl. Acad. Sci. USA 2002, 99, 10231–10233. [Google Scholar] [CrossRef] [PubMed]
  17. Lau, K.S.; Dennis, J.W. N-glycans in cancer progression. Glycobiology 2008, 18, 750–760. [Google Scholar] [CrossRef] [PubMed]
  18. Miwa, H.E.; Koba, W.R.; Fine, E.J.; Giricz, O.; Kenny, P.A.; Stanley, P. Bisected, complex N-glycans and galectins in mouse mammary tumor progression and human breast cancer. Glycobiology 2013, 23, 1477–1490. [Google Scholar] [CrossRef] [PubMed]
  19. Thiery, J.P.; Acloque, H.; Huang, R.Y.; Nieto, M.A. Epithelial-mesenchymal transitions in development and disease. Cell 2009, 139, 871–890. [Google Scholar] [CrossRef] [PubMed]
  20. Quaggin, S.E.; Kapus, A. Scar wars: Mapping the fate of epithelial-mesenchymal-myofibroblast transition. Kidney Int. 2011, 80, 41–50. [Google Scholar] [CrossRef] [PubMed]
  21. Kalluri, R. Emt: When epithelial cells decide to become mesenchymal-like cells. J. Clin. Investig. 2009, 119, 1417–1419. [Google Scholar] [CrossRef] [PubMed]
  22. Guan, F.; Handa, K.; Hakomori, S. Specific glycosphingolipids mediate epithelial-to-mesenchymal transition of human and mouse epithelial cell lines. Proc. Natl. Acad. Sci. USA 2009, 106, 7461–7466. [Google Scholar] [CrossRef] [PubMed]
  23. Cheung, P.; Dennis, J.W. Mgat5 and Pten interact to regulate cell growth and polarity. Glycobiology 2007, 17, 767–773. [Google Scholar] [CrossRef] [PubMed]
  24. Xu, Q.; Isaji, T.; Lu, Y.; Gu, W.; Kondo, M.; Fukuda, T.; Du, Y.; Gu, J. Roles of N-acetylglucosaminyltransferase III in epithelial-to-mesenchymal transition induced by transforming growth factor β1 (TGF-β1) in epithelial cell lines. J. Biol. Chem. 2012, 287, 16563–16574. [Google Scholar] [CrossRef] [PubMed]
  25. Freire-de-Lima, L.; Gelfenbeyn, K.; Ding, Y.; Mandel, U.; Clausen, H.; Handa, K.; Hakomori, S. Involvement of O-glycosylation defining oncofetal fibronectin in epithelial-mesenchymal transition process. Proc. Natl. Acad. Sci. USA 2011, 108, 17690–17695. [Google Scholar] [CrossRef] [PubMed]
  26. Villar, E.; Calvo, P.; Cabezas, J.A. Comparative studies on blood serum alpha-l-fucosidases from several mammalian species. Comp. Biochem. Phys. B 1978, 60, 459–461. [Google Scholar] [CrossRef]
  27. Przybylo, M.; Hoja-Lukowicz, D.; Litynska, A.; Laidler, P. Different glycosylation of cadherins from human bladder non-malignant and cancer cell lines. Cancer Cell Int. 2002. [Google Scholar] [CrossRef]
  28. Litynska, A.; Pochec, E.; Hoja-Lukowicz, D.; Kremser, E.; Laidler, P.; Amoresano, A.; Monti, C. The structure of the oligosaccharides of alpha3beta1 integrin from human ureter epithelium (HCV29) cell line. Acta Biochim. Pol. 2002, 49, 491–500. [Google Scholar] [PubMed]
  29. Przybylo, M.; Litynska, A.; Pochec, E. Different adhesion and migration properties of human HCV29 non-malignant urothelial and T24 bladder cancer cells: Role of glycosylation. Biochimie 2005, 87, 133–142. [Google Scholar] [CrossRef] [PubMed]
  30. Tan, Z.; Lu, W.; Li, X.; Yang, G.; Guo, J.; Yu, H.; Li, Z.; Guan, F. Altered N-glycan expression profile in epithelial-to-mesenchymal transition of NMuMG cells revealed by an integrated strategy using mass spectrometry and glycogene and lectin microarray analysis. J. Proteome Res. 2014, 13, 2783–2795. [Google Scholar] [CrossRef]
  31. Goldman, R.; Ressom, H.W.; Varghese, R.S.; Goldman, L.; Bascug, G.; Loffredo, C.A.; Abdel-Hamid, M.; Gouda, I.; Ezzat, S.; Kyselova, Z.; et al. Detection of hepatocellular carcinoma using glycomic analysis. Clin. Cancer Res. 2009, 15, 1808–1813. [Google Scholar]
  32. Zhao, Y.Y.; Takahashi, M.; Gu, J.G.; Miyoshi, E.; Matsumoto, A.; Kitazume, S.; Taniguchi, N. Functional roles of N-glycans in cell signaling and cell adhesion in cancer. Cancer Sci. 2008, 99, 1304–1310. [Google Scholar] [CrossRef] [PubMed]
  33. Mechref, Y.; Novotny, M.V.; Krishnan, C. Structural characterization of oligosaccharides using MALDI-TOF/TOF tandem mass spectrometry. Anal. Chem. 2003, 75, 4895–4903. [Google Scholar] [CrossRef] [PubMed]
  34. Moremen, K.W.; Touster, O. Biosynthesis and modification of golgi mannosidase II in Hela and 33 cells. J. Biol. Chem. 1985, 260, 6654–6662. [Google Scholar] [PubMed]
  35. Moremen, K.W.; Touster, O.; Robbins, P.W. Novel purification of the catalytic domain of golgi alpha-mannosidase II. Characterization and comparison with the intact enzyme. J. Biol. Chem. 1991, 266, 16876–16885. [Google Scholar]
  36. Moremen, K.W.; Robbins, P.W. Isolation, characterization, and expression of cDNAs encoding murine alpha-mannosidase II, a golgi enzyme that controls conversion of high mannose to complex N-glycans. J. Cell Biol. 1991, 115, 1521–1534. [Google Scholar] [CrossRef] [PubMed]
  37. Misago, M.; Liao, Y.F.; Kudo, S.; Eto, S.; Mattei, M.G.; Moremen, K.W.; Fukuda, M.N. Molecular cloning and expression of cDNAs encoding human alpha-mannosidase II and a previously unrecognized alpha-mannosidase IIx isozyme. Proc. Natl. Acad. Sci. USA 1995, 92, 11766–11770. [Google Scholar] [CrossRef] [PubMed]
  38. Schachter, H. Congenital disorders involving defective N-glycosylation of proteins. Cell. Mol. Life Sci. 2001, 58, 1085–1104. [Google Scholar] [CrossRef] [PubMed]
  39. Moremen, K.W. Golgi alpha-mannosidase II deficiency in vertebrate systems: Implications for asparagine-linked oligosaccharide processing in mammals. Biochim. Biophys. Acta 2002, 1573, 225–235. [Google Scholar] [CrossRef] [PubMed]
  40. Chui, D.; Sellakumar, G.; Green, R.; Sutton-Smith, M.; McQuistan, T.; Marek, K.; Morris, H.; Dell, A.; Marth, J. Genetic remodeling of protein glycosylation in vivo induces autoimmune disease. Proc. Natl. Acad. Sci. USA 2001, 98, 1142–1147. [Google Scholar] [CrossRef]
  41. Johnson, S.W.; Alhadeff, J.A. Mammalian alpha-l-fucosidases. Comp. Biochem. Phys. B 1991, 99, 479–488. [Google Scholar]
  42. Misonou, Y.; Shida, K.; Korekane, H.; Seki, Y.; Noura, S.; Ohue, M.; Miyamoto, Y. Comprehensive clinico-glycomic study of 16 colorectal cancer specimens: Elucidation of aberrant glycosylation and its mechanistic causes in colorectal cancer cells. J. Proteome Res. 2009, 8, 2990–3005. [Google Scholar] [CrossRef] [PubMed]
  43. Muinelo-Romay, L.; Gil-Martin, E.; Fernandez-Briera, A. Alpha(1,2)fucosylation in human colorectal carcinoma. Oncol. Lett. 2010, 1, 361–366. [Google Scholar] [PubMed]
  44. Straus, A.H.; Carter, W.G.; Wayner, E.A.; Hakomori, S. Mechanism of fibronectin-mediated cell migration: Dependence or independence of cell migration susceptibility on RGDS-directed receptor (integrin). Exp. Cell Res. 1989, 183, 126–139. [Google Scholar] [CrossRef]
  45. Yu, H.; Zhu, M.; Qin, Y.; Zhong, Y.; Yan, H.; Wang, Q.; Bian, H.; Li, Z. Analysis of glycan-related genes expression and glycan profiles in mice with liver fibrosis. J. Proteome Res. 2012, 11, 5277–5285. [Google Scholar] [CrossRef] [PubMed]
  46. Qin, Y.; Zhong, Y.; Dang, L.; Zhu, M.; Yu, H.; Chen, W.; Cui, J.; Bian, H.; Li, Z. Alteration of protein glycosylation in human hepatic stellate cells activated with transforming growth factor-β1. J. Proteome Res. 2012, 75, 4114–4123. [Google Scholar] [CrossRef]
  47. Yang, G.; Cui, T.; Wang, Y.; Sun, S.; Ma, T.; Wang, T.; Chen, Q.; Li, Z. Selective isolation and analysis of glycoprotein fractions and their glycomes from hepatocellular carcinoma sera. Proteomics 2013, 13, 1481–1498. [Google Scholar] [CrossRef] [PubMed]
  48. Smyth, G.K. Linear models and empirical bayes methods for assessing differential expression in microarray experiments. Stat. Appl. Genet. Mol. 2004. [Google Scholar] [CrossRef]
  49. Guan, F.; Schaffer, L.; Handa, K.; Hakomori, S. Functional role of gangliotetraosylceramide in epithelial-to-mesenchymal transition process induced by hypoxia and by TGF-β. FASEB J. 2010, 24, 4889–4903. [Google Scholar] [CrossRef] [PubMed]
  • Sample Availability: Samples of the compounds are not available from the authors.

