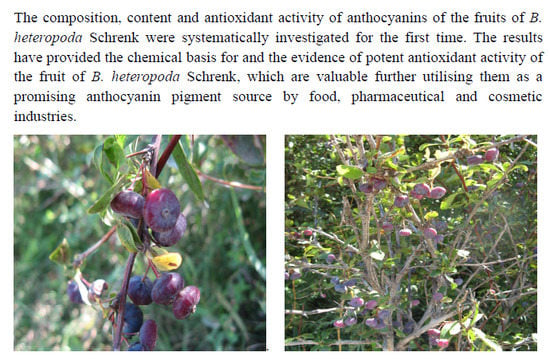
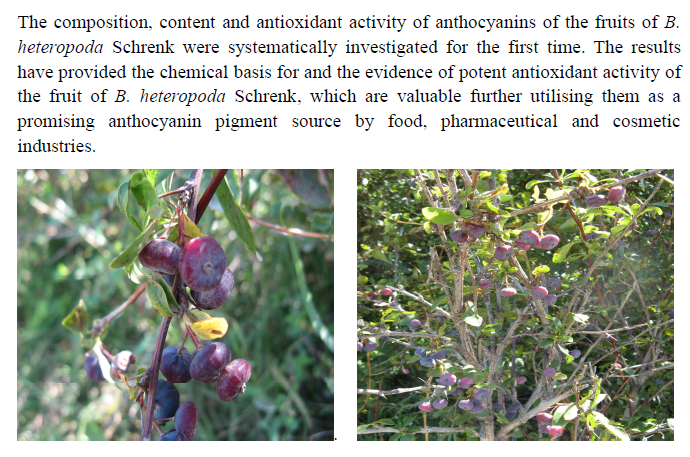
Composition and Antioxidant Activity of the Anthocyanins of the Fruit of Berberis heteropoda Schrenk

Abstract
:
1. Introduction
2. Results and Discussion
2.1. Total Anthocyanin Content (TAC)
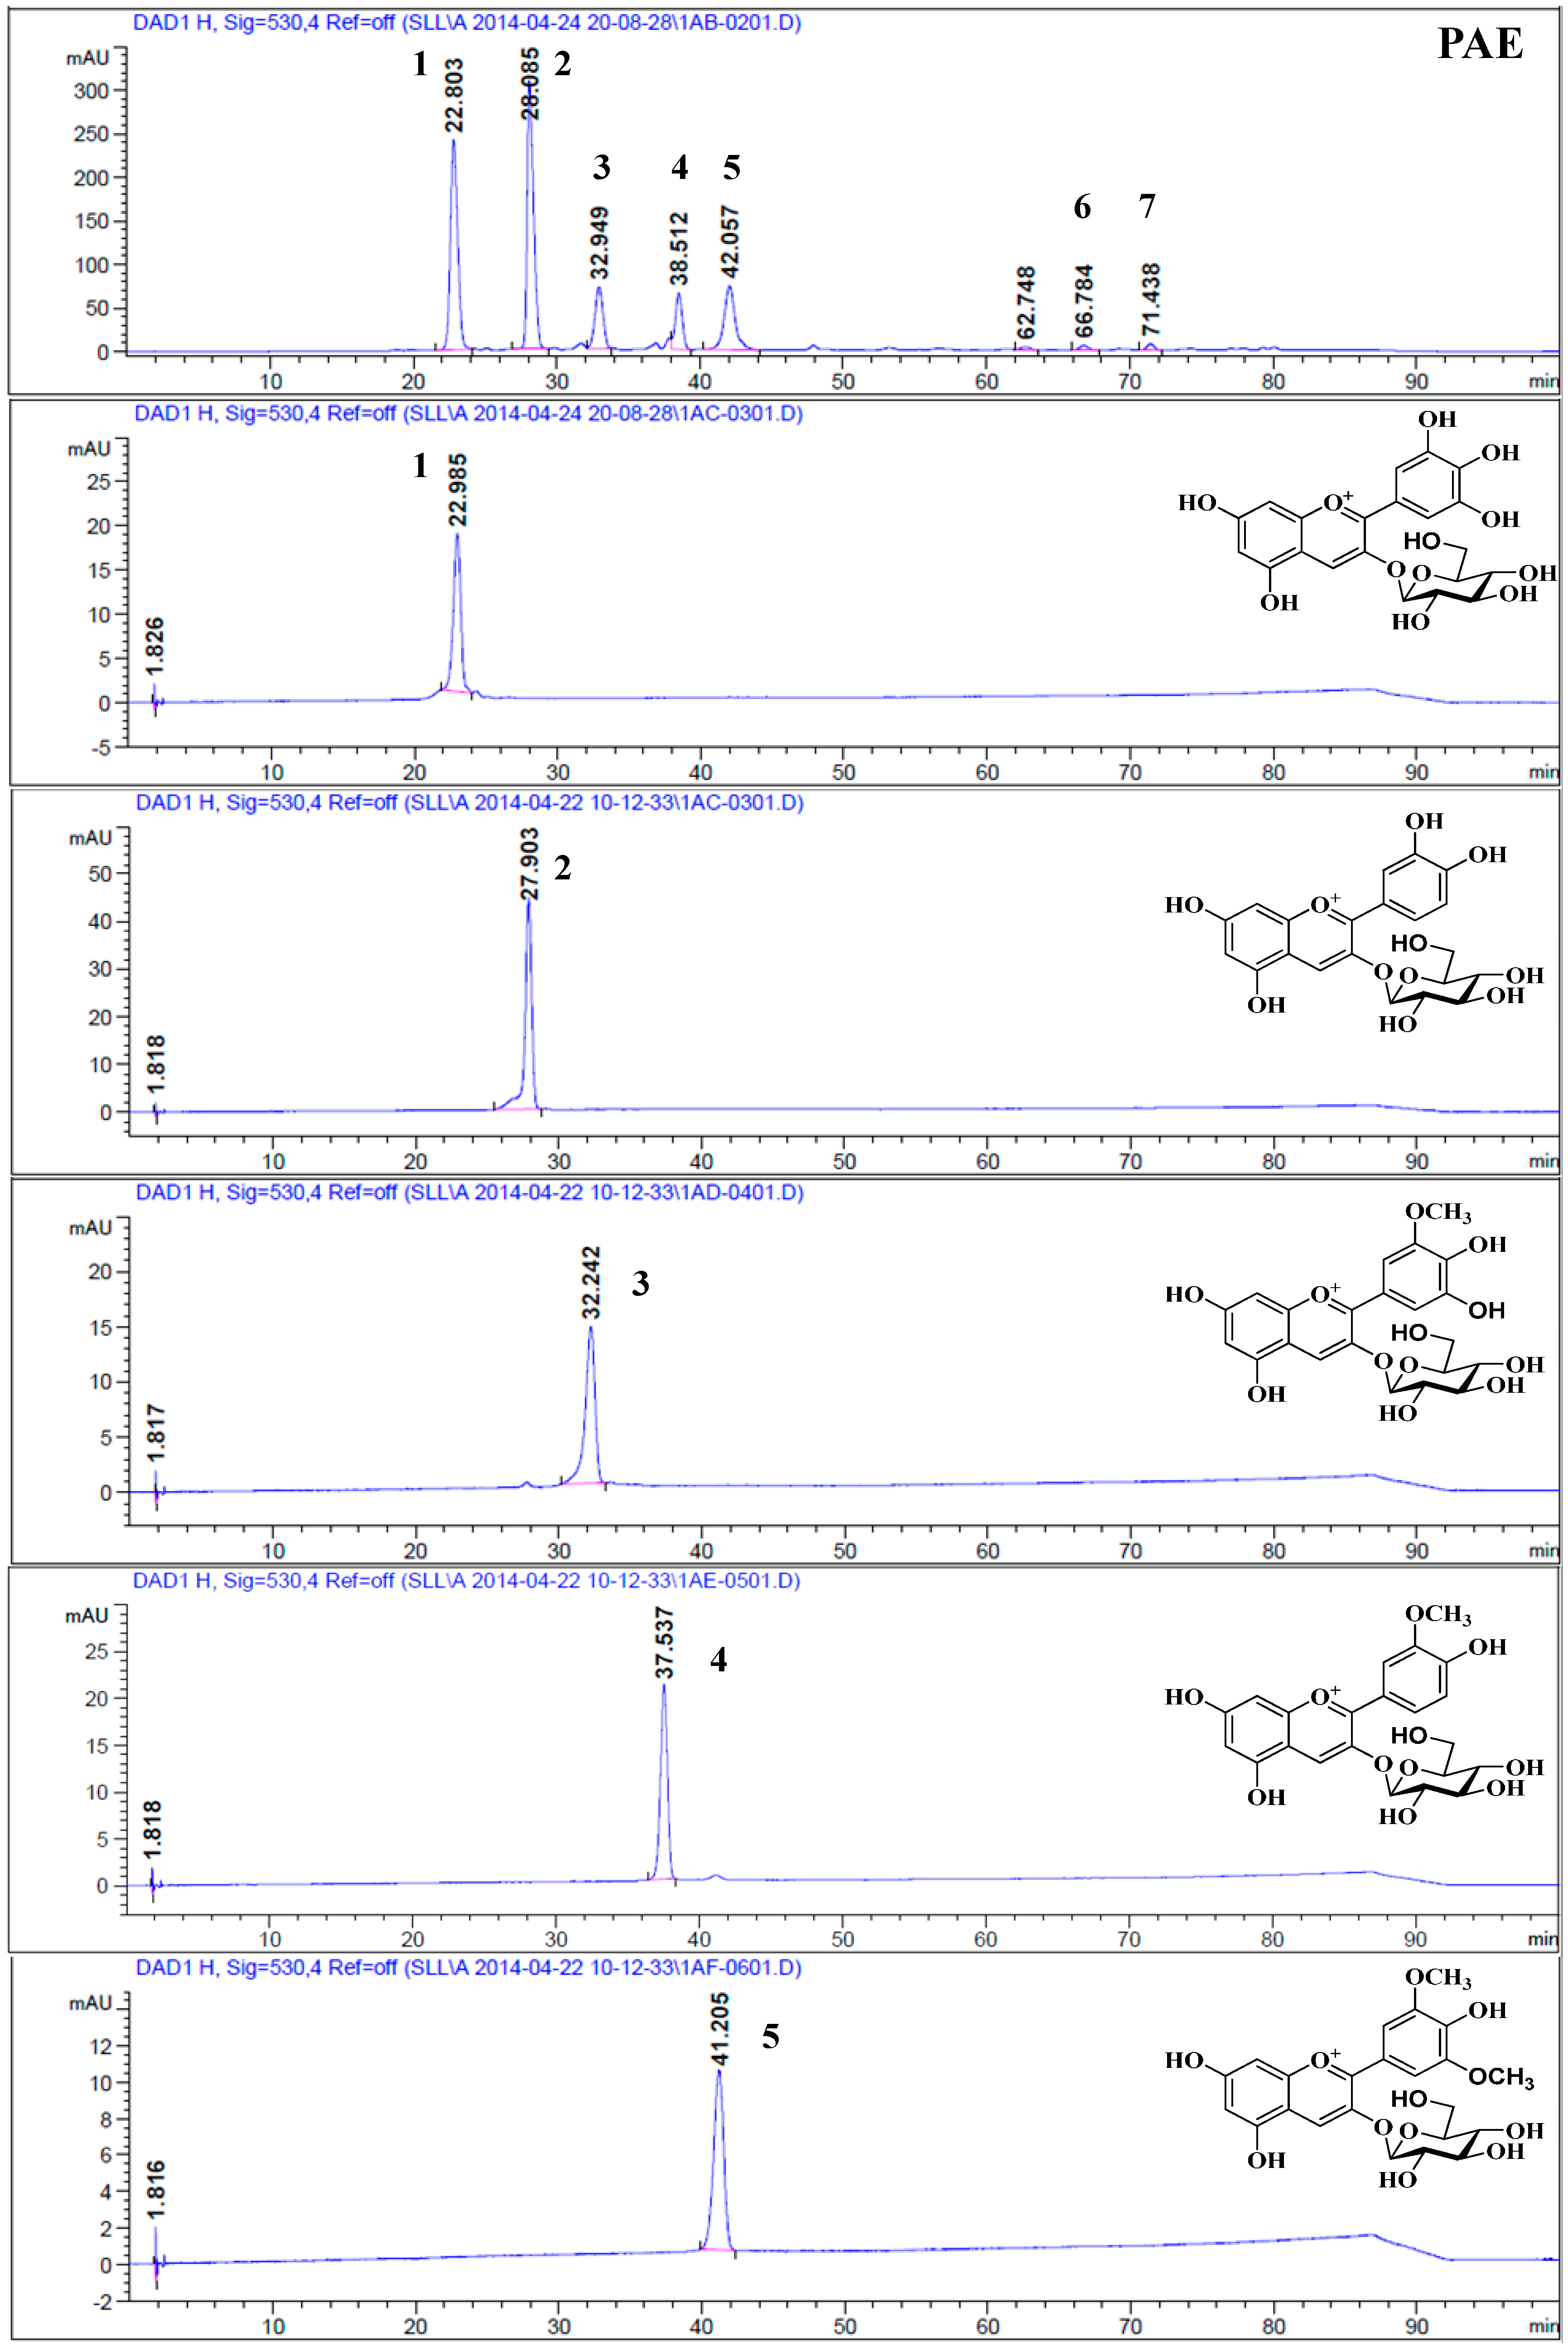
2.2. HPLC Analysis

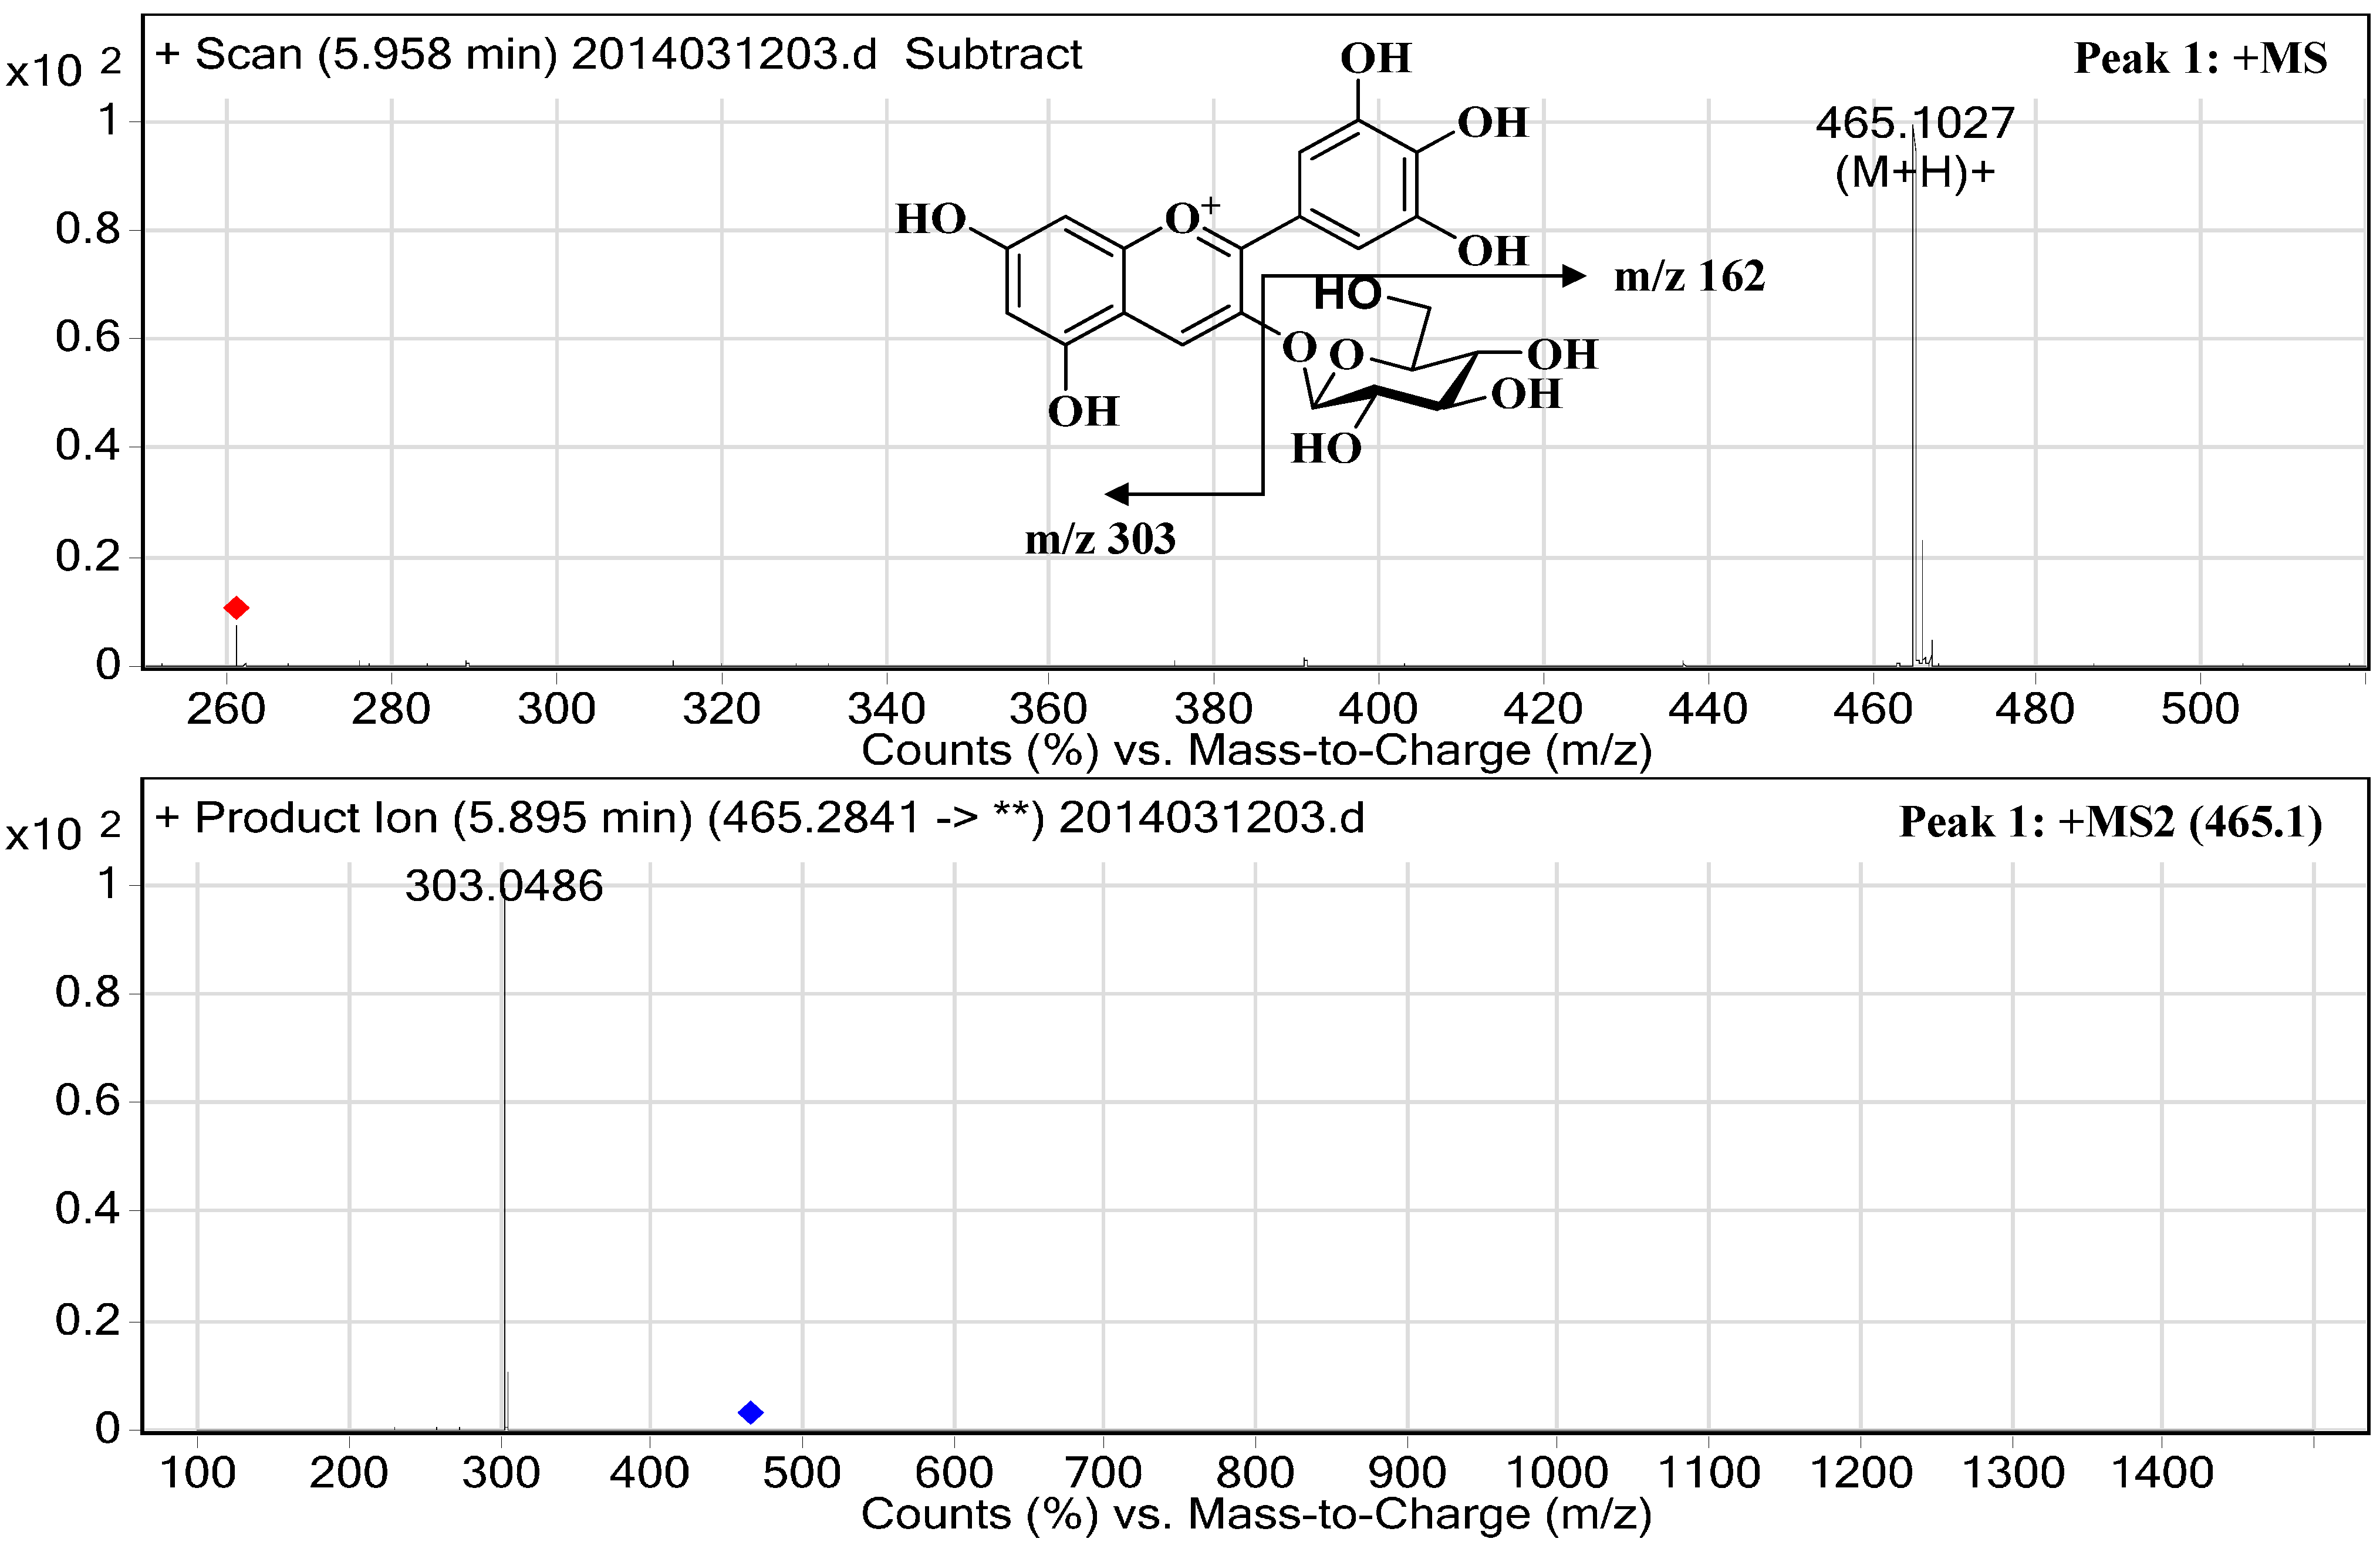
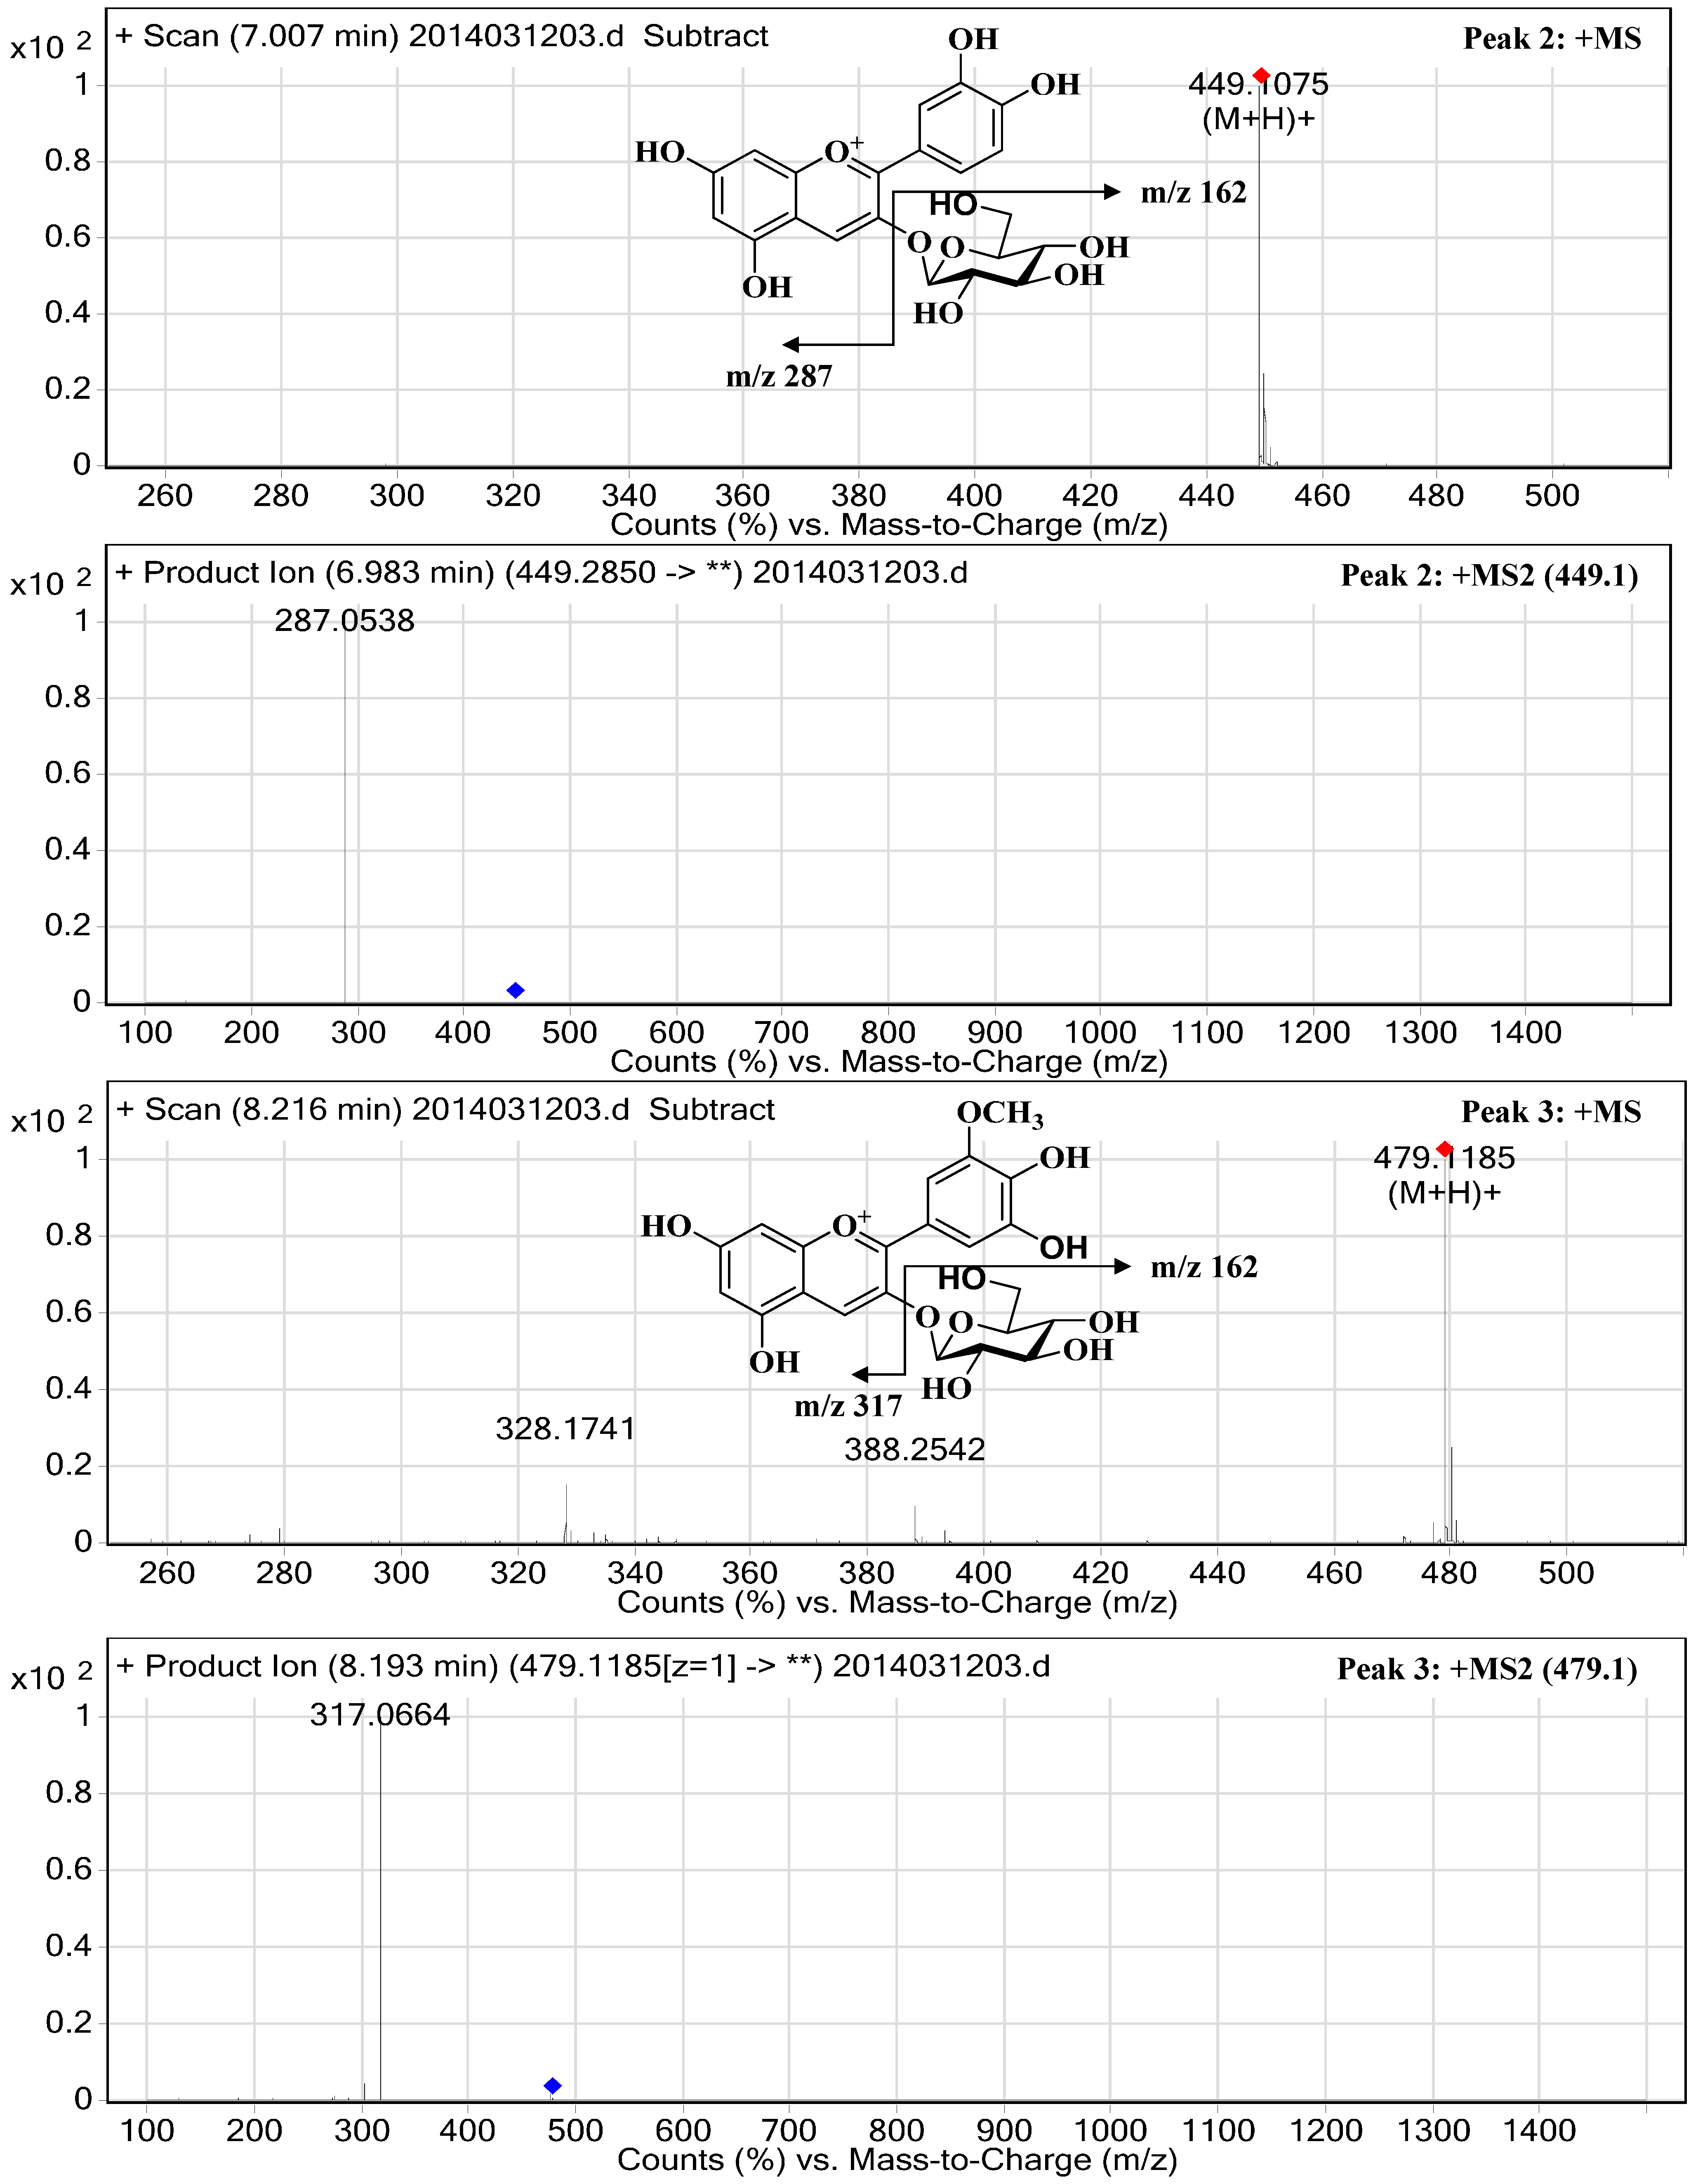
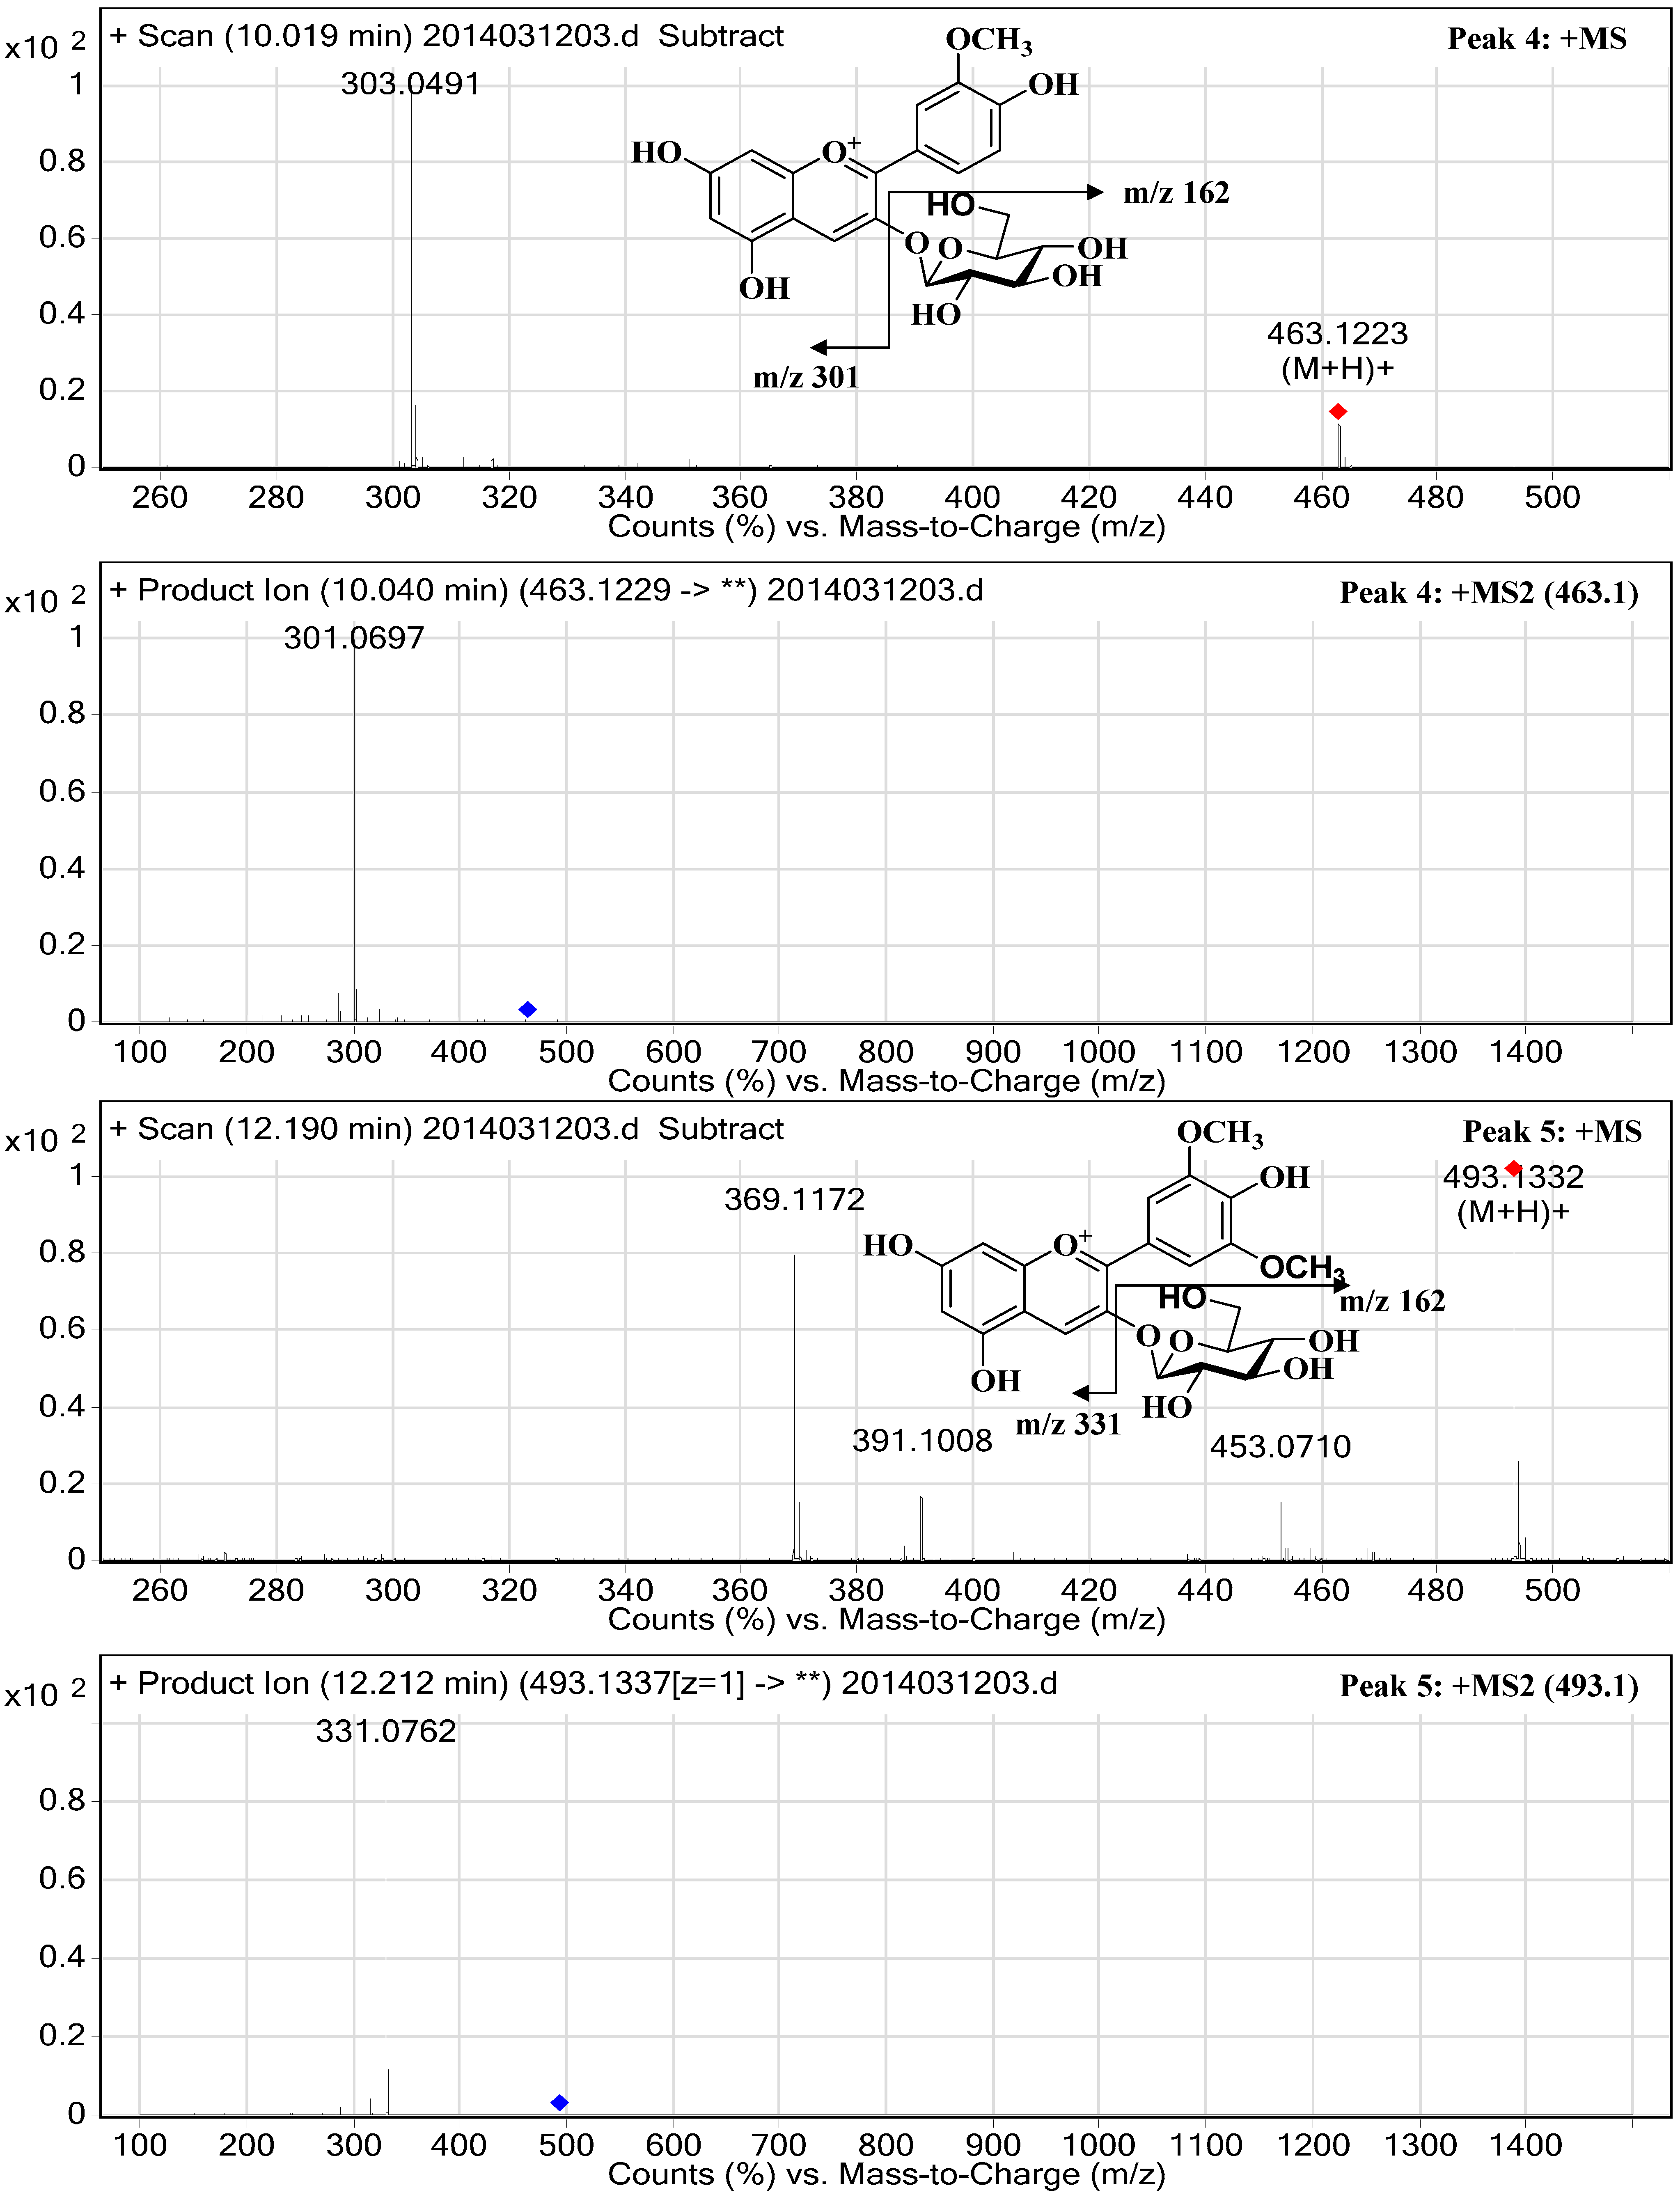
2.3. Structural Elucidation


| Peak a | tR (min) HPLC | (%) HPLC | λmax (nm) | tR (min) HPLC-HR-ESI-MS/MS | M+ (m/z) | Fragment Ions (m/z) | Compound | Contents b (mg/100 g Fresh Fruits) |
|---|---|---|---|---|---|---|---|---|
| 1 | 22.38 | 30.34 | 524/278 | 5.96 | 465.1027 | 303.0486 | Delphinidin-3-O-glucopyranoside | 617.84 ± 0.98 |
| 2 | 27.54 | 33.47 | 516/280 | 7.01 | 449.1075 | 287.0538 | Cyanidin-3-O-glucopyranoside | 681.58 ± 1.13 |
| 3 | 34.42 | 10.55 | 527/278 | 8.22 | 479.1185 | 317.0664 | Petunidin-3-O-glucopyranoside | 212.59 ± 1.79 |
| 4 | 37.88 | 8.53 | 520/280 | 10.02 | 463.1223 | 301.0697 | Peonidin-3-O-glucopyranoside | 173.65 ± 0.66 |
| 5 | 41.48 | 13.77 | 528/278 | 12.20 | 493.1332 | 331.0762 | Malvidin-3-O-glucopyranoside | 279.83 ± 0.60 |
| 6 | 78.83 | 0.16 | 520/280 | 26.12 | 301.0704 | - | Peonidin | 3.29 ± 0.05 |
| 7 | 79.52 | 0.22 | 530/278 | 27.38 | 331.0803 | - | Malvidin | 4.49 ± 0.06 |
| Position | 1 | 2 | 3 | 4 | 5 | |||||
|---|---|---|---|---|---|---|---|---|---|---|
| δH a | δC c | δH a | δC d | δH b | δC d | δH a | δC c | δH a | δC d | |
| 2 | 164.1 | 164.4 | 164.0 | 164.1 | 163.0 | |||||
| 3 | 144.9 | 145.6 | 145.1 | 145.5 | 145.3 | |||||
| 4 | 8.91 (s) | 136.4 | 9.00 (s) | 137.1 | 8.98 (s) | 136.9 | 9.02 (s) | 137.4 | 9.02 (s) | 137.3 |
| 5 | 159.6 | 159.6 | 159.0 | 158.8 | 158.9 | |||||
| 6 | 6.63 (d, 1.5) | 103.9 | 6.65 (d, 1.5) | 103.8 | 6.67 (d, 1.2) | 103.6 | 6.66 (d, 1.5) | 103.5 | 6.67 (d, 0.5) | 103.1 |
| 7 | 170.8 | 170.7 | 170.7 | 170.9 | 170.9 | |||||
| 8 | 6.82 (d, 1.5) | 95.4 | 6.87 (d, 1.0) | 95.2 | 6.88 (d, 0.6) | 95.2 | 6.89 (d, 1.5) | 95.3 | 6.93 (d, 0.5) | 95.4 |
| 9 | 157.9 | 157.8 | 157.8 | 157.9 | 157.9 | |||||
| 10 | 112.9 | 113.8 | 113.6 | 113.6 | 112.9 | |||||
| 1’ | 120.3 | 121.3 | 120.1 | 121.1 | 119.9 | |||||
| 2' | 7.71 (s) | 113.6 | 8.05 (d, 2.0) | 118.6 | 7.90 (d, 1.8) | 109.2 | 8.19 (d, 1.5) | 115.2 | 7.97 (s) | 110.6 |
| 3’ | 147.7 | 147.4 | 149.9 | 149.6 | 149.8 | |||||
| 4’ | 146.1 | 155.7 | 145.7 | 156.5 | 164.4 | |||||
| 5' | 147.7 | 7.02 (d, 8.5) | 117.3 | 147.4 | 7.05 (d, 9.0) | 117.6 | 149.8 | |||
| 6' | 7.71 (s) | 113.6 | 8.23 (dd, 9.0, 2.5) | 128.1 | 7.81 (d, 1.8) | 112.9 | 8.23 (dd, 8.5, 2.0) | 128.9 | 7.97 (s) | 110.6 |
| 3'-O Me | 3.98 (s) | 57.3 | 3.99 (s) | 56.7 | 3.99 (s) | 56.7 | ||||
| 5'-O Me | 3.99 (s) | 56.7 | ||||||||
| 1'' | 5.30 (d, 7.5) | 103.7 | 5.28 (d, 7.5) | 104.1 | 5.32 (d, 7.8) | 103.8 | 5.29 (overlap) | 103.9 | 5.33 (overlap) | 103.9 |
| 2'' | 3.77 (m) | 75.0 | 3.73 (m) | 74.8 | 3.70 (m) | 74.9 | 3.67 (m) | 74.9 | 3.71 (m) | 74.9 |
| 3'' | 3.61 (m) | 78.3 | 3.56 (m) | 78.1 | 3.57 (m) | 78.2 | 3.60 (m) | 78.2 | 3.60 (m) | 78.1 |
| 4'' | 3.50 (m) | 71.3 | 3.46 (m) | 71.1 | 3.47 (m) | 71.1 | 3.47 (m) | 71.2 | 3.47 (m) | 71.3 |
| 5'' | 3.61 (m) | 79.0 | 3.56 (m) | 78.7 | 3.57 (m) | 78.8 | 3.60 (m) | 78.8 | 3.60 (m) | 77.8 |
| 6''a | 3.94 (dd, 12.0, 1.5) | 62.6 | 3.92 (dd, 12.0, 2.0) | 62.4 | 3.94 (dd, 9.0, 3.0) | 62.3 | 3.93 (dd, 10.0, 2.0) | 62.4 | 3.92 (dd, 9.5, 1.5) | 62.3 |
| 6''b | 3.77 (dd, 12.5, 5.0) | 3.73 (dd, 12.0, 4.5) | 3.74 (dd, 12.0, 6.0) | 3.72 (dd, 12.5, 6.0) | 3.77 (dd,12.0, 6.0) | |||||
2.4. Antioxidant Activity
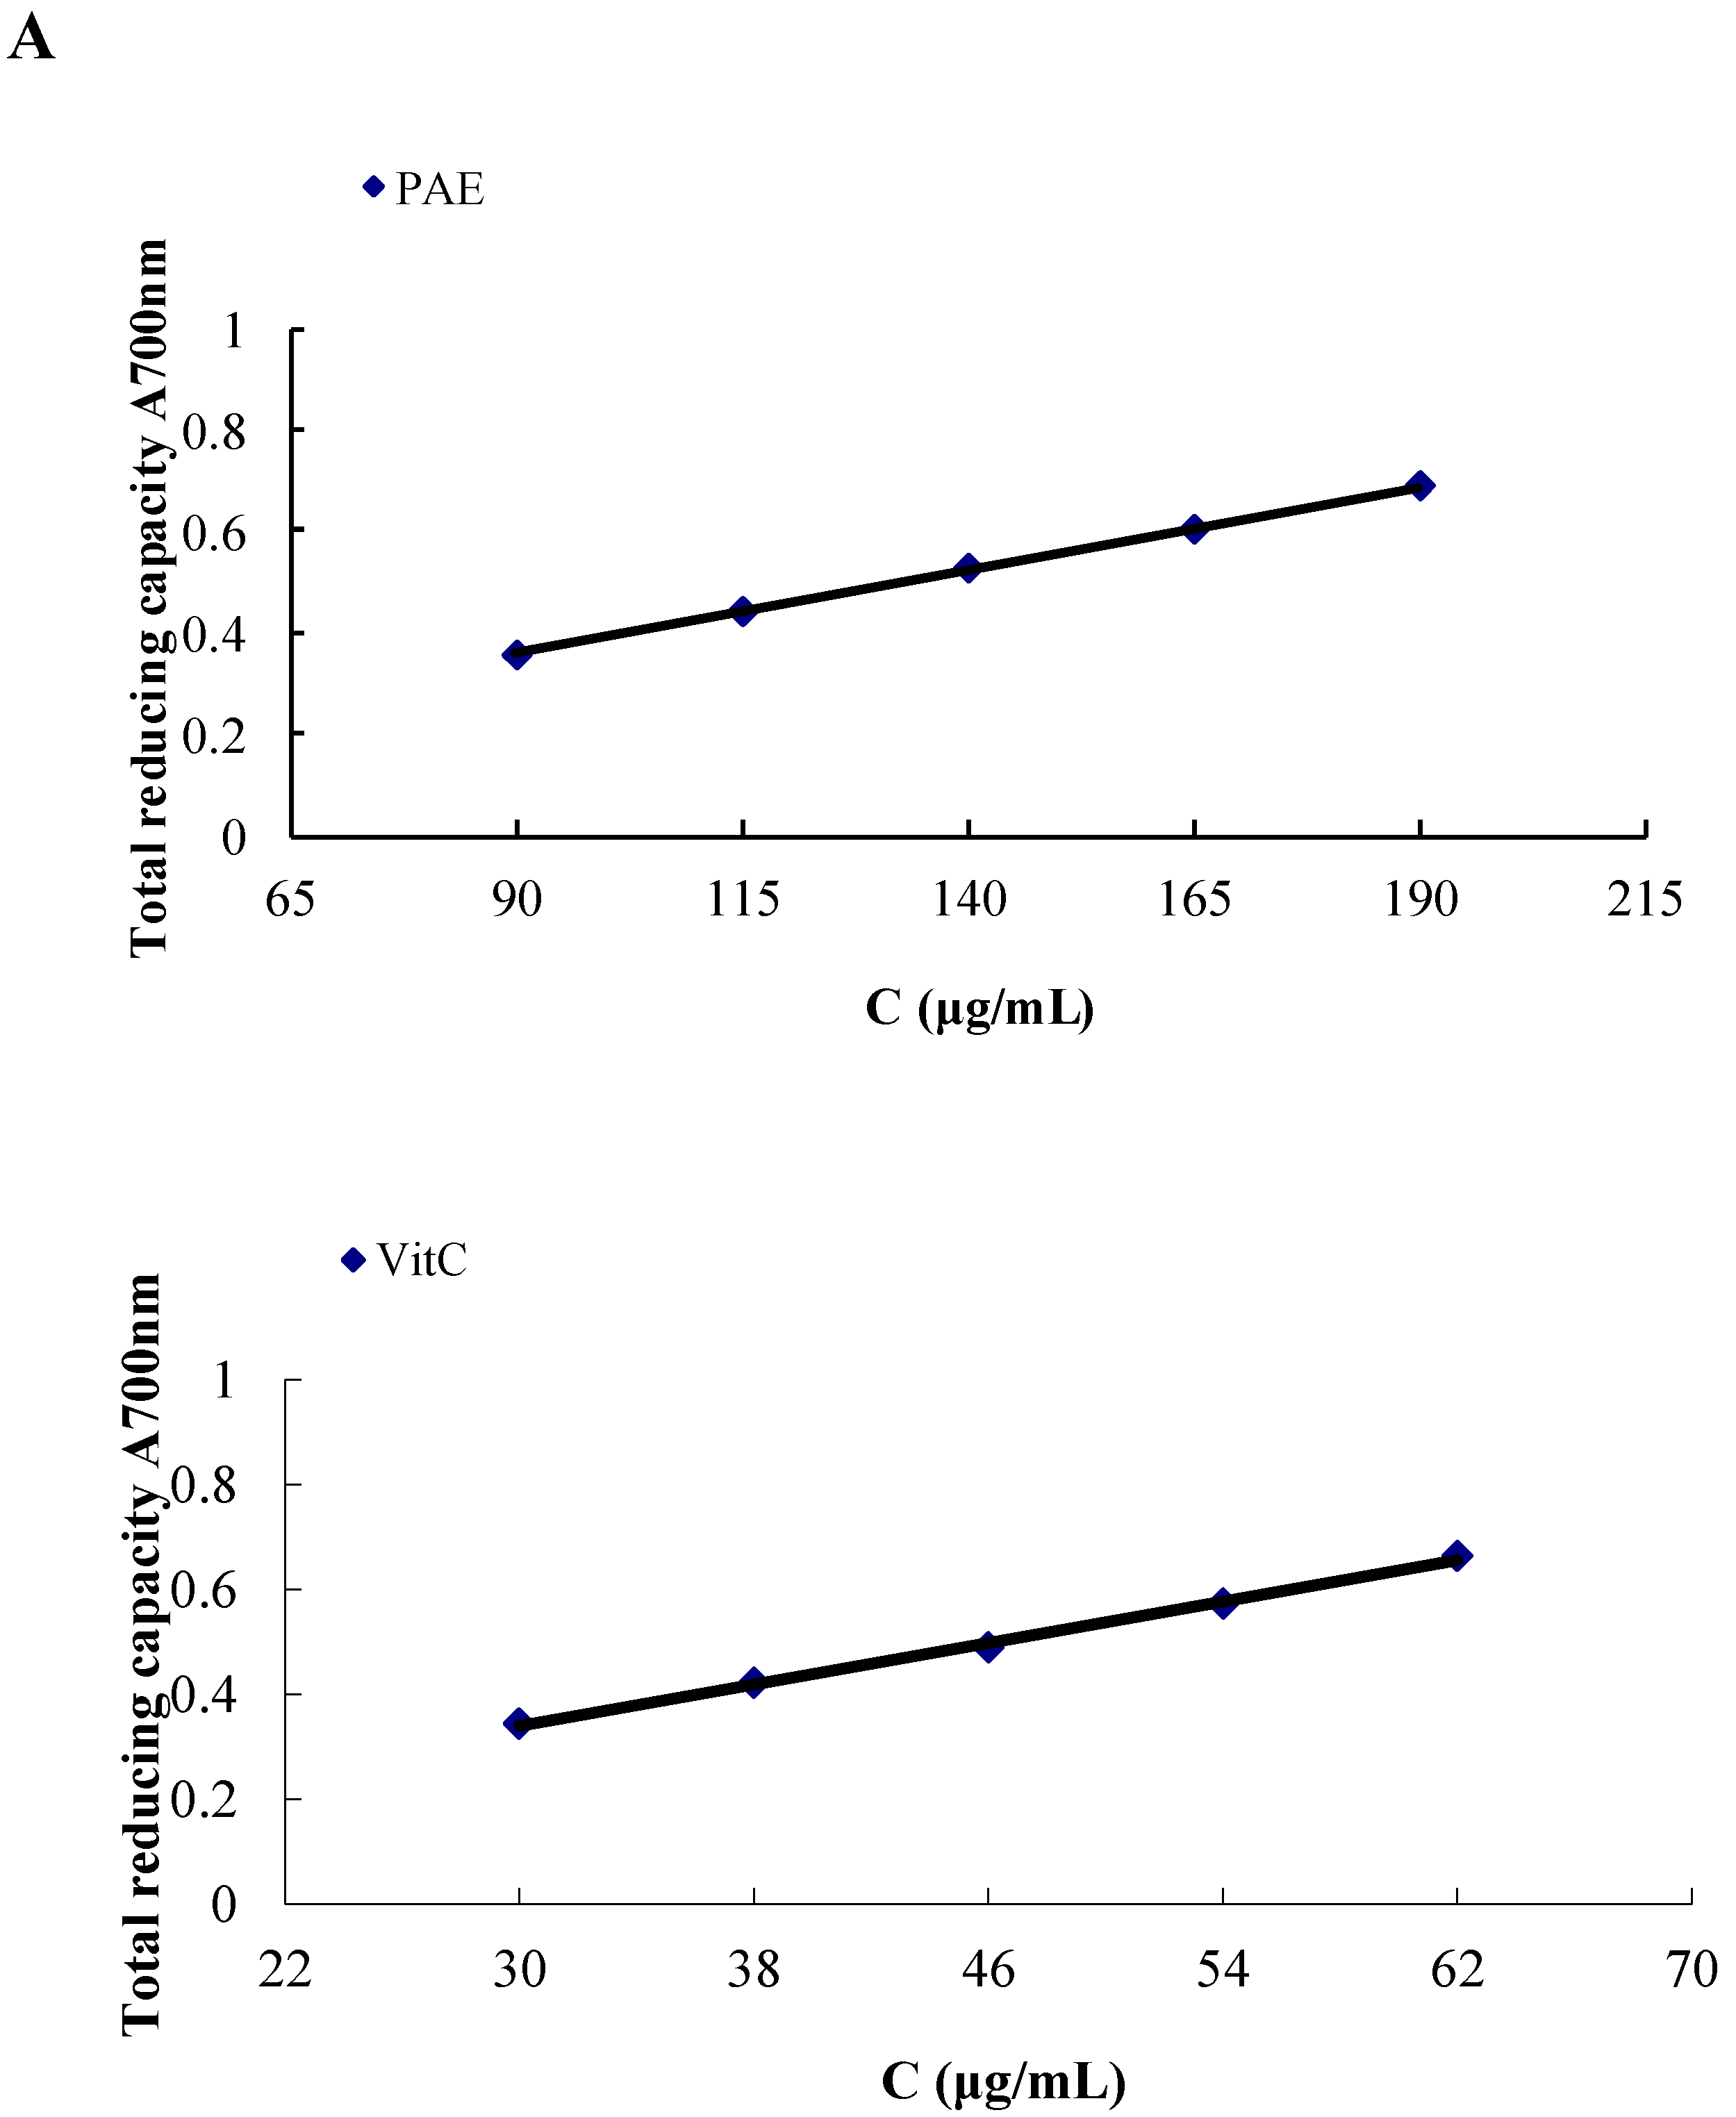
2.4.1. Total Reducing Capacity of the PAE


| Samples | A700 nm = 0.5/Total Reducing Power (μg/mL) a | IC50/DPPH (μg/mL) b |
|---|---|---|
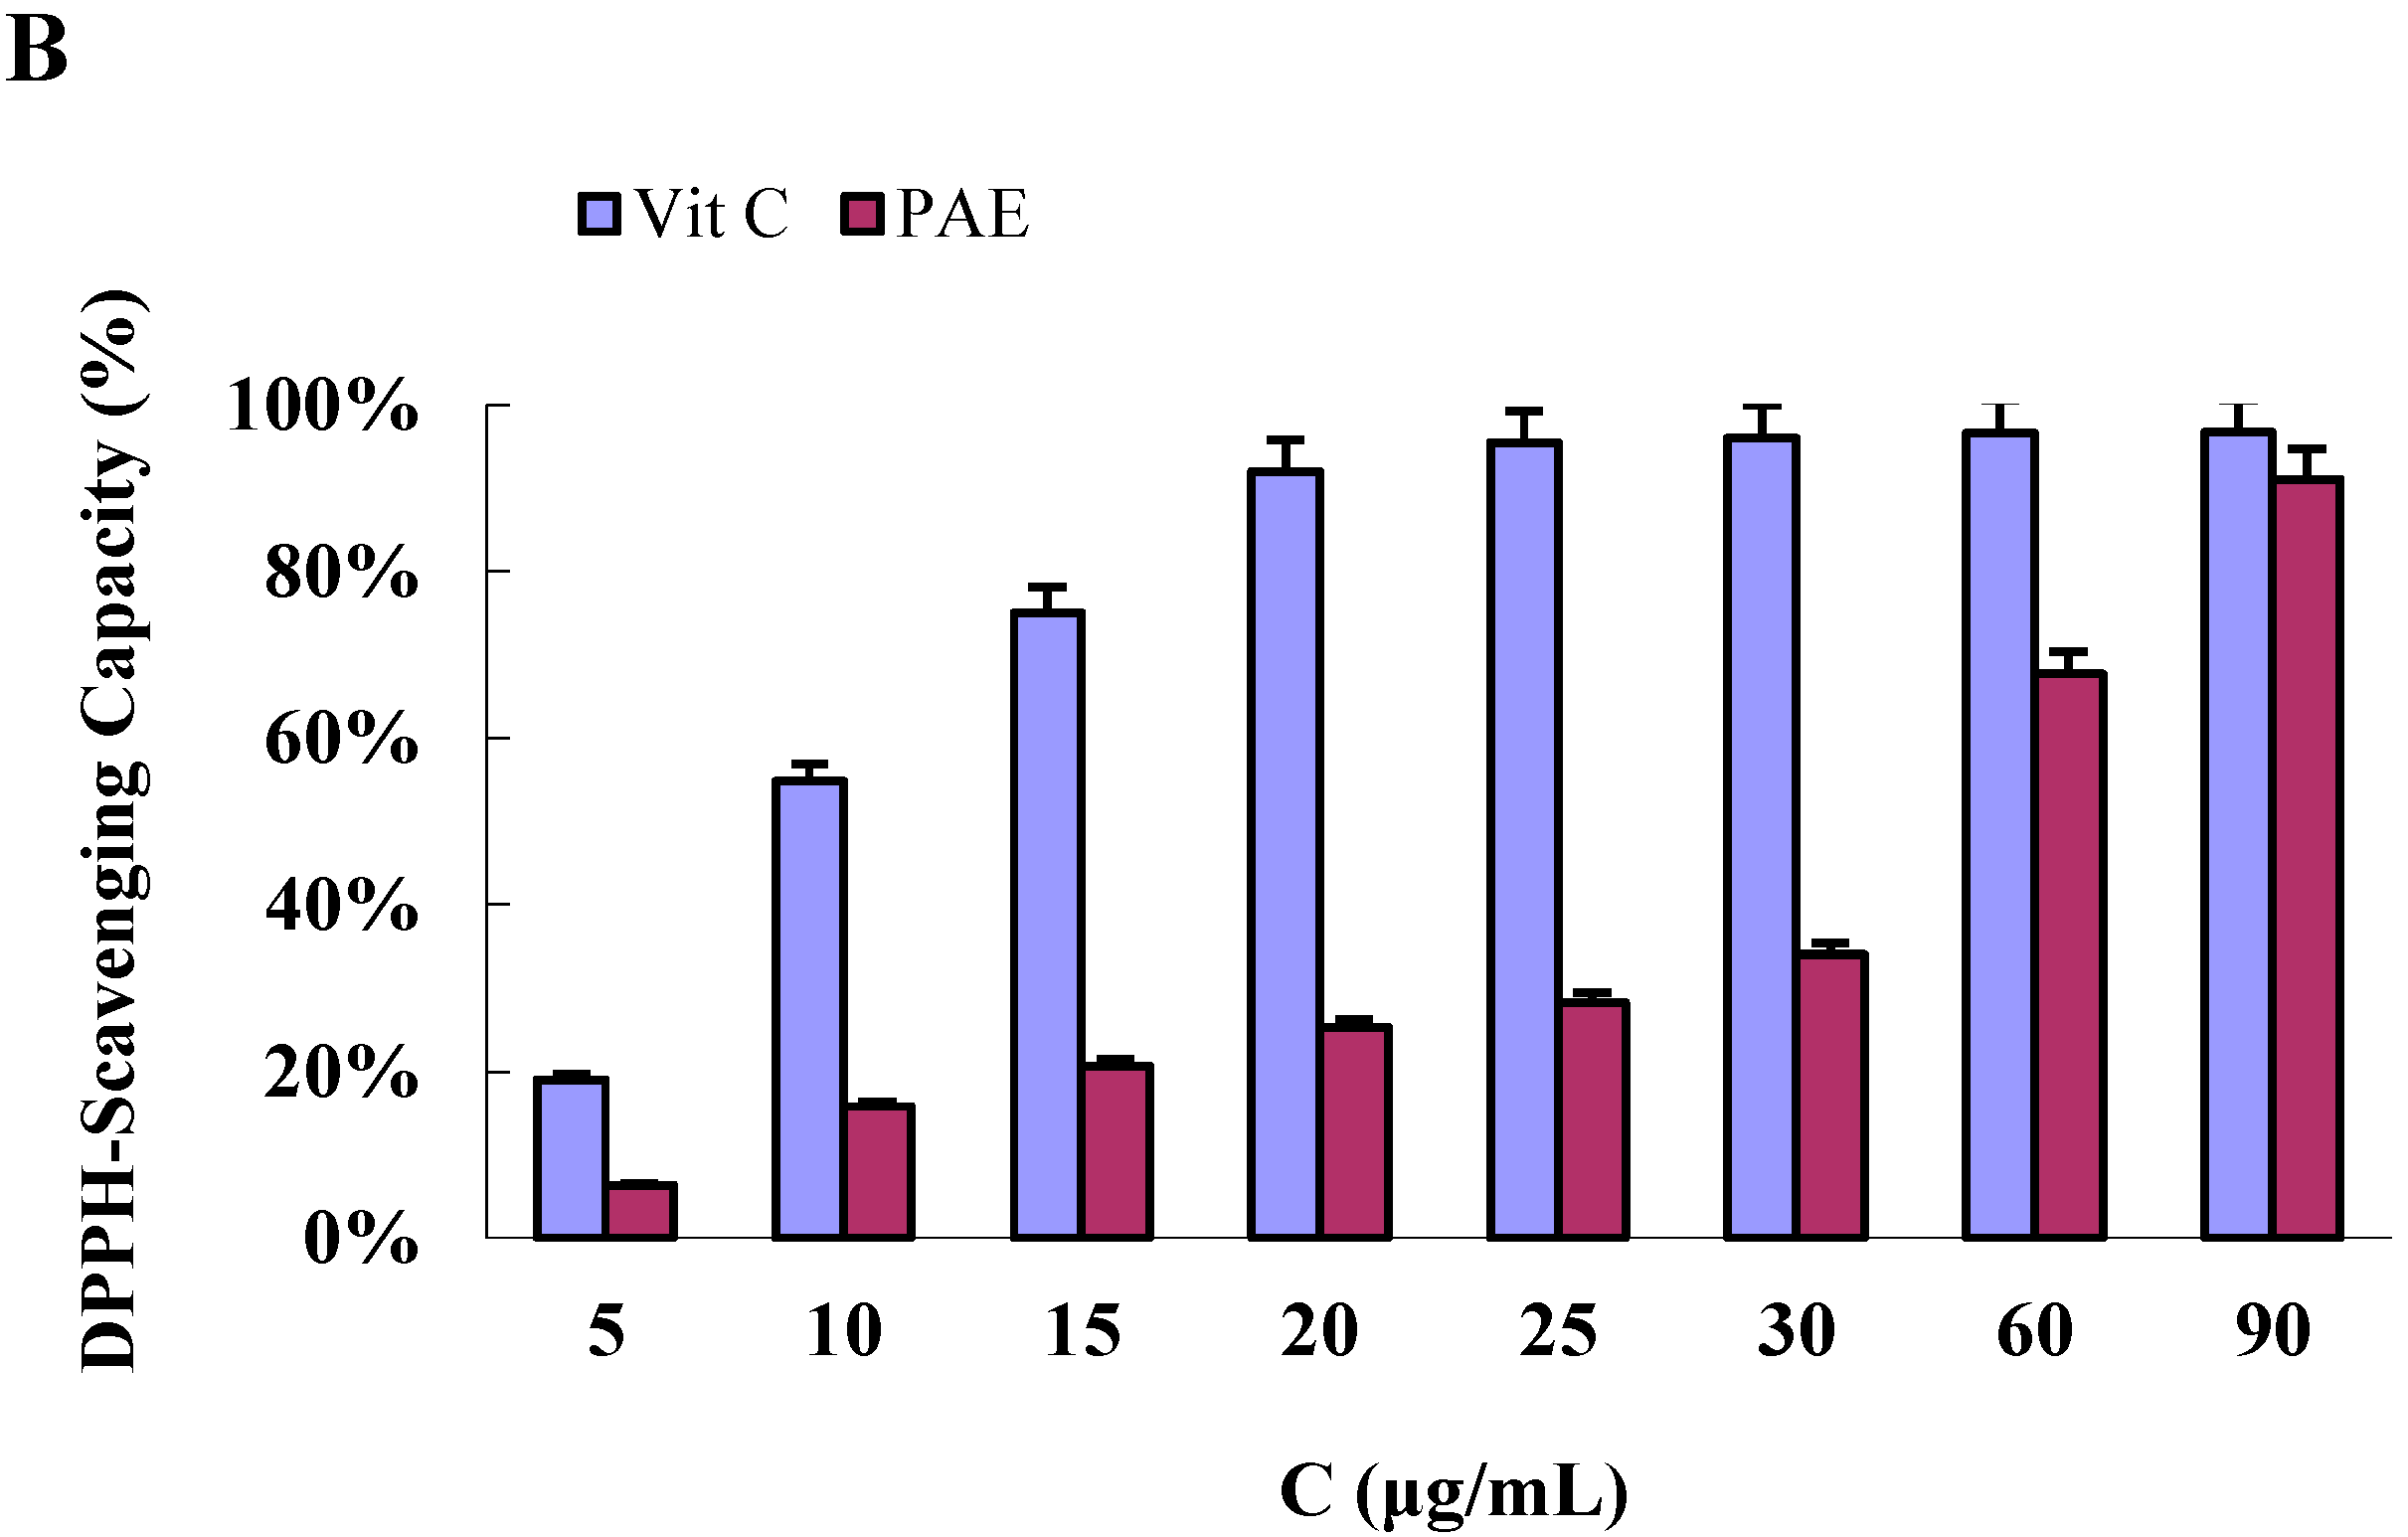
| PAE | 139.65 ± 0.01 | 47.16 ± 0.35 |
| Ascorbic acid | 46.12 ± 0.04 | 9.30 ± 0.21 |
| Samples | FRAP value (mmol/g) | TEAC/ABTS |
| PAE | 4.32 ± 0.03 | 2.250 ± 0.17 |
| Trolox | 7.007 ± 0.14 | - |
2.4.2. DPPH Radical-Scavenging Activity of the PAE
2.4.3. Ferric-Reducing Antioxidant Power (FRAP) of the PAE
2.4.4. ABTS+ Radical-Scavenging Activity of the PAE
3. Experimental Section
3.1. Plant Material
3.2. Reagents and Apparatus
3.3. Extraction and Primary Purification of the Anthocyanins
3.4. Isolation and Identification of the Main Anthocyanins in the PAE
3.4.1. Isolation
3.4.2. NMR Identification
3.5. Total Anthocyanin Content
3.6. HPLC-DAD Analysis
3.7. HPLC-DAD-HR-ESI-MS/MS
3.8. Antioxidant Activity
3.8.1. Total Reducing Capacity Assay
3.8.2. DPPH Radical-Scavenging Activity Assay
3.8.3. Ferric-Reducing Antioxidant Power (FRAP) Assay
3.8.4. ABTS+ Radical-Scavenging Capacity Assay
3.9. Statistical Analysis
4. Conclusions
Supplementary Materials
Acknowledgments
Author Contributions
Conflicts of Interest
References
- Xu, X.; Baharguli, H. (Eds.) Kazak Medicine Blog, 1st ed.; The Ethnic Publishing House: Beijing, China, 2009; Volume 1, p. 156.
- Teng, Y.; Zhang, G.Q.; Peng, Z.M. Research on Berberis heteropoda Schrenk Red Pigment Extraction and Its Stability. Food Sci. 2007, 28, 67–70. [Google Scholar]
- Ministry of Health of Forces Logistics of Xinjiang. Handbook of Chinese Herbal of Xinjiang; People’s Publishing House: Xinjiang, China, 1970; pp. 153–283.
- Zheng, J.; Ding, C.X.; Wang, L.S.; Li, G.L.; Shi, J.Y.; Li, H.; Wang, H.L.; Suo, Y.R. Anthocyanins composition and antioxidant activity of wild Lycium ruthenicum Murr. from Qinghai-Tibet Plateau. Food Chem. 2011, 126, 859–865. [Google Scholar] [CrossRef]
- Liliana, S.; José, G.C.; Ovidio, A.; Coralia, O. Anthocyanin Composition of Wild Colombian Fruits and Antioxidant Capacity Measurement by Electron Paramagnetic Resonance Spectroscopy. J. Agric. Food Chem. 2012, 60, 1397–1404. [Google Scholar] [CrossRef] [PubMed]
- Clifford, M. Anthocyanins: Nature, occurrence and dietary burden. J. Sci. Food Agric. 2000, 80, 1063–1072. [Google Scholar] [CrossRef]
- Cooney, J.M.; Dwayne, J.J.; McGhie, T. LC-MS identification of anthocyanins in boysenberry extract and anthocyanin metabolites in human urine following dosing. J. Sci. Food Agric. 2004, 84, 237–245. [Google Scholar] [CrossRef]
- Sari, P.; Wijaya, C.H.; Sajuthi, D.; Supratman, U. Colour properties, stability, and free radical scavenging activity of jambolan (Syzygium cumini) fruit anthocyanins in a beverage model system: Natural and copigmented anthocyanins. Food Chem. 2012, 132, 1908–1914. [Google Scholar] [CrossRef]
- Meltem, T.; Seref, T.; Ufuk, D.; Mehmet, O. Effects of various pressing programs and yields on the antioxidant activity, antimicrobial activity, phenolic content and colour of pomegranate juices. Food Chem. 2013, 138, 1810–1818. [Google Scholar] [CrossRef] [PubMed]
- Rice-Evans, A.C.; Miller, N.J.; Paganga, G. Structure-antioxidant activity relationships of flavonoids and phenolic acids. Free Radic. Biol. Med. 1996, 20, 933–956. [Google Scholar] [CrossRef] [PubMed]
- Chirinos, R.; Campos, D.; Betalleluz, I.; Giusti, M.M.; Schwartz, S.J.; Tian, Q.; Pedreschi, R.; Larondelle, Y. High-performance liquid chromatography with photodiode array detection (HPLC-DAD)/HPLC-Mass Spectrometry (MS) profiling of anthocyanins from Andean Mashua Tubers (Tropaeolum tuberosum Ruiz and Pavon) and their contribution to the overall antioxidant activity. J. Agric. Food Chem. 2006, 54, 7089–7097. [Google Scholar] [CrossRef] [PubMed]
- Sun, J.H.; Lin, L.Z.; Chen, P. Recent Applications for HPLC-MS Analysis of Anthocyanins in Food Materials. Curr. Anal. Chem. 2013, 9, 397. [Google Scholar] [CrossRef]
- Carla, D.C.J.; Carls, F.; He, J.; Tian, Q.Q.; Steven, J.S.; Giusti, M.M. Characterisation and preliminary bioactivity determination of Berberis boliviana Lechler fruit anthocyanins. Food Chem. 2011, 128, 717–724. [Google Scholar] [CrossRef]
- Choung, M.G.; Baek, I.Y.; Kang, S.T.; Han, W.Y.; Shin, D.C.; Moon, H.P.; Kang, K.H. Isolation and determination of anthocyanins in seed coats of black soybean (Glycine max (L.) Merr.). J. Agric. Food Chem. 2001, 49, 5848–5851. [Google Scholar] [CrossRef]
- Lee, J.H.; Cho, K.M. Changes occurring in compositional components of black soybeans maintained at room temperature for different storage periods. Food Chem. 2012, 131, 161–169. [Google Scholar] [CrossRef]
- Lee, J.H.; Choung, M.G. Identification and characterisation of anthocyanins in the antioxidant activity-containing fraction of Liriope platyphylla fruits. Food Chem. 2011, 127, 1686–1693. [Google Scholar] [CrossRef]
- Lee, J.H.; Kang, N.S.; Shin, S.O.; Shin, S.H.; Lim, S.G.; Suh, D.Y.; Baek, I.Y.; Park, K.Y.; Ha, T.J. Characterisation of anthocyanins in the black soybean (Glycine max L.) by HPLC–DAD–ESI/MS analysis. Food Chem. 2009, 112, 226–231. [Google Scholar] [CrossRef]
- Fossen, T.; Slimestad, R.; Øvstedal, D.O.; Andersen, Ø.M. Anthocyanins of grasses. Biochem. Syst. Ecol. 2002, 30, 855–864. [Google Scholar] [CrossRef]
- Alcalde-Eon, C.; Escribano-Bailón, M.T.; Santos-Buelga, C.; Rivas-Gonzalo, J.C. Changes in the detailed pigment composition of red wine during maturity and ageing. A comprehensive study. Anal. Chim. Acta 2006, 563, 238–254. [Google Scholar] [CrossRef]
- Leong, L.P.; Shui, G. An investigation of antioxidant capacity of fruits in Singapore markets. Food Chem. 2002, 76, 69–75. [Google Scholar] [CrossRef]
- Kong, Y.; Wei, Z.F.; Fu, Y.J.; Gu, C.B.; Zhao, C.J.; Yao, X.H.; Thomas, E. Negative-pressure cavitation extraction of cajaninstilbene acid and pinostrobin from pigeon pea [Cajanus cajan (L.) Millsp.] leaves and evaluation of antioxidant Activity. Food Chem. 2011, 128, 596–605. [Google Scholar] [CrossRef]
- Cui, C.; Zhang, S.M.; You, L.J.; Ren, J.Y.; Luo, W.; Chen, W.F.; Zhao, M.M. Antioxidant capacity of anthocyanins from Rhodomyrtus tomentosa (Ait.) and identification of the major anthocyanins. Food Chem. 2013, 139, 1–8. [Google Scholar] [PubMed]
- Meng, J.F.; Fang, Y.L.; Qin, M.Y.; Zhuang, X.F.; Zhang, Z.W. Varietal differences among the phenolic profiles and antioxidant properties of four cultivars of spine grape (Vitis davidii Foex) in Chongyi County (China). Food Chem. 2012, 134, 2049–2056. [Google Scholar] [CrossRef] [PubMed]
- Jing, L.H.; Shen, X.J.; Toshihiko, S.; Tomomasa, K.; Zhou, J.C.; Zhao, L.M. Characterization and activity of anthocyanins in Zijuan Tea (Camellia sinensis var. kitamura). J. Agric. Food Chem. 2013, 61, 3306–3310. [Google Scholar] [CrossRef] [PubMed]
- Luo, J.G.; Li, L.; Kong, L.Y. Preparative separation of phenylpropenoid glycerides from the bulbs of Lilium lancifolium by high-speed counter-current chromatography and evaluation of their antioxidant activities. Food Chem. 2012, 131, 1056–1062. [Google Scholar] [CrossRef]
- Sample Availability: Samples of the compounds 1 and 2 are available from the authors.
© 2014 by the authors. Licensee MDPI, Basel, Switzerland. This article is an open access article distributed under the terms and conditions of the Creative Commons Attribution license ( http://creativecommons.org/licenses/by/4.0/).
Share and Cite
Sun, L.-L.; Gao, W.; Zhang, M.-M.; Li, C.; Wang, A.-G.; Su, Y.-L.; Ji, T.-F. Composition and Antioxidant Activity of the Anthocyanins of the Fruit of Berberis heteropoda Schrenk. Molecules 2014, 19, 19078-19096. https://doi.org/10.3390/molecules191119078
Sun L-L, Gao W, Zhang M-M, Li C, Wang A-G, Su Y-L, Ji T-F. Composition and Antioxidant Activity of the Anthocyanins of the Fruit of Berberis heteropoda Schrenk. Molecules. 2014; 19(11):19078-19096. https://doi.org/10.3390/molecules191119078
Chicago/Turabian StyleSun, Li-Li, Wan Gao, Meng-Meng Zhang, Cheng Li, Ai-Guo Wang, Ya-Lun Su, and Teng-Fei Ji. 2014. "Composition and Antioxidant Activity of the Anthocyanins of the Fruit of Berberis heteropoda Schrenk" Molecules 19, no. 11: 19078-19096. https://doi.org/10.3390/molecules191119078