Article

Pterocarpan-Enriched Soy Leaf Extract Ameliorates Insulin Sensitivity and Pancreatic β-Cell Proliferation in Type 2 Diabetic Mice

1
Industrial Bio-materials Research Center, Korea Research Institute of Bioscience and Biotechnology (KRIBB), Daejeon 305-806, Korea
2
Department of Biomolecular Science, Korea University of Science and Technology, KRIBB, Daejeon 305-806, Korea
3
College of Pharmacy, Chungnam National University, Daejeon 305-764, Korea
4
Division of Applied Life Science, Gyeongsang National University, Jinju 660-701, Korea
5
Insect Biotech Co. Ltd., Daejeon 305-811, Korea
*
Author to whom correspondence should be addressed.
Molecules 2014, 19(11), 18493-18510; https://doi.org/10.3390/molecules191118493
Submission received: 2 September 2014 / Revised: 4 November 2014 / Accepted: 7 November 2014 / Published: 13 November 2014
(This article belongs to the Section Natural Products Chemistry)

Abstract

:
In Korea, soy (Glycine max (L.) Merr.) leaves are eaten as a seasonal vegetable or pickled in soy sauce. Ethyl acetate extracts of soy leaves (EASL) are enriched in pterocarpans and have potent α-glucosidase inhibitory activity. This study investigated the molecular mechanisms underlying the anti-diabetic effect of EASL in C57BL/6J mice with high-fat diet (HFD)-induced type 2 diabetes. Mice were randomly divided into normal diet (ND), HFD (60 kcal% fat diet), EASL (HFD with 0.56% (wt/wt) EASL), and Pinitol (HFD with 0.15% (wt/wt) pinitol) groups. Weight gain and abdominal fat accumulation were significantly suppressed by EASL. Levels of plasma glucose, HbA1c, and insulin in the EASL group were significantly lower than those of the HFD group, and the pancreatic islet of the EASL group had greater size than those of the HFD group. EASL group up-regulated neurogenin 3 (Ngn3), paired box 4 (Pax4), and v-maf musculoaponeurotic fibrosarcoma oncogene homolog A (MafA), which are markers of pancreatic cell development, as well as insulin receptor substrate 1 (IRS1), IRS2, and glucose transporter 4 (GLUT4), which are related to insulin sensitivity. Furthermore, EASL suppressed genes involved in hepatic gluconeogenesis and steatosis. These results suggest that EASL improves plasma glucose and insulin levels in mice with HDF-induced type 2 diabetes by regulating β-cell proliferation and insulin sensitivity.

Graphical Abstract

1. Introduction

Type 2 diabetes (T2D) is one of the fastest growing and most widespread diseases. The incidence of T2D has increased in recent years, and this trend is expected to continue because changing lifestyles have led to overconsumption of energy-rich foods, physical inactivity, and increased psychosocial stress. Shaw et al. predicted that the total number of patients with diabetes is expected to increase to 54% during the period from 2010–2030, which would require an annual growth rate of 2.2%, which is nearly twice the annual growth rate of the world adult population [1].
T2D is a metabolic disorder characterized by hyperglycemia resulting from defects in insulin secretion, action, or both [2]. Insulin regulates glucose homeostasis and is produced and secreted by pancreatic β-cells. Promotion of the proliferation and differentiation of pancreatic β-cells is an important component of T2D treatment [3,4]. Blood glucose levels are regulated by hepatic glucose production, which is controlled by insulin, and glucose uptake in peripheral tissue, which is stimulated by insulin. Under normal conditions, pancreatic β-cells secrete insulin at proper levels to maintain a normal blood glucose concentration. T2D is a result of insulin resistance associated with obesity and pancreatic β-cell dysfunction. In peripheral tissue, glucose enters cells through glucose transporter 4 (GLUT4) in a manner that is primarily controlled by insulin signaling [5,6]. Insulin signaling is mediated by the binding of insulin to its receptor, which leads to tyrosine phosphorylation of insulin receptor substrate 1 (IRS1) and IRS2. IRS1 phosphorylation enhances glucose transport and glycogen synthase activity [7,8]. Therefore, because blood glucose is controlled by insulin signaling, T2D therapy research is focused on insulin.
Soybean (Glycine max, also known as soy or soya bean) is cultivated globally, and its beneficial health effects include anti-cancer action [9,10], reduction in serum cholesterol [11,12], prevention of coronary heart disease [13,14], and immunomodulation [15,16]. While the bean of the soybean plant has been studied extensively, there is limited data on soy leaves. Soy leaves are consumed as a seasonal vegetable in the southern part of Korea, and their flavonoid and polyphenol profiles are different from those of soybeans. Soybeans contain major isoflavones, such as genistein, daidzein, glycitein, and their respective glycosides [17]. In contrast, soy leaves contain kaempferol glycosides and pterocarpans that are absent or present at low levels in soybeans [18,19].
The main components of ethyl acetate extracts of soy leaves (EASL) are pterocarpans, which are present in EASL at concentrations higher than those typically found in 95% ethanol extracts of soy leaves [19]. The pterocarpans coumestrol, glyceofuran, and phaseol strongly inhibit low-density lipoprotein (LDL) oxidation [20] and yeast α-glucosidase [19,21]. Pterocarpans produce cancer preventive [22,23], neuraminidase inhibitory [21], and anti-inflammatory [24] effects, but the effects of pterocarpans-enriched EASL against diabetes and obesity in animal models have not been reported.
Therefore, the main objective of this study was to investigate the effects of EASL in C57BL/6J mice with high-fat diet (HFD)-induced T2D, and to study the mechanisms underlying these effects, with a focus on gene expression involved in insulin sensitivity and β-cell proliferation, as well as cytokines. Pinitol (3-O-methyl-chiro-inositol) is a common constituent of legume plants and is a major component of the aqueous fraction of ethanolic extracts from soy leaves. Pinitol produces an insulin-like effect and improves insulin sensitivity [25], and so it was used as a positive control treatment in this study.

2. Results and Discussion

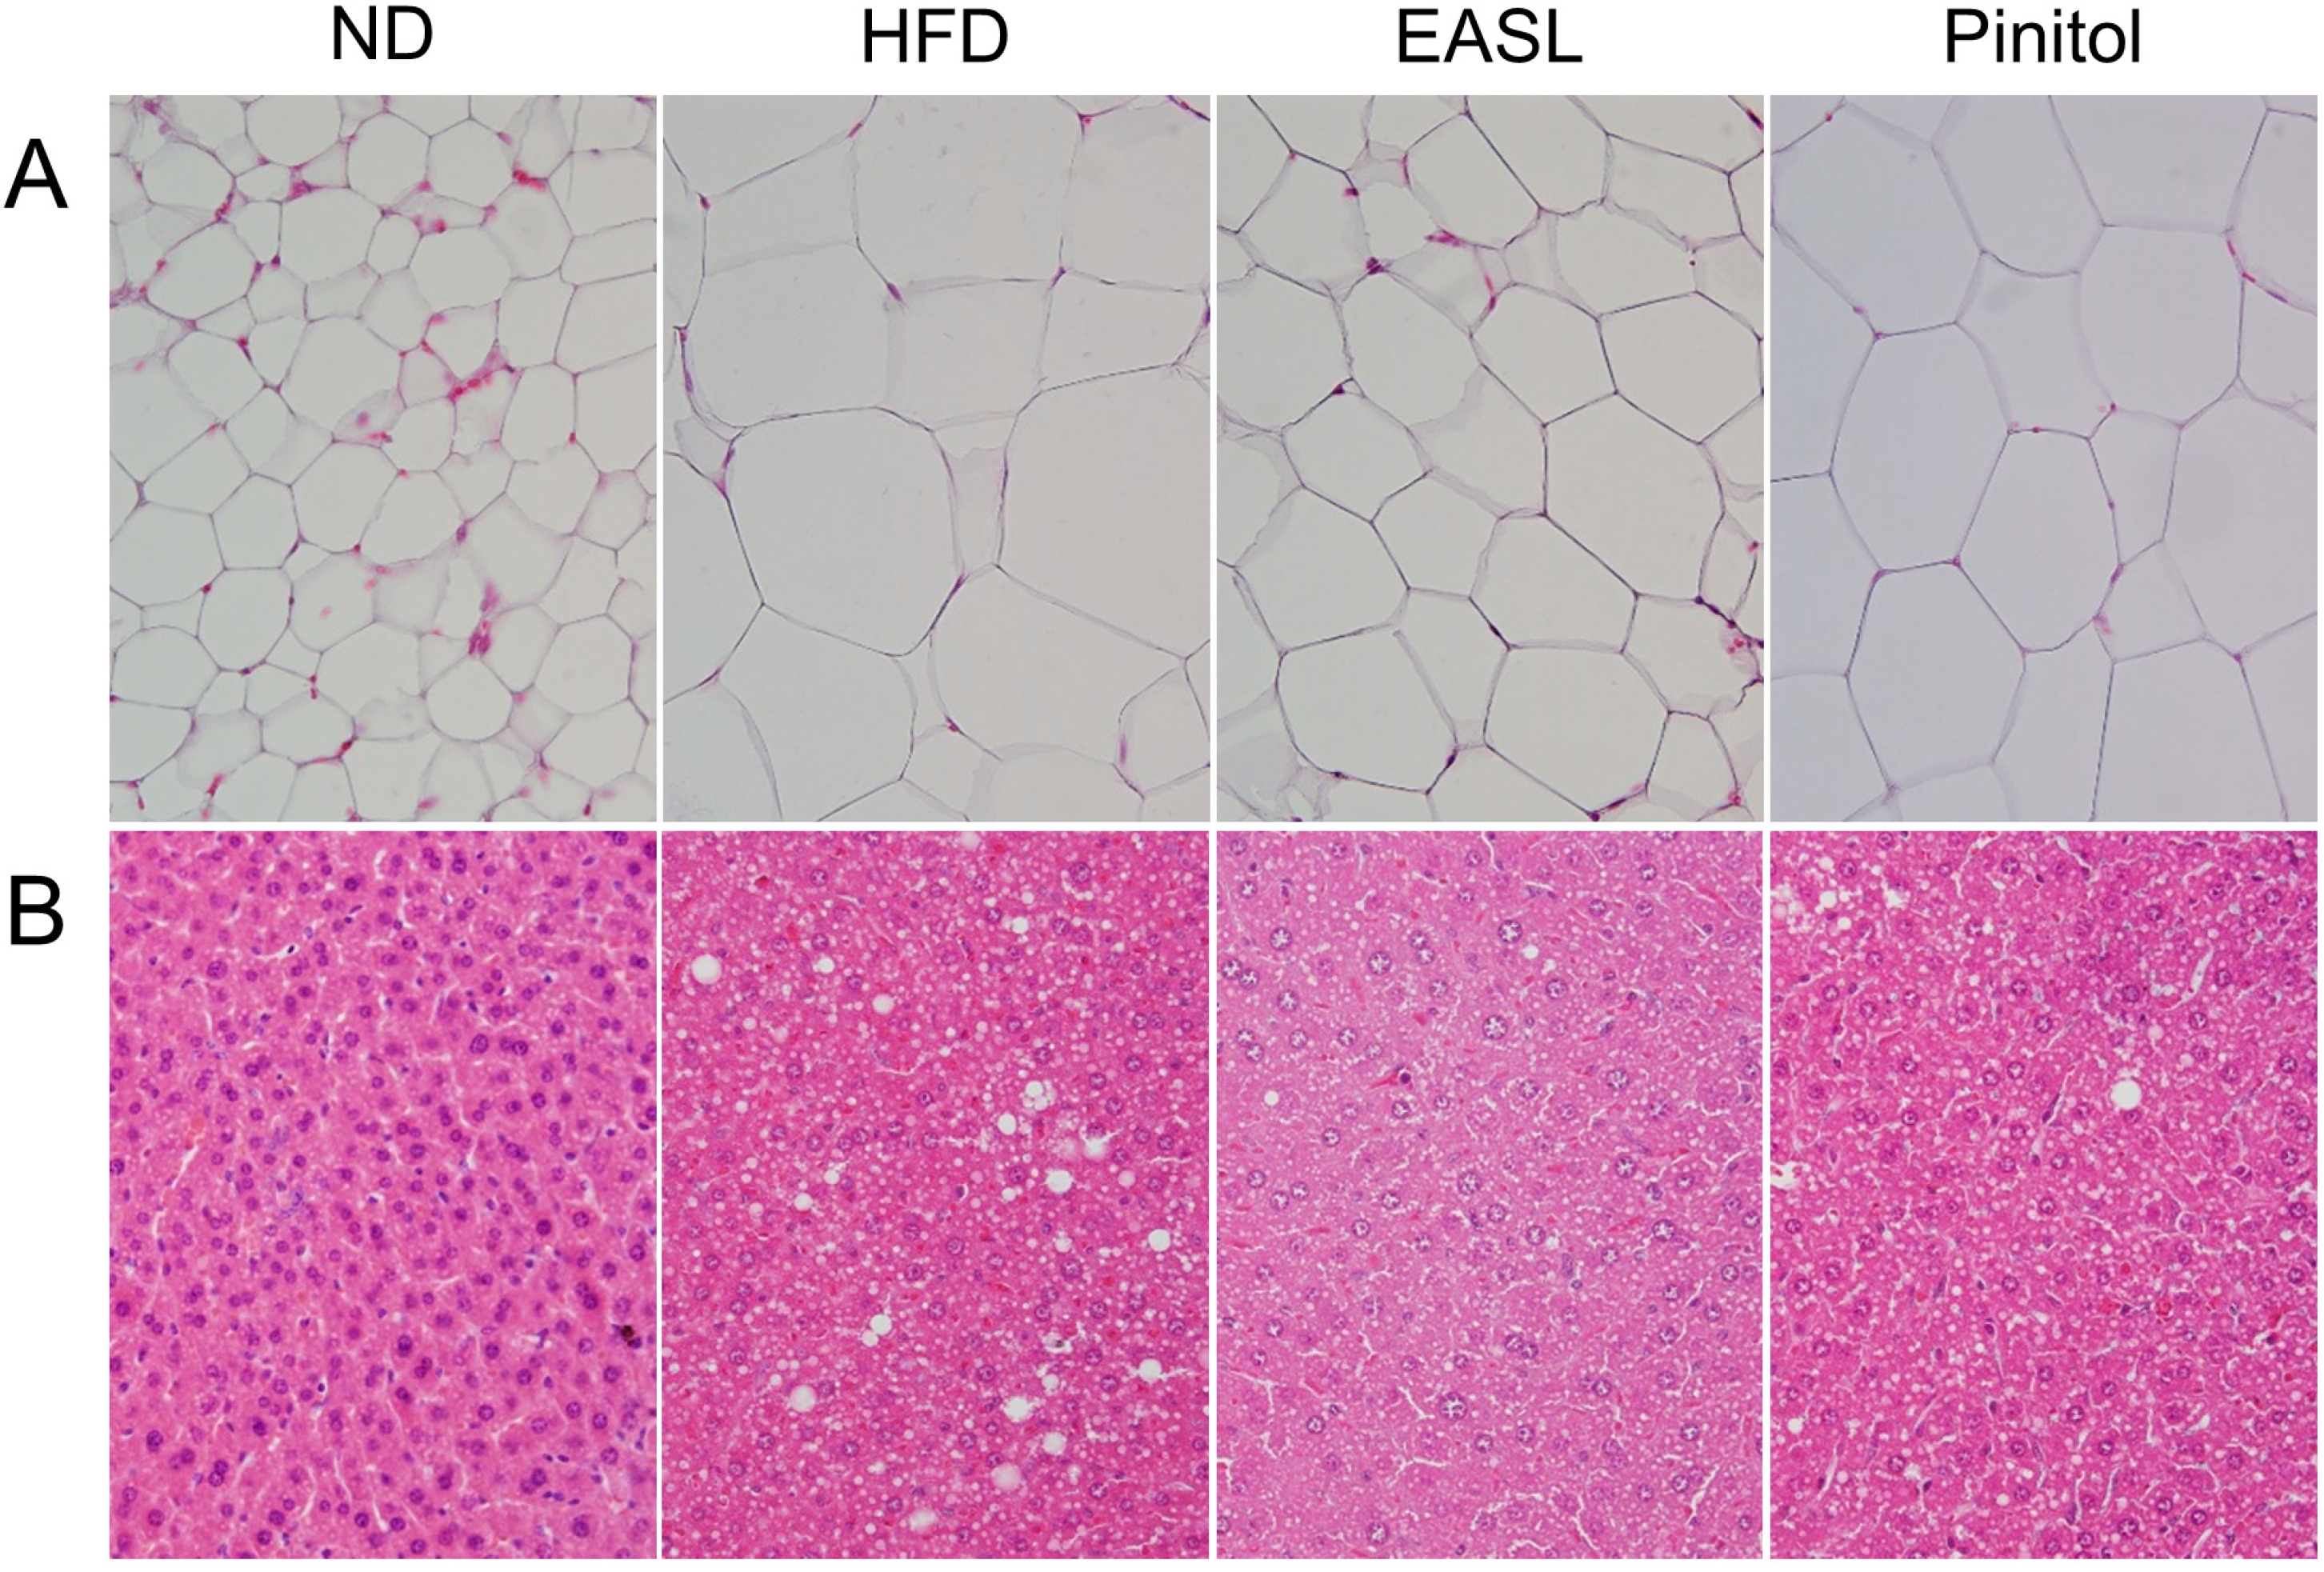
2.1. EASL Lowered Body Weight Gain and Abdominal White Adipose Tissue (WAT) Weight

The initial body weights of the four groups of mice were not significantly different. After a 12-week feeding period, the body weight of the HFD group (40.2 ± 0.8 g) was significantly greater than that of the normal diet (ND) group (26.8 ± 0.6 g). Meanwhile, body weights of the EASL group (36.3 ± 0.7 g) and the Pinitol group (36.7 ± 0.4 g) were significantly less than that of the HFD group. Compared with the HFD group, the supplementation with EASL or Pinitol did not affect food intake (Table 1).
Table 1. Effects of EASL supplementation on body weight gain and organ weights.
ParameterNDHFDEASLPinitol
Body weight (g)
Initial20.3 ± 0.6 a19.5 ± 0.2 a20.1 ± 0.3 a19.6 ± 0.3 a
Final26.8 ± 0.6 c40.2 ± 0.8 a36.3 ± 0.7 b36.7 ± 0.4 b
Weight gain (g/12 week)6.5 ± 0.2 c20.7 ± 0.8 a16.3 ± 0.6 b17.0 ± 0.2 b
Food intake (g/day)2.5 ± 0.1 a2.1 ± 0.1 b2.1 ± 0.1 ab2.2 ± 0.1 ab
Organ weight (g)
Abdominal adipose tissue0.26 ± 0.02 c2.01 ± 0.07 a1.50 ± 0.13 b1.80 ± 0.10 ab
Pancreas0.14 ± 0.02 a0.15 ± 0.03 a0.19 ± 0.01 a0.17 ± 0.01 a
Liver0.81 ± 0.01 b1.03 ± 0.04 a0.95 ± 0.02 a0.97 ± 0.01 a
Muscle0.31 ± 0.01 a0.31 ± 0.01 a0.31 ± 0.04 a0.32 ± 0.01 a
Values are presented as mean ± SE (n = 10). a–c Means in the same row not sharing a common superscript letter are significantly different (p < 0.05) between the groups.
All mice were necropsied at the end of the experiment and organ weights were measured. WAT weight in the EASL group (1.50 ± 0.13 g) was significantly less than that of the HFD group (2.01 ± 0.07 g). However, there were no significant differences in the weights of the pancreas, liver, and muscle among the groups.
The histological appearances of the WAT and the liver are shown in Figure 1. The adipocytes in the EASL-treated mice (Figure 1A) were markedly smaller than those of the HFD-fed mice. Although there were no differences in liver weight among the groups, the EASL group accumulated fewer hepatic lipid droplets than did the HFD group (Figure 1B).
Figure 1. Histology of the white adipose tissue (WAT) (A) and liver (B) with hematoxylin and eosin (H&E) staining in HFD-fed C57BL/6J mice (400× original magnification).
Molecules 19 18493 g001

2.2. Effect of EASL on Plasma Biochemical Parameters

At the end of the experiment, plasma levels of glucose, glycated hemoglobin (HbA1c), insulin, and triglyceride (TG) in HFD-fed mice were significantly higher than those of the ND mice (Table 2). Fasting glucose levels in EASL-treated mice were slightly lower than those of the ND mice, but the difference was not significant. The EASL treatment decreased the level of homeostasis model assessment of insulin resistance (HOMA-IR) index in HFD-fed mice, but the difference was not significant. The plasma HbA1c level of in the HFD group was 17.4% higher than that of the ND group, whereas treatment with EASL or Pinitol lowered the HbA1c level significantly to that of the ND group (p < 0.05). Furthermore, the plasma insulin level of the HFD group was threefold higher than that of the ND group, but the insulin level of the EASL-treated group was 40% less than that of the HFD group (p < 0.05). Consistent with this effect on HbA1c and insulin, after EASL supplementation, plasma total cholesterol (TC) and TG levels were 19.1% (p < 0.05) and 19.7% lower, respectively, than those of the HFD group. Additionally, plasma concentrations of glutamate oxaloacetate transaminase (GOT) and glutamate pyruvate transaminase (GPT) in EASL-supplemented mice tended to be significantly lower than those of the HFD mice. Pinitol showed a tendency to decrease fasting glucose (16.0%, p < 0.05), TC (41.7%, p < 0.05), and TG (26.0%) levels.
Table 2. Effects of EASL supplementation on plasma profiles.
ParameterNDHFDEASLPinitol
Glucose (mg/dL)93.9 ± 3.1 c203.7 ± 3.9 a193.0 ± 6.0 ab171.2 ± 9.1 b
HbAlc (%)4.6 ± 0.1 b5.4 ± 0.2 a4.5 ± 0.1 b4.5 ± 0.1 b
Insulin (ng/mL)0.5 ± 0.0 b1.5 ± 0.2 a0.9 ± 0.1 b0.9 ± 0.1 b
HOMA-IR index3.0 ± 0.1 b13.8 ± 2.5 a11.3 ± 1.1 a9.1 ± 1.9 ab
TC (mg/dL)149.7 ± 5.2 ab168.4 ± 5.6 a136.3 ± 11.0 b98.2 ± 9.6 c
HDL-C/TC (%)0.44 ± 0.05 a0.36 ± 0.08 a0.56 ± 0.10 a0.58 ± 0.04 a
TG (mg/dL)20.8 ± 3.9 b67.6 ± 11.4 a54.3 ± 9.1 a50.0 ± 5.4 a
GOT (IU/L)113.8 ± 10.0 a120.0 ± 8.1 a72.1 ± 1.2 b67.0 ± 1.9 b
GPT (IU/L)68.9 ± 4.7 ab71.4 ± 6.3 a54.8 ± 1.9 bc50.5 ± 2.3 c
Values are presented as mean ± SE (n = 10). a–c Means in the same row not sharing a common superscript letter are significantly different (p < 0.05) between groups.

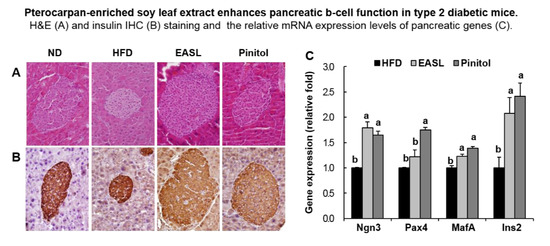
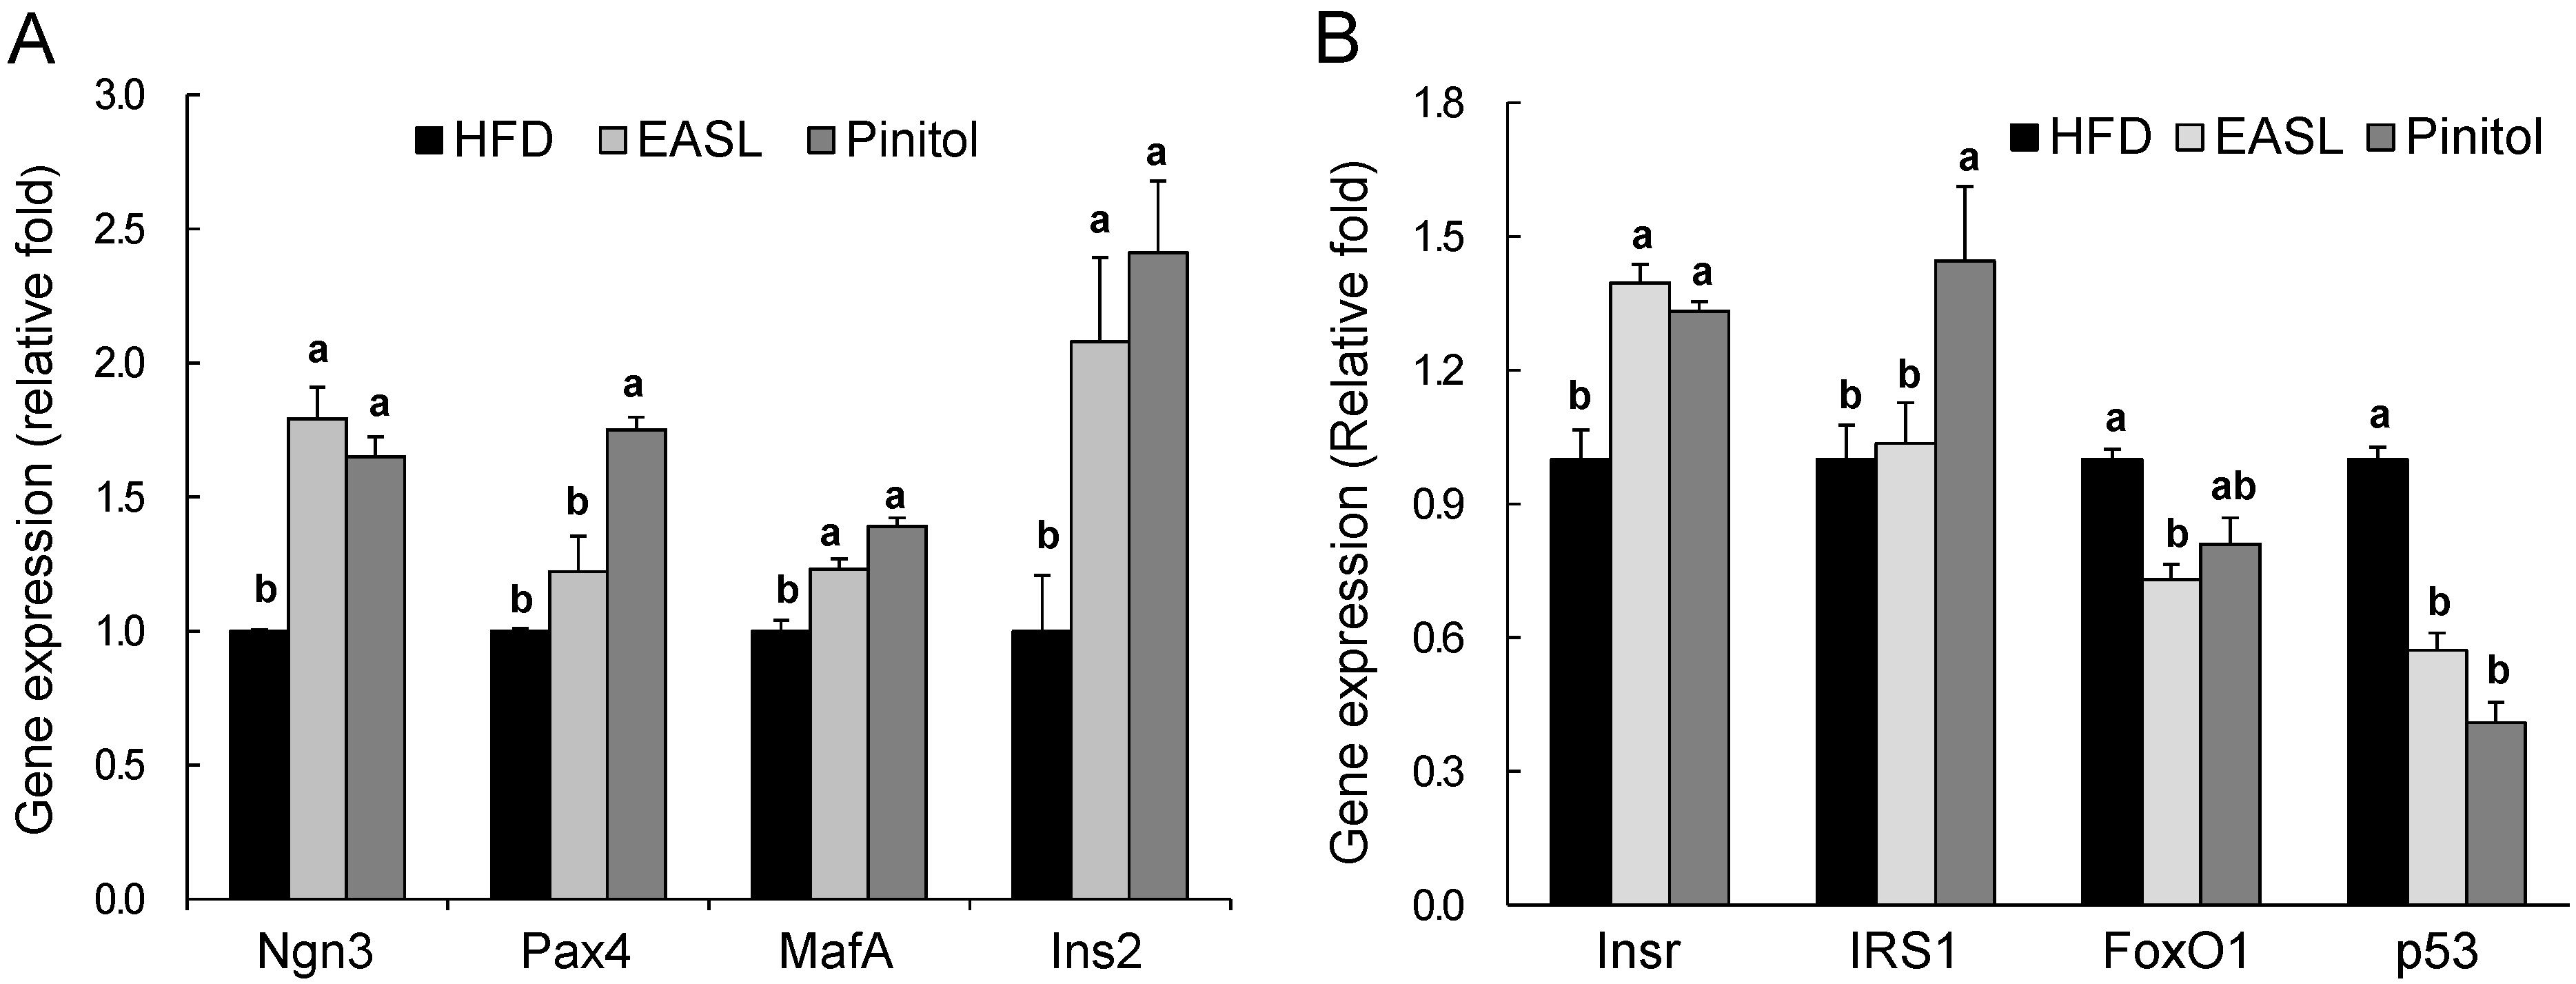
2.3. Effect of EASL on Pancreatic Function

The ameliorative effect of EASL on plasma HbA1c, insulin, and glucose levels may have been due to its prevention of β-cell dysfunction in pancreatic islets. Therefore, we investigated the histology of the pancreas via H&E and insulin immunohistochemical (IHC) staining. In the pancreas of the ND and HFD groups had intermediate-sized islets, whereas the pancreas of EASL and Pinitol groups had large-sized islets (Figure 2A,B). On the other hand, the insulin were sparsely expressed in the pancreatic islet of the EASL group compared with the ND and HFD group as demonstrated by insulin IHC staining (Figure 2C). For interpretation of the abnormal observation, we examined the mean size of the pancreatic islet and the pancreatic insulin content. While the pancreatic insulin content of the HFD group was similar to that of the ND group, the islet size of the HFD group was smaller than that of the ND group. We inferred that these results were associated with the increased number of the pancreatic islet in HFD group corresponding to Figure 2A. (Figure 2D,E). Kou et al. suggest that islet number rather than islet size is a major determinant of β-cell mass in humans [26]. In this study, we measured pancreatic insulin content instead of β-cell mass or β-cell number. The insulin content and islet size of the pancreas were not increased by the HFD as part of compensatory adaptation in an insulin-resistant state to maintain normoglycemia. (Figure 2 D,E). Peyot et al. reported that HFD (60 kcal% fat)-fed C57BL/6 mice show β-cell maladaptation caused by insulin resistance with resulting dysfunction and mild hyperglycemia [27]. In the present study, HFD-fed mice for 12 weeks did not reveal the pancreatic β-cell compensation owing to hyperglycemia and hyperinsulinemia according to the plasma profile. Nevertheless, the pancreatic islet size and insulin content in EASL-supplemented mice were increased for compensation to maintain normoglycemia compared with those of the HFD mice. The plasma levels of insulin, HbA1c, and glucose in the EASL and Pinitol groups were lower than that of the HFD group. These results suggest that the EASL dietary supplementation may enhance pancreas function and insulin sensitivity.
Figure 2. Effect of EASL supplementation on the pancreatic dysfunction in HFD-fed C57BL/6J mice. Histology of the pancreas with H&E (A,B) and insulin immunohistochemical (IHC) (C) staining. Magnification 100× (A) and 400× (B,C). The mean size of pancreatic islet (D) expressed in mm2. Pancreatic insulin levels (E). Pancreas was isolated and homogenized to measure pancreatic insulin levels. Values are presented as mean ± SE. a,b Means not sharing a common letter are significantly different between groups (p < 0.05).
Molecules 19 18493 g002
Next, we investigated whether EASL influenced the expression of pancreatic β-cell proliferation-related genes, such as neurogenin 3 (Ngn3), paired box 4 (Pax4), v-maf musculoaponeurotic fibrosarcoma oncogene homolog A (MafA), and insulin II (Ins2). The mRNA levels of Ngn3, MafA, and Ins2 in the EASL group were significantly higher than those of the HFD group (Figure 3A). We also examined levels of key molecules in the insulin sensitivity. Compared with the HFD group, supplementation with EASL significantly increased insulin receptor (Insr) mRNA expression (Figure 3B) and significantly reduced the transcriptional expression of the β-cell apoptosis-related genes forkhead box O1 (FoxO1) and p53 in pancreatic tissue. Pinitol group showed mRNA expression of Ngn3, Pax4, MafA, Ins2, Insr, and insulin receptor substrate 1 (IRS1) that was significantly greater than that of the HFD group (Figure 3A,B).
Figure 3. Effects of EASL supplementation on the relative mRNA expression levels of pancreatic genes related to β-cell development (A) or insulin sensitivity (B). The levels of mRNA in pancreatic tissue were measured by real-time quantitative RT-PCR (qRT-PCR) and normalized to glyceraldehyde-3-phosphate dehydrogenase (GAPDH) expression. Values are presented as mean ± SE. a,b Means not sharing a common letter are significantly different between groups (p < 0.05).
Molecules 19 18493 g003

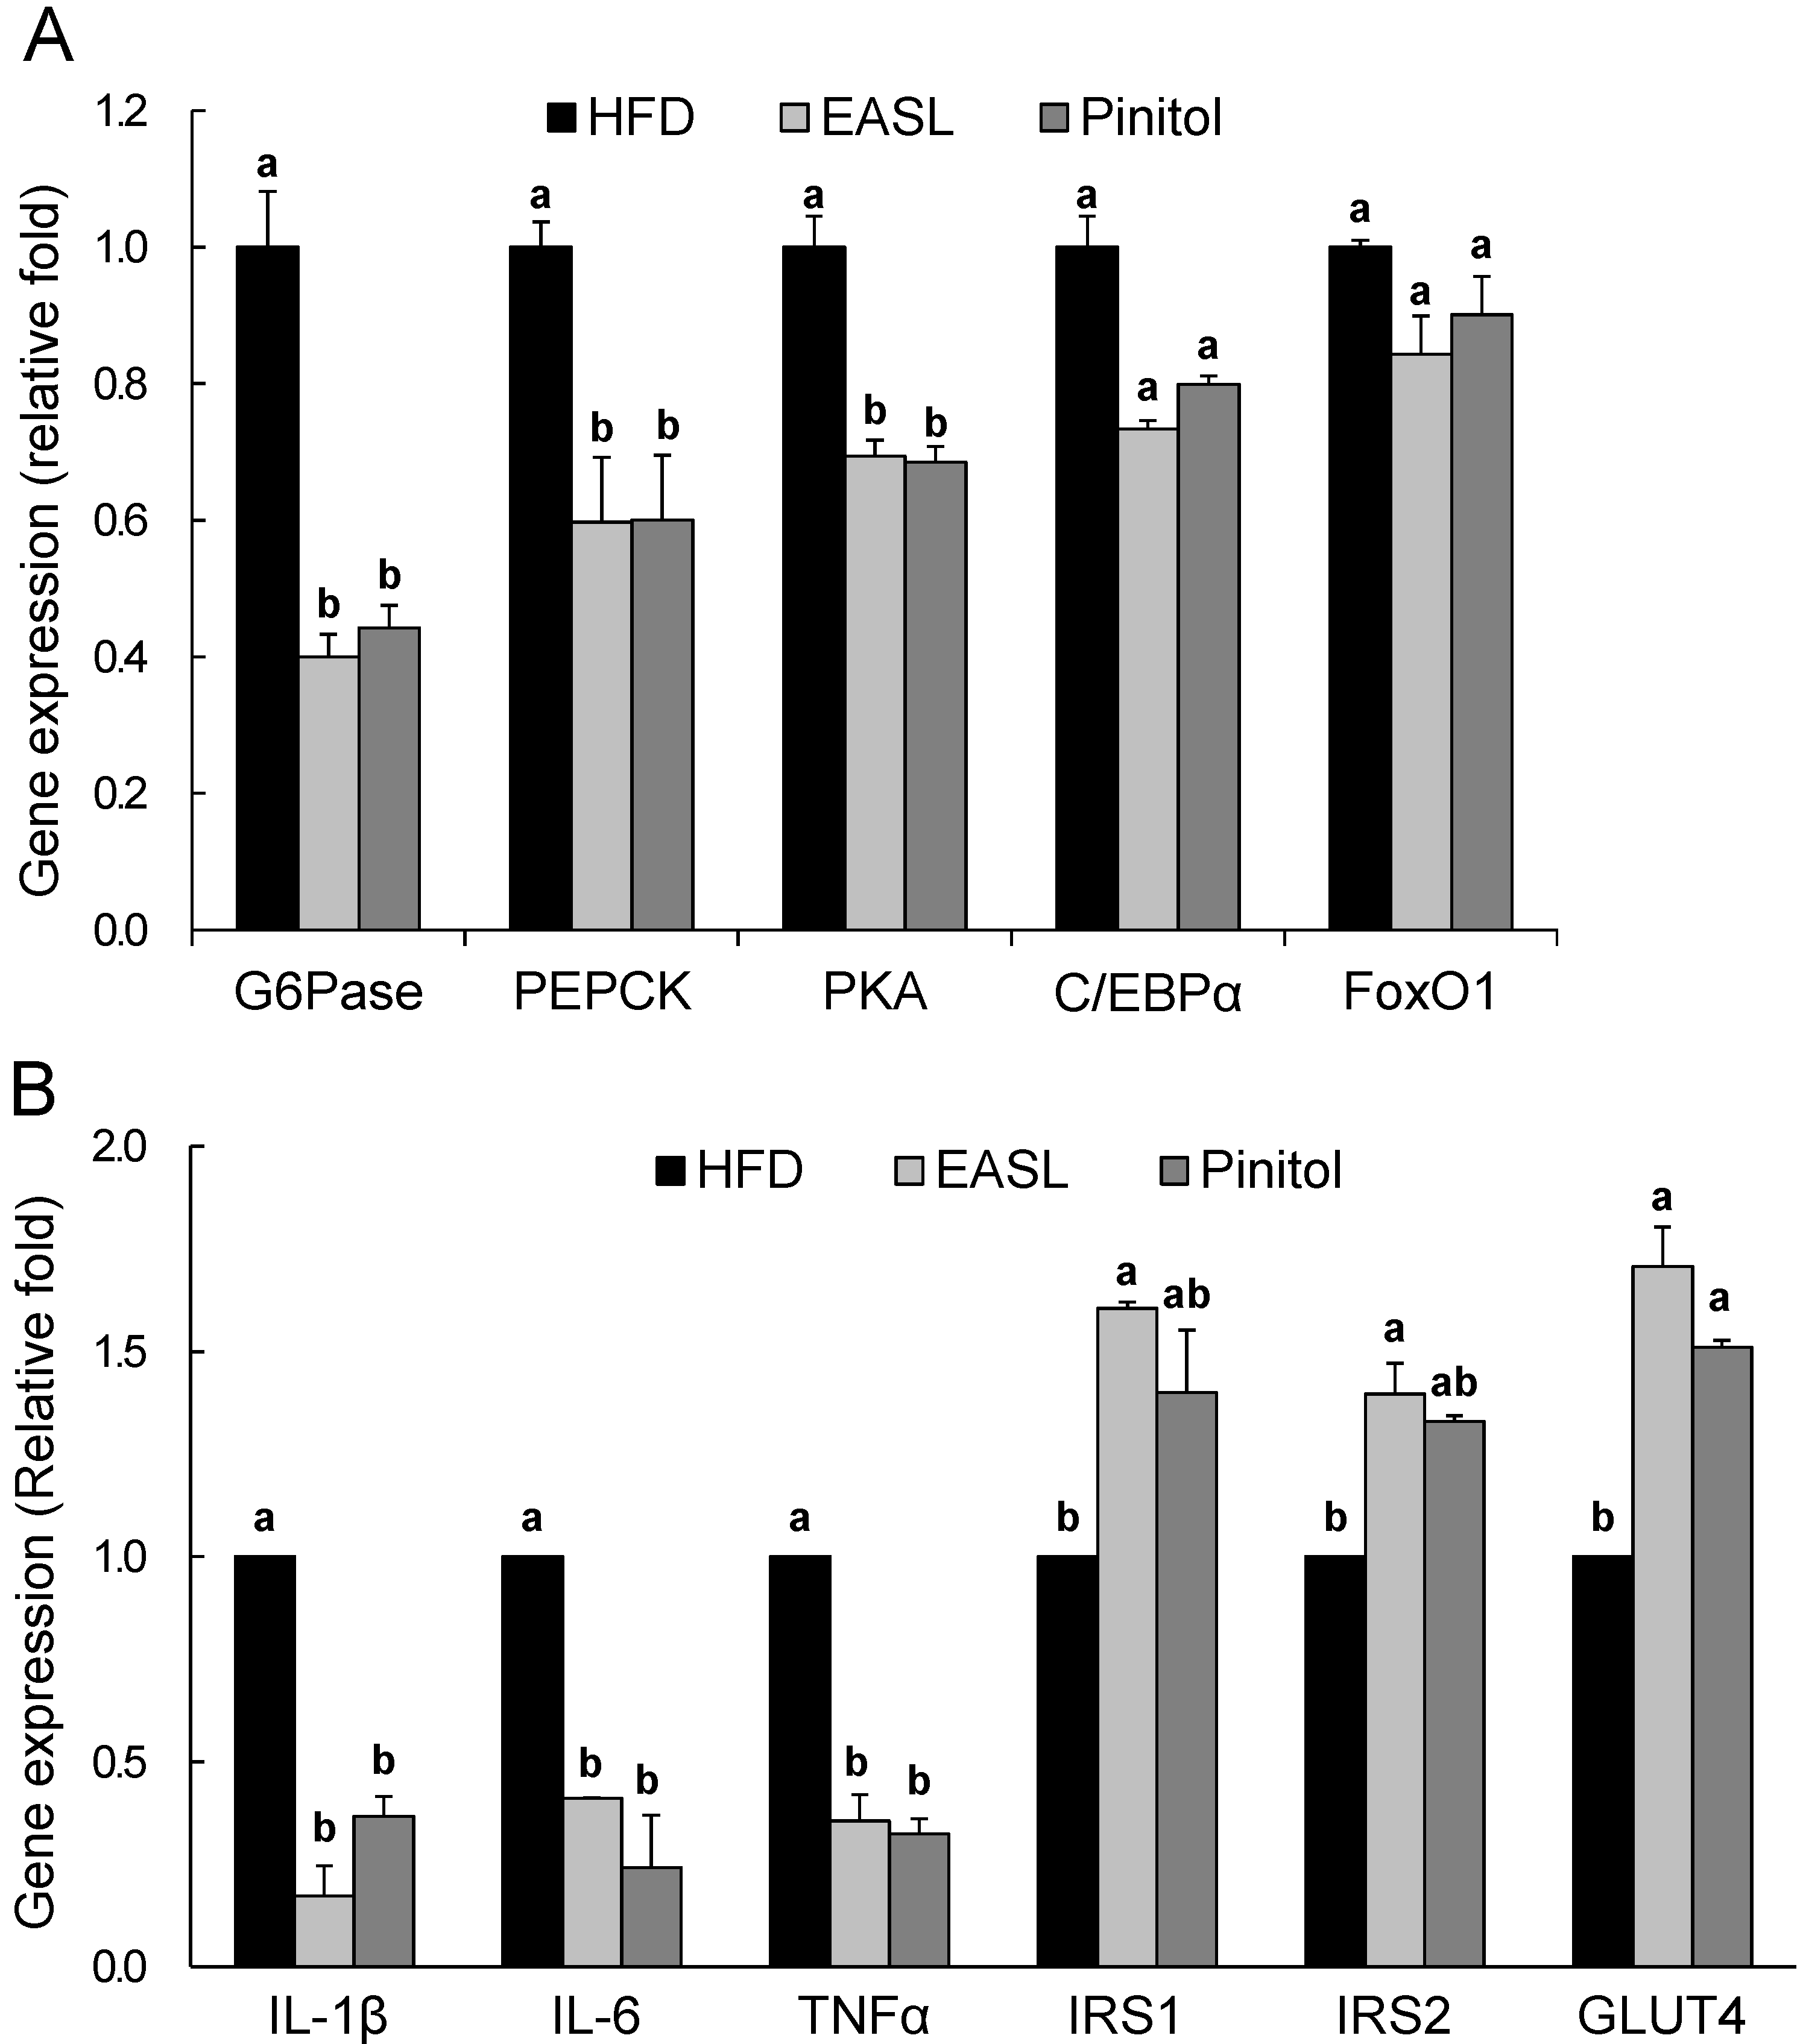
2.4. Effect of EASL on Expression of Gluconeogenesis and Insulin Sensitivity-Related Genes in Liver Tissue and WAT

The mRNA levels of hepatic genes involved in gluconeogenesis were measured by real-time qRT-PCR analysis. HFD-induced elevations in expression of glucose-6-phosphatase (G6Pase) and phosphoenolpyruvate carboxykinase (PEPCK) genes were markedly suppressed by dietary EASL or pinitol supplementation. The expression level of upstream transcription factor protein kinase A (PKA) in the EASL group was significantly lower than those of the HFD group. FoxO1 and CCAAT/enhancer binding protein alpha (C/EBPα) mRNA abundance were reduced, but the difference was not significant (Figure 4A).
Next, we evaluated EASL-induced changes in the expression of WAT genes associated with insulin signaling pathways and cytokines via qRT-PCR analyses. The expression levels of cytokines interluekin-1 beta (IL-1β), interleukin-6 (IL-6), and tumor necrosis factor alpha (TNFα) in the WAT from the EASL-treated group (82.8%, 58.9%, and 64.4%, respectively) were significantly lower than those measured in the WAT of the HFD group. Furthermore, mRNA levels of IRS1, IRS2, and glucose transporter 4 (GLUT4) in the EASL-treated group were significant higher than those of the HFD group (Figure 4B). Changes in gene expression similar to those mentioned above for EASL also occurred in the pinitol-supplemented positive control group.
Figure 4. Effects of EASL dietary supplementation on the relative mRNA expression levels of genes in the liver and WAT. Expression was measured by qRT-PCR for genes involved in gluconeogenesis (A) and insulin sensitivity (B) and then normalized to GAPDH expression. Values are presented as mean ± SE. a,b Means not sharing a common letter are significantly different between groups (p < 0.05).
Molecules 19 18493 g004

2.5. Discussion

Soybean is a globally exploited food crop that is relatively high in protein, and the health effects of the soy bean have been exhaustively studied. However, the leaves of the soybean plant are consumed in parts of Asia, and the health effects of soy leaves are not as well-known as those of soy beans. In recent clinical studies, soy leaf extracts produced body fat loss, and lowered fasting blood glucose, plasma TC, and HbA1c levels [28,29]. Therefore, we hypothesized that dietary supplementation with pterocarpan-enriched soy leaf extracts might produce therapeutic effects against T2D associated with obesity. Insulin resistance because of obesity is the most important etiological factor in the onset of T2D, in parallel with its central role in the pathogenesis of metabolic syndrome, which is a cluster of conditions that increase the risk of diabetes, heart disease, and stroke [8]. We supplemented a diabetes-inducing HFD with pterocarpan-enriched extract from soy leaves in C57BL/6J mice for 12 weeks to investigate whether the extract prevented T2D and obesity produced by impaired glucose tolerance.
As expected, the HFD group was induced obesity and T2D, which were accompanied by abnormally high weight, greater adipocyte size, and elevated levels of plasma lipids, glucose, HbA1c, and insulin. Plasma analysis revealed that EASL significantly improved the plasma profile; although the glucose level was not significantly changed by EASL supplementation, plasma HbA1c and insulin levels were markedly lower than the levels of the HFD group (Table 2). HbA1c and insulin levels are important parameters in the diagnosis of T2D and diabetic complications. The size of the pancreatic islets of the EASL group was greater than that of the islets of the HFD group (Figure 2). Accordingly, the prevention of β-cell dysfunction in the pancreatic islets of the EASL group was a result of lowered levels of plasma HbA1c, insulin, and glucose. EASL supplementation produced plasma TC levels markedly lower than those of the HFD group. Decreased plasma TC and TG concentrations were verified by the reduction in WAT weight and adipocyte size. In addition, EASL treatment inhibited weight gain and the formation of lipid droplets within hepatocytes. Moreover, plasma GOT and GPT levels in the EASL group, which are indicative of the level of liver function, were dramatically lower than those of the HFD group.
The beneficial effects of lowered HbA1c and glucose levels may be mediated by the prevention of β-cell dysfunction in pancreatic islet. Therefore, we evaluated the expression of genes involved in β-cell proliferation and differentiation. Ngn3 is a transcription factor that is essential for pancreatic endocrine cell differentiation and development. In the pancreas, α-, β-, and δ-cells are differentiated from Ngn3-expressing precursors. The transcription factor Pax4 also plays an important role in the differentiation of β- and δ-cells [30]. MafA, a strong activator of insulin gene transcription, is expressed during the final stage of β-cell differentiation [31]. Recent findings have suggested that it is possible to utilize small molecules or other techniques to reprogram cells into a β-cell-like state by expressing transcription factors, such as Ngn3, Pax4, pancreatic and duodenal homeobox 1 (PDX1), and MafA [32,33]. We found that mRNA levels of Ngn3 and MafA were significantly increased in the EASL group (Figure 3A). In addition, in pancreatic β-cells, insulin signaling pathways are reported to play an important role in the maintenance of cellular function [34]; insulin signaling in β-cells is important for insulin secretion, proliferation, and β-cell survival. EASL dietary supplementation significantly increased Insr transcript expression, but expression level of IRS1 was not changed. In addition, expression of the β-cell apoptosis-related gene p53 and FoxO1 were markedly reduced by dietary EASL supplementation (Figure 3B). These results suggest that EASL ameliorates insulin sensitivity by enhancing pancreatic β-cell proliferation and function.
The insulin-like effect of pinitol was mediated by reduced glucose and HbA1c levels and increased glucose uptake [35]. Dietary supplementation with pinitol ameliorates insulin sensitivity by positively regulating insulin signaling [35,36]. In addition to this insulin-like effect, pinitol produces anti-hyperlipidemic, cardioprotective, and anti-oxidative effects [37,38,39]. In this study, we confirmed the anti-diabetic effect of pinitol, which produced an effect similar to that of EASL (Figure 3A,B).
Reduced insulin levels may be caused by improved insulin sensitivity in insulin target organs, such as the liver, skeletal muscle, and adipose tissue. The liver is extremely sensitive to insulin, which controls its plasma glucose regulating function. Usually, Insr activation induces IRS1 Tyr phosphorylation, thereby triggering phosphoinositide 3-kinase (PI3K)-protein kinase B (PKB) activation. PKB controls the expression of gluconeogenic and lipogenic enzymes by regulating the activity of the winged helix, or forkhead (Fox), class of transcription factors [40]. It is well known that PKA-cAMP response element binding protein (CREB) and FoxO1 signaling mediates the expression of genes involved in gluconeogenesis. In a fasted state, CREB phosphorylation is induced by PKA and C/EBPα, and it acts as a major transcription factor in the control of hepatic gluconeogenesis [41]. PKA phosphorylates CREB, and the action of CREB appears to be limited primarily by nuclear entry of the PKA catalytic subunit. Activated CREB directly stimulates the expression of gluconeogenic genes, such as G6Pase and PEPCK [42]. In addition, gluconeogenesis is suppressed by insulin signaling that leads to phosphorylation of FoxO1 when the organism is in a fed state [43]. In this study, it is interesting that EASL significantly decreased mRNA levels of G6Pase and PEPCK, implying decreased hepatic gluconeogenesis (Figure 4A). To further evaluate these effects of EASL on gene expression and gluconeogenesis, we examined PKA, and C/EBPα, and FoxO1 gene expressions, which is upstream of hepatic gluconeogenic genes. PKA mRNA expression was dramatically down-regulated by dietary supplementation with EASL (p < 0.05). In addition, EASL treatment suppressed C/EBPα and FoxO1 transcript levels, but these changes were not significant (Figure 4A). These results suggest that dietary supplementation with EASL might reduce gluconeogenesis by enhancing insulin sensitivity, and regulate the hepatic glucose homeostasis, which leads to lowering of glucose level.
Adipose tissue, the typical insulin-target organ, can respond quickly to excess caloric intake through adipocyte hypertrophy and hyperplasia, and enlarged adipose tissue results in altered production of various adipokines and inflammatory chemokines and cytokines, which impacts insulin sensitivity [44]. In obesity, increased accumulation of adipose tissue is accompanied by chronic adipose inflammation, which seems to play an important role in the pathogenesis of obesity-related insulin resistance [45]. It has been reported that increased cytokine levels inhibit the normal action of insulin. In particular, the well-known pro-inflammatory cytokines, IL-1β, IL-6, and TNFα are secreted at high levels in the visceral adipose tissue [44]. Plasma IL-1β, IL-6, and TNFα levels are typically elevated in the metabolic syndrome and are associated with obesity, insulin resistance, and T2D. Specifically, IL-6 production in adipose tissue is increased by obesity, related to insulin resistance, and predictive of the incidence of T2D [46,47]. TNFα induces production of chemokines and adhesion molecules in the adipose tissue that serve as markers of inflammation; therefore, TNFα mediates adipose tissue inflammation [48]. In this study, EASL inhibited dramatically transcriptional expression of IL-1β, IL-6 and TNFα in WAT. In addition, EASL enhanced expression of insulin sensitivity-related genes IRS1, IRS2, and GLUT4 (Figure 4B). These results suggest that insulin sensitivity may be enhanced by decreased cytokine production in the WAT.

3. Experimental Section

3.1. Preparation of Soy Leaf Extracts

Soybeans, Glycine max (L.) Merr., were cultivated in Jeungpyeong County, Chungcheongbuk-do, Korea for 4 months, after which soy leaves were collected and immediately air-dried at room temperature for 5 days. The dried soy leaves were chopped with the aid of a laboratory blade cutter and stored at 4 °C. The chopped soy leaves (500 g) were extracted with 5 L ethyl acetate (EtOAc) at room temperature for 3 days. The extract was filtered and evaporated to dryness under reduced pressure at 40 °C to obtain the EASL (33.1 g).

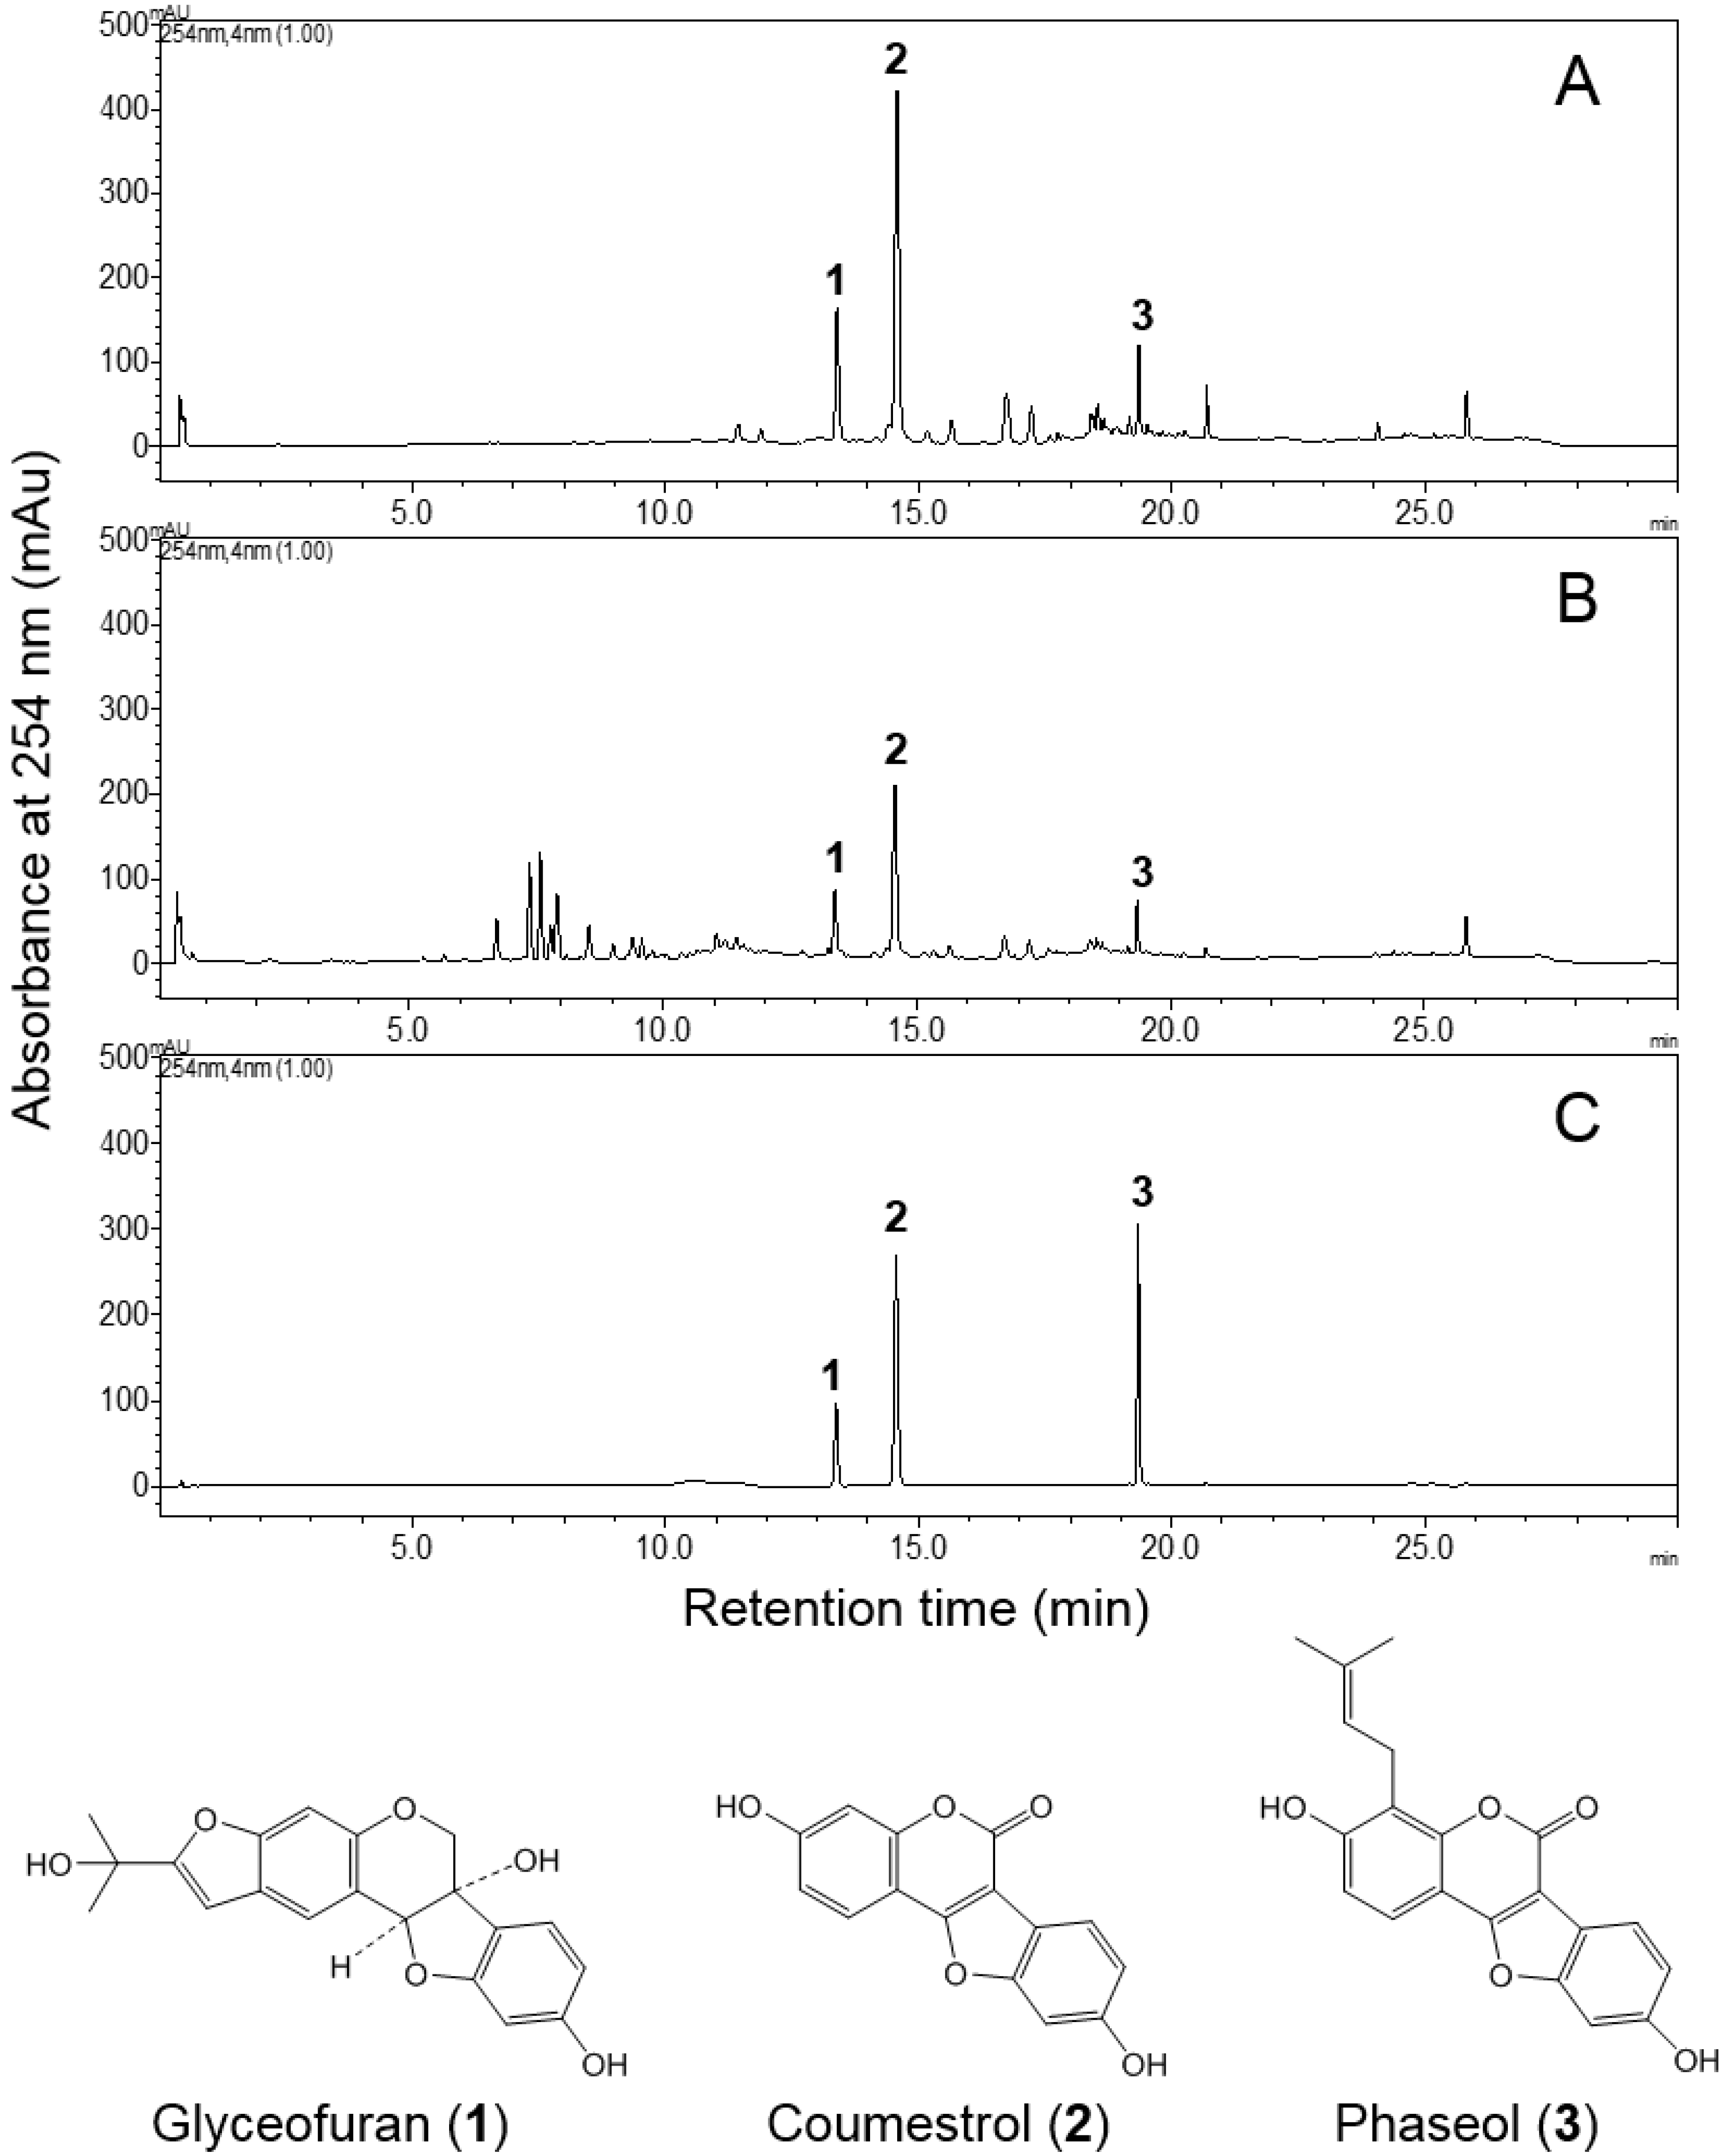
3.2. HPLC Analysis of EASL

The main polyphenol compounds present in EASL (20 mg/mL) and 95% EtOH extract (20 mg/mL) of soy leaves were analyzed and confirmed using a Shimadzu HPLC system equipped with a binary pump delivery system, a photo diode array detector, and an autosampler (Shimadzu Corp., Tokyo, Japan) and a Brownlee SPP C18 column (4.6 × 50 mm, 2.7 µm; PerkinElmer, Inc., Waltham, MA, USA). The injection volume was 5 µL and the mobile phase was 0.1% acetic acid in water (solvent A) and acetonitrile (solvent B). The linear gradient elution program was as follows: 5%–30% B for 0–15 min, 30%–80% B for 15–20 min, 80%–100% B for 20–23 min, 100% B for 23–27.5 min, and 100%–5% B for 27.5–30 min. The flow rate was 1.8 mL/min and the absorbance was 254 nm. Coumestrol obtained from Sigma-Aldrich (St. Louis, MO, USA) and glyceofuran, and Phaseol, isolated from EASL by Ki Hun Park (Gyeongsang National University) [20], were used as external standards of HPLC analysis. The peak areas of the major pterocarpan components glyceofuran (1), coumestrol (2), and phaseol (3) in the EASL (56.4% ± 0.3%) were about 1.9-fold greater than those of the 95% ethanol extract (29.0% ± 0.3%), which was prepared for preliminary study (Figure 5).

3.3. Animals and Diets

Male C57BL/6J (4-week-old) mice were purchased from Japan SLC (Shizuoka, Japan) and housed in a facility with controlled temperature (25 ± 2 °C), humidity (50% ± 5%), and lighting (alternating 12-h periods of light and dark) at the Korea Research Institute of Bioscience and Biotechnology (KRIBB), in Daejeon, Korea. Animals were fed a standard normal laboratory diet (Taklad 2018S, Harlan Laboratories, Inc., Indianapolis, IN, USA) for an acclimation period of 2 weeks, after which the mice were divided into 4 groups of 10 mice each: the ND group, which was fed a standard normal diet; the HFD group, which was fed a 60 kcal% fat diet (D12492, Research Diets, Inc., New Brunswick, NJ, USA) with no supplement; the EASL group, which was fed a HFD with 0.56% EASL (wt/wt); or Pinitol group, which was fed a HFD with 0.15% pinitol (wt/wt) (CnF Co. Ltd., Seoul, Korea) as a positive control group. The groups of mice were allowed to consume their respective diets for a 12-week experimental period. Animal study protocols were approved by the Animal Care Committee of KRIBB (KRIBB-ACE-13028).
Figure 5. HPLC chromatograms of EASL (A), 95% EtOH extract (B) from soy leaves, and the external standards 1, 2, and 3 (C) and their chemical structures. The HPLC chromatograms were detected at 254 nm. Peaks: 1, glyceofuran (TR: 13.36 min); 2, coumestrol (TR: 14.55 min); and 3, Phaseol (TR: 19.33 min). The mean peak areas of 1, 2, and 3 were 12.5%, 36.6%, and 5.4%, respectively, in EASL; the mean peak areas of 1, 2, and 3 were 6.2%, 19.5%, and 3.3%, respectively, in 95% ethanol extract.
Molecules 19 18493 g005

3.4. Measurement of Metabolic Parameters

Body weight and food intake were monitored every week during the experiment. At the end of the experimental period, all mice were anesthetized with ether after a 12-h fast. Blood was collected from the inferior vena cava into an EDTA-coated tube. The collected blood samples were centrifuged at 800 g at 4 °C for 15 min and stored at −72 °C. The plasma concentrations of glucose, TC, TG, and high-density lipoprotein-cholesterol (HDL-C) were analyzed using an automatic blood chemical analyzer (Hitachi-720, Hitachi, Ltd., Tokyo, Japan). HbA1c and insulin levels were determined using an HbA1c Measuring System (Infopia, Anyang, Korea) and an ELISA kit (Alpco Diagnostics, Windham, NH, USA), respectively. The plasma GOT and GPT levels were measured using commercially available kits (Asan Pharm. Co., Seoul, Korea). The HOMA-IR index was calculated as described: HOMA-IR index = [fasting insulin concentration (ng/mL)] × 24.8 × [fasting glucose concentration (mg/dL)]/405 [49]. The WAT, liver, and pancreas were removed, weighed, and frozen in liquid N2 or stored in RNAlaterTM (Qiagen, Valencia, CA, USA) for further analysis.

3.5. Histological Analysis of WAT, Liver, and Pancreas

Freshly isolated WAT, liver, and pancreas sections were fixed in 10% formalin for 24 h for histopathological analysis. Following a rinse in flowing water, tissues were processed in a paraffin automatic processor using a programmed cascade. The paraffin-embedded samples were sliced into 5-µm thick sections and stained with hematoxylin and eosin (H&E). The mean size of pancreatic islet were measured using MetaMorph Imaging System (Meta Imaging Software, Sunnyvale, CA, USA).

3.6. IHC Analysis of the Pancreas

Paraffin-embedded sections of the pancreas were deparaffinized in xylene, hydrated in graded ethanol solutions, and boiled in 10 mM sodium citrate buffer (pH 6.0) for 5 min for antigen retrieval. IHC staining for insulin was performed using the VECTASTAIN Elite ABC kit (Vector Laboratories, Burlingame, CA, USA). Sections were treated with blocking serum and incubated with anti-insulin antibody (1:200, Santa Cruz Biotechnology, Santa Cruz, CA, USA) at 4 °C overnight. Biotinylated goat anti-rabbit IgG was used as the secondary antibody. Antibody reactivity was developed with a diaminobenzidine tetrahydrochloride (DAB) peroxidase substrate kit (Vector Laboratories).

3.7. Pancreatic Insulin Content

To measure pancreatic insulin contents, pancreas was cut in half, weighed, and then added into 70% EtOH solution containing 1.5% HCl. Tissue was homogenized by TissuLyser (Qiagen, Valencia, CA, USA), and incubated in the same solution overnight at 4 °C. The tissue was then centrifuged at 300× g for 15 min at 4 °C and the supernatant neutralized with 1 M Tris buffer (pH 7.5). Insulin contents were determined by ELISA kit (Alpco Diagnostics, Windham, NH, USA).

3.8. Real-Time Quantitative RT-PCR (qRT-PCR)

After isolation of total RNA from pancreas, liver, and abdominal adipose tissue using the RNeasy mini kit (Qiagen, Valencia, CA, USA) as described by the manufacturer, cDNA was prepared from total RNA (1 µg) using the High-capacity cDNA reverse transcription kit (Applied Biosystems, Inc., Foster City, CA, USA). Real-time qRT-PCR was performed using SYBR Green Supermix reagent (Roche, Mannheim, Germany) with an Applied Biosystems® 7500 Real Time PCR system (Life Technologies, Grand Island, NY, USA). The cycling conditions were 95 °C for 10 min, followed by 50 cycles of 95 °C for 10 s, 60 °C for 20 s, and 72 °C for 50 s. To detect and eliminate possible primer-dimer artifacts, a dissociation curve was generated by adding a cycle of 95 °C for 15 s, 60 °C for 1 min, and 95 °C for 15 s. Results were normalized using glyceraldehyde-3-phosphate dehydrogenase (GAPDH) as a reference gene. The primers used in the experiments are shown in Table 3.
Table 3. Sequences of the primers used in qRT-PCR.
GeneForward PrimerReverse Primer
C/EBPαCAAGAAGTCGGTGGACAAGATCAACTCCAGCACCTTCTGT
FoxO1TGGGCCCTAATTCGGTCATTTGGGTCAGGCGGTTCATAC
GLUT4GCCCCACAGAAGGTGATTGAAGCGTAGTGAGGGTGCCTTGT
G6PaseGCTGGAGTCTTGTCAGGCATTAAACAAGAAGATGGTGATGAGACAAT
GAPDHACATCATCCCTGCATCCACTAGATCCACGACGGACACATT
Ins2CCCCACCCAGGCTTTTGTGCGGGACATGGGTGTGTAG
InsrCTGAACAAAGATGACAACGAGGAACTTACAGATGGTTGGGCAAACTT
IRS1GAGAAGAGACTGGCTCGGAAGAGCCTATTCTGCCCAACTCAACT
IRS2GGCCCGAACCTCAATAACAACCGCGCAACACGAAAAAG
IL-1βATGAGGACATGAGCACCTTCCATTGAGGTGGAGAGCTTTC
IL-6GCTACCTGGAGTACATGAAGCTGTGACTCCAGCTTATCTG
MafAGAACCGGAGGAGAATAAGAGGAGTCAAGTTGAGCATCACTGC
Ngn3CACTCAGCAAACAGCGAAGAAGGTCAGTGCCCAGATGTAGTTGTG
p53ACATCATCCCTGCATCCACTAGATCCACGACGGACACATT
Pax4CCCAGTGTGTCCTCTATCAATCGGGGAAGAACTGGAGCCAACA
PEPCKAGACCCTGCGAGTGCTTAGTGAGGGTCAGTGTGGCAGTATTCTC
PKAGGTTTTGCCAAGCGTGTGACAGCCTTGTTGTAGCCTTTGC
TNFαCTCAGATCATCTTCTCAAAATTCGAGTGACACTTCACAGAGCAATGACTCCAAAGT

3.9. Statistical Analysis

Data from tissues and plasma are presented as mean ± SE. Significant differences among the groups were determined by one-way analysis of variance (ANOVA) using JMP® software (SAS Institute Inc., Cary, NC, USA). Statistical analysis was performed using Student’s t-test. Values of p < 0.05 were considered significant.

4. Conclusions

Our results show that pterocarpan-enriched EASL enhanced the action of insulin by improving the structure of pancreatic islets of Langerhans in insulin target organs, as well as the liver and WAT, and thereby reduced plasma glucose and insulin levels and body weight gain. In addition, EASL increased the size of pancreatic islets and mRNA expression of β-cell proliferation-related genes. EASL modulated the expression of genes involved in hepatic gluconeogenesis, decreased hepatic steatosis, and improved plasma lipid profiles in mice. These results suggest that EASL dietary supplementation can prevent insulin resistance and β-cells dysfunction induced by a high-fat diet.

Acknowledgments

This study was supported by the grants from Agricultural Biotechnology Development Program (No. 111064-3) and High Value-added Food Technology Development Program (No. 313044-3) funded by the Ministry of Agriculture, Food and Rural Affairs, Republic of Korea.

Author Contributions

Un-Hee Kim, Jeong-Hyun Yoon, and Tae-Sook Jeong designed and carried out all the experiments, and wrote the paper. Hua Li and Ji-Hyun Kang provided research assistances. Hyeon-Seon Ji performed the HPLC analysis. Ki Hun Park, Dong-Ha Shin, Ho-Yong Park prepared the essential materials. All authors read and approved the final manuscript.

Conflicts of Interest

The authors declare no conflict of interest.

References

  1. Shaw, J.E.; Sicree, R.A.; Zimmet, P.Z. Global estimates of the prevalence of diabetes for 2010 and 2030. Diabetes Res. Clin. Pract. 2010, 87, 4–14. [Google Scholar] [CrossRef] [PubMed]
  2. American Diabetes Association. Diagnosis and Classification of Diabetes Mellitus. Diabetes Care 2010, 33, S62–S69. [Google Scholar]
  3. Kahn, S.E.; Hull, R.L.; Utzschneider, K.M. Mechanisms linking obesity to insulin resistance and type 2 diabetes. Nature 2006, 444, 840–846. [Google Scholar] [CrossRef] [PubMed]
  4. Donath, M.Y.; Ehses, J.A.; Maedler, K.; Schumann, D.M.; Ellingsgaard, H.; Eppler, E.; Reinecke, M. Mechanisms of β-Cell Death in Type 2 Diabetes. Diabetes 2005, 54, S108–S113. [Google Scholar] [CrossRef] [PubMed]
  5. Leto, D.; Saltiel, A.R. Regulation of glucose transport by insulin: Traffic control of GLUT4. Nat. Rev. Mol. Cell Biol. 2012, 13, 383–396. [Google Scholar] [CrossRef] [PubMed]
  6. Thong, F.S.; Dugani, C.B.; Klip, A. Turning signals on and off: GLUT4 traffic in the insulin-signaling highway. Physiology 2005, 20, 271–284. [Google Scholar] [CrossRef] [PubMed]
  7. Copps, K.D.; White, M.F. Regulation of insulin sensitivity by serine/threonine phosphorylation of insulin receptor substrate proteins IRS1 and IRS2. Diabetologia 2012, 55, 2565–2582. [Google Scholar] [CrossRef] [PubMed]
  8. Samuel, V.T.; Shulman, G.I. Mechanisms for insulin resistance: Common threads and missing links. Cell 2012, 148, 852–871. [Google Scholar] [CrossRef] [PubMed]
  9. Messina, M.; Barnes, S. The role of soy products in reducing risk of cancer. J. Natl. Cancer Inst. 1991, 83, 541–546. [Google Scholar] [CrossRef] [PubMed]
  10. Wu, A.H.; Yu, M.C.; Tseng, C.C.; Pike, M.C. Epidemiology of soy exposures and breast cancer risk. Br. J. Cancer 2008, 98, 9–14. [Google Scholar] [CrossRef] [PubMed]
  11. Nagata, C.; Takatsuka, N.; Kurisu, Y.; Shimizu, H. Decreased serum total cholesterol concentration is associated with high intake of soy products in Japanese men and women. J. Nutr. 1998, 128, 209–213. [Google Scholar] [PubMed]
  12. Jenkins, D.J.; Mirrahimi, A.; Srichaikul, K.; Berryman, C.E.; Wang, L.; Carleton, A.; Abdulnour, S.; Sievenpiper, J.L.; Kendall, C.W.; Kris-Etherton, P.M. Soy protein reduces serum cholesterol by both intrinsic and food displacement mechanisms. J. Nutr. 2010, 140, 2302S–2311S. [Google Scholar] [CrossRef] [PubMed]
  13. U.S. Department of Health & Human Services, Food and Drug Administration. Food Labeling: Health Claims; Soy Protein and Coronary Heart Disease; Federal Register: Washington, DC, USA, 1999; Volume 64, pp. 57700–57733.
  14. Sacks, F.M.; Lichtenstein, A.; van Horn, L.; Harris, W.; Kris-Etherton, P.; Winston, M. Soy protein, isoflavones, and cardiovascular health: An American Heart Association Science Advisory for professionals from the Nutrition Committee. Circulation 2006, 113, 1034–1044. [Google Scholar] [CrossRef] [PubMed]
  15. Kong, X.; Guo, M.; Hua, Y.; Cao, D.; Zhang, C. Enzymatic preparation of immunomodulating hydrolysates from soy proteins. Bioresour. Technol. 2008, 99, 8873–8879. [Google Scholar] [CrossRef] [PubMed]
  16. Masotti, A.I.; Buckley, N.; Champagne, C.P.; Green-Johnson, J. Immunomodulatory bioactivity of soy and milk ferments on monocyte and macrophage models. Food Res. Int. 2011, 44, 2475–2481. [Google Scholar] [CrossRef]
  17. Setchell, K.D. Phytoestrogens: The biochemistry, physiology, and implications for human health of soy isoflavones. Am. J. Clin. Nutr. 1998, 68, 1333S–1346S. [Google Scholar] [PubMed]
  18. Ho, H.M.; Chen, R.Y.; Leung, L.K.; Chan, F.L.; Huang, Y.; Chen, Z.Y. Difference in flavonoid and isoflavone profile between soybean and soy leaf. Biomed. Pharmacother. 2002, 56, 289–295. [Google Scholar] [CrossRef] [PubMed]
  19. Yuk, H.J.; Lee, J.H.; Curtis-Long, M.J.; Lee, J.W.; Kim, Y.S.; Ryu, H.W.; Park, C.G.; Jeong, T.S.; Park, K.H. The most abundant polyphenol of soy leaves, coumestrol, displays potent α-glucosidase inhibitory activity. Food Chem. 2011, 126, 1057–1063. [Google Scholar] [CrossRef]
  20. Lee, J.H.; Lee, B.W.; Kim, J.H.; Jeong, T.S.; Kim, M.J.; Lee, W.S.; Park, K.H. LDL-antioxidant pterocarpans from roots of Glycine max (L.) Merr. J. Agric. Food Chem. 2006, 54, 2057–2063. [Google Scholar] [CrossRef] [PubMed]
  21. Yuk, H.J.; Curtis-Long, M.J.; Ryu, H.W.; Jang, K.C.; Seo, W.D.; Kim, J.Y.; Kang, K.Y.; Park, K.H. Pterocarpan profiles for soybean leaves at different growth stages and investigation of their glycosidase inhibitions. J. Agric. Food Chem. 2011, 59, 12683–12690. [Google Scholar] [CrossRef] [PubMed]
  22. Kuete, V.; Sandjo, L.P.; Kwamou, G.M.; Wiench, B.; Nkengfack, A.E.; Efferth, T. Activity of three cytotoxic isoflavonoids from Erythrina excelsa and Erythrina senegalensis (neobavaisoflavone, sigmoidin H and isoneorautenol) toward multi-factorial drug resistant cancer cells. Phytomedicine 2014, 21, 682–688. [Google Scholar] [CrossRef] [PubMed]
  23. Liu, S.; Hsieh, D.; Yang, Y.L.; Xu, Z.; Peto, C.; Jablons, D.M.; You, L. Coumestrol from the national cancer Institute’s natural product library is a novel inhibitor of protein kinase CK2. BMC Pharmacol. Toxicol. 2013, 11, 14–36. [Google Scholar]
  24. Jantaratnotai, N.; Utaisincharoen, P.; Sanvarinda, P.; Thampithak, A.; Sanvarinda, Y. Phytoestrogens mediated anti-inflammatory effect through suppression of IRF-1 and pSTAT1 expressions in lipopolysaccharide-activated microglia. Int. Immunopharmacol. 2013, 17, 483–488. [Google Scholar] [CrossRef] [PubMed]
  25. Larner, J.; Brautigan, D.L.; Thorner, M.O. D-chiro-inositol glycans in insulin signaling and insulin resistance. Mol. Med. 2010, 16, 543–552. [Google Scholar] [CrossRef] [PubMed]
  26. Kou, K.; Saisho, Y.; Sato, S.; Yamada, T.; Itoh, H. Islet number rather than silet is a major determinant of β-cell and α-cell mass in humans. J. Clin. Endocrinol. Metab. 2014, 99, 1733–1740. [Google Scholar] [CrossRef] [PubMed]
  27. Peyot, M.L.; Pepin, E.; Lamontagne, J.; Latour, M.G.; Zarrouki, B.; Lussier, R.; Pineda, M.; Jetton, T.L.; Madiraju, S.R.; Joly, E.; et al. Beta-cell failure in diet-induced obese mice stratified according to body weight gain: secretory dysfunction and altered islet lipid metabolism without steatosis or reduced beta-cell mass. Diabetes 2010, 59, 2178–2187. [Google Scholar] [CrossRef] [PubMed]
  28. Choi, M.S.; Ryu, R.; Seo, Y.R.; Jeong, T.S.; Shin, D.H.; Park, Y.B.; Kim, S.R.; Jung, U.J. The beneficial effect of soybean (Glycine max (L.) Merr.) leaf extracts in adults with prediabetes: A randomized placebo controlled trial. Food Funct. 2014, 25, 1621–1630. [Google Scholar] [CrossRef]
  29. Kim, J.E.; Jeon, S.M.; Park, K.H.; Lee, W.S.; Jeong, T.S.; McGregor, R.A.; Choi, M.S. Does Glycine max leaves or Garcinia Cambogia promote weight-loss or lower plasma cholesterol in overweight individuals: a randomized control trial. Nutr. J. 2011, 10, 94. [Google Scholar] [CrossRef] [PubMed]
  30. Vishwakarma, S.K.; Rahamathulla, S.; Bardia, A.; Tiwari, S.K.; Srinivas, G.; Raj, A.; Tripura, C.; Sandhya, A.; Habeeb, M.A.; Khan, A.A.; et al. In vitro quantitative and relative gene expression analysis of pancreatic transcription factors Pdx-1, Ngn-3, Isl-1, Pax-4, Pax-6 and Nkx-6.1 in trans-differentiated human hepatic progenitors. J. Diabetes Investig. 2014, 5, 492–500. [Google Scholar] [CrossRef]
  31. Kaneto, H.; Miyatsuka, T.; Fujitani, Y.; Noguchi, H.; Song, K.H.; Yoon, K.H.; Matsuoka, T.A. Role of PDX-1 and MafA as a potential therapeutic target for diabetes. Diabetes Res. Clin. Pract. 2007, 77, S127–S137. [Google Scholar] [CrossRef] [PubMed]
  32. Vetere, A.; Choudhary, A.; Burns, S.M.; Wagner, B.K. Targeting the pancreatic β-cell to treat diabetes. Nat. Rev. Drug Discov. 2014, 13, 278–289. [Google Scholar] [CrossRef] [PubMed]
  33. Al-Hasani, K.; Pfeifer, A.; Courtney, M.; Ben-Othman, N.; Gjernes, E.; Vieira, A.; Druelle, N.; Avolio, F.; Ravassard, P.; Leuckx, G.; et al. Adult duct-lining cells can reprogram into β-like cells able to counter repeated cycles of toxin-induced diabetes. Dev. Cell 2013, 26, 86–100. [Google Scholar] [CrossRef] [PubMed]
  34. Leibiger, I.B.; Leibiger, B.; Berggren, P.O. Insulin signaling in the pancreatic beta-cell. Annu. Rev. Nutr. 2008, 28, 233–251. [Google Scholar] [CrossRef] [PubMed]
  35. Bates, S.H.; Jones, R.B.; Bailey, C.J. Insulin-like effect of pinitol. Br. J. Pharmacol. 2000, 130, 1944–1948. [Google Scholar] [PubMed]
  36. Davis, A.; Christiansen, M.; Horowitz, J.F.; Klein, S.; Hellerstein, M.K.; Ostlund, R.E., Jr. Effect of pinitol treatment on insulin action in subjects with insulin resistance. Diabetes Care 2000, 23, 1000–1005. [Google Scholar] [CrossRef] [PubMed]
  37. Geethan, P.K.; Prince, P.S. Antihyperlipidemic effect of D-pinitol on streptozotocin-induced diabetic Wistar rats. J. Biochem. Mol. Toxicol. 2008, 22, 220–224. [Google Scholar] [CrossRef] [PubMed]
  38. Kim, J.I.; Kim, J.C.; Kang, M.J.; Lee, M.S.; Kim, J.J.; Cha, I.J. Effects of pinitol isolated from soybeans on glycaemic control and cardiovascular risk factors in Korean patients with type II diabetes mellitus: a randomized controlled study. Eur. J. Clin. Nutr. 2005, 59, 456–458. [Google Scholar] [CrossRef] [PubMed]
  39. Sivakumar, S.; Palsamy, P.; Subramanian, S.P. Impact of D-pinitol on the attenuation of proinflammatory cytokines, hyperglycemia-mediated oxidative stress and protection of kidney tissue ultrastructure in streptozotocin-induced diabetic rats. Chem. Biol. Interact. 2010, 188, 237–245. [Google Scholar] [CrossRef] [PubMed]
  40. Saltiel, A.R.; Kahn, C.R. Insulin signaling and the regulation of glucose and lipid metabolism. Nature 2001, 414, 799–806. [Google Scholar] [CrossRef] [PubMed]
  41. Altarejos, J.Y.; Montminy, M. CREB and the CRTC co-activators: sensors for hormonal and metabolic signals. Nat. Rev. Mol. Cell Biol. 2011, 12, 141–151. [Google Scholar] [CrossRef] [PubMed]
  42. Matsumoto, M.; Accili, D. The tangled path to glucose production. Nat. Med. 2006, 12, 33–34. [Google Scholar] [CrossRef] [PubMed]
  43. Jitrapakdee, S. Transcription factors and coactivators controlling nutrient and hormonal regulation of hepatic gluconeogenesis. Int. J. Biochem. Cell Biol. 2012, 44, 33–45. [Google Scholar] [CrossRef] [PubMed]
  44. Olefsky, J.M.; Glass, C.K. Macrophages, inflammation, and insulin resistance. Annu. Rev. Physiol. 2010, 72, 219–246. [Google Scholar] [CrossRef] [PubMed]
  45. Xu, H.; Barnes, G.T.; Yang, Q.; Tan, G.; Yang, D.; Chou, C.J.; Sole, J.; Nichols, A.; Ross, J.S.; Tartaglia, L.A.; et al. Chronic inflammation in fat plays a crucial role in the development of obesity-related insulin resistance. J. Clin. Investig. 2003, 112, 1821–1830. [Google Scholar] [CrossRef] [PubMed]
  46. Donath, M.Y.; Shoelson, S.E. Type 2 diabetes as an inflammatory disease. Nat. Rev. Immunol. 2011, 11, 98–107. [Google Scholar] [CrossRef] [PubMed]
  47. Kristiansen, O.P.; Mandrup-Poulsen, T. Interleukin-6 and diabetes: The good, the bad, or the indifferent? Diabetes 2005, 54, S114–S124. [Google Scholar] [CrossRef]
  48. Permana, P.A.; Menge, C.; Reaven, P.D. Macrophage-secreted factors induce adipocyte inflammation and insulin resistance. Biochem. Biophys. Res. Commun. 2006, 341, 507–514. [Google Scholar] [CrossRef] [PubMed]
  49. Matthews, D.R.; Hosker, J.P.; Rudenski, A.S.; Naylor, B.A.; Treacher, D.F.; Turner, R.C. Homeostasis model assessment: Insulin resistance and beta-cell function from fasting plasma glucose and insulin concentrations in man. Diabetologia 1985, 28, 412–419. [Google Scholar] [CrossRef] [PubMed]
  • Sample Availability: Ethyl acetate extracts of soy leaves (EASL) are available from the corresponding author Tae-Sook Jeong.

