ROS-Mediated Cytotoxic Effect of Copper(II) Hydrazone Complexes against Human Glioma Cells

Abstract
:
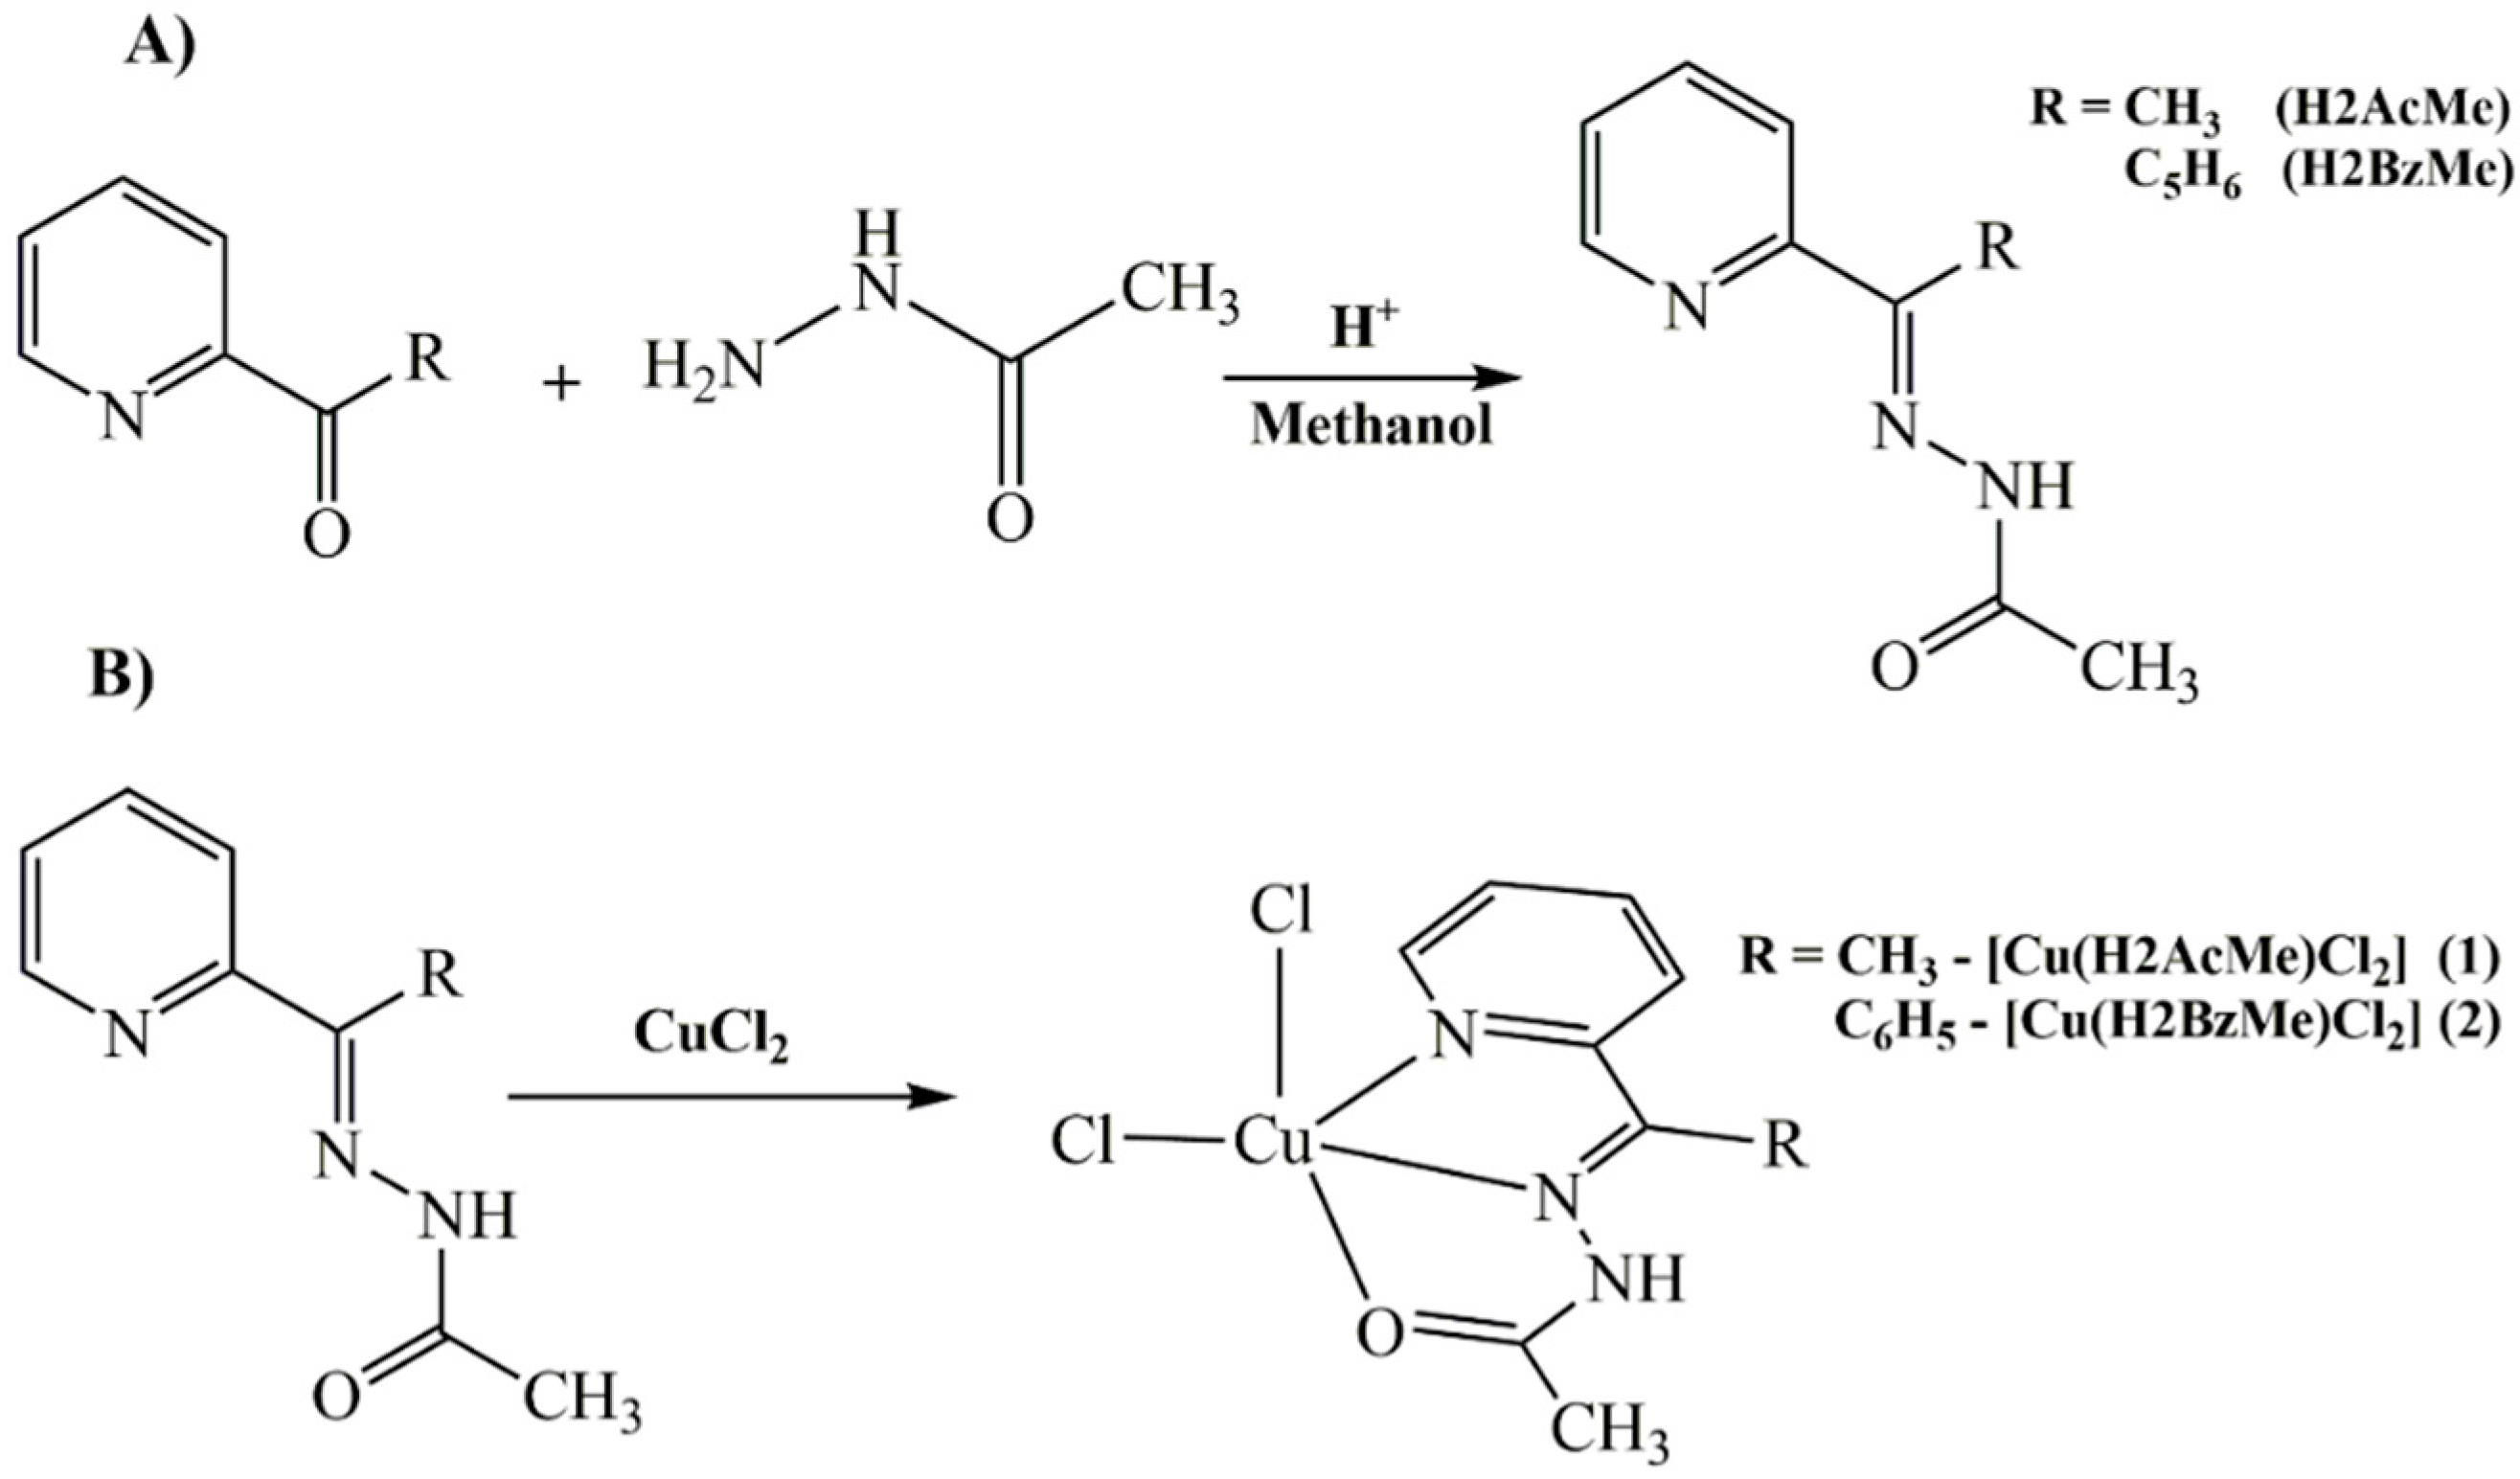
1. Introduction
2. Results and Discussion

2.1. Cytotoxic Activity against Malignant U-87 and T-98 Glioma Cells and against MRC5 Cells

| Compounds | IC50 [µM] | ||
|---|---|---|---|
| U87 | T98 | MRC5 | |
| H2AcMe | 67.6 ± 4.08 | 13.80 ± 4.89 | 19.80 ± 4.15 |
| [Cu(H2AcMe)Cl2] (1) | 3.02 ± 0.85 | 5.08 ± 0.41 | 22.50 ± 3.13 |
| H2BzMe | 52.30 ± 10.03 | 19.70 ± 1.06 | 62.30 ± 7.76 |
| [Cu(H2BzMe)Cl2] (2) | 5.95 ± 0.74 | 29.40 ± 7.06 | 49.40 ± 8.83 |
| CuCl2 | >100 | >100 | >100 |
| Cisplatin | 1.76 ± 0.22 | 5.31 ± 1.94 | 5.05 ± 0.71 |
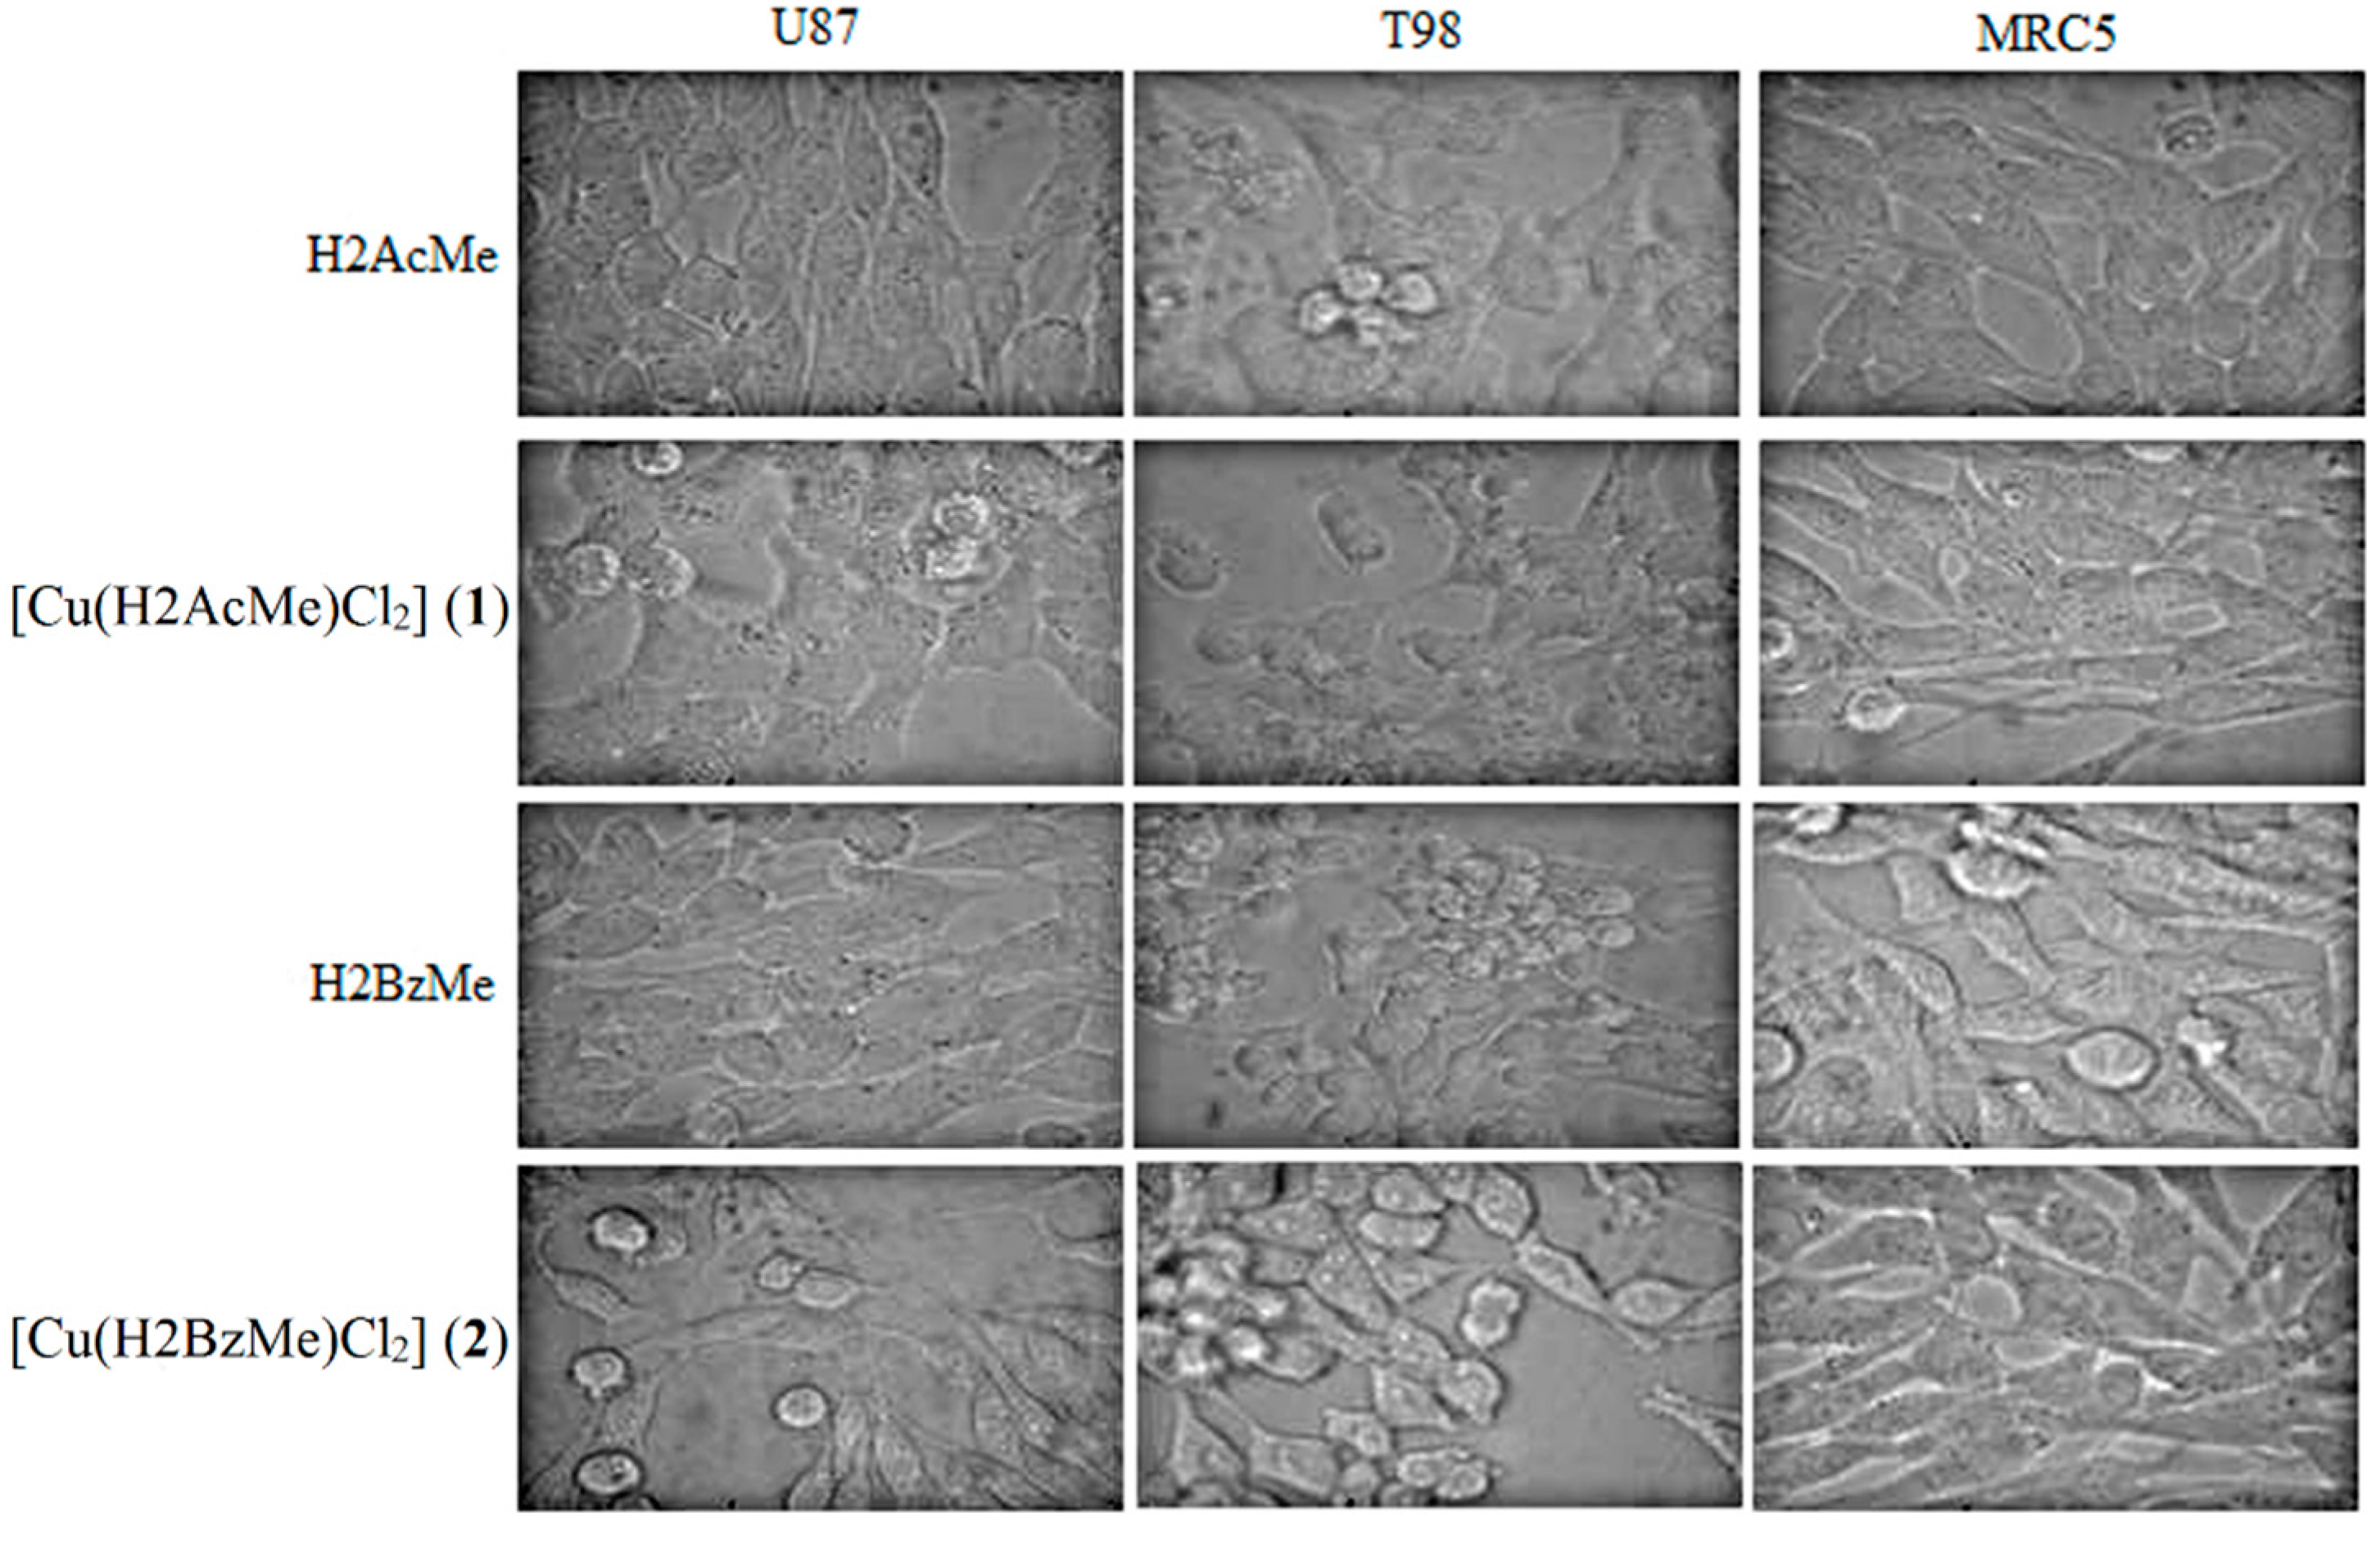
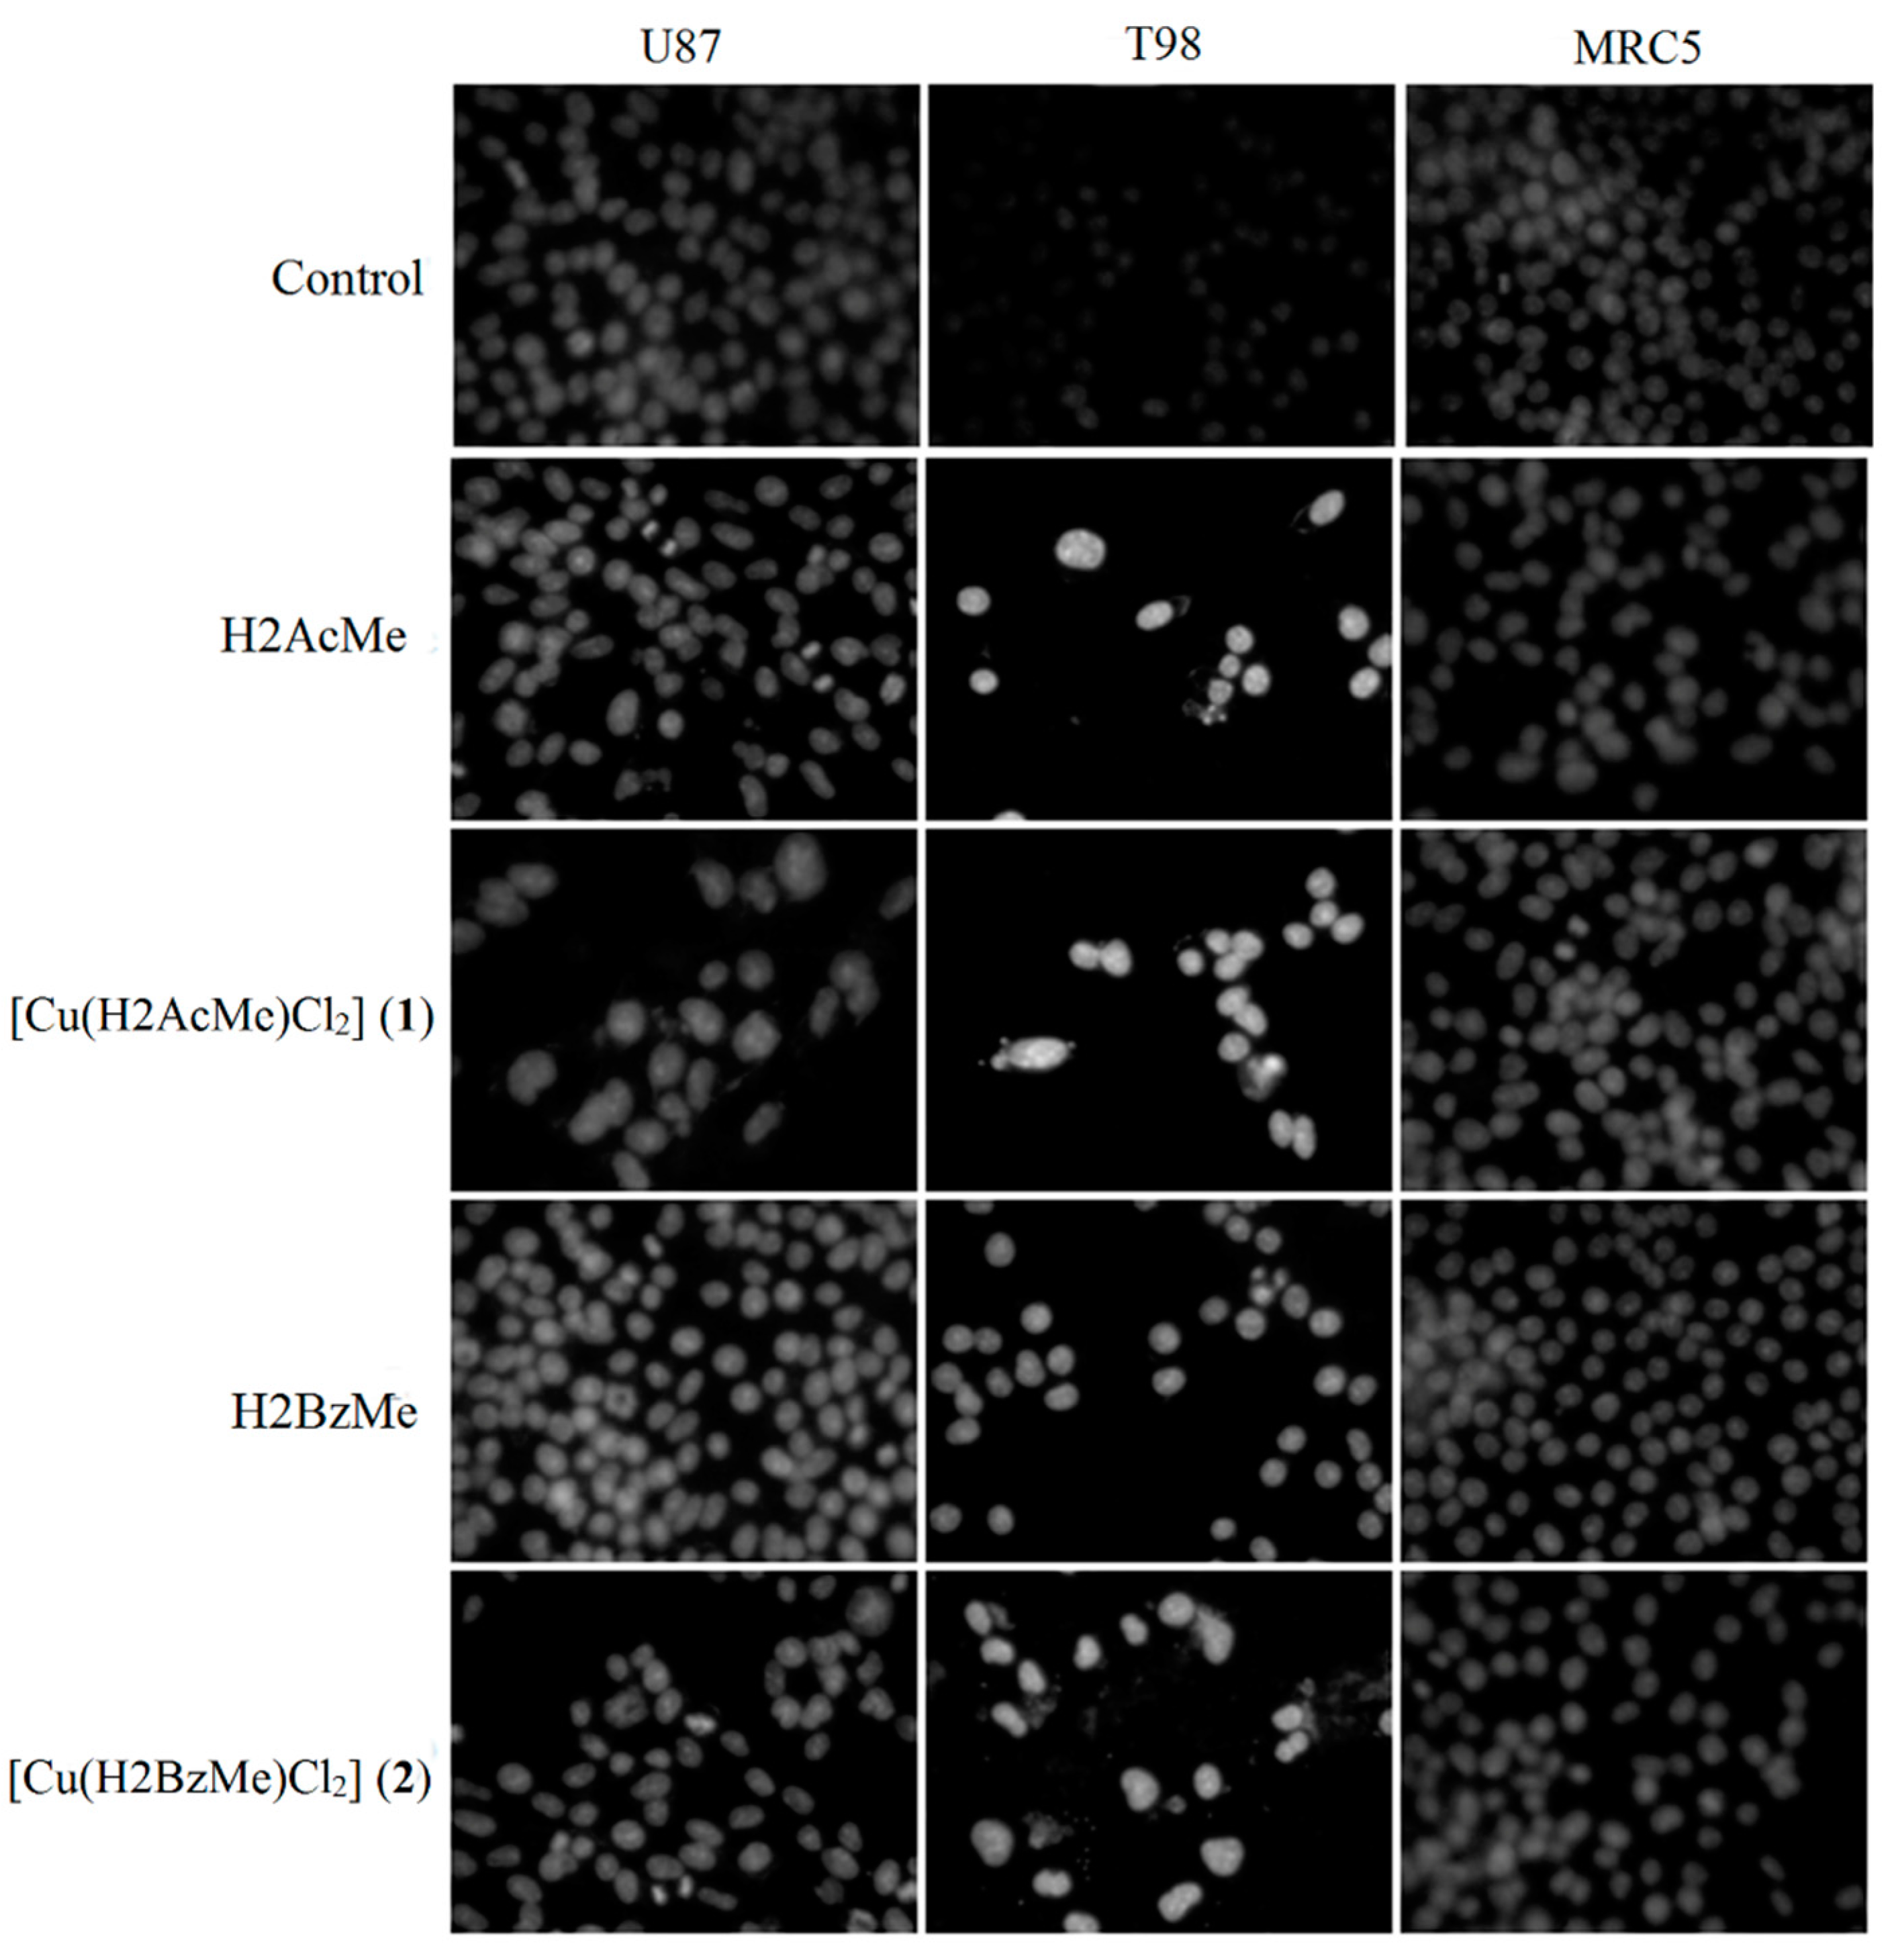
2.2. Analysis of Morphological Changes

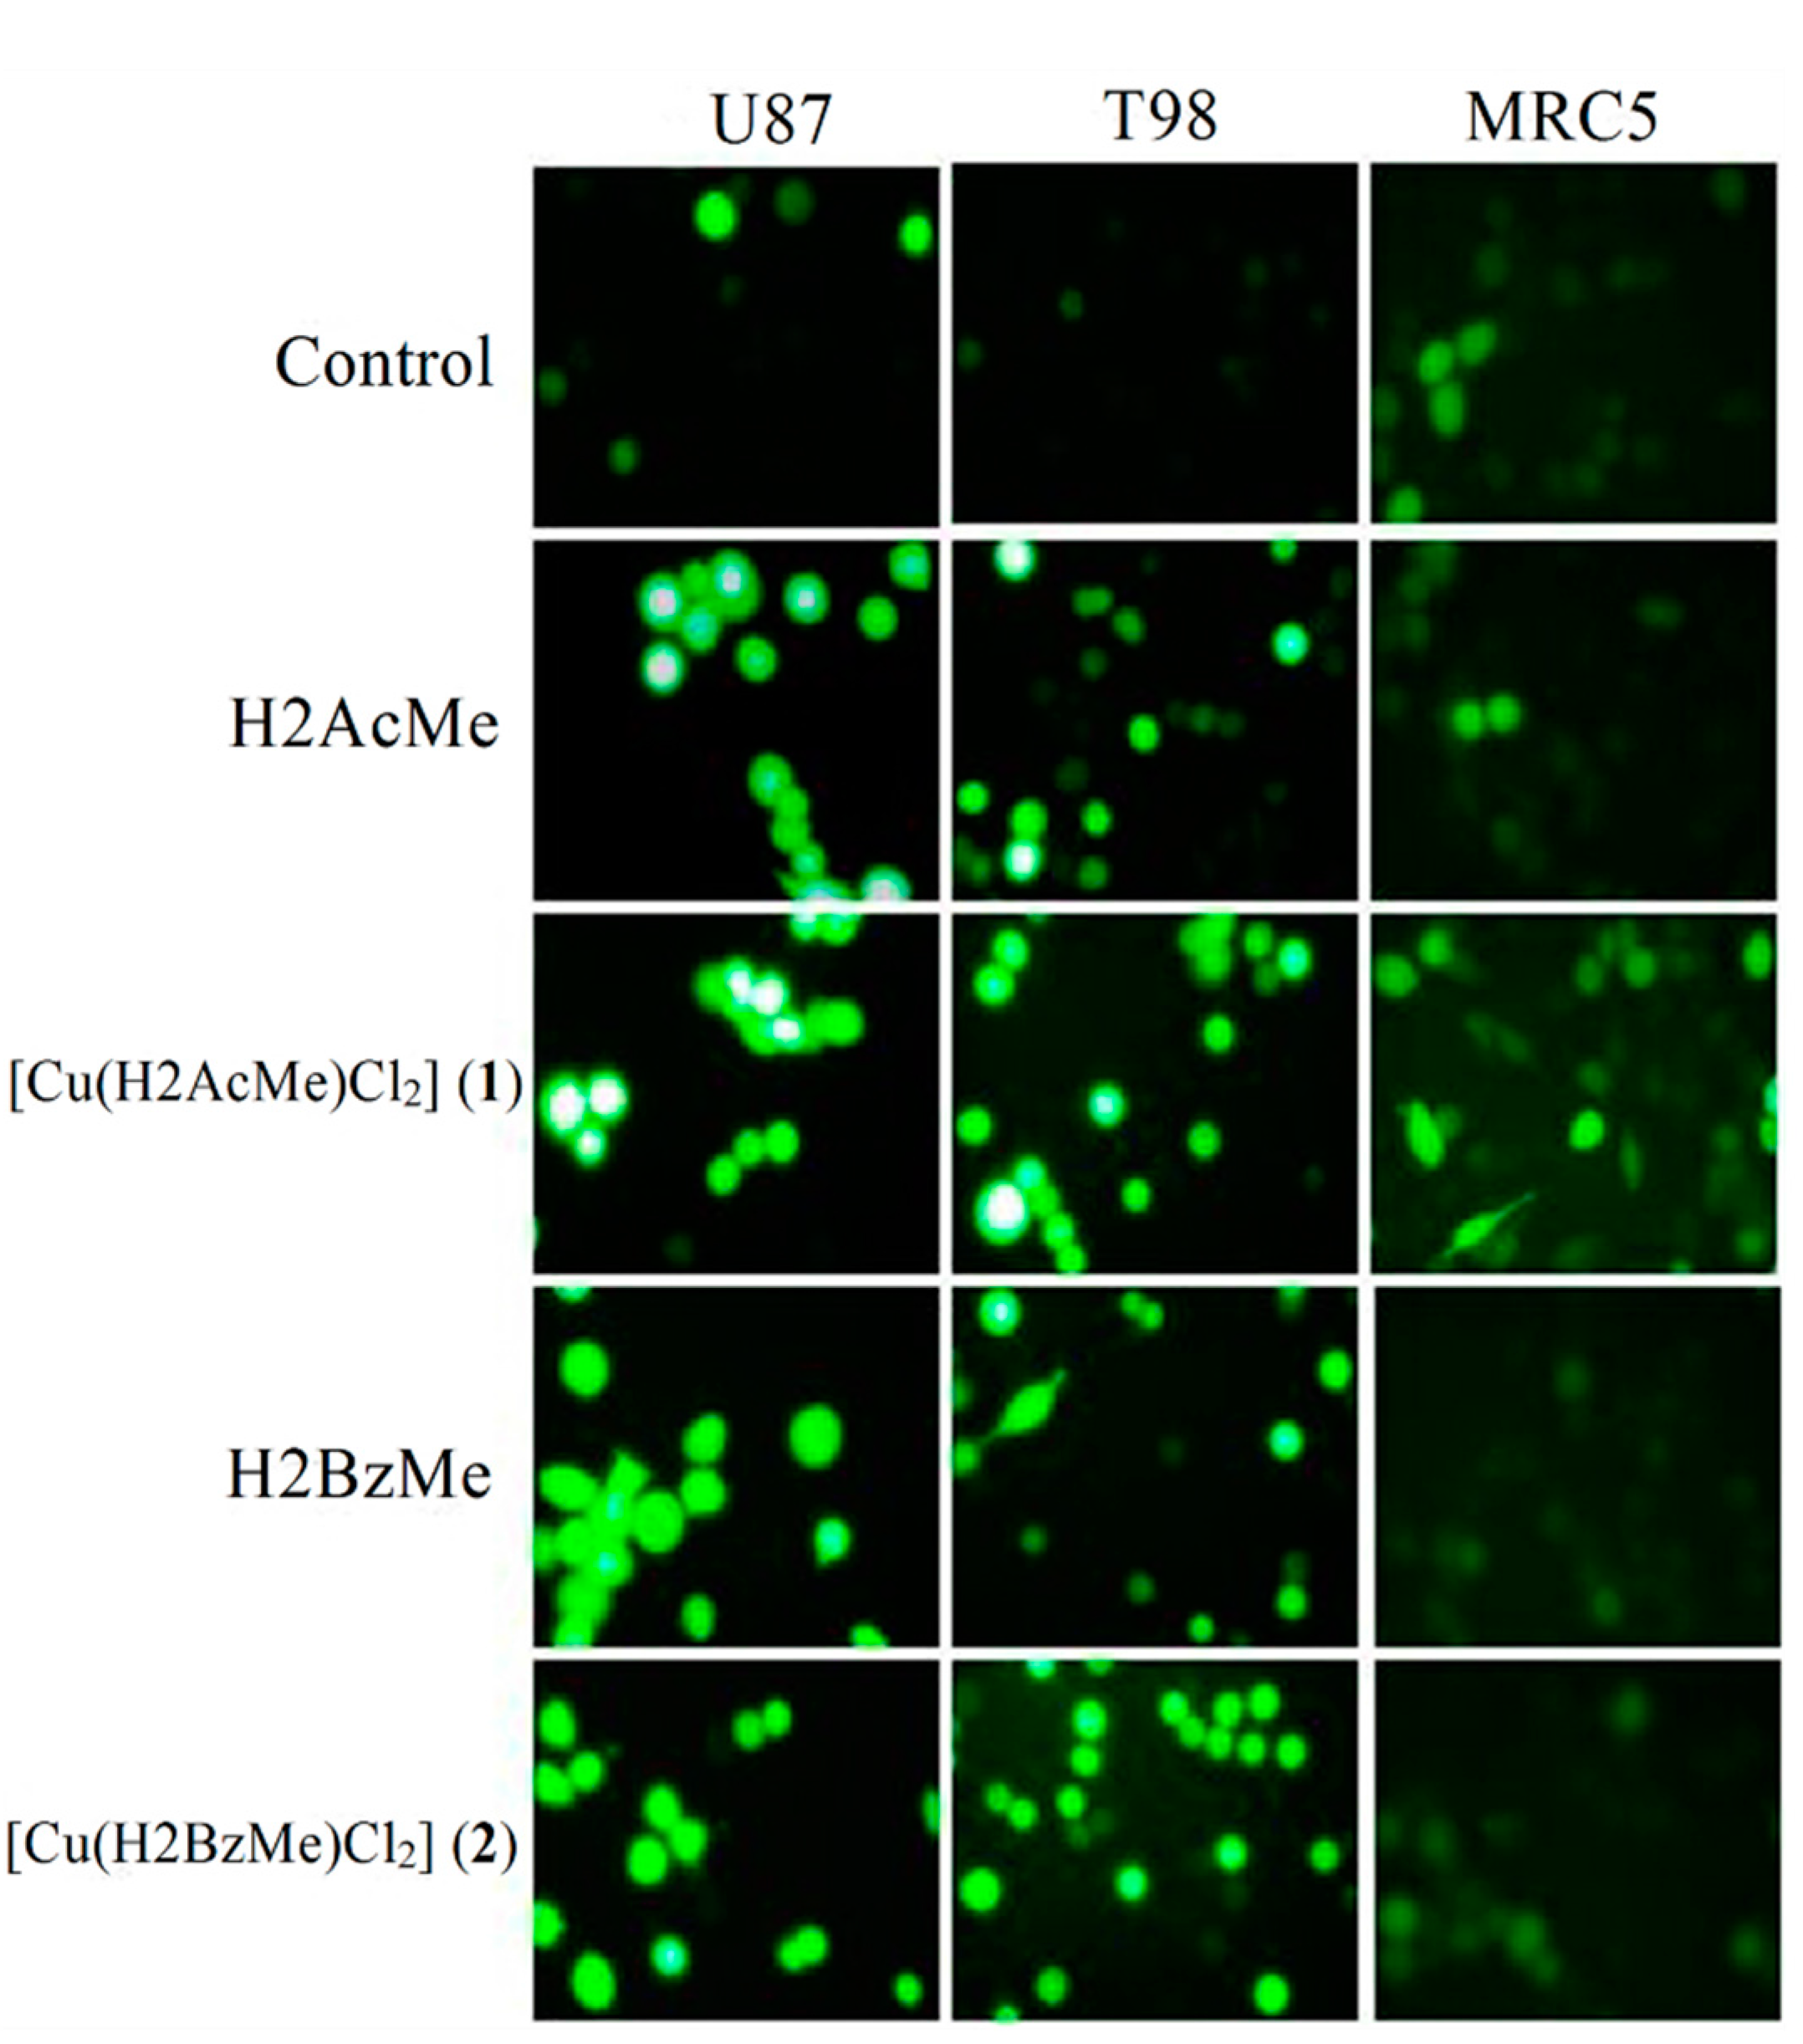
2.3. Analysis of Chromosomal DNA Alterations
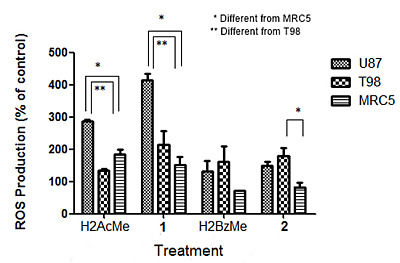
2.4. Measurement of Reactive Oxygen Species (ROS) Generation


2.5. DNA Binding Studies
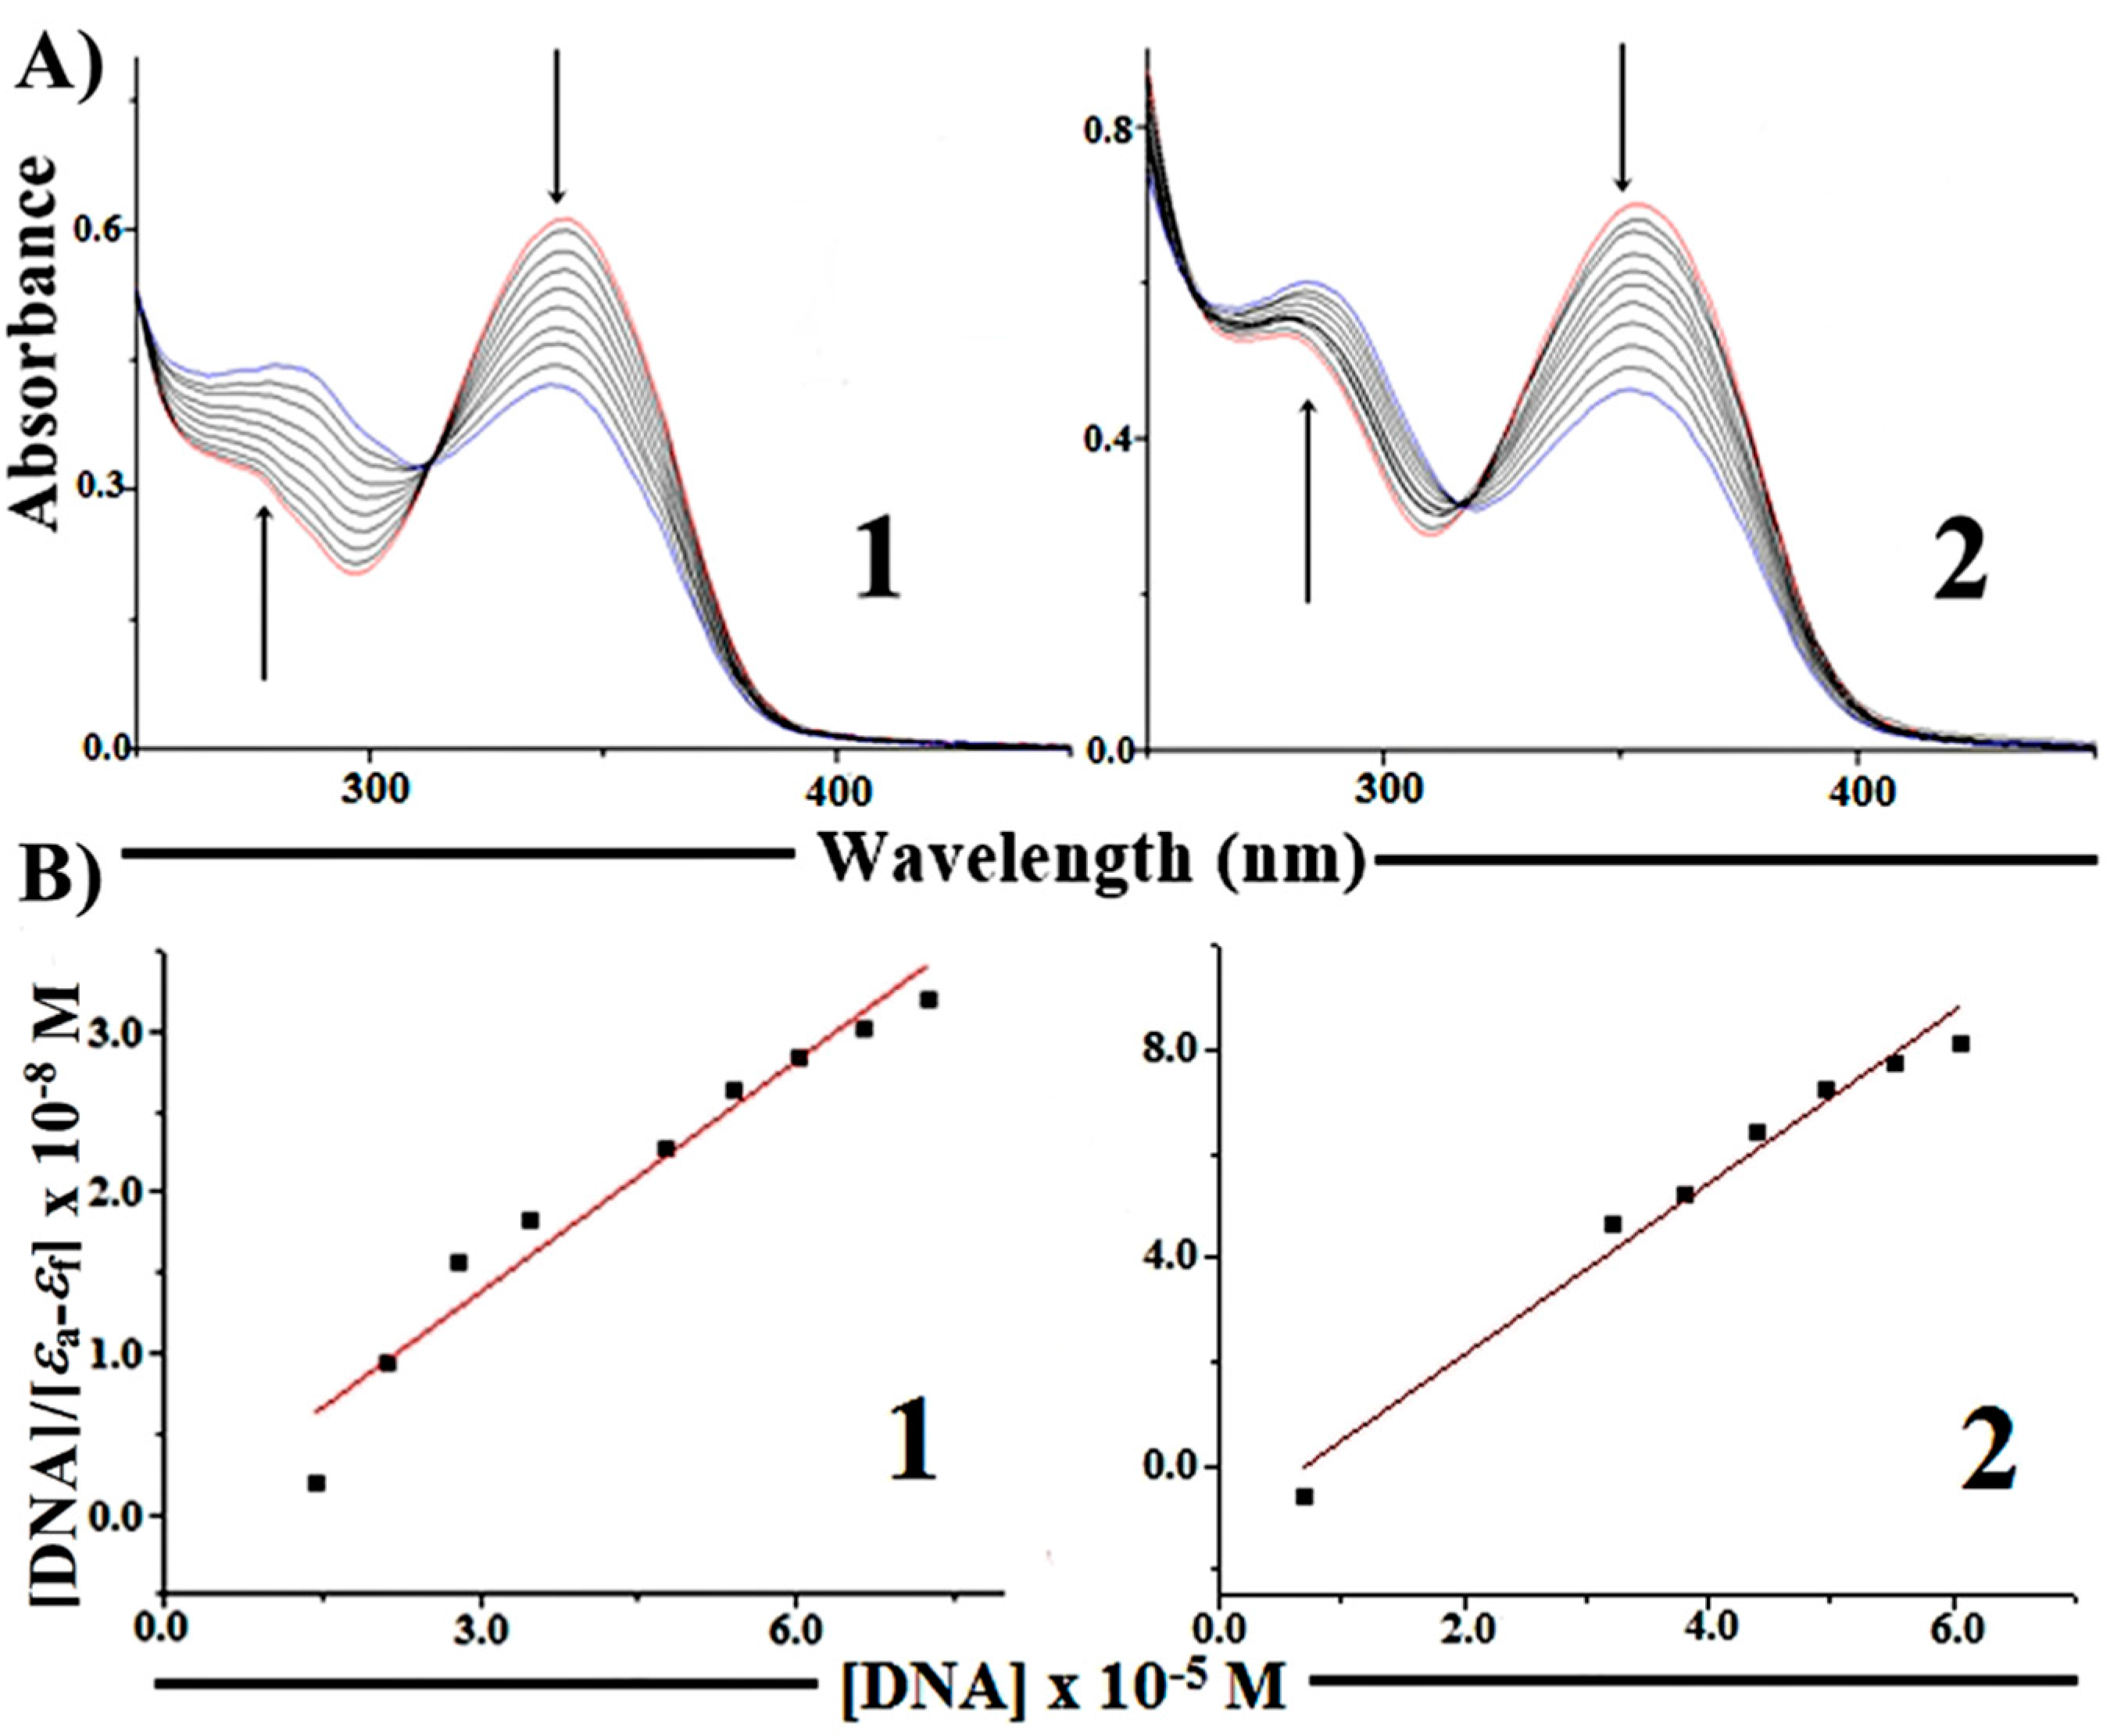
2.5.1. Absorption Spectroscopy Studies of DNA Binding

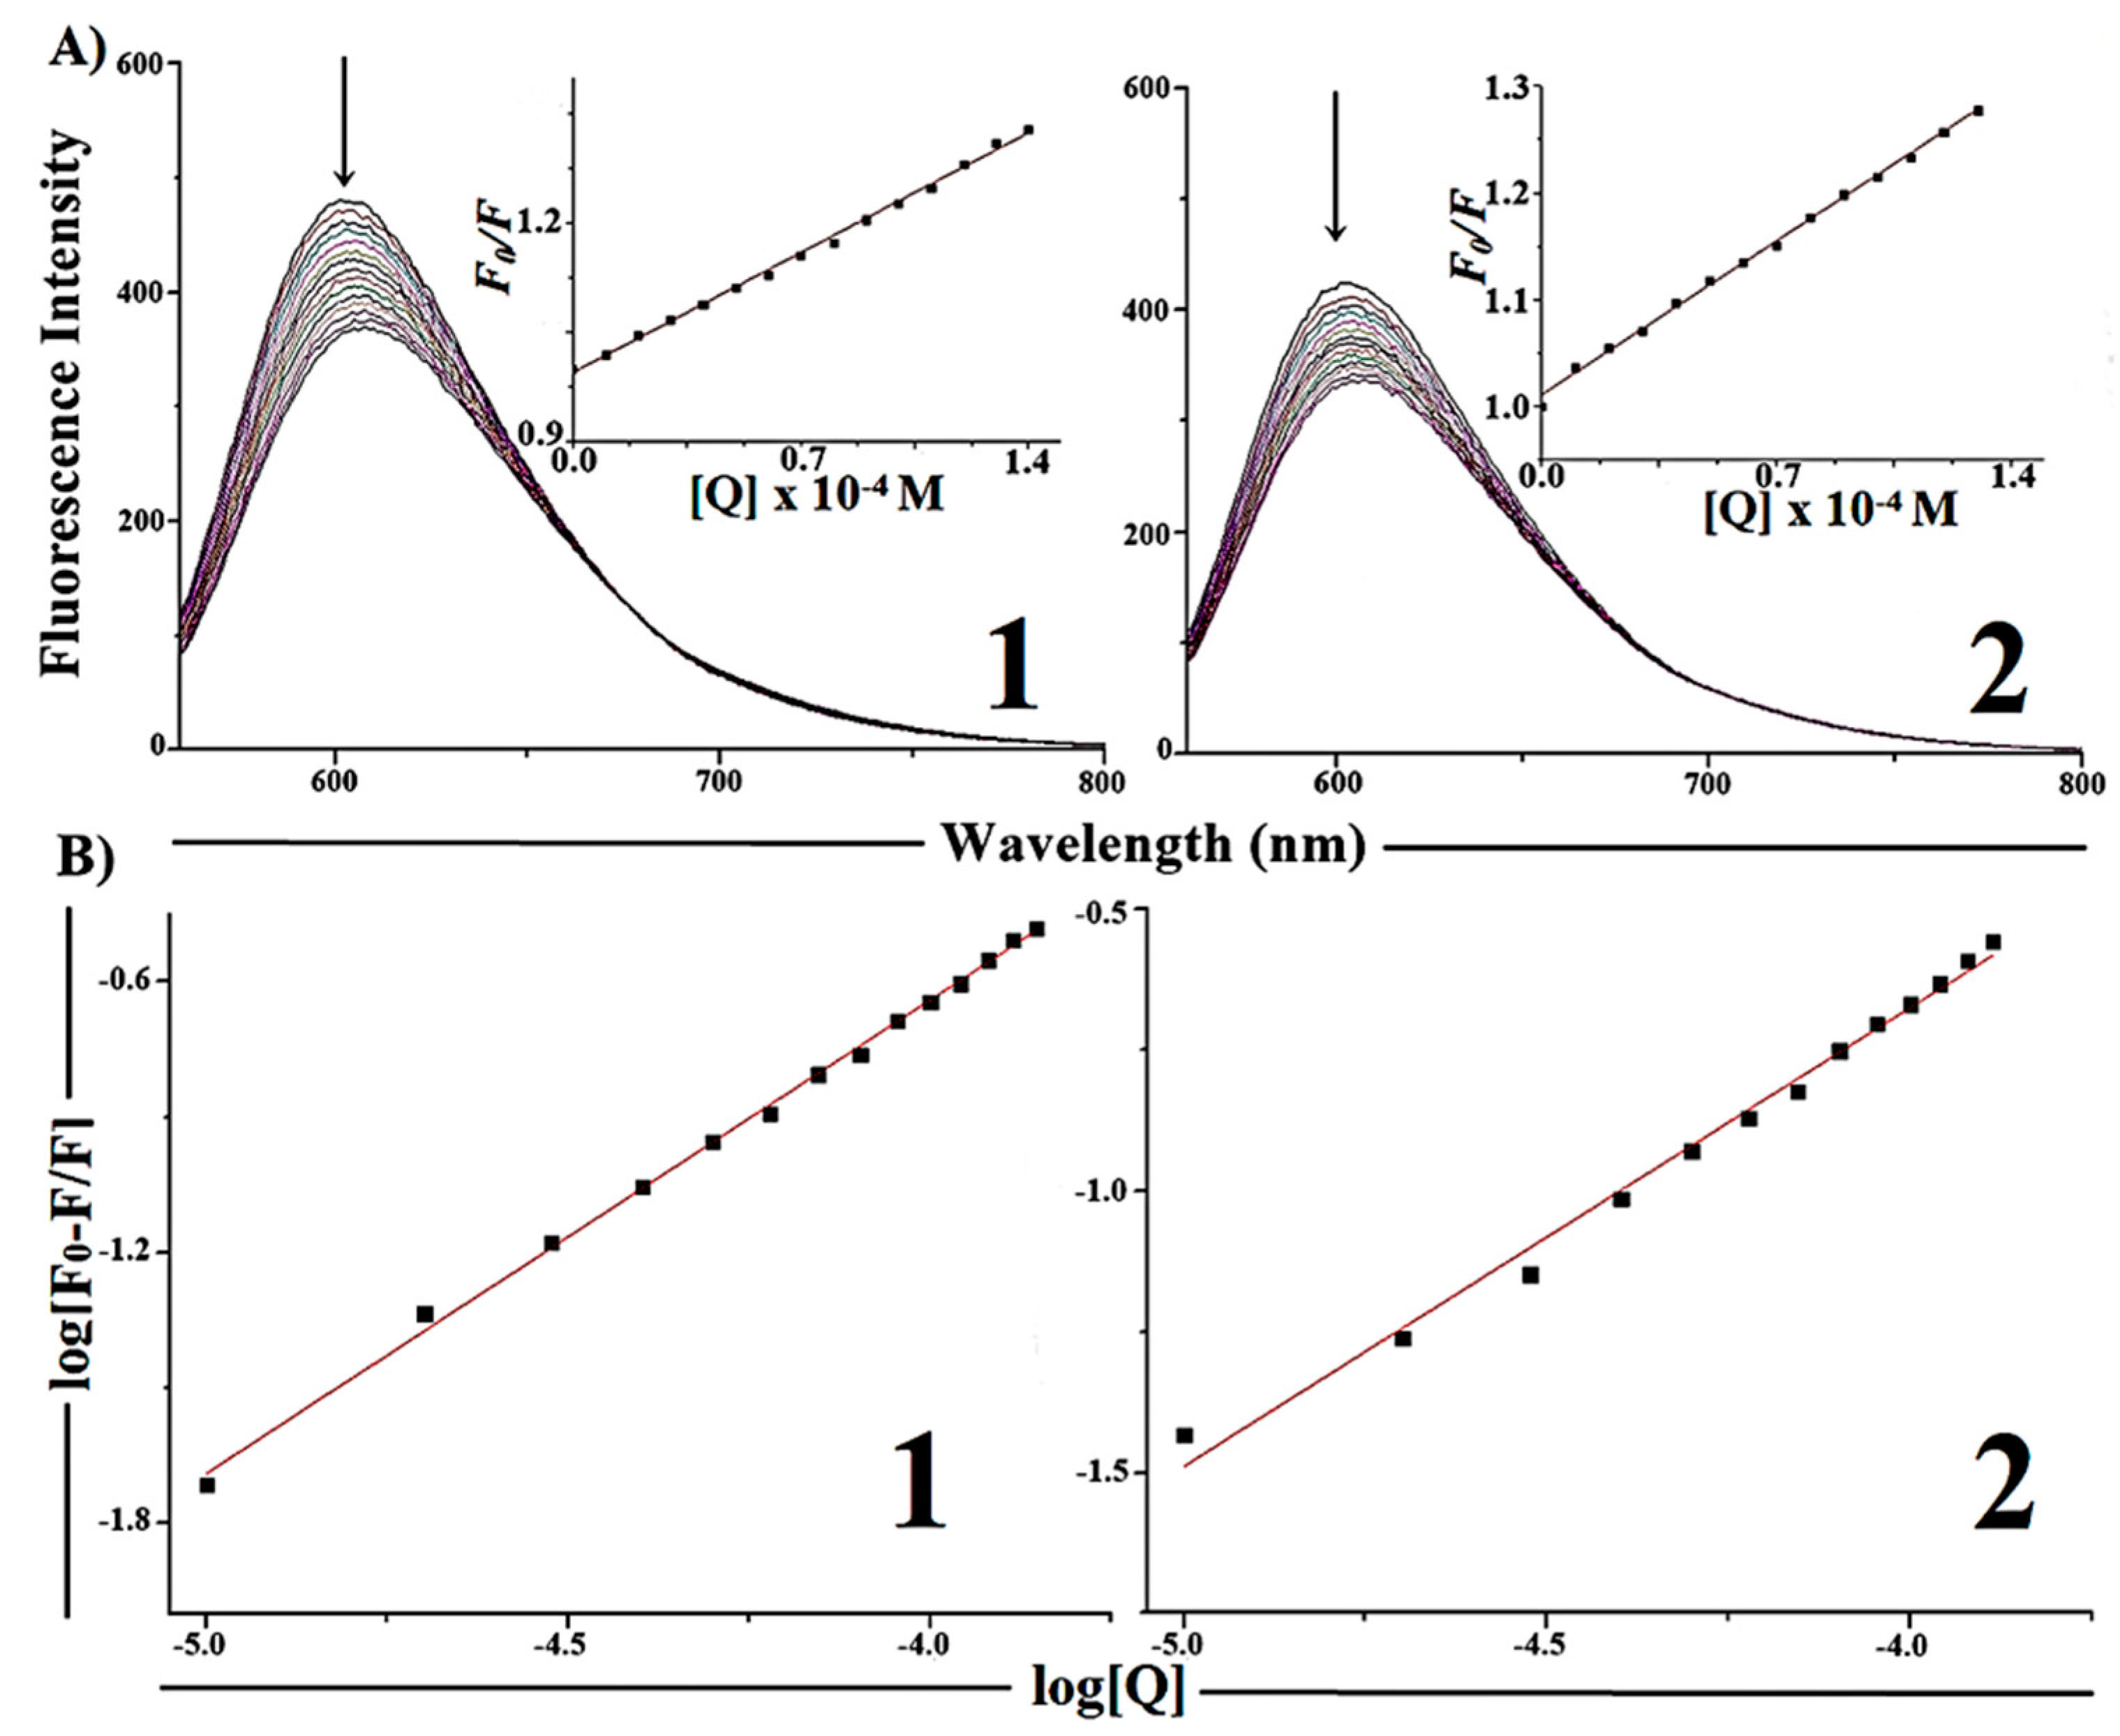
2.5.2. Competitive Binding between EB and Complexes 1 and 2 for CT-DNA

| Complexes | Ksv [M−1] | Kapp [M−1] | K [M−1] | n |
|---|---|---|---|---|
| [Cu(H2AcMe)Cl2] ( 1) | (2.35 ± 0.03) × 103 | 2.34 × 10⁵ | (0.35 ± 0.01) × 104 | 1.04 ± 0.01 |
| [Cu(H2BzMe)Cl2] (2) | (2.05 ± 0.03) × 103 | 2.07 × 10⁵ | (0.38 ± 0.01) × 103 | 0.81 ± 0.02 |
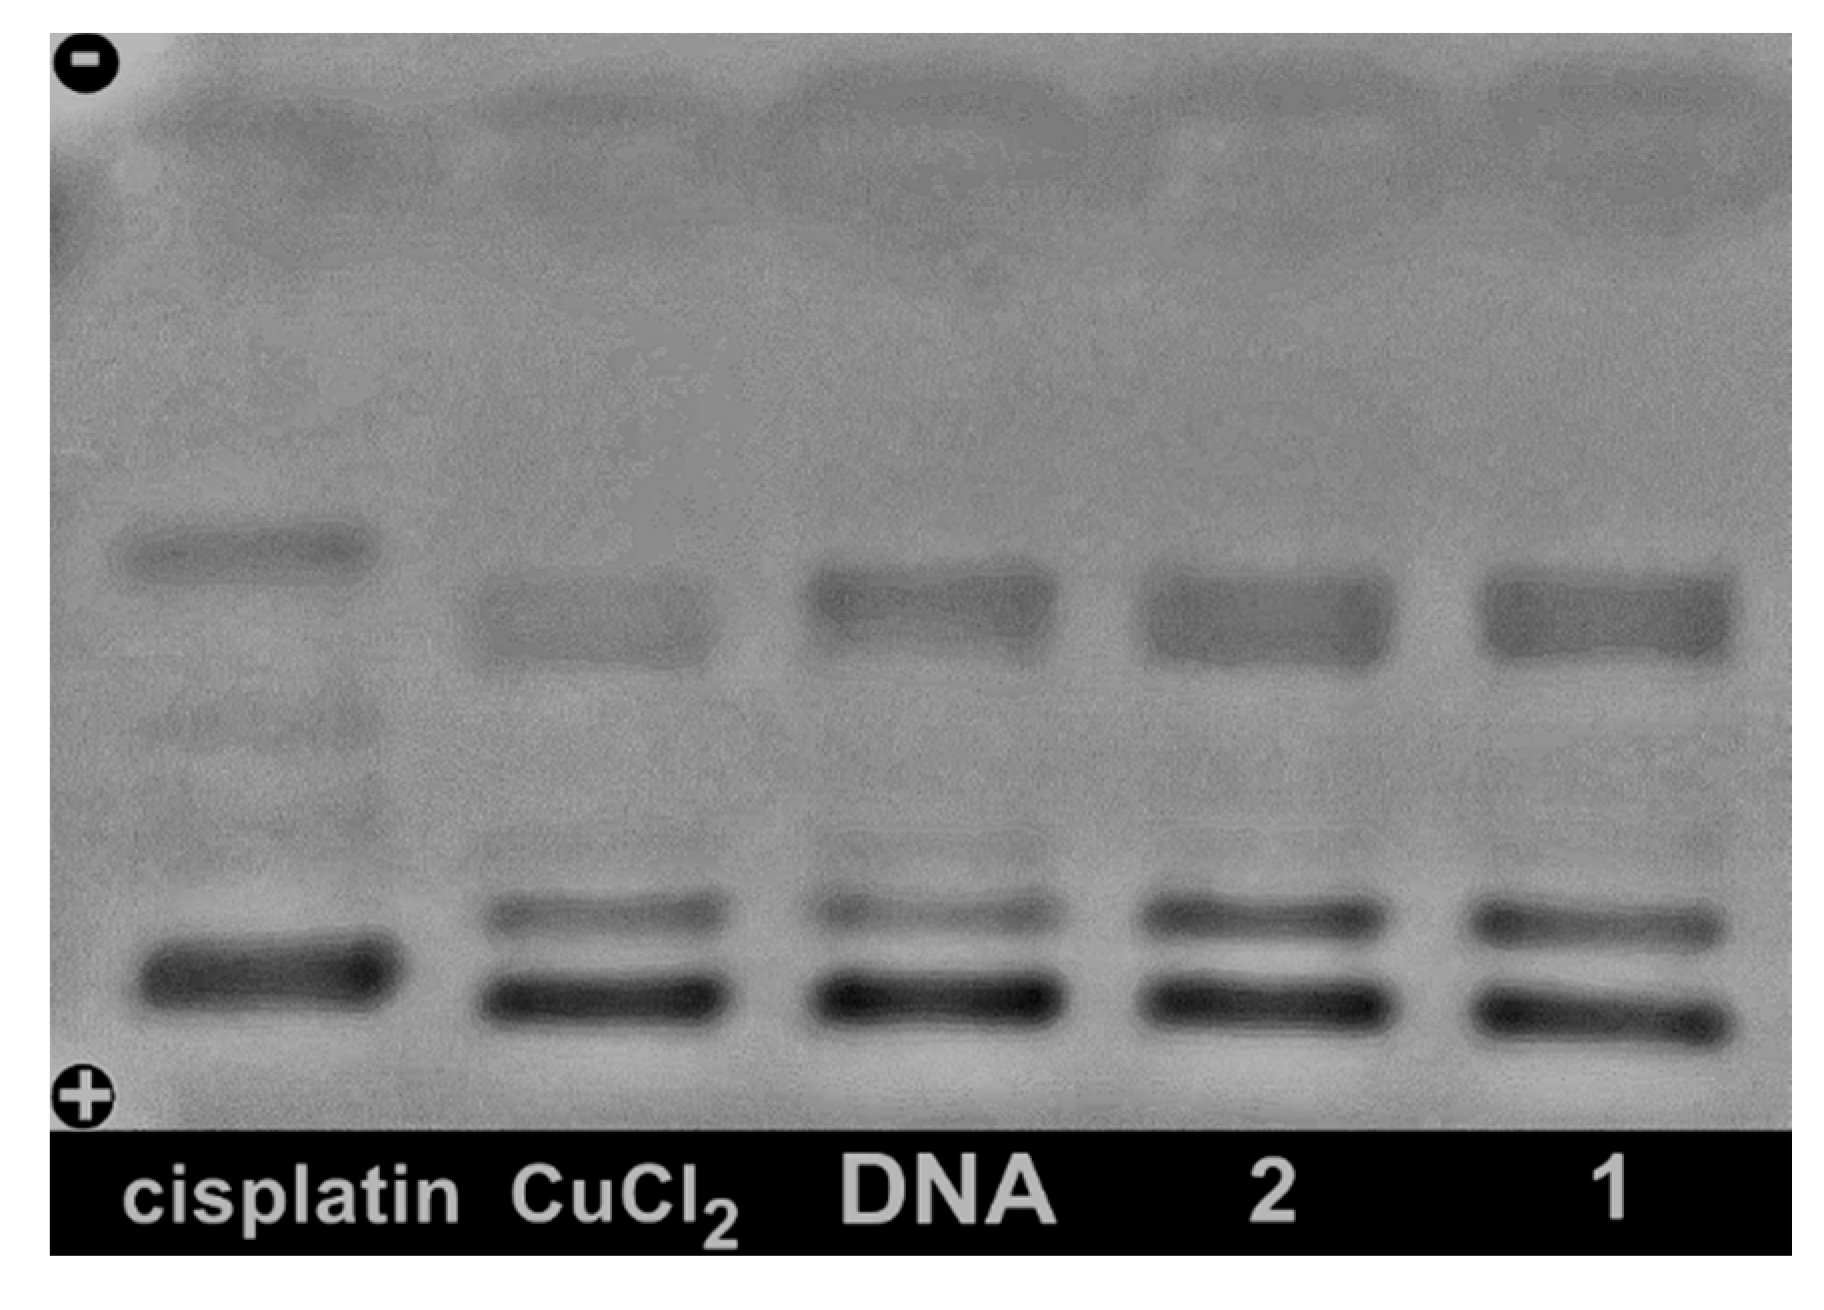
2.6. Studies of Interactions with Supercoiled Plasmid DNA

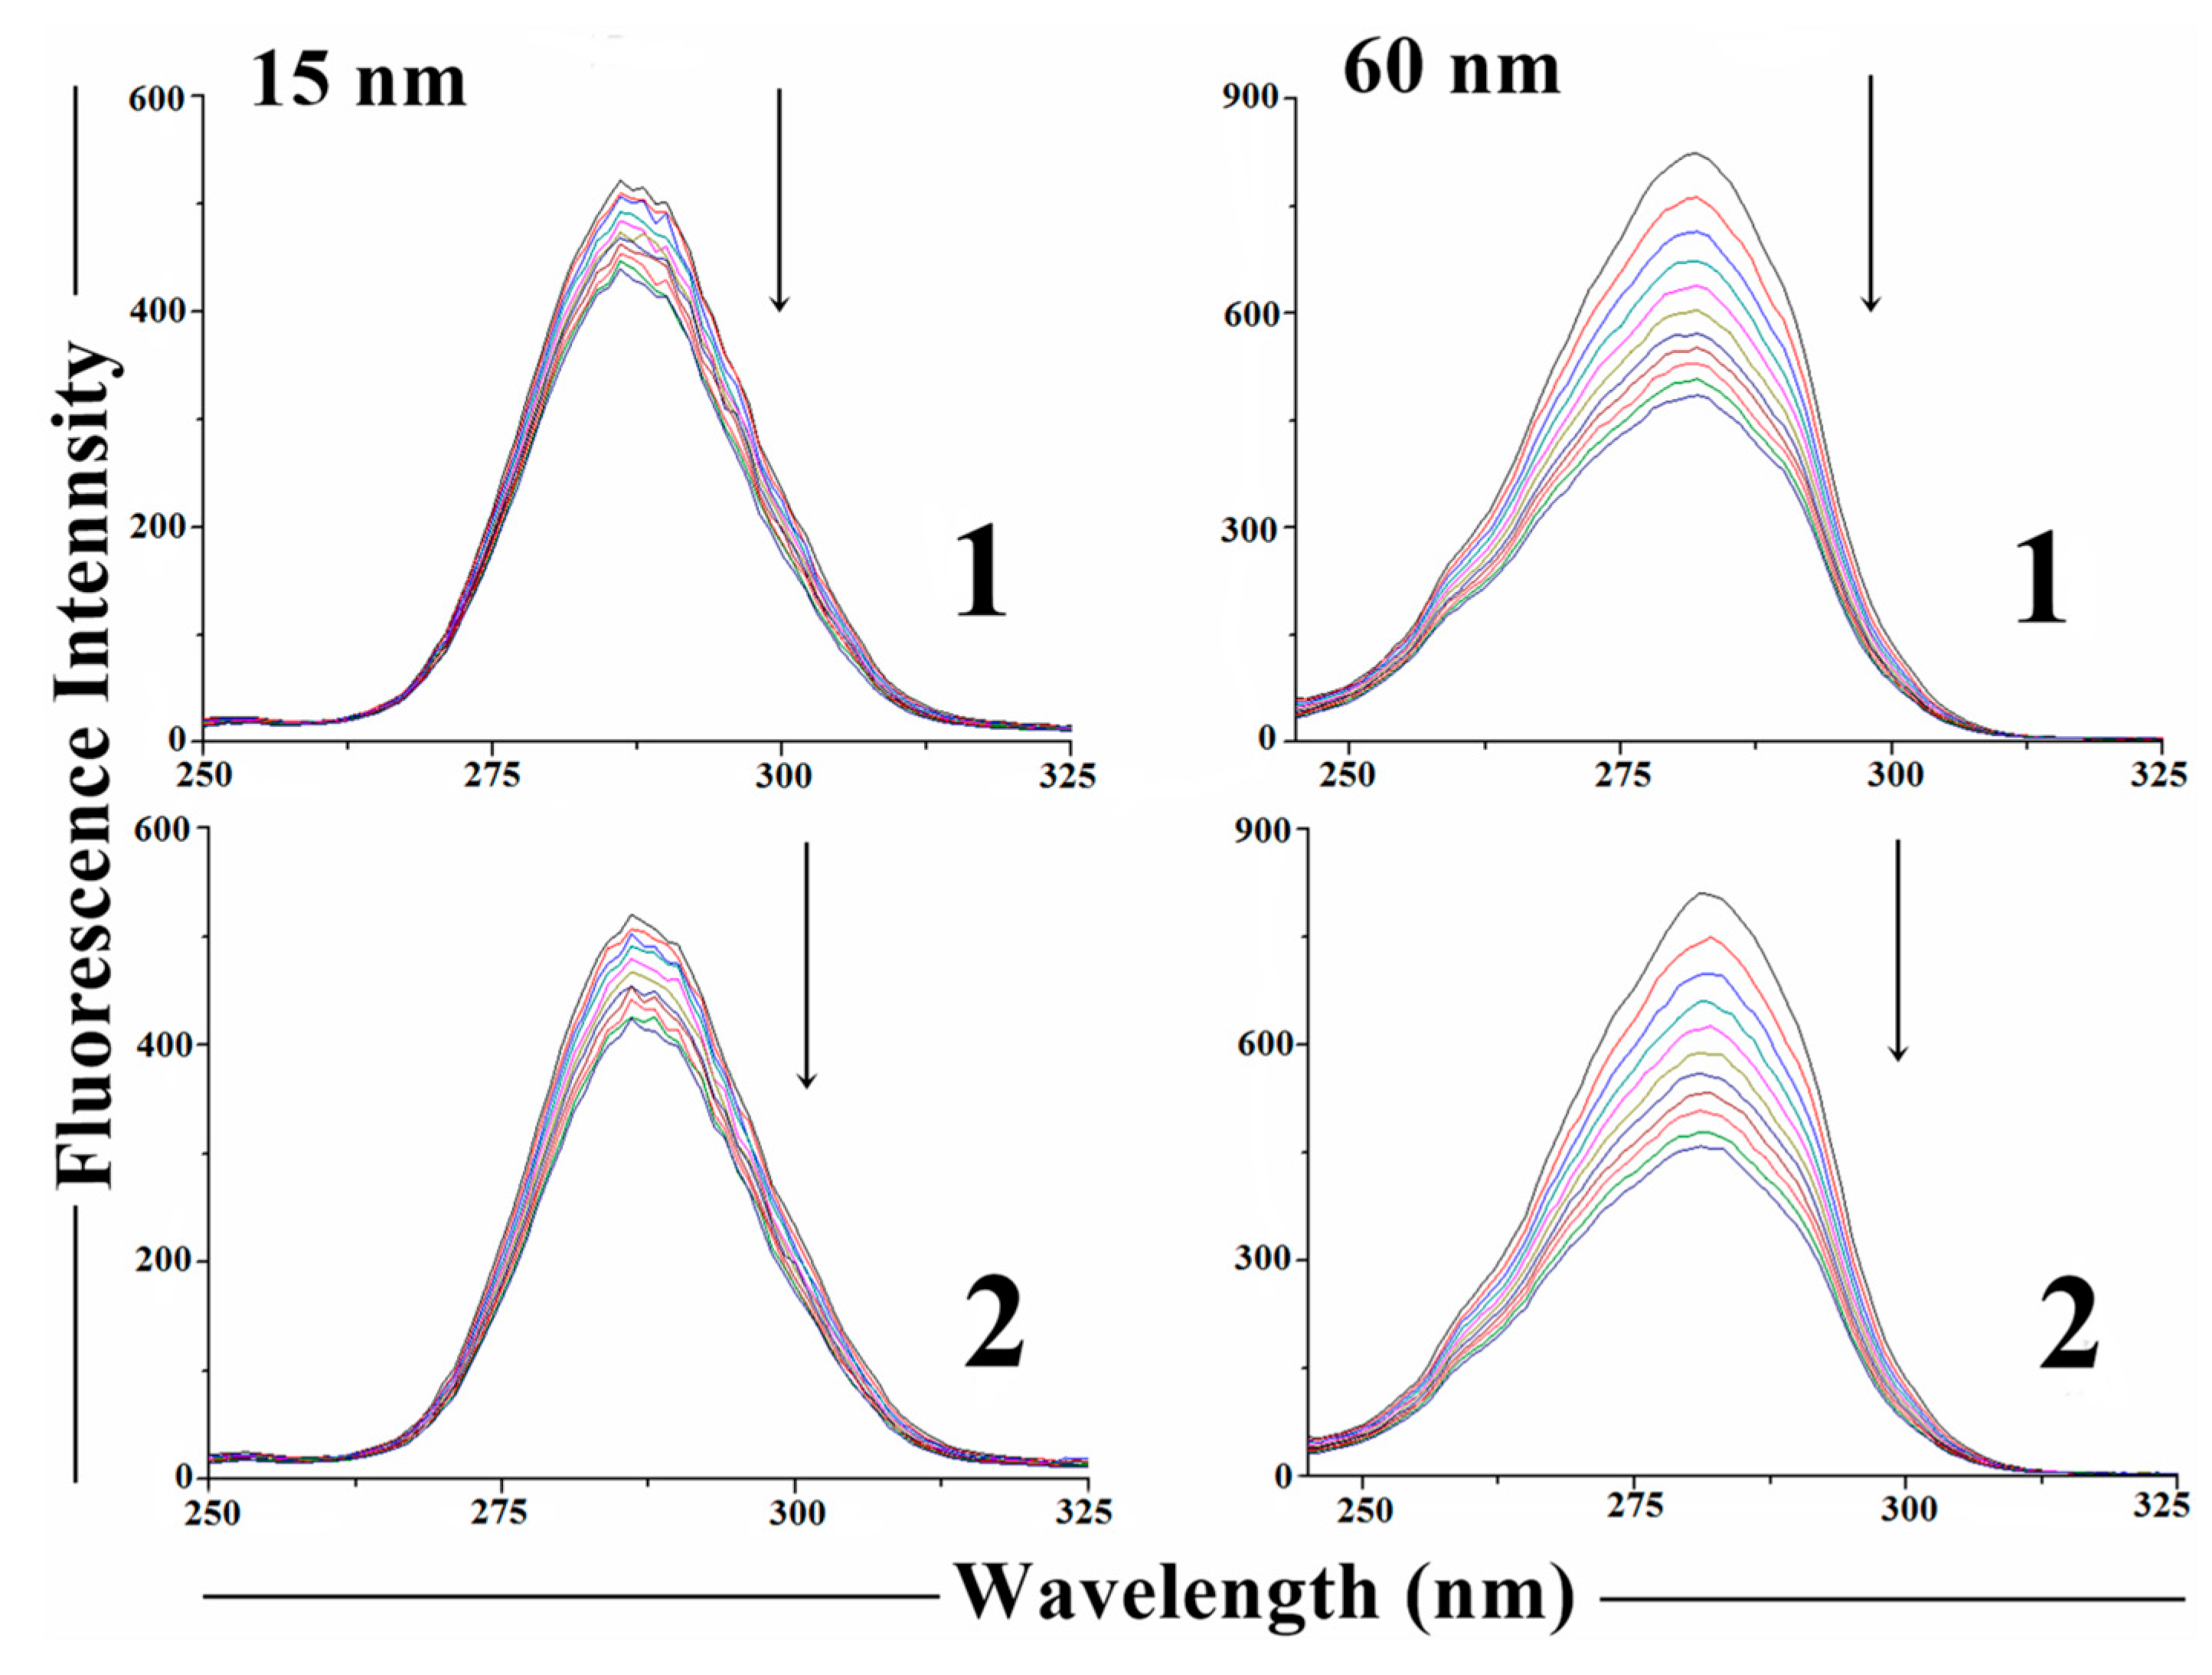
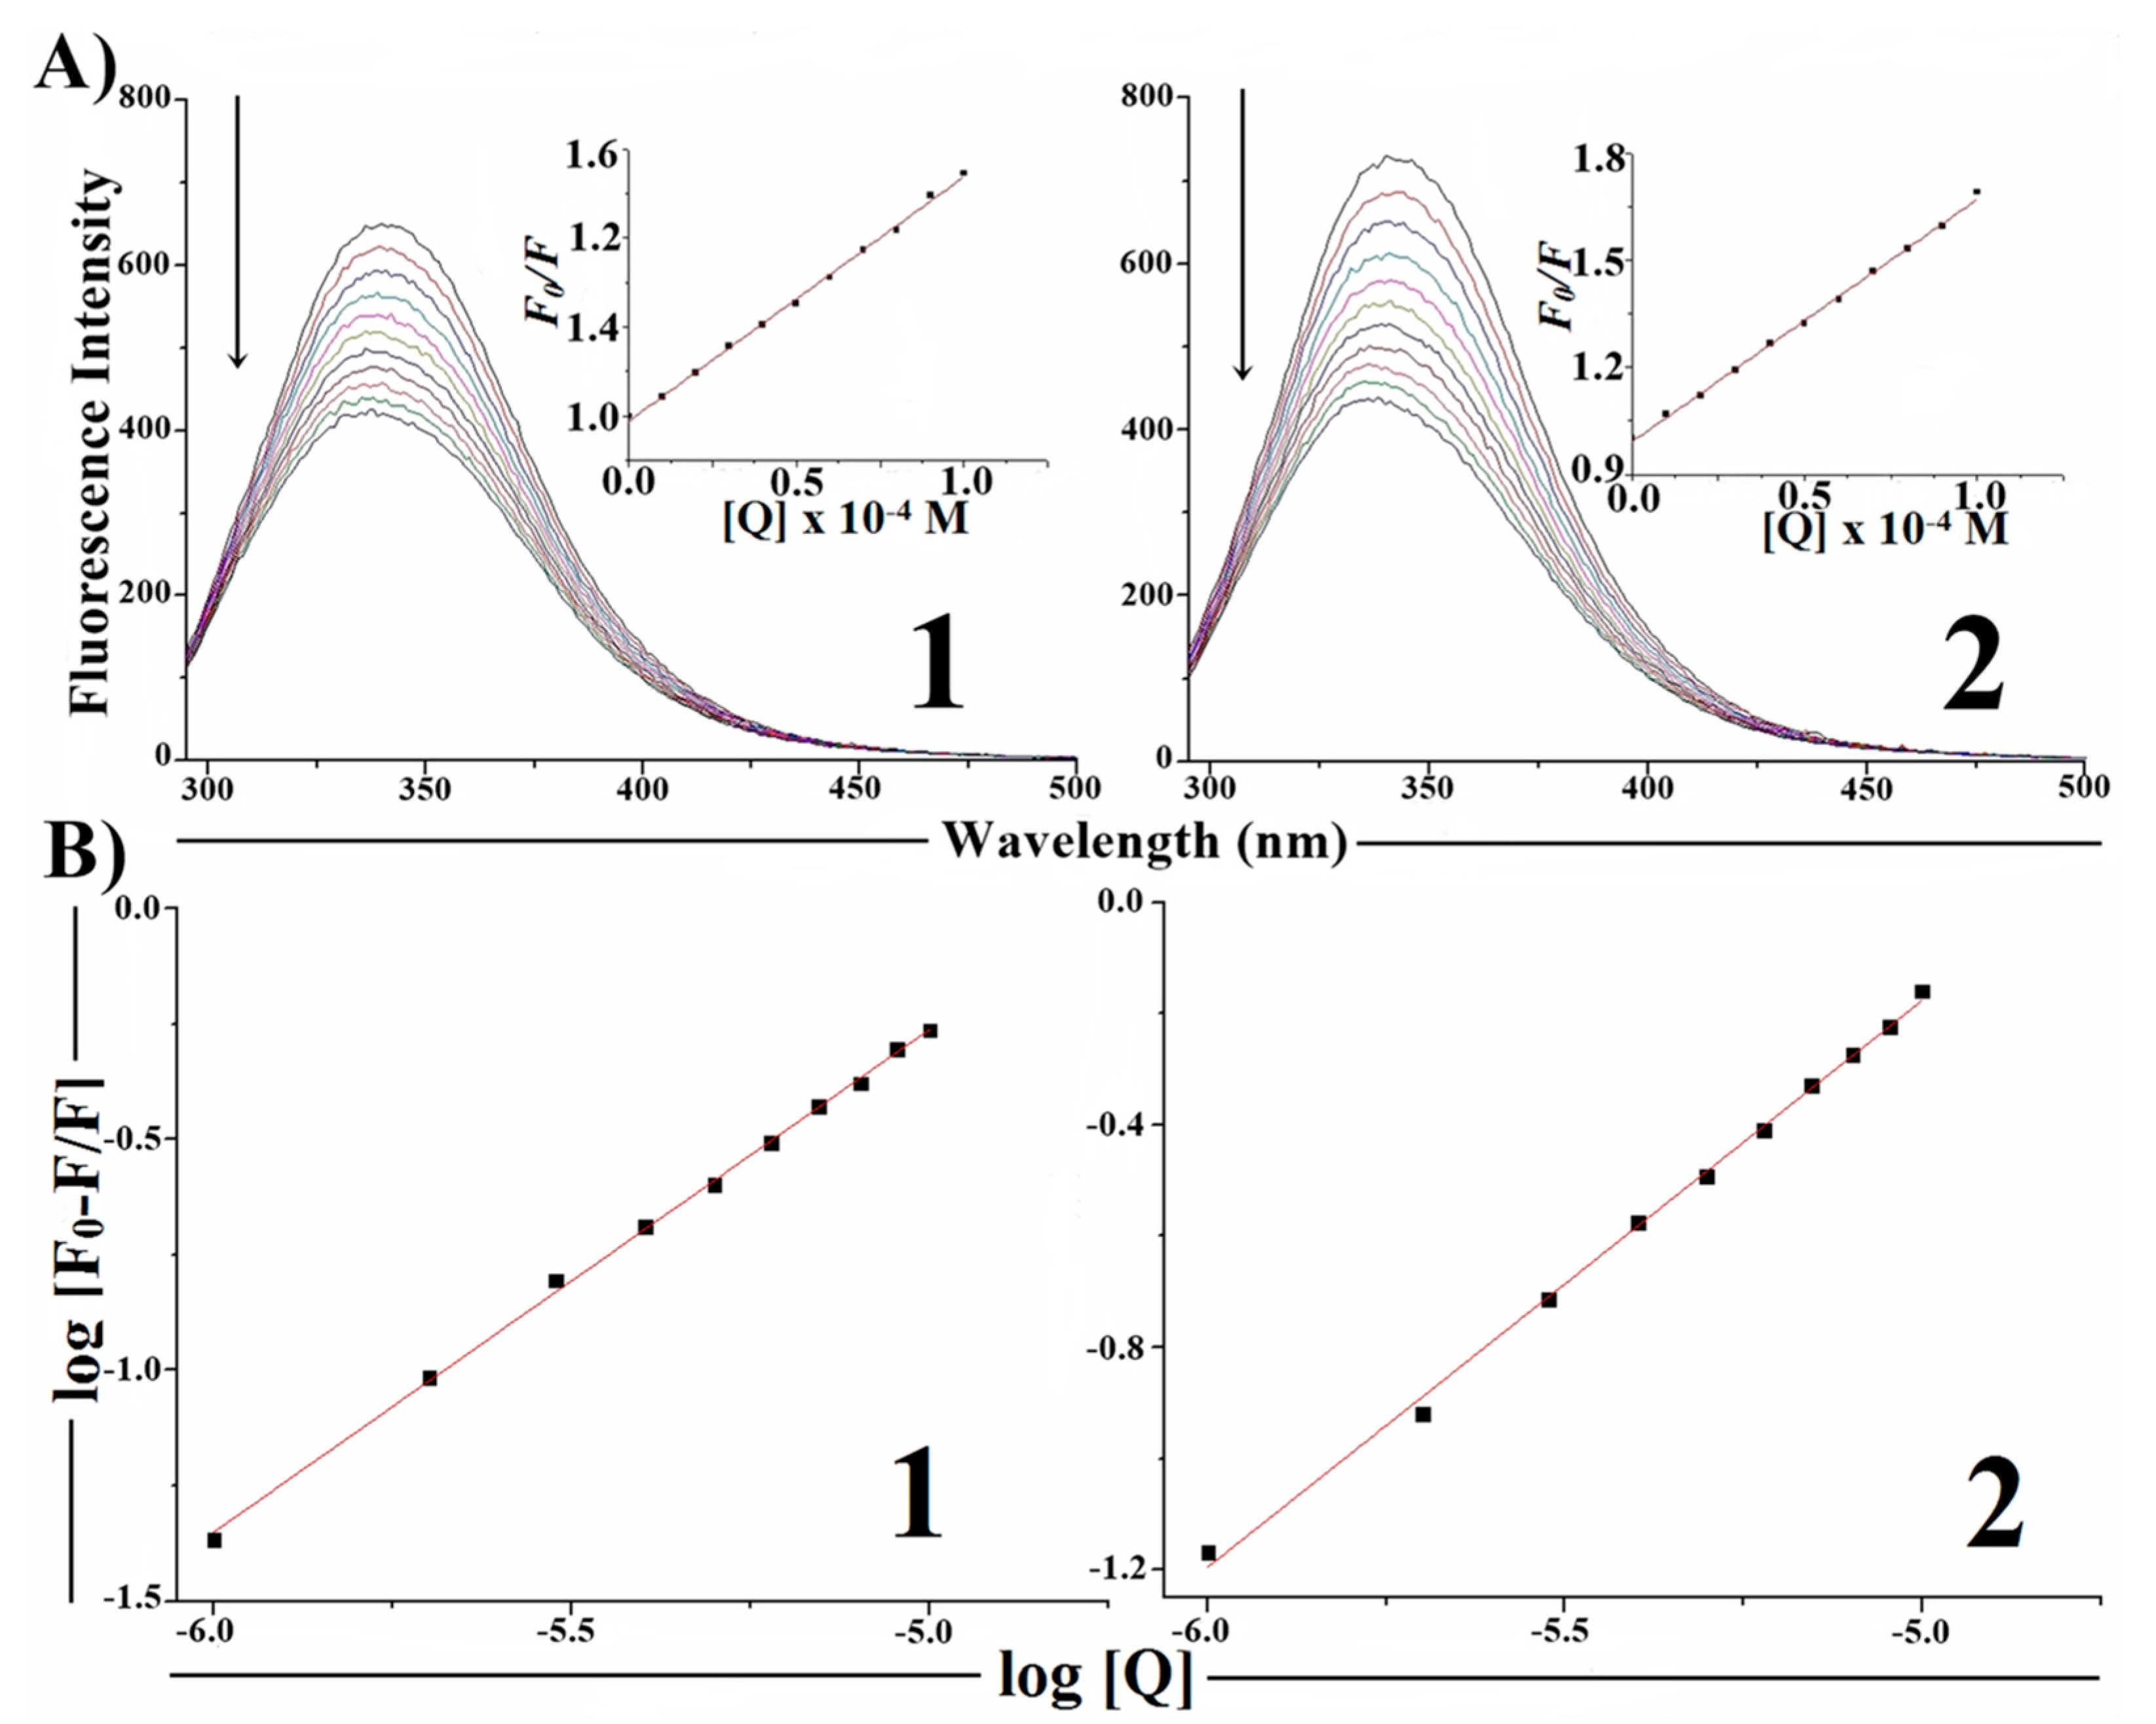
2.7. Protein Binding Studies

3. Experimental Section
3.1. General Information
3.2. Studies of Interactions with DNA
3.3. Studies of Interactions with Supercoiled Plasmid DNA
3.4. Albumin Binding Studies
3.5. Cell Lines and Culture Conditions
3.6. Cytotoxic Activity
3.7. Morphological Analysis
3.8. Analysis of Chromosomal Alterations
3.9. Measurement of Reactive Oxygen Species (ROS) Generation
3.10. Statistical Analysis
4. Conclusions
Acknowledgments
Author Contributions
Conflicts of Interest
References
- Rajendiran, V.; Karthik, R.; Palaniandavar, M.; Stoeckli-Evans, H.; Periasamy, V.S.; Akbarsha, M.A.B.; Srinag, S.; Krishnamurthy, H. Mixed-ligand copper(II)-phenolate complexes: Effect of coligand on enhanced DNA and protein binding, DNA cleavage, and anticancer activity. Inorg. Chem. 2007, 46, 8208–8221. [Google Scholar]
- O’Halloran, T.V. Transition metals in control of gene expression. Science 1993, 261, 715–725. [Google Scholar]
- Verhaegh, G.W.; Richard, M.J.; Hainaut, P. Regulation of p53 by metal ions and by antioxidants: Dithiocarbamate down-regulates p53 DNA-binding activity by increasing the intracellular level of copper. Mol. Cell. Biol. 1997, 17, 5699–5706. [Google Scholar]
- Yamamoto, K.; Kawanishi, S. Site-specific DNA damage induced by hydrazine in the presence of manganese and copper ions. J. Biol. Chem. 1991, 266, 1509–1515. [Google Scholar]
- Matias, A.C.; dos Santos, N.V.; Chelegão, R.; Nomura, C.S.; Fiorito, P.A.; Cerchiaro, G.J. Cu(GlyGlyHis) effects on MCF7 cells: Copper uptake, reactive oxygen species generation and membrane topography changes. Inorg. Biochem. 2012, 116, 172–179. [Google Scholar]
- Narang, R.; Narasimhan, B.; Sharma, S. A review on biological activities and chemical synthesis of hydrazide derivatives. Curr. Med. Chem. 2012, 19, 569–612. [Google Scholar]
- Despaigne, A.A. 2-Acetylpyridine- and 2-benzoylpyridine-derived hydrazones and their gallium(III) complexes are highly cytotoxic to glioma cells. Eur. J. Med. Chem. 2012, 50, 163–172. [Google Scholar]
- Sathyadevi, P.; Krishnamoorthy, P.; Bhuvanesh, N.S.; Kalaiselvi, P.; Vijaya, P.V.; Dharmaraj, N. Organometallic ruthenium(II) complexes: Synthesis, structure and influence of substitution at azomethine carbon towards DNA/BSA binding, radical scavenging and cytotoxicity. Eur. J. Med. Chem. 2012, 55, 420–431. [Google Scholar]
- Recio Despaigne, A.A.; da Costa, F.B.; Piro, O.E.; Castellano, E.E.; Louro, S.R.W.; Beraldo, H. Complexation of 2-acetylpyridine- and 2-benzoylpyridine-derived hydrazones to copper(II) as an effective strategy for antimicrobial activity improvement. Polyhedron 2012, 38, 285–290. [Google Scholar]
- Gokce, C.; Gup, R. Synthesis and characterisation of Cu(II), Ni(II), and Zn(II) complexes of furfural derived from aroylhydrazones bearing aliphatic groups and their interactions with DNA. Chem. Pap. 2013, 67, 1293–1303. [Google Scholar]
- Pathan, A.H.; Gudasi, K.B. 1,3-Dioxolane-based ligands as a novel class of α1-adrenoceptor antagonists. Med. Chem. Res. 2013, 22, 1504–1511. [Google Scholar]
- Da Silva, J.G.; Recio Despaigne, A.A.; Louro, S.R.W.; Bandeira, C.C.; Souza-Fagundes, E.M.; Beraldo, H. Cytotoxic activity, albumin and DNA binding of new copper(II) complexes with chalcone-derived thiosemicarbazones. Eur. J. Med. Chem. 2013, 65, 415–426. [Google Scholar]
- Recio Despaigne, A.A.; Da Silva, J.G.; do Carmo, A.C.M.; Piro, O.E.; Castellano, E.E.; Beraldo, H. Structural studies on zinc(II) complexes with 2-benzoylpyridine-derived hydrazones. Inorg. Chim. Acta 2009, 362, 2117–2122. [Google Scholar]
- Choudhary, S.; Morrow, J. Dynamic acylhydrazone metal ion complex libraries: A mixed-ligand approach to increased selectivity in extraction. Angew. Chem. Int. Ed. 2002, 41, 4096–4098. [Google Scholar]
- Datta, A.; Das, K.; Yan-Ming, J.; Jui-Hsien, H.; Lee, H.M. Dichlorido{N'-[(pyridin-2-yl)methylidene-κN]acetohydrazide-κ2 N',O}copper(II). Acta Crystallogr. Sect. E Struct. Rep. Online 2011, 67. [Google Scholar] [CrossRef]
- Freshney, R.I. Culture of Animal Cells: A Manual of Basic Technique, 6th ed.; Wiley-Blackwell: New York, NY, USA, 2010. [Google Scholar]
- Kaufmann, S.H.; Earnshaw, W.C. Induction of apoptosis by cancer chemotherapy. Exp. Cell Res. 2000, 256, 42–49. [Google Scholar]
- Gabriel, L.M.; Sanchez, E.F.; Silva, S.G.; Santos, R.G. Tumor cytotoxicity of leucurolysin-B, a P-III snake venom metalloproteinase from Bothrops leucurus. J. Venom. Anim. Toxins Incl. Trop. Dis. 2012, 18, 24–33. [Google Scholar]
- Kubota, Y.; Kubota, K.; Tani, S. DNA binding properties of DAPI (4',6-diamidino-2-phenylindole) analogs having an imidazoline ring or a tetrahydropyrimidinering: Groove-binding and intercalation. Nucleic Acids Symp. Ser. 2000, 44, 53–54. [Google Scholar]
- Feng, X.; Xia, Q.; Yuan, L.; Yang, X.; Wang, K. Impaired mitochondrial function and oxidative stress in rat cortical neurons: Implications for gadolinium-induced neurotoxicity. Neurotoxicology 2010, 31, 391–398. [Google Scholar]
- Li, P.F.; Dietz, R.; von Harsdorf, R. p53 Regulates mitochondrial membrane potential through reactive oxygen species and induces cytochrome c-independent apoptosis blocked by Bcl-2. EMBO J. 1999, 18, 6027–6036. [Google Scholar]
- Lee, J.M. Inhibition of p53-dependent apoptosis by the KIT tyrosine kinase: Regulation of mitochondrial permeability transition and reactive oxygen species generation. Oncogene 1998, 17, 1653–1662. [Google Scholar]
- Liu, B.; Chen, Y.; St Clair, D.K. ROS and p53: Versatile partnership. Free Radic. Biol. Med. 2008, 44, 1529–1535. [Google Scholar]
- Sawada, M.; Kiyono, T.; Nakashima, S.; Shinoda, J.; Naganawa, T.; Hara, S.; Iwama, T.; Sakai, N. Molecular mechanisms of TNF-α-induced ceramide formation in human glioma cells: P53-Mediated oxidant stress-dependent and -independent pathways. Cell Death Differ. 2004, 11, 997–1008. [Google Scholar]
- Haupt, S.; Berger, M.; Goldberg, Z.; Haupt, Y. Apoptosis—the p53 network. J. Cell Sci. 2003, 116, 4077–4085. [Google Scholar]
- Kumar, R.S.; Sasikala, K.; Arunachalam, S. DNA interaction of some polymer-copper(II) complexes containing 2,2'-bipyridyl ligand and their antimicrobial activities. J. Inorg. Biochem. 2008, 102, 234–241. [Google Scholar]
- Barton, J.K.; Danishefsky, A.T.; Goldberg, J.M. Tris(phenanthroline)ruthenium(II) stereoselectivity in binding to DNA. J. Am. Chem. Soc. 1984, 106, 2172–2176. [Google Scholar]
- Krishnamoorthy, P.; Sathyadevi, P.; Cowley, A.H.; Butorac, R.R.; Dharmaraj, N. Evaluation of DNA binding, DNA cleavage, protein binding and in vitro cytotoxic activities of bivalent transition metal hydrazone complexes. Eur. J. Med. Chem. 2011, 46, 3376–3387. [Google Scholar]
- Garbett, N.C.; Hammond, N.B.; Graves, D.E. Influence of the amino substituents in the interaction of ethidium bromide with DNA. Biophys. J. 2004, 87, 3974–3981. [Google Scholar]
- Raja, D.S.; Bhuvanesh, N.S.P.; Natarajan, K. DNA binding, protein interaction, radical scavenging and cytotoxic activity of 2-oxo-1,2-dihydroquinoline-3-carbaldehyde(2'-hydroxybenzoyl)hydrazone and its Cu(II) complexes: A structure activity relationship study. Inorg. Chim. Acta 2012, 385, 81–93. [Google Scholar]
- Pyle, A.M.; Rehmann, J.P.; Meshoyrer, R.; Kumar, C.V.; Turro, N.J.; Barton, J.K. Mixed-ligand complexes of ruthenium(II): Factors governing binding to DNA. J. Am. Chem. Soc. 1989, 111, 3051–3058. [Google Scholar]
- Sathyadevi, P.; Krishnamoorthy, P.; Butorac, R.R.; Cowley, A.H.; Dharmaraj, N. Synthesis of novel heterobimetallic copper(I) hydrazone Schiff base complexes: A comparative study on the effect of heterocyclic hydrazides towards interaction with DNA/protein, free radical scavenging and cytotoxicity. Metallomics 2012, 4, 498–511. [Google Scholar]
- Dimiza, F.; Perdih, F.; Tangoulis, V.; Turel, I.; Kessissoglou, D.P.; Psomas, G. Interaction of copper(II) with the non-steroidal anti-inflammatory drugs naproxen and diclofenac: Synthesis, structure, DNA- and albumin-binding. J. Inorg. Biochem. 2011, 105, 476–489. [Google Scholar]
- Lakowicz, J.R. Principles of Fluorescence Spectroscopy, 2nd ed.; Kluwer Academic Press/Plenum Publishers: New York, NY, USA, 1999. [Google Scholar]
- Kumar, P.; Baidya, B.; Chaturvedi, S.K.; Khan, R.H.; Manna, D.; Mondal, B. DNA binding and nuclease activity of copper(II) complexes of tridentate ligands. Inorg. Chim. Acta 2011, 376, 264–270. [Google Scholar]
- Bi, S.; Sun, Y.; Qiao, C.; Zhang, H.; Liu, C. Binding of several anti-tumor drugs to bovine serum albumin: Fluorescence study. J. Lumin. 2009, 129, 541–547. [Google Scholar]
- Bhattacharyya, M.; Chaudhuri, U.; Poddar, R.K. Evidence for cooperative binding of chlorpromazine with hemoglobin: Equilibrium dialysis, fluorescence quenching and oxygen release study. Biochem. Biophys. Res. Commun. 1990, 167, 1146–1153. [Google Scholar]
- Shahabadi, N.; Mohammadpour, M. Study on the interaction of sodium morin-5-sulfonate with bovine serum albumin by spectroscopic techniques. Spectrochim. Acta Part A 2012, 86, 191–195. [Google Scholar]
- Chen, G.Z.; Huang, X.Z.; Zheng, Z.Z.; Xu, J.G.; Wang, Z.B. Methods of Fluorescence Analysis, 2nd ed.; Science Press: Beijing, China, 1990. [Google Scholar]
- Miller, J.N. Recent advances in molecular luminescence analysis. Proc. Anal. Div. Chem. Soc. 1979, 16, 203–208. [Google Scholar]
- Tang, J.H.; Luan, F.; Chen, X.G. Binding analysis of glycyrrhetinic acid to human serum albumin: Fluorescence spectroscopy, FTIR, and molecular modeling. Bioorg. Med. Chem. 2006, 14, 3210–3217. [Google Scholar]
- Raja, D.S.; Bhuvanesh, N.S.; Natarajan, K. Structure-activity relationship study of copper(II) complexes with 2-oxo-1,2-dihydroquinoline-3-carbaldehyde (4'-methylbenzoyl) hydrazone: Synthesis, structures, DNA and protein interaction studies, antioxidative and cytotoxic activity. J. Biol. Inorg. Chem. 2012, 17, 223–237. [Google Scholar]
- Reichmann, M.E.; Rice, S.A.; Thomas, C.A.; Doty, P. A further examination of the molecular weight and size of desoxypentose nucleic acid. J. Am. Chem. Soc. 1954, 76, 3047–3053. [Google Scholar]
- Meyer-Almes, F.J.; Porschke, D. Mechanism of intercalation into the DNA double helix by ethidium. Biochemistry 1993, 32, 4246–4253. [Google Scholar]
- ImageJ. Available online: http://imagej.nih.gov/ij/download/ (accessed on 17 October 2014).
- Sample Availability: Samples of the complexes 1 and 2 are available from the authors.
© 2014 by the authors. Licensee MDPI, Basel, Switzerland. This article is an open access article distributed under the terms and conditions of the Creative Commons Attribution license ( http://creativecommons.org/licenses/by/4.0/).
Share and Cite
Recio Despaigne, A.A.; Da Silva, J.G.; Da Costa, P.R.; Dos Santos, R.G.; Beraldo, H. ROS-Mediated Cytotoxic Effect of Copper(II) Hydrazone Complexes against Human Glioma Cells. Molecules 2014, 19, 17202-17220. https://doi.org/10.3390/molecules191117202
Recio Despaigne AA, Da Silva JG, Da Costa PR, Dos Santos RG, Beraldo H. ROS-Mediated Cytotoxic Effect of Copper(II) Hydrazone Complexes against Human Glioma Cells. Molecules. 2014; 19(11):17202-17220. https://doi.org/10.3390/molecules191117202
Chicago/Turabian StyleRecio Despaigne, Angel A., Jeferson G. Da Silva, Pryscila R. Da Costa, Raquel G. Dos Santos, and Heloisa Beraldo. 2014. "ROS-Mediated Cytotoxic Effect of Copper(II) Hydrazone Complexes against Human Glioma Cells" Molecules 19, no. 11: 17202-17220. https://doi.org/10.3390/molecules191117202