A Starting Point for Fluorescence-Based Single-Molecule Measurements in Biomolecular Research

Abstract
:
1. Introduction
2. Planning a Biological Single-Molecule Experiment

| Fluorophore | Absorption Max (nm) | Emission Max (nm) | Quantum Yield | Fluorescence Lifetime (ns) | Extinction Coefficient (×103 M−1·cm−1) | Chemical Structure | References | Notes |
|---|---|---|---|---|---|---|---|---|
| Cy2 | 489 | 506 | 0.12 | - | 150 |  | [12,19] | - lower probability of redshifted statecompared toAlexa488, ATTO488 |
| Dylight488 | 493 | 518 | - | - | 70 | proprietary | - | - phosphine-derivative available for labelling of unnatural amino acids containing an azide moiety |
| Alexa 488 | 495 | 519 | 0.92 | 4.1 | 71 |  | [12,20,21,22,23,24,25,26,27] | - often used to monitor protein folding - donor dye for Alexa 568 and Alexa 594 - red-shifted photobleaching intermediates - quenched by guanosines in close proximity - almost no interaction with DNA |
| ATTO 488 | 501 | 523 | 0.80 | 4.1 | 90 |  | [28,,29] | - redshifted states [11] |
| Rhodamine 6G | 525 | 555 | 0.95 | - | 102 |  | - | - |
| Alexa 532 | 531 | 554 | 0.61 | 2.5 | 81 | 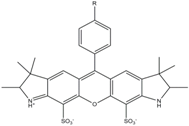 | [30] | - spectral fluctuations |
| ATTO 532 | 532 | 553 | 0.90 | 3.8 | 115 | 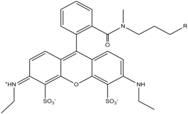 | [31] | - high water solubility - good photostability without oxygen removal |
| Cy3 | 548 | 562 | 0.09 | 0.15 | 150 | 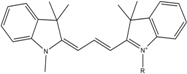 | [32,33,34] | - very often used in combination with Cy5 for FRET experiments as the dyes do not interact even if in close proximity to each other - cis-trans-isomerization |
| Cy3B | 558 | 572 | 0.7 | 2.8 | 130 | 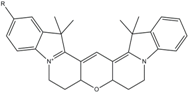 | [32,35] | - increased photostability compared to Cy3 due to inhibition of cis-trans-isomerization |
| Alexa 546 | 556 | 573 | 0.79 | 4.1 | 104 | 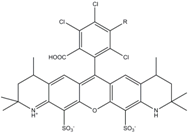 | [27] | - |
| Alexa 555 | 555 | 565 | 0.10 | 0.30 | 155 | 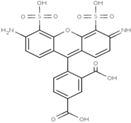 | - | - |
| DyLight550 | 562 | 576 | - | - | - | proprietary | - | - phosphine-derivative available for labelling of unnatural amino acids containing an azide moiety |
| ATTO 565 | 563 | 592 | 0.90 | 4.0 | 120 | 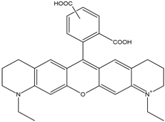 | [28] | - used in multi-color FRET schemes |
| Alexa 568 | 578 | 603 | 0.61 | 3.6 | 91.3 | 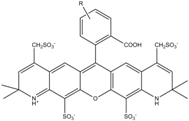 | - | - |
| Alexa 594 | 590 | 617 | 0.66 | 3.9 | 90 | 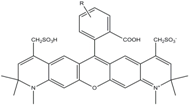 | [22,23,24,25,36] | - often used in single-molecule protein folding experiments - acceptor for Alexa488 in FRET experiments |
| ATTO 590 | 594 | 624 | 0.80 | 3.7 | 120 | 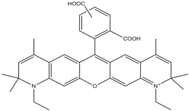 | - | - |
| Cy5 | 646 | 664 | 0.27 | 1.0 | 250 |  | [19,33,34,37,38,39] | - broadening due to spectrally different Cy5 states - switchable with thiols - cis-trans isomerization - ROXS inhibits blinking |
| Alexa 647 | 650 | 668 | 0.33 | 1.0 | 239 | 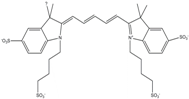 | [19,40] | - switchable with thiols—similar to Cy5 |
| DyLight650 | 652 | 672 | - | - | - | proprietary | - | - phosphine-derivative available for labelling of unnatural amino acids containing an azide moiety |
| ATTO647N | 644 | 669 | 0.65 | 3.5 | 150 | 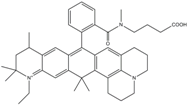 | [28,39,41] | - manifold of spectral states - lifetime seems to depend strongly on environment [42,43] - photostability improved by ROXS - heavily quenched if placed close to guanosine bases |
| ATTO680 | 680 | 700 | 0.30 | 1.7 | 125 | proprietary | [43] | - redshift in absorption and emission maxima with increasing glycerol concentration |
| Cy7 | 750 | 773 | 0.30 | 0.8 | 199 |  | [11,44] | - |
3. Tuning Photophysical Processes of Dyes for Fluorescence Single-Molecule Detection
3.1. Structure and Characteristics of Fluorescent Dyes


3.2. Photoblinking and Photobleaching
3.3. Energy Transfer between Fluorescent Dyes
4. Setups for Fluorescence Based Single-Molecule Measurements
| Fluorescence-Based Method | Time Scale | Advantages | Disadvantages | |
|---|---|---|---|---|
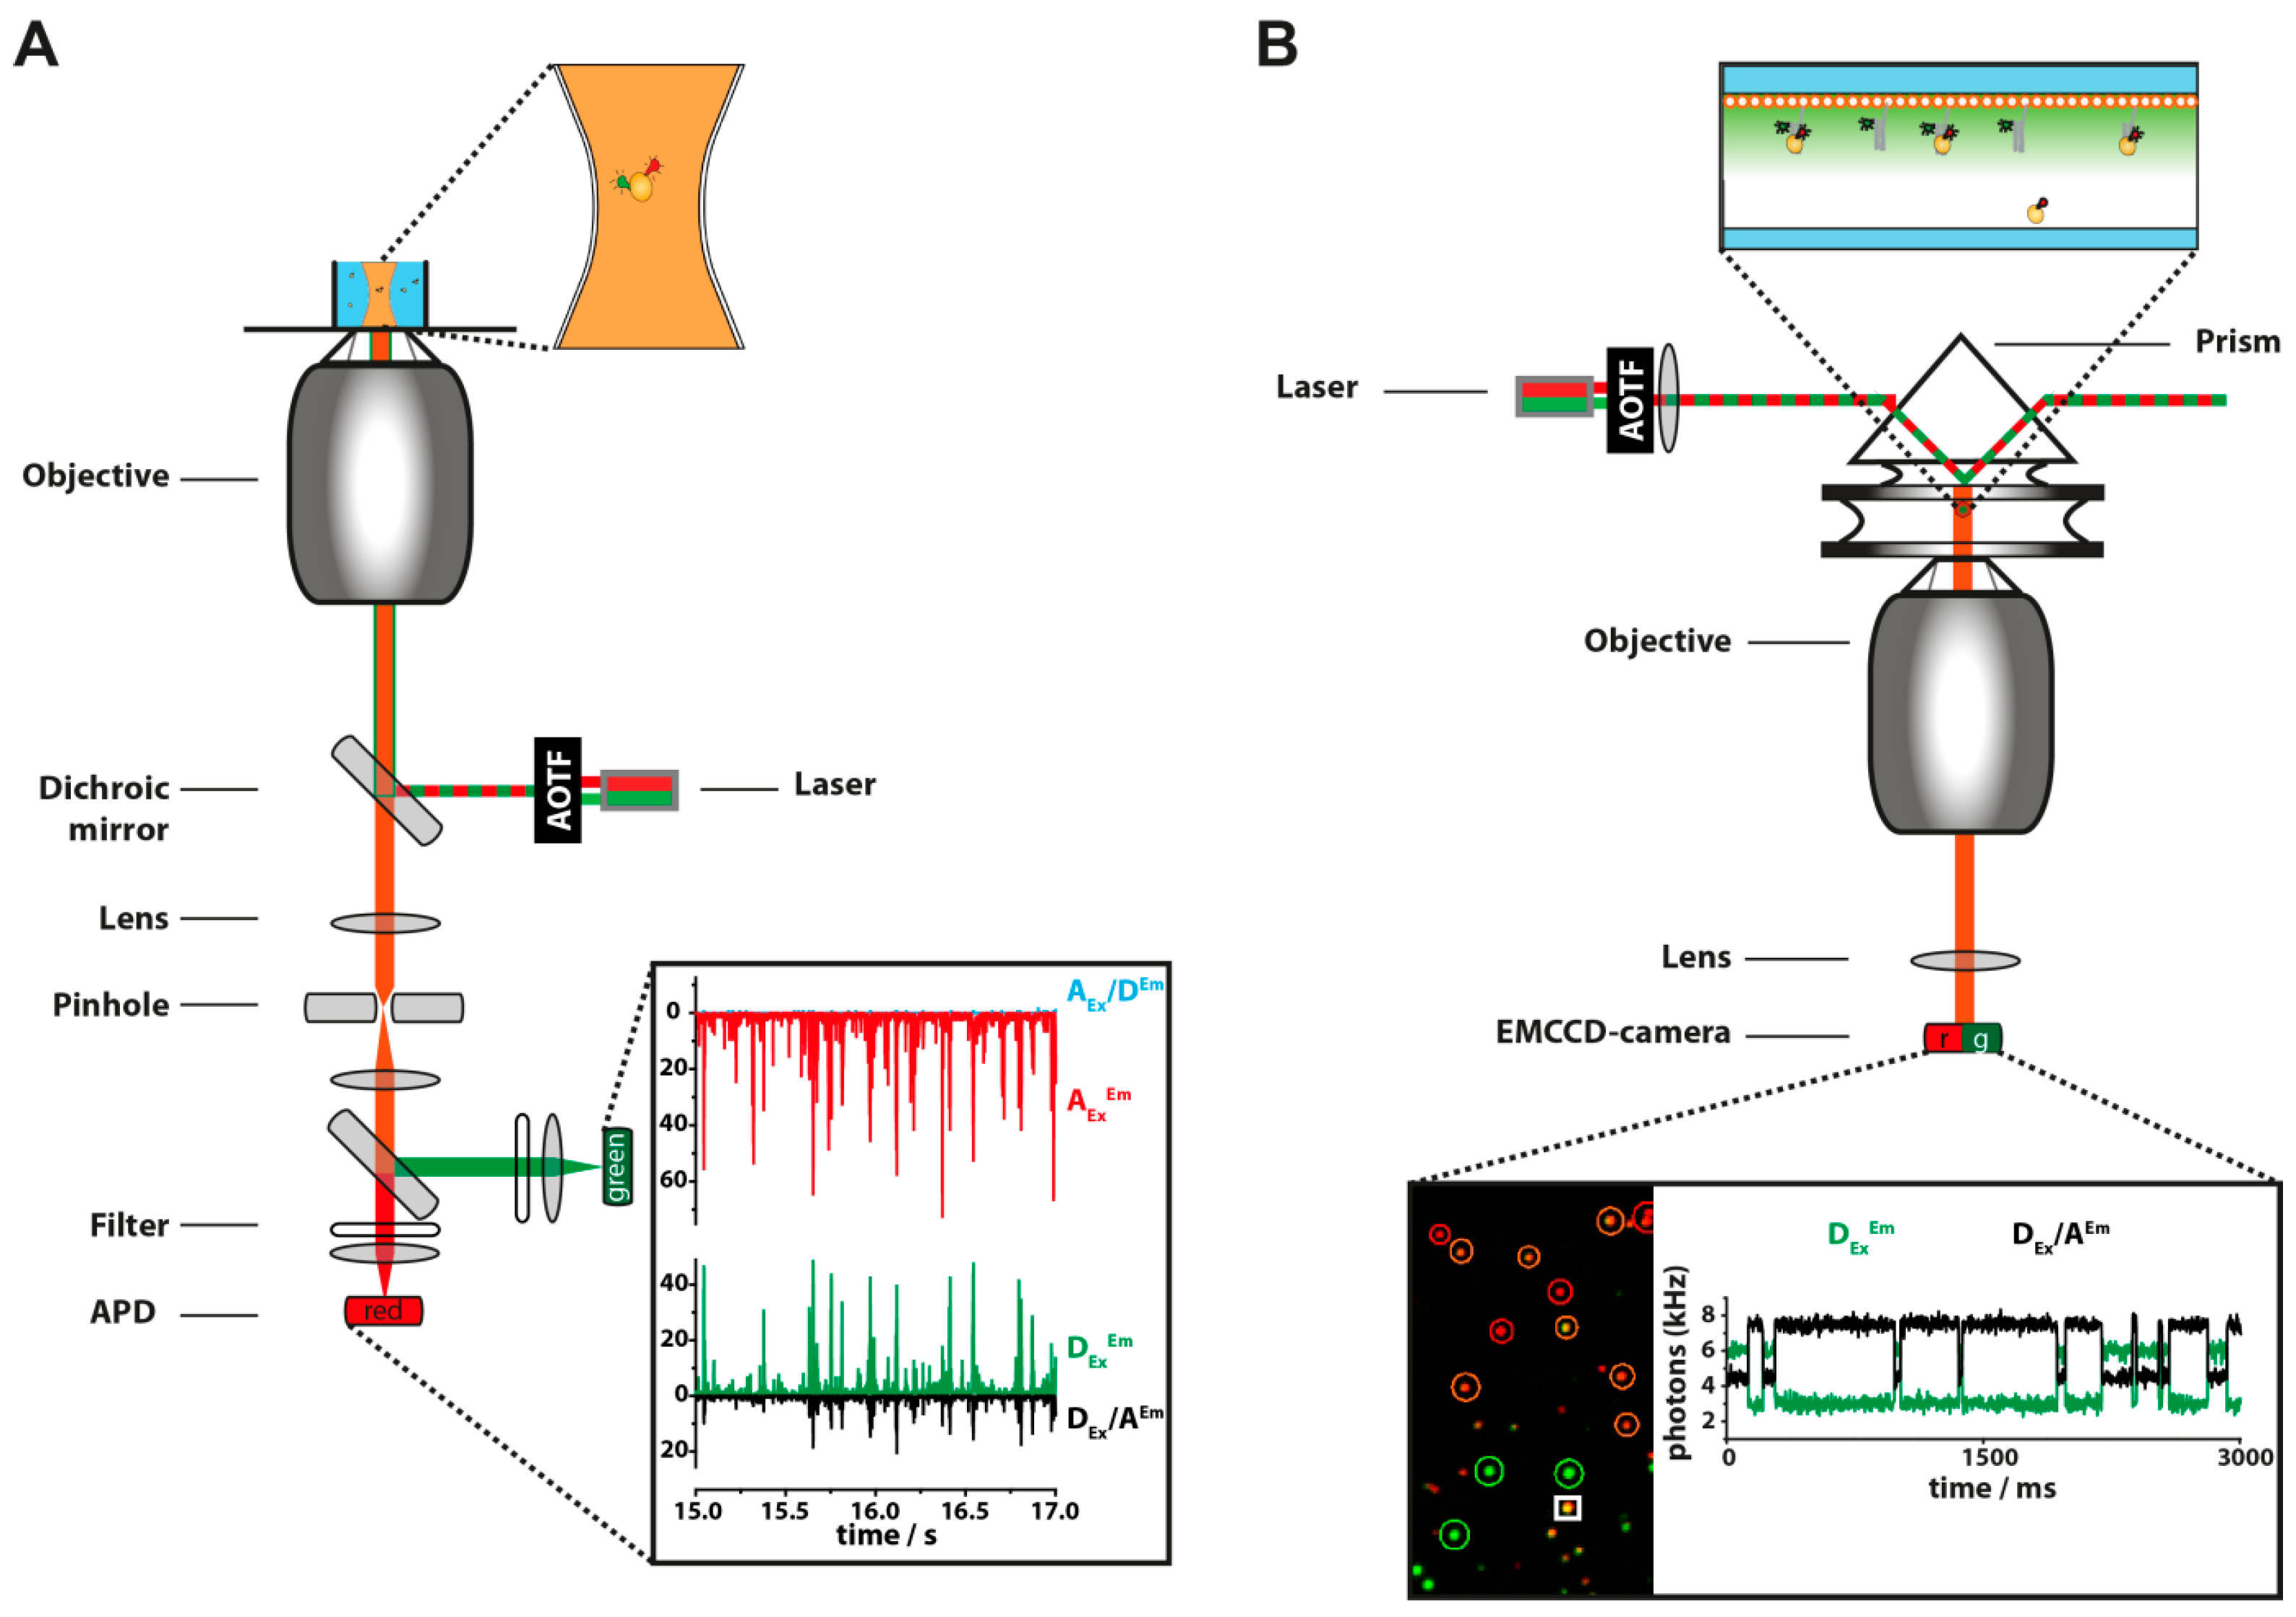
| Confocal fluorescence spectroscopy | in solution | ns–ms | - molecule sorting for donor- and/or acceptor-labeled species via alternating laser excitation (ALEX) possible - measurements on freely diffusing and immobilized molecules possible | - limited concentration range of labeled species (5–200 pM) - time resolution is limited by the diffusion-time in the focus |
| immobilized | ns–min | - fluorescence lifetimes measurements possible - kinetic information | - interactions with the surface due to immobilization might negatively influence activity of the biomolecule - sequential measurements | |
| Total internal reflection fluorescence microscopy (TIRF) | ms–min | - molecule sorting for donor- and/or acceptor-labeled species via ALEX possible - parallel measurement of hundreds of individual molecules - spatial information on the observed molecules - able to monitor not synchronized or rare events | - interactions with the surface due to immobilization might negatively influence activity of the biomolecule - no fluorescence lifetime measurements possible | |
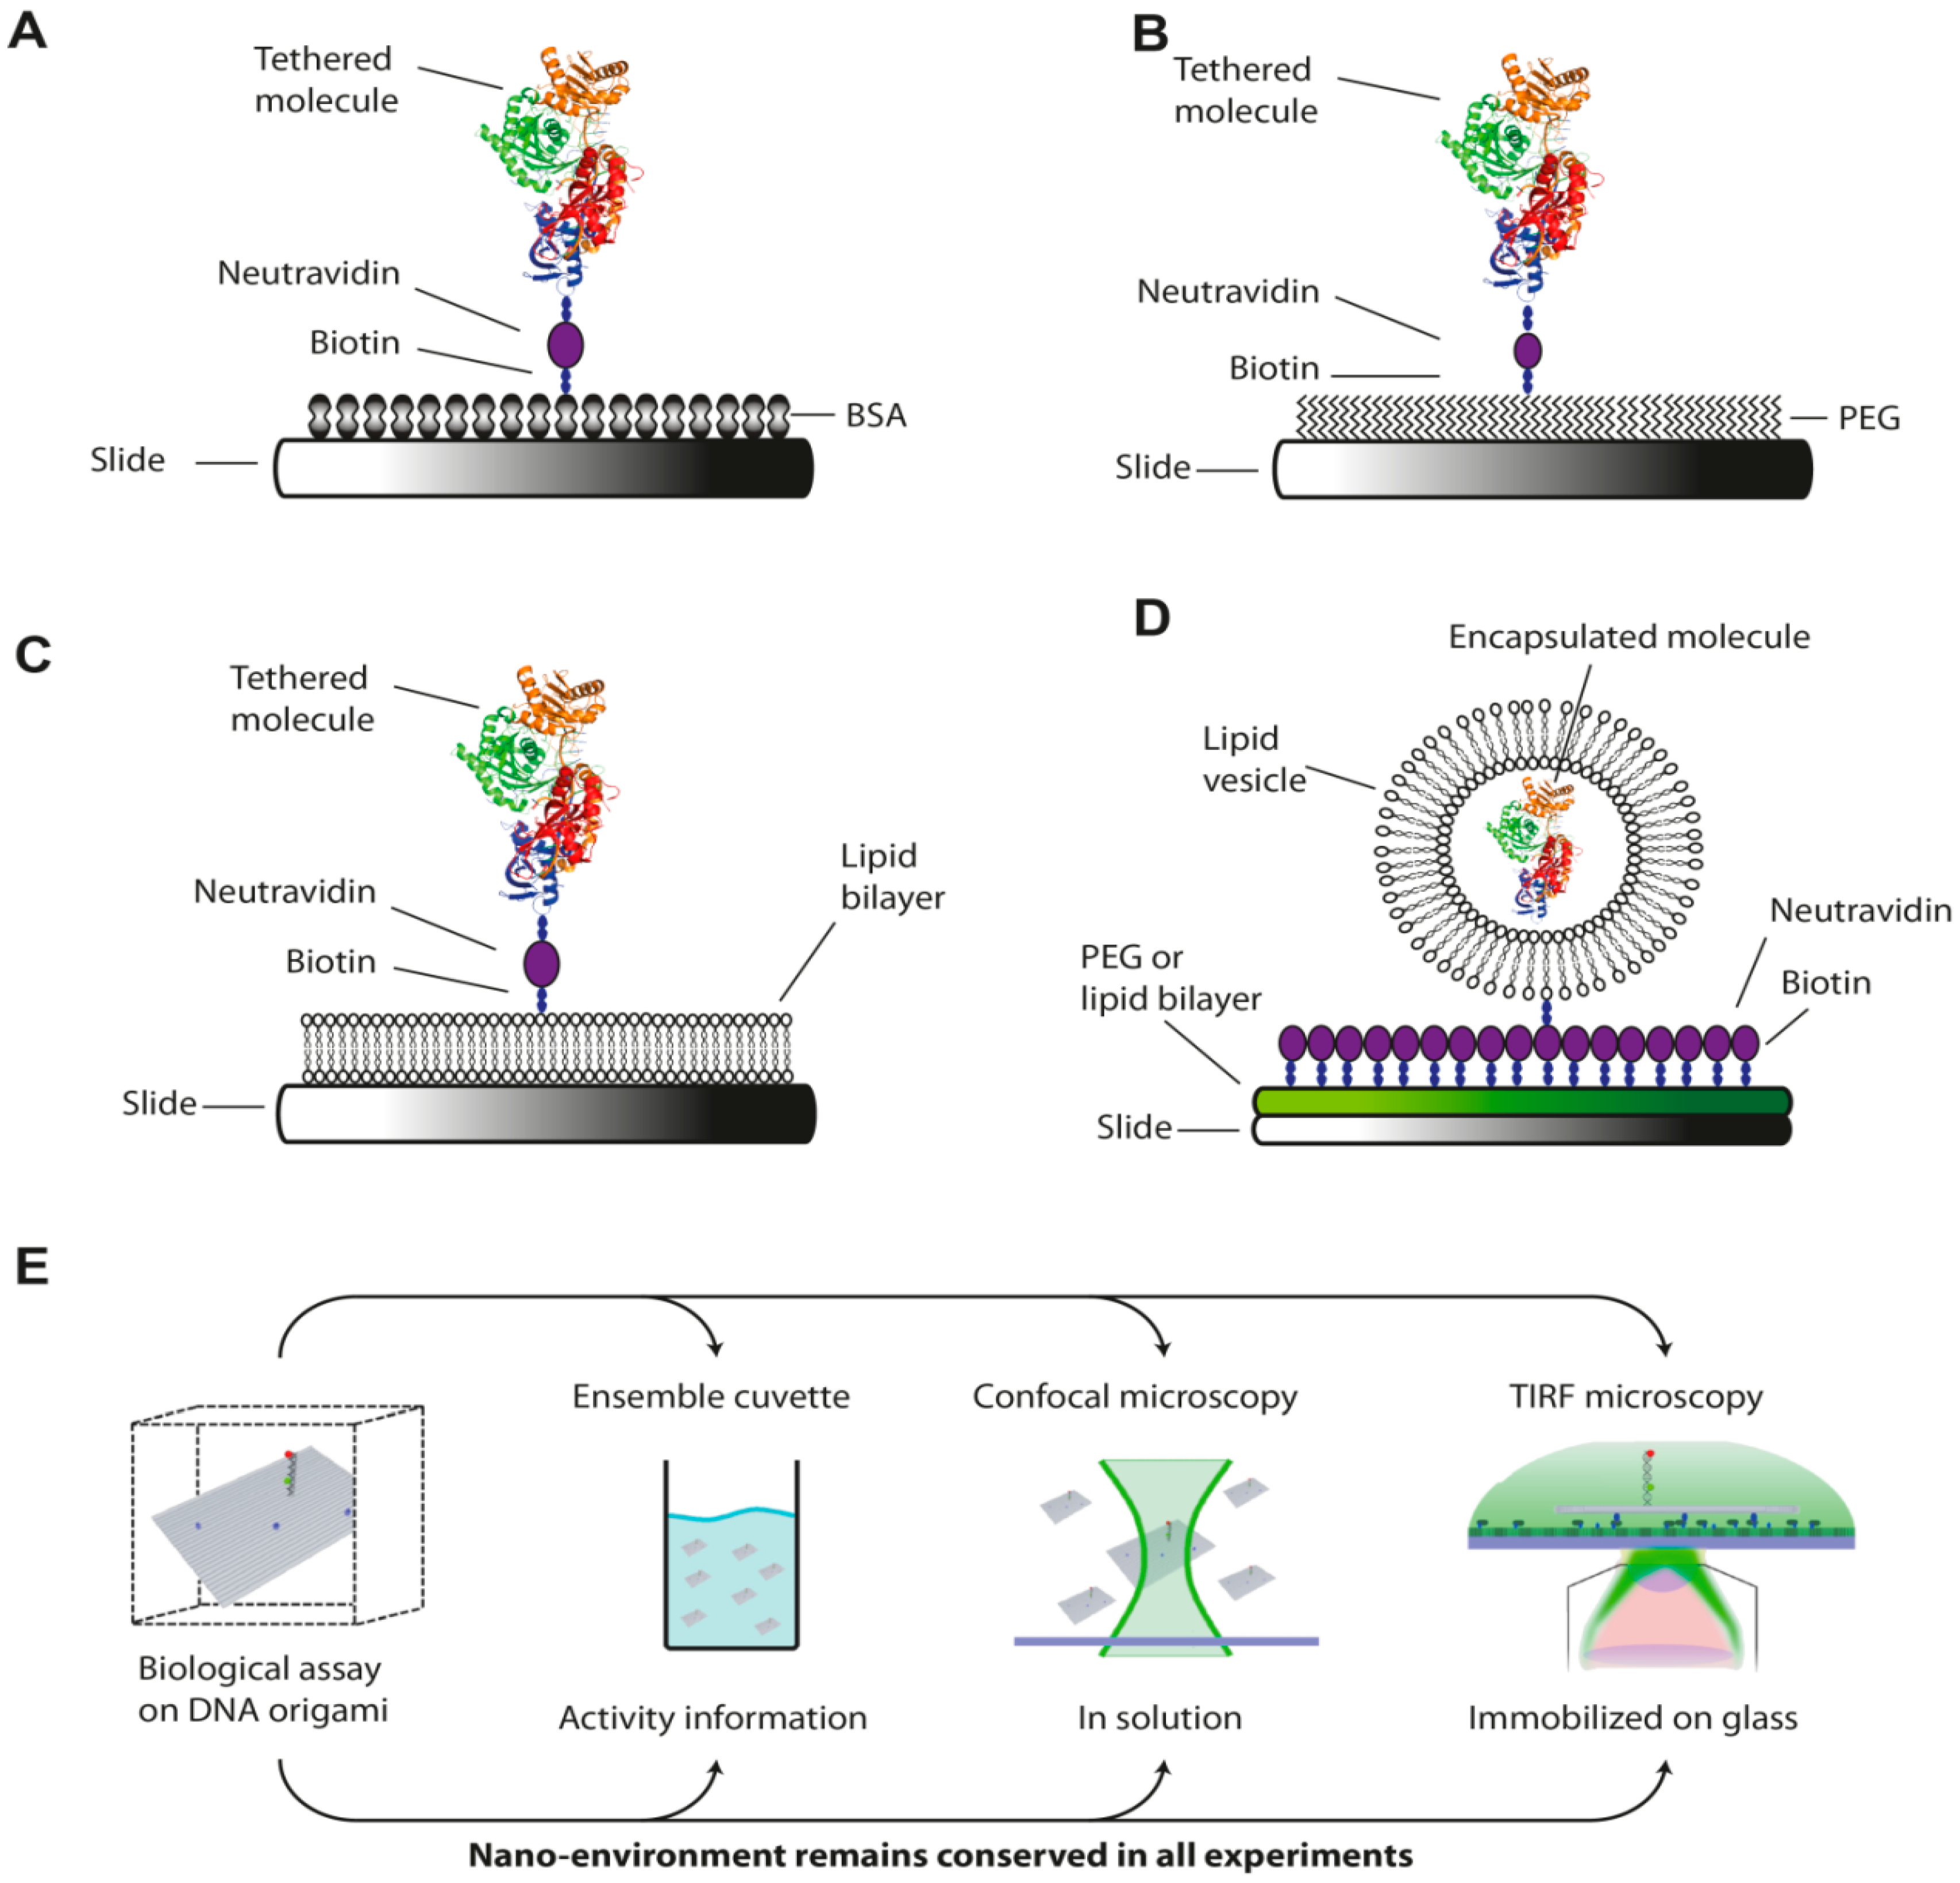
5. Surface Preparation and Passivation for Measurement on Immobilized Molecules
6. Data Analysis and Interpretation
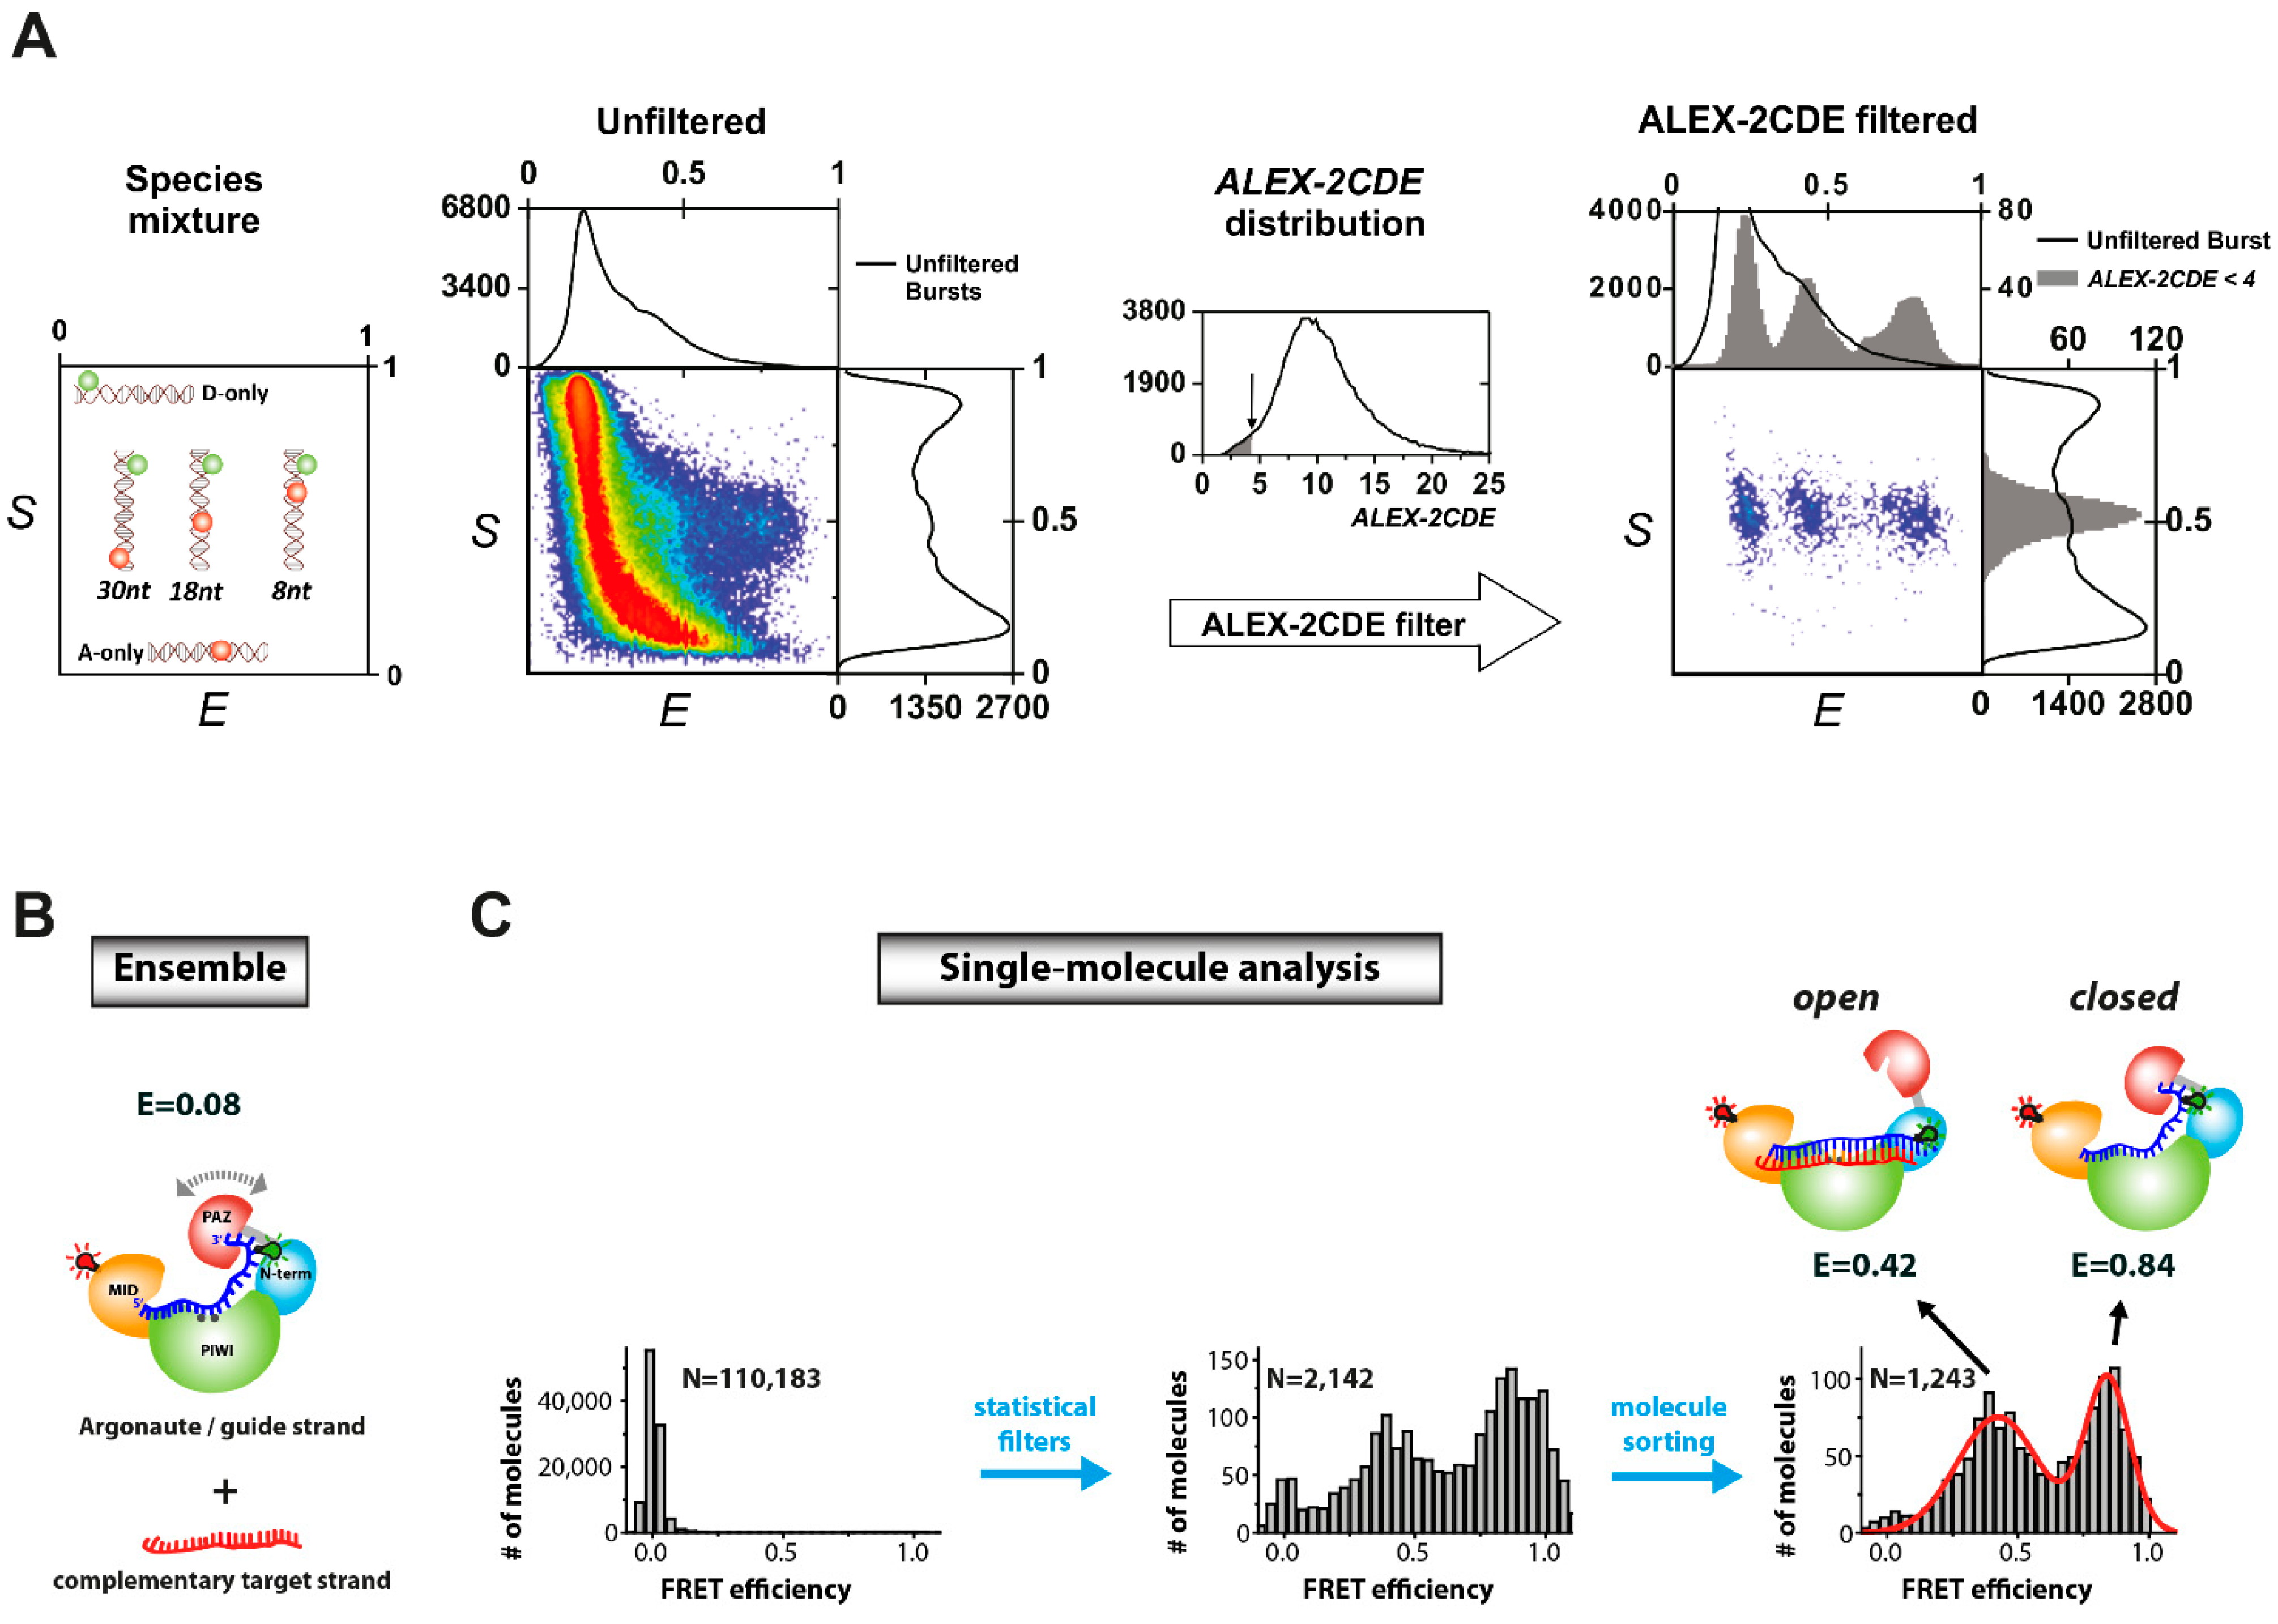
6.1. Data Registration and Analysis Using Confocal Fluorescence Microscopy
6.2. Data Registration and Analysis Using TIRF-Based Single-Molecule Measurements on Immobilized Molecules
6.3. Analysis of Weak Protein Interactions Using the Single-Molecule Co-Immunoprecipitation/Pulldown Technique
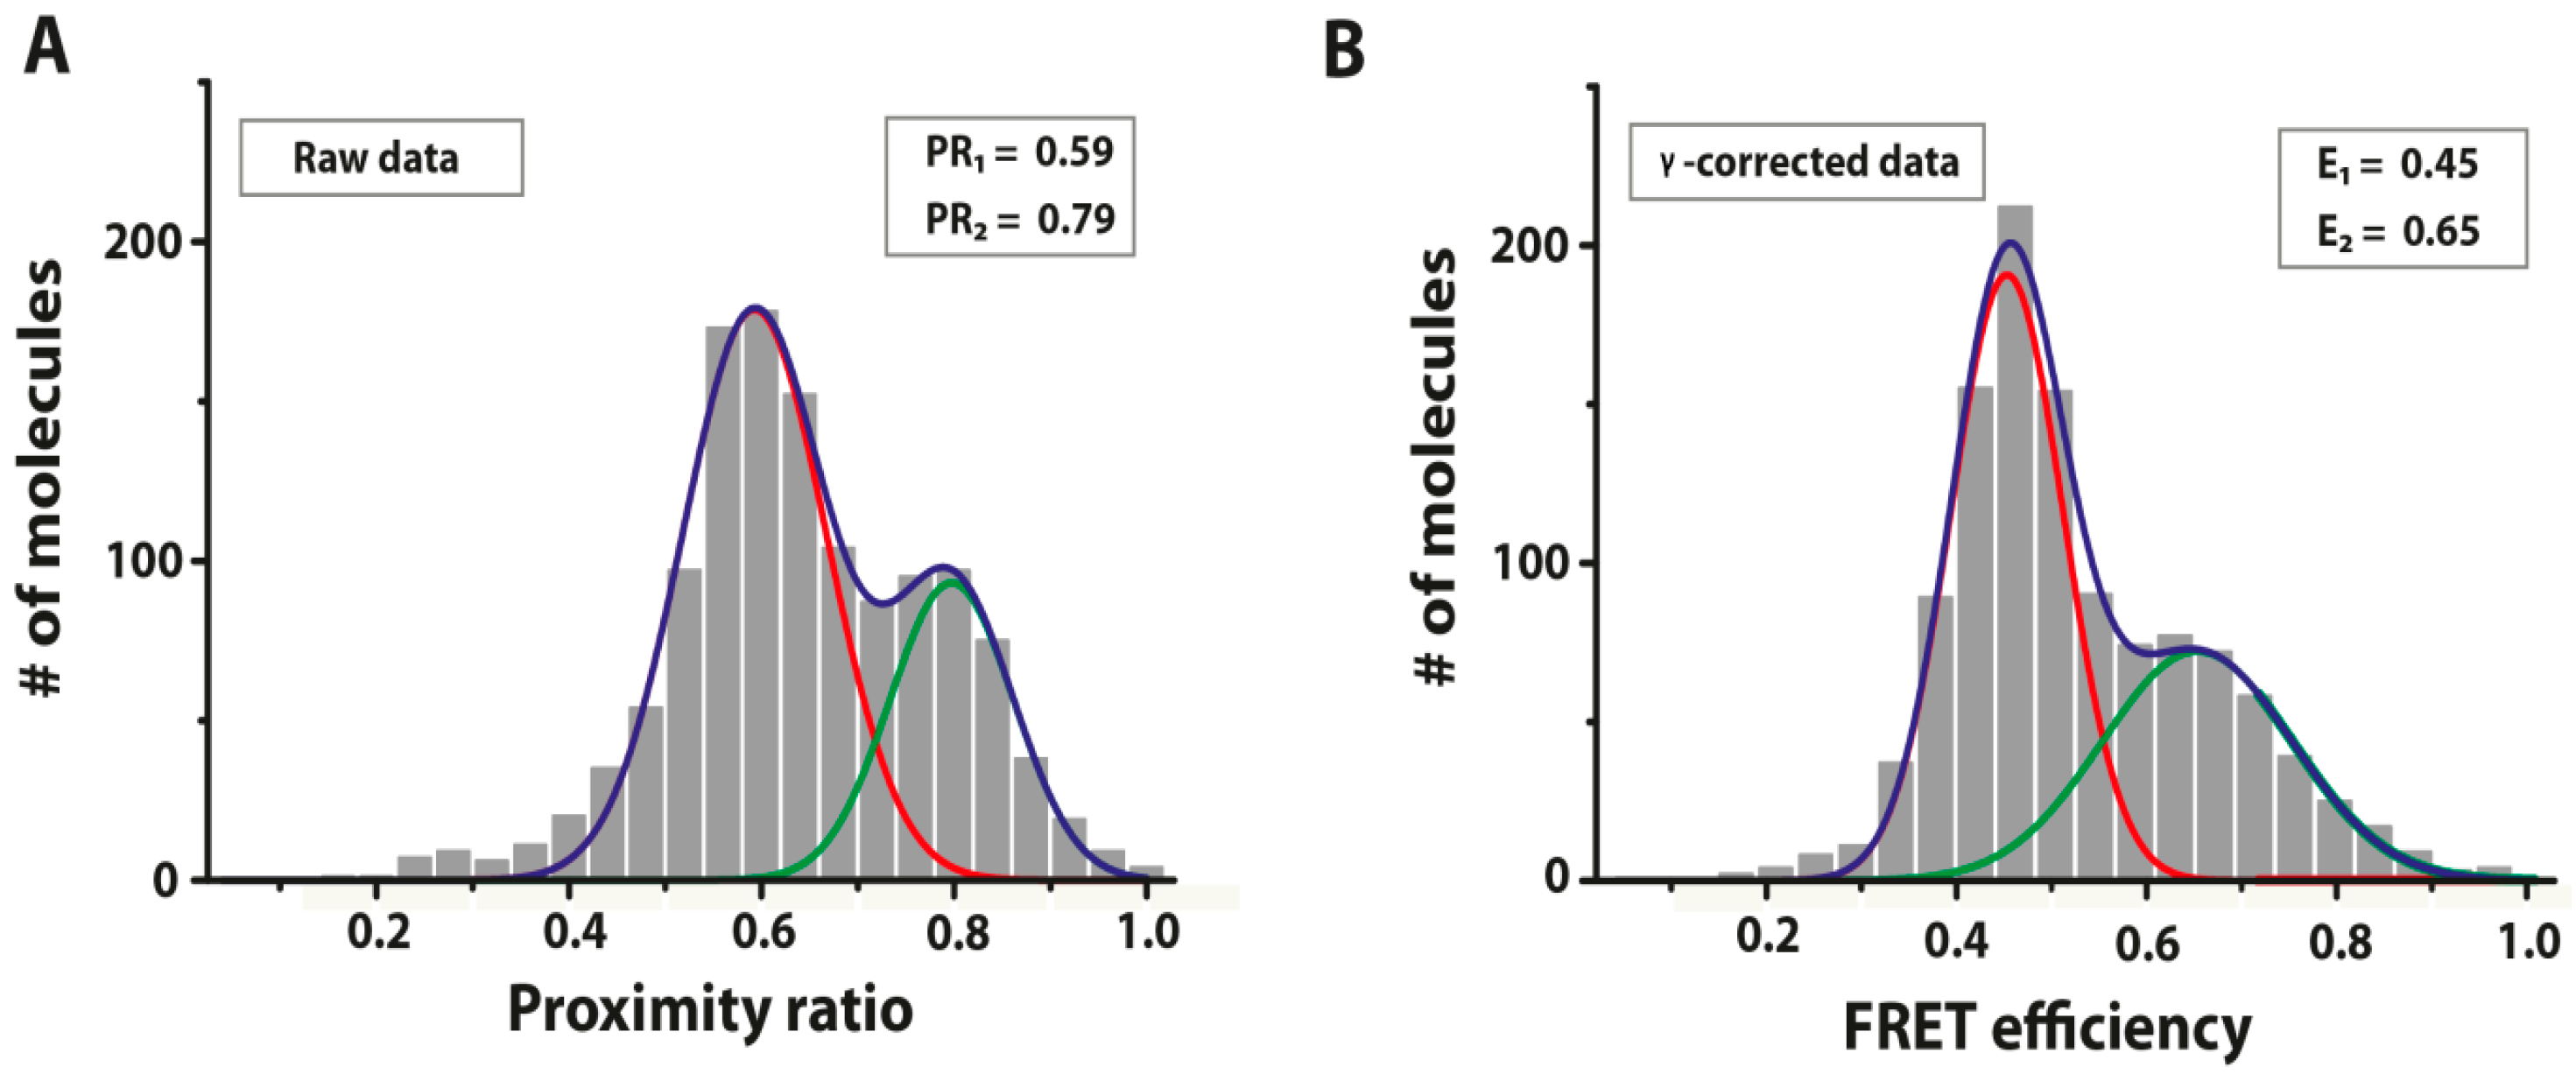
6.4. Single-Molecule FRET Analysis


7. Perspective
Acknowledgments
Conflicts of Interest
References
- Funatsu, T.; Harada, Y.; Tokunaga, M.; Saito, K.; Yanagida, T. Imaging of single fluorescent molecules and individual atp turnovers by single myosin molecules in aqueous solution. Nature 1995, 374, 555–559. [Google Scholar]
- Jain, A.; Liu, R.; Ramani, B.; Arauz, E.; Ishitsuka, Y.; Ragunathan, K.; Park, J.; Chen, J.; Xiang, Y.K.; Ha, T. Probing cellular protein complexes using single-molecule pull-down. Nature 2011, 473, 484–488. [Google Scholar]
- Wang, Q.; Moerner, W.E. Single-molecule motions enable direct visualization of biomolecular interactions in solution. Nat. Methods 2014, 11, 555–558. [Google Scholar]
- Zhang, Z.; Revyakin, A.; Grimm, J.B.; Lavis, L.D.; Tjian, R. Single-molecule tracking of the transcription cycle by sub-second rna detection. Elife 2014, 3, e01775. [Google Scholar]
- Tsai, A.; Petrov, A.; Marshall, R.A.; Korlach, J.; Uemura, S.; Puglisi, J.D. Heterogeneous pathways and timing of factor departure during translation initiation. Nature 2012, 487, 390–393. [Google Scholar]
- Milon, P.; Maracci, C.; Filonava, L.; Gualerzi, C.O.; Rodnina, M.V. Real-time assembly landscape of bacterial 30s translation initiation complex. Nat. Struct. Mol. Biol. 2012, 19, 609–615. [Google Scholar]
- Muschielok, A.; Andrecka, J.; Jawhari, A.; Bruckner, F.; Cramer, P.; Michaelis, J. A nano-positioning system for macromolecular structural analysis. Nat. Methods 2008, 5, 965–971. [Google Scholar]
- Banerjee, P.R.; Deniz, A.A. Shedding light on protein folding landscapes by single-molecule fluorescence. Chem. Soc. Rev. 2014, 43, 1172–1188. [Google Scholar]
- Holzmeister, P.; Acuna, G.P.; Grohmann, D.; Tinnefeld, P. Breaking the concentration limit of optical single-molecule detection. Chem. Soc. Rev. 2014, 43, 1014–1028. [Google Scholar]
- Grohmann, D.; Werner, F.; Tinnefeld, P. Making connections—Strategies for single molecule fluorescence biophysics. Curr. Opin. Chem. Biol. 2013, 17, 691–698. [Google Scholar]
- Lee, S.; Lee, J.; Hohng, S. Single-molecule three-color fret with both negligible spectral overlap and long observation time. PLoS One 2010, 5, e12270. [Google Scholar]
- Lee, J.; Lee, S.; Ragunathan, K.; Joo, C.; Ha, T.; Hohng, S. Single-molecule four-color fret. Angew. Chem. Int. Ed. 2010, 49, 9922–9925. [Google Scholar]
- Hoskins, A.A.; Friedman, L.J.; Gallagher, S.S.; Crawford, D.J.; Anderson, E.G.; Wombacher, R.; Ramirez, N.; Cornish, V.W.; Gelles, J.; Moore, M.J. Ordered and dynamic assembly of single spliceosomes. Science 2011, 331, 1289–1295. [Google Scholar]
- Crawford, D.J.; Hoskins, A.A.; Friedman, L.J.; Gelles, J.; Moore, M.J. Visualizing the splicing of single pre-mrna molecules in whole cell extract. Rna 2008, 14, 170–179. [Google Scholar]
- Shen, Z.; Chakraborty, A.; Jain, A.; Giri, S.; Ha, T.; Prasanth, K.V.; Prasanth, S.G. Dynamic association of orca with prereplicative complex components regulates DNA replication initiation. Mol. Cell. Biol. 2012, 32, 3107–3120. [Google Scholar]
- Lee, H.W.; Ryu, J.Y.; Yoo, J.; Choi, B.; Kim, K.; Yoon, T.Y. Real-time single-molecule coimmunoprecipitation of weak protein-protein interactions. Nat. Protoc. 2013, 8, 2045–2060. [Google Scholar]
- Joo, C.; Fareh, M.; Kim, V.N. Bringing single-molecule spectroscopy to macromolecular protein complexes. Trends Biochem. Sci. 2013, 38, 30–37. [Google Scholar]
- Muschielok, A.; Michaelis, J. Application of the nano-positioning system to the analysis of fluorescence resonance energy transfer networks. J. Phys. Chem. B 2011, 115, 11927–11937. [Google Scholar]
- Bates, M.; Huang, B.; Dempsey, G.T.; Zhuang, X. Multicolor super-resolution imaging with photo-switchable fluorescent probes. Science 2007, 317, 1749–1753. [Google Scholar]
- Doose, S.; Neuweiler, H.; Sauer, M. Fluorescence quenching by photoinduced electron transfer: A reporter for conformational dynamics of macromolecules. ChemPhysChem 2009, 10, 1389–1398. [Google Scholar]
- Sindbert, S.; Kalinin, S.; Nguyen, H.; Kienzler, A.; Clima, L.; Bannwarth, W.; Appel, B.; Müller, S.; Seidel, C.A.M. Accurate distance determination of nucleic acids via förster resonance energy transfer: Implications of dye linker length and rigidity. J. Am. Chem. Soc. 2011, 133, 2463–2480. [Google Scholar]
- Hoffmann, A.; Kane, A.; Nettels, D.; Hertzog, D.E.; Baumgartel, P.; Lengefeld, J.; Reichardt, G.; Horsley, D.A.; Seckler, R.; Bakajin, O.; et al. Mapping protein collapse with single-molecule fluorescence and kinetic synchrotron radiation circular dichroism spectroscopy. Proc. Natl. Acad. Sci. USA 2007, 104, 105–110. [Google Scholar]
- Schuler, B.; Lipman, E.A.; Eaton, W.A. Probing the free-energy surface for protein folding with single-molecule fluorescence spectroscopy. Nature 2002, 419, 743–747. [Google Scholar]
- Sherman, E.; Haran, G. Coil-globule transition in the denatured state of a small protein. Proc. Natl. Acad. Sci. USA 2006, 103, 11539–11543. [Google Scholar]
- Merchant, K.A.; Best, R.B.; Louis, J.M.; Gopich, I.V.; Eaton, W.A. Characterizing the unfolded states of proteins using single-molecule fret spectroscopy and molecular simulations. Proc. Natl. Acad. Sci. USA 2007, 104, 1528–1533. [Google Scholar]
- Chung, H.S.; Louis, J.M.; Eaton, W.A. Distinguishing between protein dynamics and dye photophysics in single-molecule fret experiments. Biophys. J. 2010, 98, 696–706. [Google Scholar]
- Smiley, R.D.; Collins, T.R.L.; Hammes, G.G.; Hsieh, T.-S. Single-molecule measurements of the opening and closing of the DNA gate by eukaryotic topoisomerase II. Proc. Natl. Acad. Sci. USA 2007, 104, 4840–4845. [Google Scholar]
- Stein, I.H.; Steinhauer, C.; Tinnefeld, P. Single-molecule four-color fret visualizes energy-transfer paths on DNA origami. J. Am. Chem. Soc. 2011, 133, 4193–4195. [Google Scholar]
- Ross, J.; Buschkamp, P.; Fetting, D.; Donnermeyer, A.; Roth, C.M.; Tinnefeld, P. Multicolor single-molecule spectroscopy with alternating laser excitation for the investigation of interactions and dynamics. J. Phys. Chem. B 2007, 111, 321–326. [Google Scholar]
- Kinoshita, M.; Kamagata, K.; Maeda, A.; Goto, Y.; Komatsuzaki, T.; Takahashi, S. Development of a technique for the investigation of folding dynamics of single proteins for extended time periods. Proc. Natl. Acad. Sci. USA 2007, 104, 10453–10458. [Google Scholar]
- Jung, C.; Ruthardt, N.; Lewis, R.; Michaelis, J.; Sodeik, B.; Nolde, F.; Peneva, K.; Müllen, K.; Bräuchle, C. Photophysics of new water-soluble terrylenediimide derivatives and applications in biology. ChemPhysChem 2009, 10, 180–190. [Google Scholar]
- Sanborn, M.E.; Connolly, B.K.; Gurunathan, K.; Levitus, M. Fluorescence properties and photophysics of the sulfoindocyanine cy3 linked covalently to DNA. J. Phys. Chem. B 2007, 111, 11064–11074. [Google Scholar]
- Rasnik, I.; McKinney, S.A.; Ha, T. Nonblinking and long-lasting single-molecule fluorescence imaging. Nat. Methods 2006, 3, 891–893. [Google Scholar]
- Zhuang, X.; Bartley, L.E.; Babcock, H.P.; Russell, R.; Ha, T.; Herschlag, D.; Chu, S. A single-molecule study of rna catalysis and folding. Science (Washington, DC) 2000, 288, 2048–2051. [Google Scholar]
- Cooper, M.; Ebner, A.; Briggs, M.; Burrows, M.; Gardner, N.; Richardson, R.; West, R. Cy3b: Improving the performance of cyanine dyes. J. Fluoresc. 2004, 14, 145–150. [Google Scholar]
- Wildanger, D.; Medda, R.; Kastrup, L.; Hell, S.W. A compact sted microscope providing 3d nanoscale resolution. J. Microsc. 2009, 236, 35–43. [Google Scholar]
- Kalinin, S.; Sisamakis, E.; Magennis, S.W.; Felekyan, S.; Seidel, C.A. On the origin of broadening of single-molecule fret efficiency distributions beyond shot noise limits. J. Phys. Chem. B 2010, 114, 6197–6206. [Google Scholar]
- Widengren, J.; Schwille, P. Characterization of photoinduced isomerization and back-isomerization of the cyanine dye cy5 by fluorescence correlation spectroscopy. J. Phys. Chem. A 2000, 104, 6416–6428. [Google Scholar]
- Vogelsang, J.; Kasper, R.; Steinhauer, C.; Person, B.; Heilemann, M.; Sauer, M.; Tinnefeld, P. A reducing and oxidizing system minimizes photobleaching and blinking of fluorescent dyes. Angew. Chem. Int. Ed. 2008, 47, 5465–5469. [Google Scholar]
- Pertsinidis, A.; Zhang, Y.; Chu, S. Subnanometer single-molecule localization, registration and distance measurements. Nature 2010, 466, 647–651. [Google Scholar]
- Kasper, R.; Harke, B.; Forthmann, C.; Tinnefeld, P.; Hell, S.W.; Sauer, M. Single-molecule sted microscopy with photostable organic fluorophores. Small 2010, 6, 1379–1384. [Google Scholar]
- Bückers, J.; Wildanger, D.; Vicidomini, G.; Kastrup, L.; Hell, S.W. Simultaneous multi-lifetime multi-color sted imaging for colocalization analyses. Opt. Express 2011, 19, 3130–3143. [Google Scholar]
- Buschmann, V.; Weston, K.D.; Sauer, M. Spectroscopic study and evaluation of red-absorbing fluorescent dyes. Bioconjug. Chem. 2002, 14, 195–204. [Google Scholar]
- Harms, G.S.; Sonnleitner, M.; Schutz, G.J.; Gruber, H.J.; Schmidt, T. Single-molecule anisotropy imaging. Biophys. J. 1999, 77, 2864–2870. [Google Scholar]
- Rothwell, P.J.; Berger, S.; Kensch, O.; Felekyan, S.; Antonik, M.; Wöhrl, B.M.; Restle, T.; Goody, R.S.; Seidel, C.A.M. Multiparameter single-molecule fluorescence spectroscopy reveals heterogeneity of hiv-1 reverse transcriptase:Primer/template complexes. Proc. Natl. Acad. Sci. USA 2003, 100, 1655–1660. [Google Scholar]
- Widengren, J.; Kudryavtsev, V.; Antonik, M.; Berger, S.; Gerken, M.; Seidel, C.A.M. Single-molecule detection and identification of multiple species by multiparameter fluorescence detection. Anal. Chem. 2006, 78, 2039–2050. [Google Scholar]
- Woźniak, A.K.; Schröder, G.F.; Grubmüller, H.; Seidel, C.A.M.; Oesterhelt, F. Single-molecule fret measures bends and kinks in DNA. Proc. Natl. Acad. Sci. USA 2008. [Google Scholar] [CrossRef]
- Holzmeister, P.; Gietl, A.; Tinnefeld, P. Geminate recombination as a photoprotection mechanism for fluorescent dyes. Angew. Chem. Int. Ed. Engl. 2014, 53, 5685–5688. [Google Scholar]
- Gietl, A.; Holzmeister, P.; Blombach, F.; Schulz, S.; von Voithenberg, L.V.; Lamb, D.C.; Werner, F.; Tinnefeld, P.; Grohmann, D. Eukaryotic and archaeal tbp and tfb/tf(ii)b follow different promoter DNA bending pathways. Nucleic Acids Res. 2014, 42, 6219–6231. [Google Scholar]
- Ha, T.; Tinnefeld, P. Photophysics of fluorescent probes for single-molecule biophysics and super-resolution imaging. Annu. Rev. Phys. Chem. 2012, 63, 595–617. [Google Scholar]
- Brasselet, S.; Aït-Belkacem, D.; Gasecka, A.; Munhoz, F.; Brustlein, S.; Brasselet, S. Influence of birefringence on polarization resolved nonlinear microscopy and collagen shg structural imaging. Opt. Express 2010, 18, 14859–14870. [Google Scholar]
- Vogelsang, J.; Cordes, T.; Forthmann, C.; Steinhauer, C.; Tinnefeld, P. Controlling the fluorescence of ordinary oxazine dyes for single-molecule switching and superresolution microscopy. Proc. Natl. Acad. Sci. USA 2009, 106, 8107–8112. [Google Scholar]
- Cordes, T.; Vogelsang, J.; Tinnefeld, P. On the mechanism of trolox as antiblinking and antibleaching reagent. J. Am. Chem. Soc. 2009, 131, 5018–5019. [Google Scholar]
- Hwang, H.; Kim, H.; Myong, S. Protein induced fluorescence enhancement as a single molecule assay with short distance sensitivity. Proc. Natl. Acad. Sci. USA 2011, 108, 7414–7418. [Google Scholar]
- Myong, S.; Stevens, B.C.; Ha, T. Bridging conformational dynamics and function using single-molecule spectroscopy. Structure 2006, 14, 633–643. [Google Scholar]
- Eggeling, C.; Fries, J.R.; Brand, L.; Günther, R.; Seidel, C.A.M. Monitoring conformational dynamics of a single molecule by selective fluorescence spectroscopy. Proc. Natl. Acad. Sci. USA 1998, 95, 1556–1561. [Google Scholar]
- Jungmann, R.; Steinhauer, C.; Scheible, M.; Kuzyk, A.; Tinnefeld, P.; Simmel, F.C. Single-molecule kinetics and super-resolution microscopy by fluorescence imaging of transient binding on DNA origami. Nano Lett. 2010, 10, 4756–4761. [Google Scholar]
- Cordes, T.; Santoso, Y.; Tomescu, A.I.; Gryte, K.; Hwang, L.C.; Camará, B.; Wigneshweraraj, S.; Kapanidis, A.N. Sensing DNA opening in transcription using quenchable förster resonance energy transfer. Biochemistry 2010, 49, 9171–9180. [Google Scholar]
- Di Fiori, N.; Meller, A. The effect of dye-dye interactions on the spatial resolution of single-molecule fret measurements in nucleic acids. Biophys. J. 2010, 98, 2265–2272. [Google Scholar]
- Benesch, R.E.; Benesch, R. Enzymatic removal of oxygen for polarography and related methods. Science 1953, 118, 447–448. [Google Scholar]
- Roy, R.; Hohng, S.; Ha, T. A practical guide to single-molecule fret. Nat. Methods 2008, 5, 507–516. [Google Scholar]
- Aitken, C.E.; Marshall, R.A.; Puglisi, J.D. An oxygen scavenging system for improvement of dye stability in single-molecule fluorescence experiments. Biophys. J. 2008, 94, 1826–1835. [Google Scholar]
- Patil, P.V.; Ballou, D.P. The use of protocatechuate dioxygenase for maintaining anaerobic conditions in biochemical experiments. Anal. Biochem. 2000, 286, 187–192. [Google Scholar]
- Vogelsang, J.; Cordes, T.; Tinnefeld, P. Single-molecule photophysics of oxazines on DNA and its application in a fret switch. Photochem. Photobiol. Sci. 2009, 8, 486–496. [Google Scholar]
- Plumeré, N.; Henig, J.; Campbell, W.H. Enzyme-catalyzed o2 removal system for electrochemical analysis under ambient air: Application in an amperometric nitrate biosensor. Anal. Chem. 2012, 84, 2141–2146. [Google Scholar]
- Vogelsang, J.; Steinhauer, C.; Forthmann, C.; Stein, I.H.; Person-Skegro, B.; Cordes, T.; Tinnefeld, P. Make them blink: Probes for super-resolution microscopy. ChemPhysChem 2010, 11, 2475–2490. [Google Scholar]
- Dempsey, G.T.; Vaughan, J.C.; Chen, K.H.; Bates, M.; Zhuang, X. Evaluation of fluorophores for optimal performance in localization-based super-resolution imaging. Nat. Methods 2011, 8, 1027–1036. [Google Scholar]
- Van de Linde, S.; Heilemann, M.; Sauer, M. Live-cell super-resolution imaging with synthetic fluorophores. Annu. Rev. Phys. Chem. 2012, 63, 519–540. [Google Scholar]
- Knight, J.L.; Mekler, V.; Mukhopadhyay, J.; Ebright, R.H.; Levy, R.M. Distance-restrained docking of rifampicin and rifamycin sv to rna polymerase using systematic fret measurements: Developing benchmarks of model quality and reliability. Biophys. J. 2005, 88, 925–938. [Google Scholar]
- Clegg, R.M. Fluorescence resonance energy transfer and nucleic acids. Methods Enzymol. 1992, 211, 353–388. [Google Scholar]
- Corry, B.; Jayatilaka, D. Simulation of structure, orientation, and energy transfer between alexafluor molecules attached to mscl. Biophys. J. 2008, 95, 2711–2721. [Google Scholar]
- Majumdar, Z.K.; Hickerson, R.; Noller, H.F.; Clegg, R.M. Measurements of internal distance changes of the 30
o;S Ribosome using FRET with multiple donor–acceptor pairs: Quantitative spectroscopic methods. J. Mol. Biol. 2005, 351, 1123–1145. [Google Scholar]
- Badali, D.; Gradinaru, C.C. The effect of brownian motion of fluorescent probes on measuring nanoscale distances by förster resonance energy transfer. J. Chem. Phys. 2011, 134. [Google Scholar] [CrossRef]
- Treutlein, B.; Muschielok, A.; Andrecka, J.; Jawhari, A.; Buchen, C.; Kostrewa, D.; Hög, F.; Cramer, P.; Michaelis, J. Dynamic architecture of a minimal rna polymerase ii open Hög, promoter complex. Mol. Cell 2012, 46, 136–146. [Google Scholar]
- Andrecka, J.; Lewis, R.; Brückner, F.; Lehmann, E.; Cramer, P.; Michaelis, J. Single-molecule tracking of mrna exiting from rna polymerase ii. Proc. Natl. Acad. Sci. USA 2008, 105, 135–140. [Google Scholar]
- Andrecka, J.; Treutlein, B.; Arcusa, M.A.I.; Muschielok, A.; Lewis, R.; Cheung, A.C.M.; Cramer, P.; Michaelis, J. Nano positioning system reveals the course of upstream and nontemplate DNA within the rna polymerase ii elongation complex. Nucleic Acids Res. 2009, 37, 5803–5809. [Google Scholar]
- Auclair, S.M.; Moses, J.P.; Musial-Siwek, M.; Kendall, D.A.; Oliver, D.B.; Mukerji, I. Mapping of the signal peptide-binding domain of escherichia coli seca using förster resonance energy transfer. Biochemistry 2009, 49, 782–792. [Google Scholar]
- Choi, U.B.; Strop, P.; Vrljic, M.; Chu, S.; Brunger, A.T.; Weninger, K.R. Single-molecule fret-derived model of the synaptotagmin 1-snare fusion complex. Nat. Struct. Mol. Biol. 2010, 17, 318–324. [Google Scholar]
- Margittai, M.; Widengren, J.; Schweinberger, E.; Schröder, G.F.; Felekyan, S.; Haustein, E.; König, M.; Fasshauer, D.; Grubmüller, H.; Jahn, R.; et al. Single-molecule fluorescence resonance energy transfer reveals a dynamic equilibrium between closed and open conformations of syntaxin 1. Proc. Natl. Acad. Sci. USA 2003, 100, 15516–15521. [Google Scholar]
- Mekler, V.; Kortkhonjia, E.; Mukhopadhyay, J.; Knight, J.; Revyakin, A.; Kapanidis, A.N.; Niu, W.; Ebright, Y.W.; Levy, R.; Ebright, R.H. Structural organization of bacterial rna polymerase holoenzyme and the rna polymerase-promoter open complex. Cell 2002, 108, 599–614. [Google Scholar]
- Mukhopadhyay, J.; Sineva, E.; Knight, J.; Levy, R.M.; Ebright, R.H. Antibacterial peptide microcin j25 inhibits transcription by binding within and obstructing the rna polymerase secondary channel. Mol. Cell 2004, 14, 739–751. [Google Scholar]
- Rasnik, I.; Myong, S.; Cheng, W.; Lohman, T.M.; Ha, T. DNA-binding orientation and domain conformation of the E. coli rep helicase monomer bound to a partial duplex junction: Single-molecule studies of fluorescently labeled enzymes. J. Mol. Biol. 2004, 336, 395–408. [Google Scholar]
- Grohmann, D.; Nagy, J.; Chakraborty, A.; Klose, D.; Fielden, D.; Ebright, R.H.; Michaelis, J.; Werner, F. The initiation factor tfe and the elongation factor spt4/5 compete for the rnap clamp during transcription initiation and elongation. Mol. Cell 2011, 43, 263–274. [Google Scholar]
- Deniz, A.A.; Dahan, M.; Grunwell, J.R.; Ha, T.; Faulhaber, A.E.; Chemla, D.S.; Weiss, S.; Schultz, P.G. Single-pair fluorescence resonance energy transfer on freely diffusing molecules: Observation of forster distance dependence and subpopulations. Proc. Natl. Acad. Sci. USA 1999, 96, 3670–3675. [Google Scholar]
- Nie, S.; Chiu, D.T.; Zare, R.N. Probing individual molecules with confocal fluorescence microscopy. Science 1994, 266, 1018–1021. [Google Scholar]
- Axelrod, D. Total internal reflection fluorescence microscopy in cell biology. Methods Enzymol. 2003, 361, 1–33. [Google Scholar]
- Moerner, W.E.; Fromm, D.P. Methods of single-molecule fluorescence spectroscopy and microscopy. Rev. Sci. Instrum. 2003, 74, 3597–3619. [Google Scholar]
- Lee, N.K.; Kapanidis, A.N.; Wang, Y.; Michalet, X.; Mukhopadhyay, J.; Ebright, R.H.; Weiss, S. Accurate fret measurements within single diffusing biomolecules using alternating-laser excitation. Biophys. J. 2005, 88, 2939–2953. [Google Scholar]
- Nir, E.; Michalet, X.; Hamadani, K.M.; Laurence, T.A.; Neuhauser, D.; Kovchegov, Y.; Weiss, S. Shot-noise limited single-molecule fret histograms: Comparison between theory and experiments. J. Phys. Chem. B 2006, 110, 22103–22124. [Google Scholar]
- Kapanidis, A.N.; Lee, N.K.; Laurence, T.A.; Doose, S.; Margeat, E.; Weiss, S. Fluorescence-aided molecule sorting: Analysis of structure and interactions by alternating-laser excitation of single molecules. Proc. Natl. Acad. Sci. USA 2004, 101, 8936–8941. [Google Scholar]
- Hohlbein, J.; Craggs, T.D.; Cordes, T. Alternating-laser excitation: Single-molecule fret and beyond. Chem. Soc. Rev. 2014, 43, 1156–1171. [Google Scholar]
- Muller, B.K.; Zaychikov, E.; Brauchle, C.; Lamb, D.C. Pulsed interleaved excitation. Biophys. J. 2005, 89, 3508–3522. [Google Scholar]
- Saurabh, S.; Maji, S.; Bruchez, M.P. Evaluation of scmos cameras for detection and localization of single cy5 molecules. Opt. Express 2012, 20, 7338–7349. [Google Scholar]
- Michalet, X.; Colyer, R.A.; Scalia, G.; Ingargiola, A.; Lin, R.; Millaud, J.E.; Weiss, S.; Siegmund, O.H.; Tremsin, A.S.; Vallerga, J.V.; et al. Development of new photon-counting detectors for single-molecule fluorescence microscopy. Philos. Trans. R. Soc. Lond. B Biol. Sci. 2013, 368. [Google Scholar] [CrossRef]
- Gambin, Y.; Ariotti, N.; McMahon, K.A.; Bastiani, M.; Sierecki, E.; Kovtun, O.; Polinkovsky, M.E.; Magenau, A.; Jung, W.; Okano, S.; et al. Single-molecule analysis reveals self assembly and nanoscale segregation of two distinct cavin subcomplexes on caveolae. Elife 2014, 3, e01434. [Google Scholar]
- Jeyachandran, Y.L.; Mielczarski, J.A.; Mielczarski, E.; Rai, B. Efficiency of blocking of non-specific interaction of different proteins by bsa adsorbed on hydrophobic and hydrophilic surfaces. J. Colloid Interface Sci. 2010, 341, 136–142. [Google Scholar]
- Ha, T.; Rasnik, I.; Cheng, W.; Babcock, H.P.; Gauss, G.H.; Lohman, T.M.; Chu, S. Initiation and re-initiation of DNA unwinding by the escherichia coli rep helicase. Nature 2002, 419, 638–641. [Google Scholar]
- Sahoo, H.; Schwille, P. Fret and fcs—Friends or foes? ChemPhysChem 2011, 12, 532–541. [Google Scholar]
- Heyes, C.D.; Groll, J.; Moller, M.; Nienhaus, G.U. Synthesis, patterning and applications of star-shaped poly(ethylene glycol) biofunctionalized surfaces. Mol. BioSyst. 2007, 3, 419–430. [Google Scholar]
- Scott, E.A.; Nichols, M.D.; Cordova, L.H.; George, B.J.; Jun, Y.-S.; Elbert, D.L. Protein adsorption and cell adhesion on nanoscale bioactive coatings formed from poly(ethylene glycol) and albumin microgels. Biomaterials 2008, 29, 4481–4493. [Google Scholar]
- Tessler, L.A.; Donahoe, C.D.; Garcia, D.J.; Jun, Y.-S.; Elbert, D.L.; Mitra, R.D. Nanogel surface coatings for improved single-molecule imaging substrates. J. R. Soc. Interface 2011, 8, 1400–1408. [Google Scholar]
- Zanetti-Domingues, L.C.; Martin-Fernandez, M.L.; Needham, S.R.; Rolfe, D.J.; Clarke, D.T. A systematic investigation of differential effects of cell culture substrates on the extent of artifacts in single-molecule tracking. PLoS One 2012, 7, e45655. [Google Scholar]
- Chandradoss, S.D.; Haagsma, A.C.; Lee, Y.K.; Hwang, J.H.; Nam, J.M.; Joo, C. Surface passivation for single-molecule protein studies. J. Vis. Exp. 2014, 86. [Google Scholar] [CrossRef]
- Gietl, A.; Holzmeister, P.; Grohmann, D.; Tinnefeld, P. DNA origami as biocompatible surface to match single-molecule and ensemble experiments. Nucleic Acids Res. 2012, 40, e110. [Google Scholar]
- Sackmann, E. Supported membranes: Scientific and practical applications. Science 1996, 271, 43–48. [Google Scholar]
- Granéli, A.; Yeykal, C.C.; Prasad, T.K.; Greene, E.C. Organized arrays of individual DNA molecules tethered to supported lipid bilayers. Langmuir 2005, 22, 292–299. [Google Scholar]
- Rhoades, E.; Gussakovsky, E.; Haran, G. Watching proteins fold one molecule at a time. Proc. Natl. Acad. Sci. USA 2003, 100, 3197–3202. [Google Scholar]
- Okumus, B.; Wilson, T.J.; Lilley, D.M.J.; Ha, T. Vesicle encapsulation studies reveal that single molecule ribozyme heterogeneities are intrinsic. Biophys. J. 2004, 87, 2798–2806. [Google Scholar]
- Cisse, I.; Okumus, B.; Joo, C.; Ha, T. Fueling protein–DNA interactions inside porous nanocontainers. Proc. Natl. Acad. Sci. USA 2007, 104, 12646–12650. [Google Scholar]
- Groll, J.; Amirgoulova, E.V.; Ameringer, T.; Heyes, C.D.; Rocker, C.; Nienhaus, G.U.; Moller, M. Biofunctionalized, ultrathin coatings of cross-linked star-shaped poly(ethylene oxide) allow reversible folding of immobilized proteins. J. Am. Chem. Soc. 2004, 126, 4234–4239. [Google Scholar]
- Talaga, D.S.; Lau, W.L.; Roder, H.; Tang, J.; Jia, Y.; DeGrado, W.F.; Hochstrasser, R.M. Dynamics and folding of single two-stranded coiled-coil peptides studied by fluorescent energy transfer confocal microscopy. Proc. Natl. Acad. Sci. USA 2000, 97, 13021–13026. [Google Scholar]
- Tsukanov, R.; Tomov, T.E.; Masoud, R.; Drory, H.; Plavner, N.; Liber, M.; Nir, E. Detailed study of DNA hairpin dynamics using single-molecule fluorescence assisted by DNA origami. J. Phys. Chem. B 2013, 117, 11932–11942. [Google Scholar]
- Rothemund, P.W. Folding DNA to create nanoscale shapes and patterns. Nature 2006, 440, 297–302. [Google Scholar]
- Fu, J.; Liu, M.; Liu, Y.; Yan, H. Spatially-interactive biomolecular networks organized by nucleic acid nanostructures. Acc. Chem. Res. 2012, 45, 1215–1226. [Google Scholar]
- Maoz, B.M.; van der Weegen, R.; Fan, Z.; Govorov, A.O.; Ellestad, G.; Berova, N.; Meijer, E.W.; Markovich, G. Plasmonic chiroptical response of silver nanoparticles interacting with chiral supramolecular assemblies. J. Am. Chem. Soc. 2012, 134, 17807–17813. [Google Scholar]
- Acuna, G.P.; Moller, F.M.; Holzmeister, P.; Beater, S.; Lalkens, B.; Tinnefeld, P. Fluorescence enhancement at docking sites of DNA-directed self-assembled nanoantennas. Science 2012, 338, 506–510. [Google Scholar]
- Tyagi, S.; VanDelinder, V.; Banterle, N.; Fuertes, G.; Milles, S.; Agez, M.; Lemke, E.A. Continuous throughput and long-term observation of single-molecule fret without immobilization. Nat. Methods 2014, 11, 297–300. [Google Scholar]
- Shon, M.J.; Cohen, A.E. Mass action at the single-molecule level. J. Am. Chem. Soc. 2012, 134, 14618–14623. [Google Scholar]
- Watanabe, R.; Soga, N.; Fujita, D.; Tabata, K.V.; Yamauchi, L.; Hyeon Kim, S.; Asanuma, D.; Kamiya, M.; Urano, Y.; Suga, H.; et al. Arrayed lipid bilayer chambers allow single-molecule analysis of membrane transporter activity. Nat. Commun. 2014, 5. [Google Scholar] [CrossRef]
- Eggeling, C.; Berger, S.; Brand, L.; Fries, J.R.; Schaffer, J.; Volkmer, A.; Seidel, C.A. Data registration and selective single-molecule analysis using multi-parameter fluorescence detection. J. Biotechnol. 2001, 86, 163–180. [Google Scholar]
- Hines, K.E. Inferring subunit stoichiometry from single molecule photobleaching. J. Gen. Physiol. 2013, 141, 737–746. [Google Scholar]
- Cherny, D.; Gooding, C.; Eperon, G.E.; Coelho, M.B.; Bagshaw, C.R.; Smith, C.W.; Eperon, I.C. Stoichiometry of a regulatory splicing complex revealed by single-molecule analyses. EMBO J. 2010, 29, 2161–2172. [Google Scholar]
- Geertsema, H.J.; Kulczyk, A.W.; Richardson, C.C.; van Oijen, A.M. Single-molecule studies of polymerase dynamics and stoichiometry at the bacteriophage t7 replication machinery. Proc. Natl. Acad. Sci. USA 2014, 111, 4073–4078. [Google Scholar]
- Leake, M.C.; Chandler, J.H.; Wadhams, G.H.; Bai, F.; Berry, R.M.; Armitage, J.P. Stoichiometry and turnover in single, functioning membrane protein complexes. Nature 2006, 443, 355–358. [Google Scholar]
- Xie, X.S.; Lu, H.P. Single-molecule enzymology. J. Biol. Chem. 1999, 274, 15967–15970. [Google Scholar]
- Van Oijen, A.M. Single-molecule approaches to characterizing kinetics of biomolecular interactions. Curr. Opin. Biotechnol. 2011, 22, 75–80. [Google Scholar]
- Kim, E.; Lee, S.; Jeon, A.; Choi, J.M.; Lee, H.S.; Hohng, S.; Kim, H.S. A single-molecule dissection of ligand binding to a protein with intrinsic dynamics. Nat. Chem. Biol. 2013, 9, 313–318. [Google Scholar]
- Holden, S.J.; Uphoff, S.; Hohlbein, J.; Yadin, D.; Le Reste, L.; Britton, O.J.; Kapanidis, A.N. Defining the limits of single-molecule fret resolution in tirf microscopy. Biophys. J. 2010, 99, 3102–3111. [Google Scholar]
- Lee, H.W.; Kyung, T.; Yoo, J.; Kim, T.; Chung, C.; Ryu, J.Y.; Lee, H.; Park, K.; Lee, S.; Jones, W.D.; et al. Real-time single-molecule co-immunoprecipitation analyses reveal cancer-specific ras signaling dynamics. Nat. Commun. 2013, 4. [Google Scholar] [CrossRef]
- Dahan, M.; Deniz, A.A.; Ha, T.; Chemla, D.S.; Schultz, P.G.; Weiss, S. Ratiometric measurement and identification of single diffusing molecules. Chem. Phys. 1999, 247, 85–106. [Google Scholar]
- Deniz, A.A.; Laurence, T.A.; Dahan, M.; Chemla, D.S.; Schultz, P.G.; Weiss, S. Ratiometric single-molecule studies of freely diffusing biomolecules. Annu. Rev. Phys. Chem. 2001, 52, 233–253. [Google Scholar]
- Sisamakis, E.; Valeri, A.; Kalinin, S.; Rothwell, P.J.; Seidel, C.A. Accurate single-molecule fret studies using multiparameter fluorescence detection. Methods Enzymol. 2010, 475, 455–514. [Google Scholar]
- Basche, T.; Moerner, W.E.; Orrit, M.; Talon, H. Photon antibunching in the fluorescence of a single dye molecule trapped in a solid. Phys. Rev. Lett. 1992, 69, 1516–1519. [Google Scholar]
- Kalinin, S.; Felekyan, S.; Valeri, A.; Seidel, C.A. Characterizing multiple molecular states in single-molecule multiparameter fluorescence detection by probability distribution analysis. J. Phys. Chem. B 2008, 112, 8361–8374. [Google Scholar]
- Antonik, M.; Felekyan, S.; Gaiduk, A.; Seidel, C.A. Separating structural heterogeneities from stochastic variations in fluorescence resonance energy transfer distributions via photon distribution analysis. J. Phys. Chem. B 2006, 110, 6970–6978. [Google Scholar]
- Tsukanov, R.; Tomov, T.E.; Berger, Y.; Liber, M.; Nir, E. Conformational dynamics of DNA hairpins at millisecond resolution obtained from analysis of single-molecule fret histograms. J. Phys. Chem. B 2013, 117, 16105–16109. [Google Scholar]
- Deniz, A.A.; Laurence, T.A.; Beligere, G.S.; Dahan, M.; Martin, A.B.; Chemla, D.S.; Dawson, P.E.; Schultz, P.G.; Weiss, S. Single-molecule protein folding: Diffusion fluorescence resonance energy transfer studies of the denaturation of chymotrypsin inhibitor 2. Proc. Natl. Acad. Sci. USA 2000, 97, 5179–5184. [Google Scholar]
- Pljevaljčič, G.; Millar, D.P.; Deniz, A.A. Freely diffusing single hairpin ribozymes provide insights into the role of secondary structure and partially folded states in rna folding. Biophys. J. 2004, 87, 457–467. [Google Scholar]
- Schuler, B.; Hofmann, H. Single-molecule spectroscopy of protein folding dynamics—Expanding scope and timescales. Curr. Opin. Struct. Biol. 2013, 23, 36–47. [Google Scholar]
- Kim, H.D.; Puglisi, J.D.; Chu, S. Fluctuations of transfer rnas between classical and hybrid states. Biophys. J. 2007, 93, 3575–3582. [Google Scholar]
- McCann, J.J.; Choi, U.B.; Zheng, L.; Weninger, K.; Bowen, M.E. Optimizing methods to recover absolute fret efficiency from immobilized single molecules. Biophys. J. 2010, 99, 961–970. [Google Scholar]
- Tomov, T.E.; Tsukanov, R.; Masoud, R.; Liber, M.; Plavner, N.; Nir, E. Disentangling subpopulations in single-molecule fret and alex experiments with photon distribution analysis. Biophys. J. 2012, 102, 1163–1173. [Google Scholar]
- Zander, A.; Holzmeister, P.; Klose, D.; Tinnefeld, P.; Grohmann, D. Single-molecule fret supports the two-state model of argonaute action. RNA Biol. 2014, 11, 45–56. [Google Scholar]
- Ryu, Y.; Schultz, P.G. Efficient incorporation of unnatural amino acids into proteins in escherichia coli. Nat. Methods 2006, 3, 263–265. [Google Scholar]
- Tyagi, S.; Lemke, E.A. Genetically encoded click chemistry for single-molecule fret of proteins. Methods Cell Biol. 2013, 113, 169–187. [Google Scholar]
- Plass, T.; Milles, S.; Koehler, C.; Szymanski, J.; Mueller, R.; Wiessler, M.; Schultz, C.; Lemke, E.A. Amino acids for diels-alder reactions in living cells. Angew. Chem. Int. Ed. Engl. 2012, 51, 4166–4170. [Google Scholar]
- Altman, R.B.; Zheng, Q.; Zhou, Z.; Terry, D.S.; Warren, J.D.; Blanchard, S.C. Enhanced photostability of cyanine fluorophores across the visible spectrum. Nat. Methods 2012, 9, 428–429. [Google Scholar]
- Tinnefeld, P.; Cordes, T. “Self-healing” dyes: Intramolecular stabilization of organic fluorophores. Nat. Methods 2012, 9, 426–427. [Google Scholar]
- Acuna, G.; Grohmann, D.; Tinnefeld, P. Enhancing single-molecule fluorescence with nanophotonics. FEBS Lett. 2014, 588, 3547–3552. [Google Scholar]
- Mivelle, M.; van Zanten, T.S.; Manzo, C.; Garcia-Parajo, M.F. Nanophotonic approaches for nanoscale imaging and single-molecule detection at ultrahigh concentrations. Microsc. Res. Tech. 2014, 77, 537–545. [Google Scholar]
- Eid, J.; Fehr, A.; Gray, J.; Luong, K.; Lyle, J.; Otto, G.; Peluso, P.; Rank, D.; Baybayan, P.; Bettman, B.; et al. Real-time DNA sequencing from single polymerase molecules. Science 2009, 323, 133–138. [Google Scholar]
- Chen, J.; Dalal, R.V.; Petrov, A.N.; Tsai, A.; O’Leary, S.E.; Chapin, K.; Cheng, J.; Ewan, M.; Hsiung, P.L.; Lundquist, P.; et al. High-throughput platform for real-time monitoring of biological processes by multicolor single-molecule fluorescence. Proc. Natl. Acad. Sci. USA 2014, 111, 664–669. [Google Scholar]
- Plochowietz, A.; Crawford, R.; Kapanidis, A.N. Characterization of organic fluorophores for in vivo fret studies based on electroporated molecules. Phys. Chem. Chem. Phys. 2014, 16, 12688–12694. [Google Scholar]
- Stracy, M.; Uphoff, S.; Garza de Leon, F.; Kapanidis, A.N. In vivo single-molecule imaging of bacterial DNA replication, transcription, and repair. FEBS Lett. 2014, 588, 3585–3594. [Google Scholar]
© 2014 by the authors. Licensee MDPI, Basel, Switzerland. This article is an open access article distributed under the terms and conditions of the Creative Commons Attribution license ( http://creativecommons.org/licenses/by/4.0/).
Share and Cite
Gust, A.; Zander, A.; Gietl, A.; Holzmeister, P.; Schulz, S.; Lalkens, B.; Tinnefeld, P.; Grohmann, D. A Starting Point for Fluorescence-Based Single-Molecule Measurements in Biomolecular Research. Molecules 2014, 19, 15824-15865. https://doi.org/10.3390/molecules191015824
Gust A, Zander A, Gietl A, Holzmeister P, Schulz S, Lalkens B, Tinnefeld P, Grohmann D. A Starting Point for Fluorescence-Based Single-Molecule Measurements in Biomolecular Research. Molecules. 2014; 19(10):15824-15865. https://doi.org/10.3390/molecules191015824
Chicago/Turabian StyleGust, Alexander, Adrian Zander, Andreas Gietl, Phil Holzmeister, Sarah Schulz, Birka Lalkens, Philip Tinnefeld, and Dina Grohmann. 2014. "A Starting Point for Fluorescence-Based Single-Molecule Measurements in Biomolecular Research" Molecules 19, no. 10: 15824-15865. https://doi.org/10.3390/molecules191015824