Antioxidant Properties and Hyphenated HPLC-PDA-MS Profiling of Chilean Pica Mango Fruits (Mangifera indica L. Cv. piqueño)


Abstract
:
1. Introduction
2. Results and Discussion
2.1. Antioxidant Capacity and Phenolic Content of Mango Fruits from Northern Chile

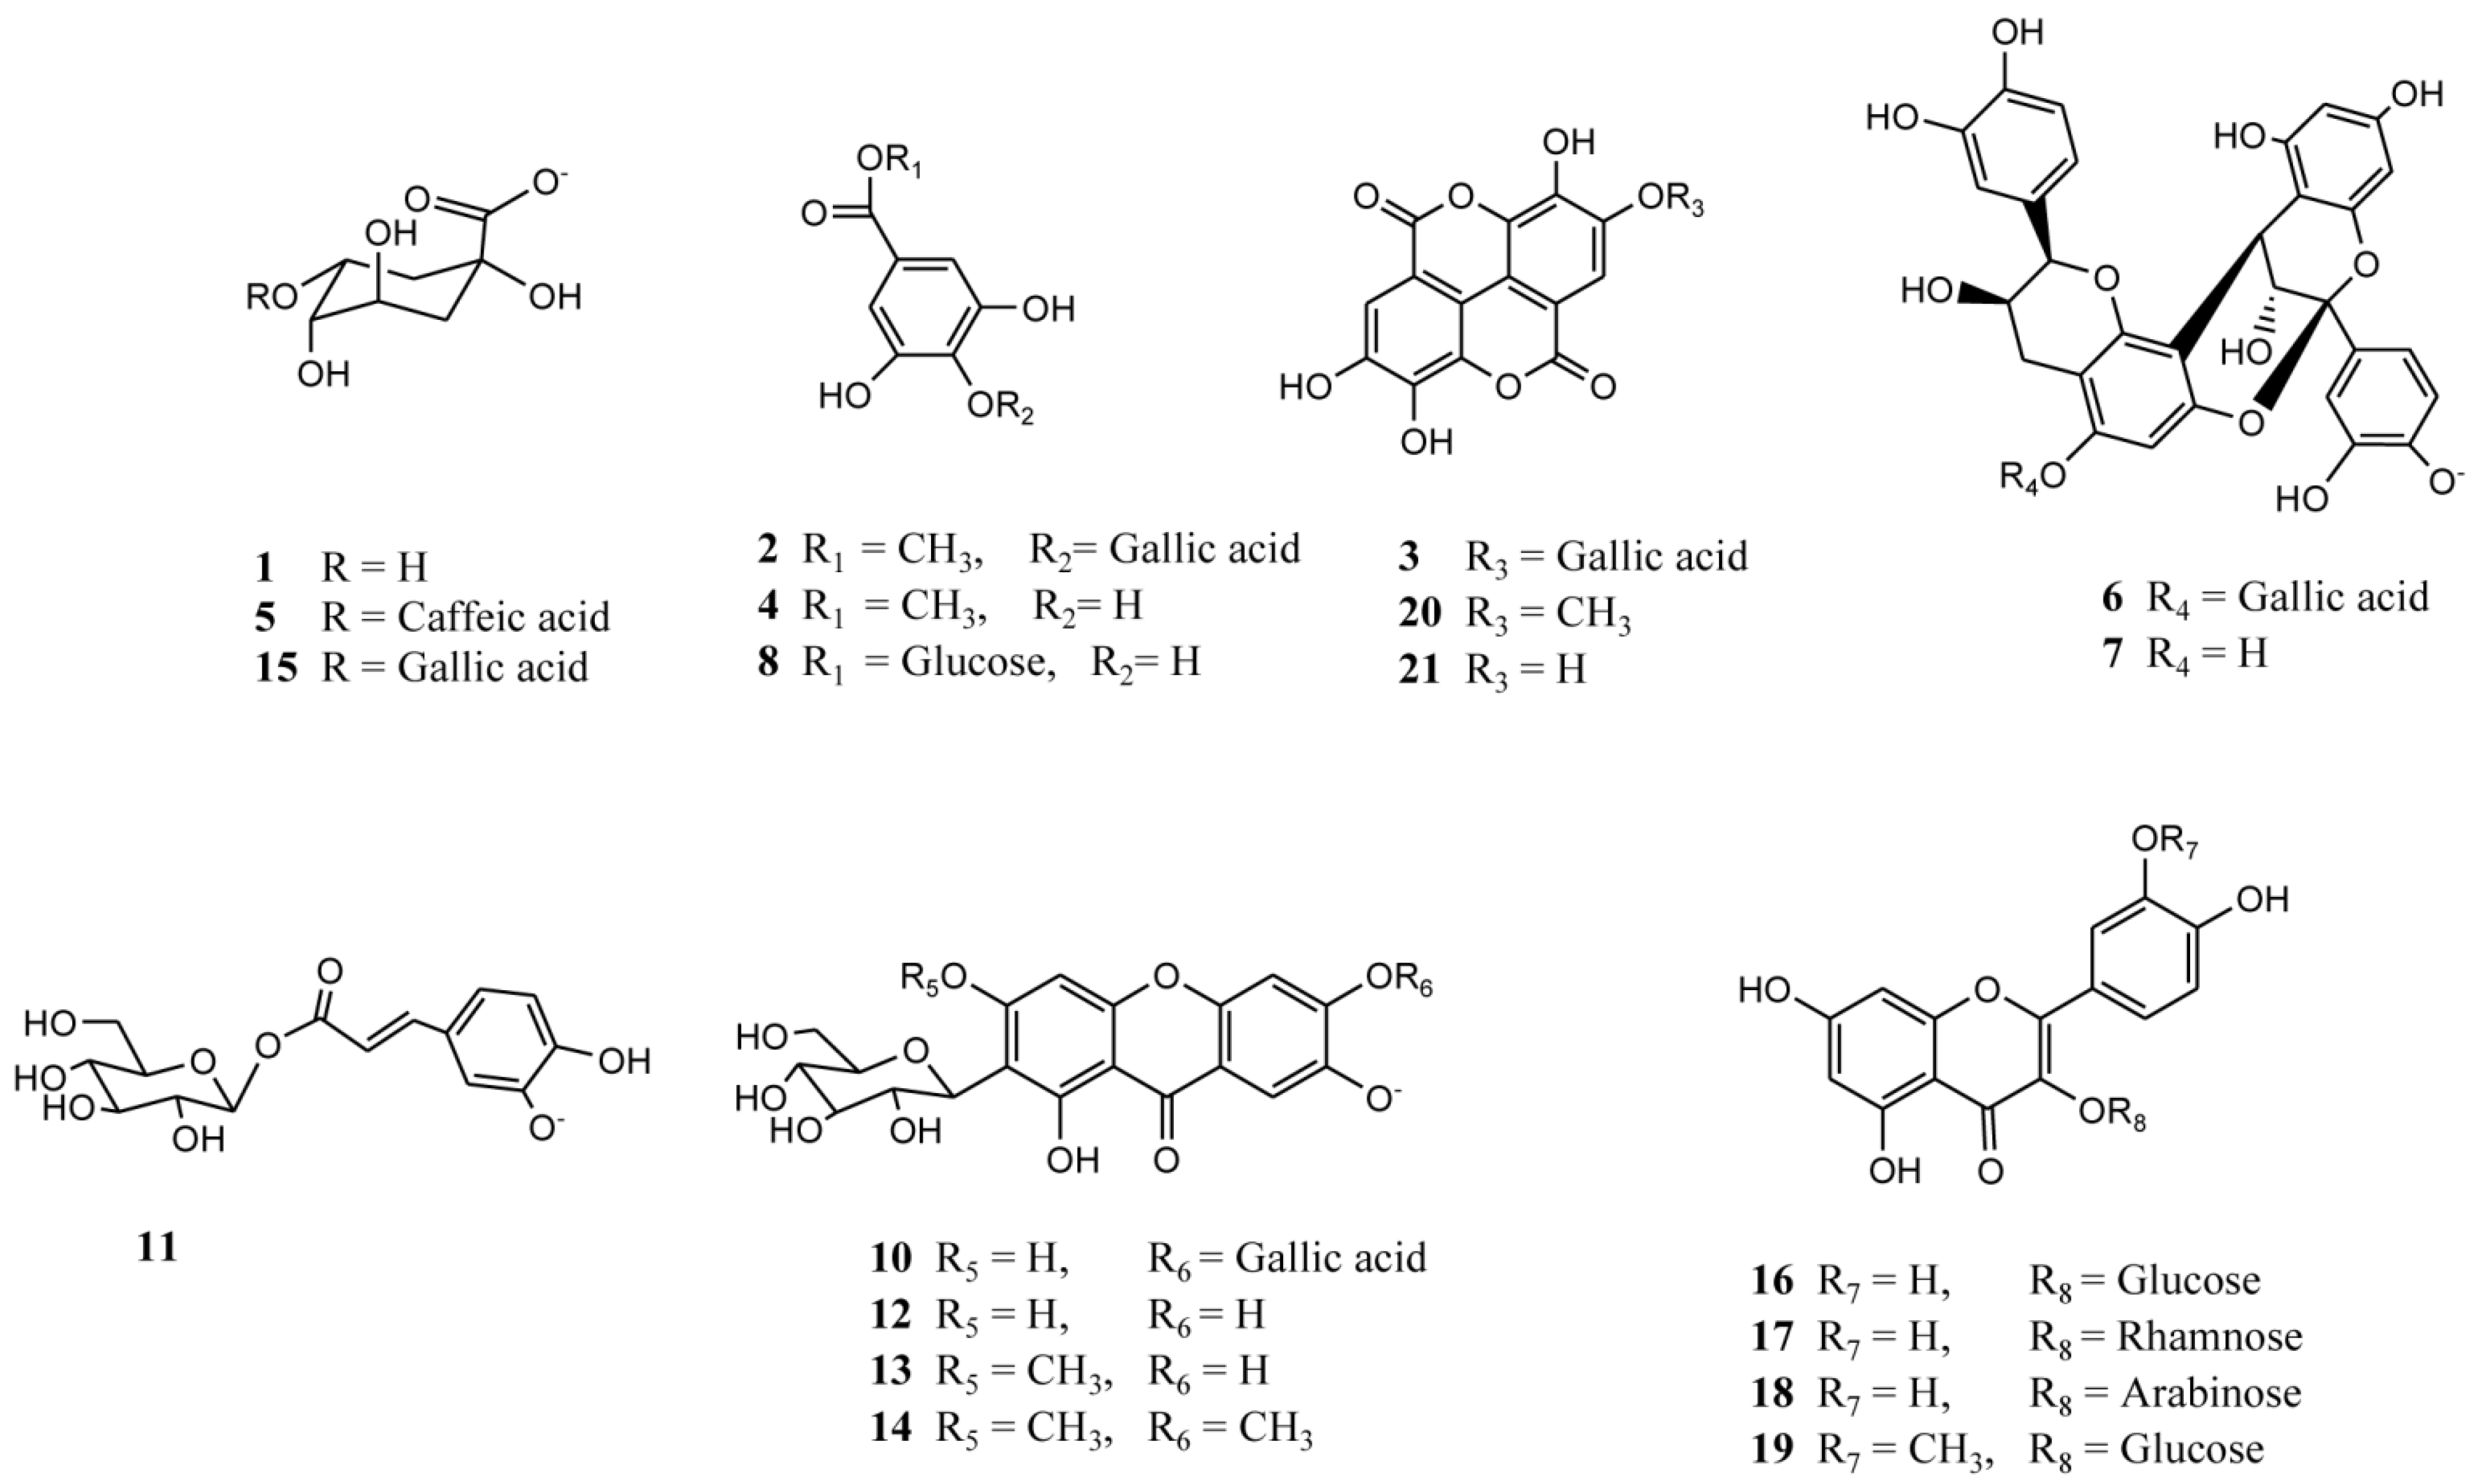
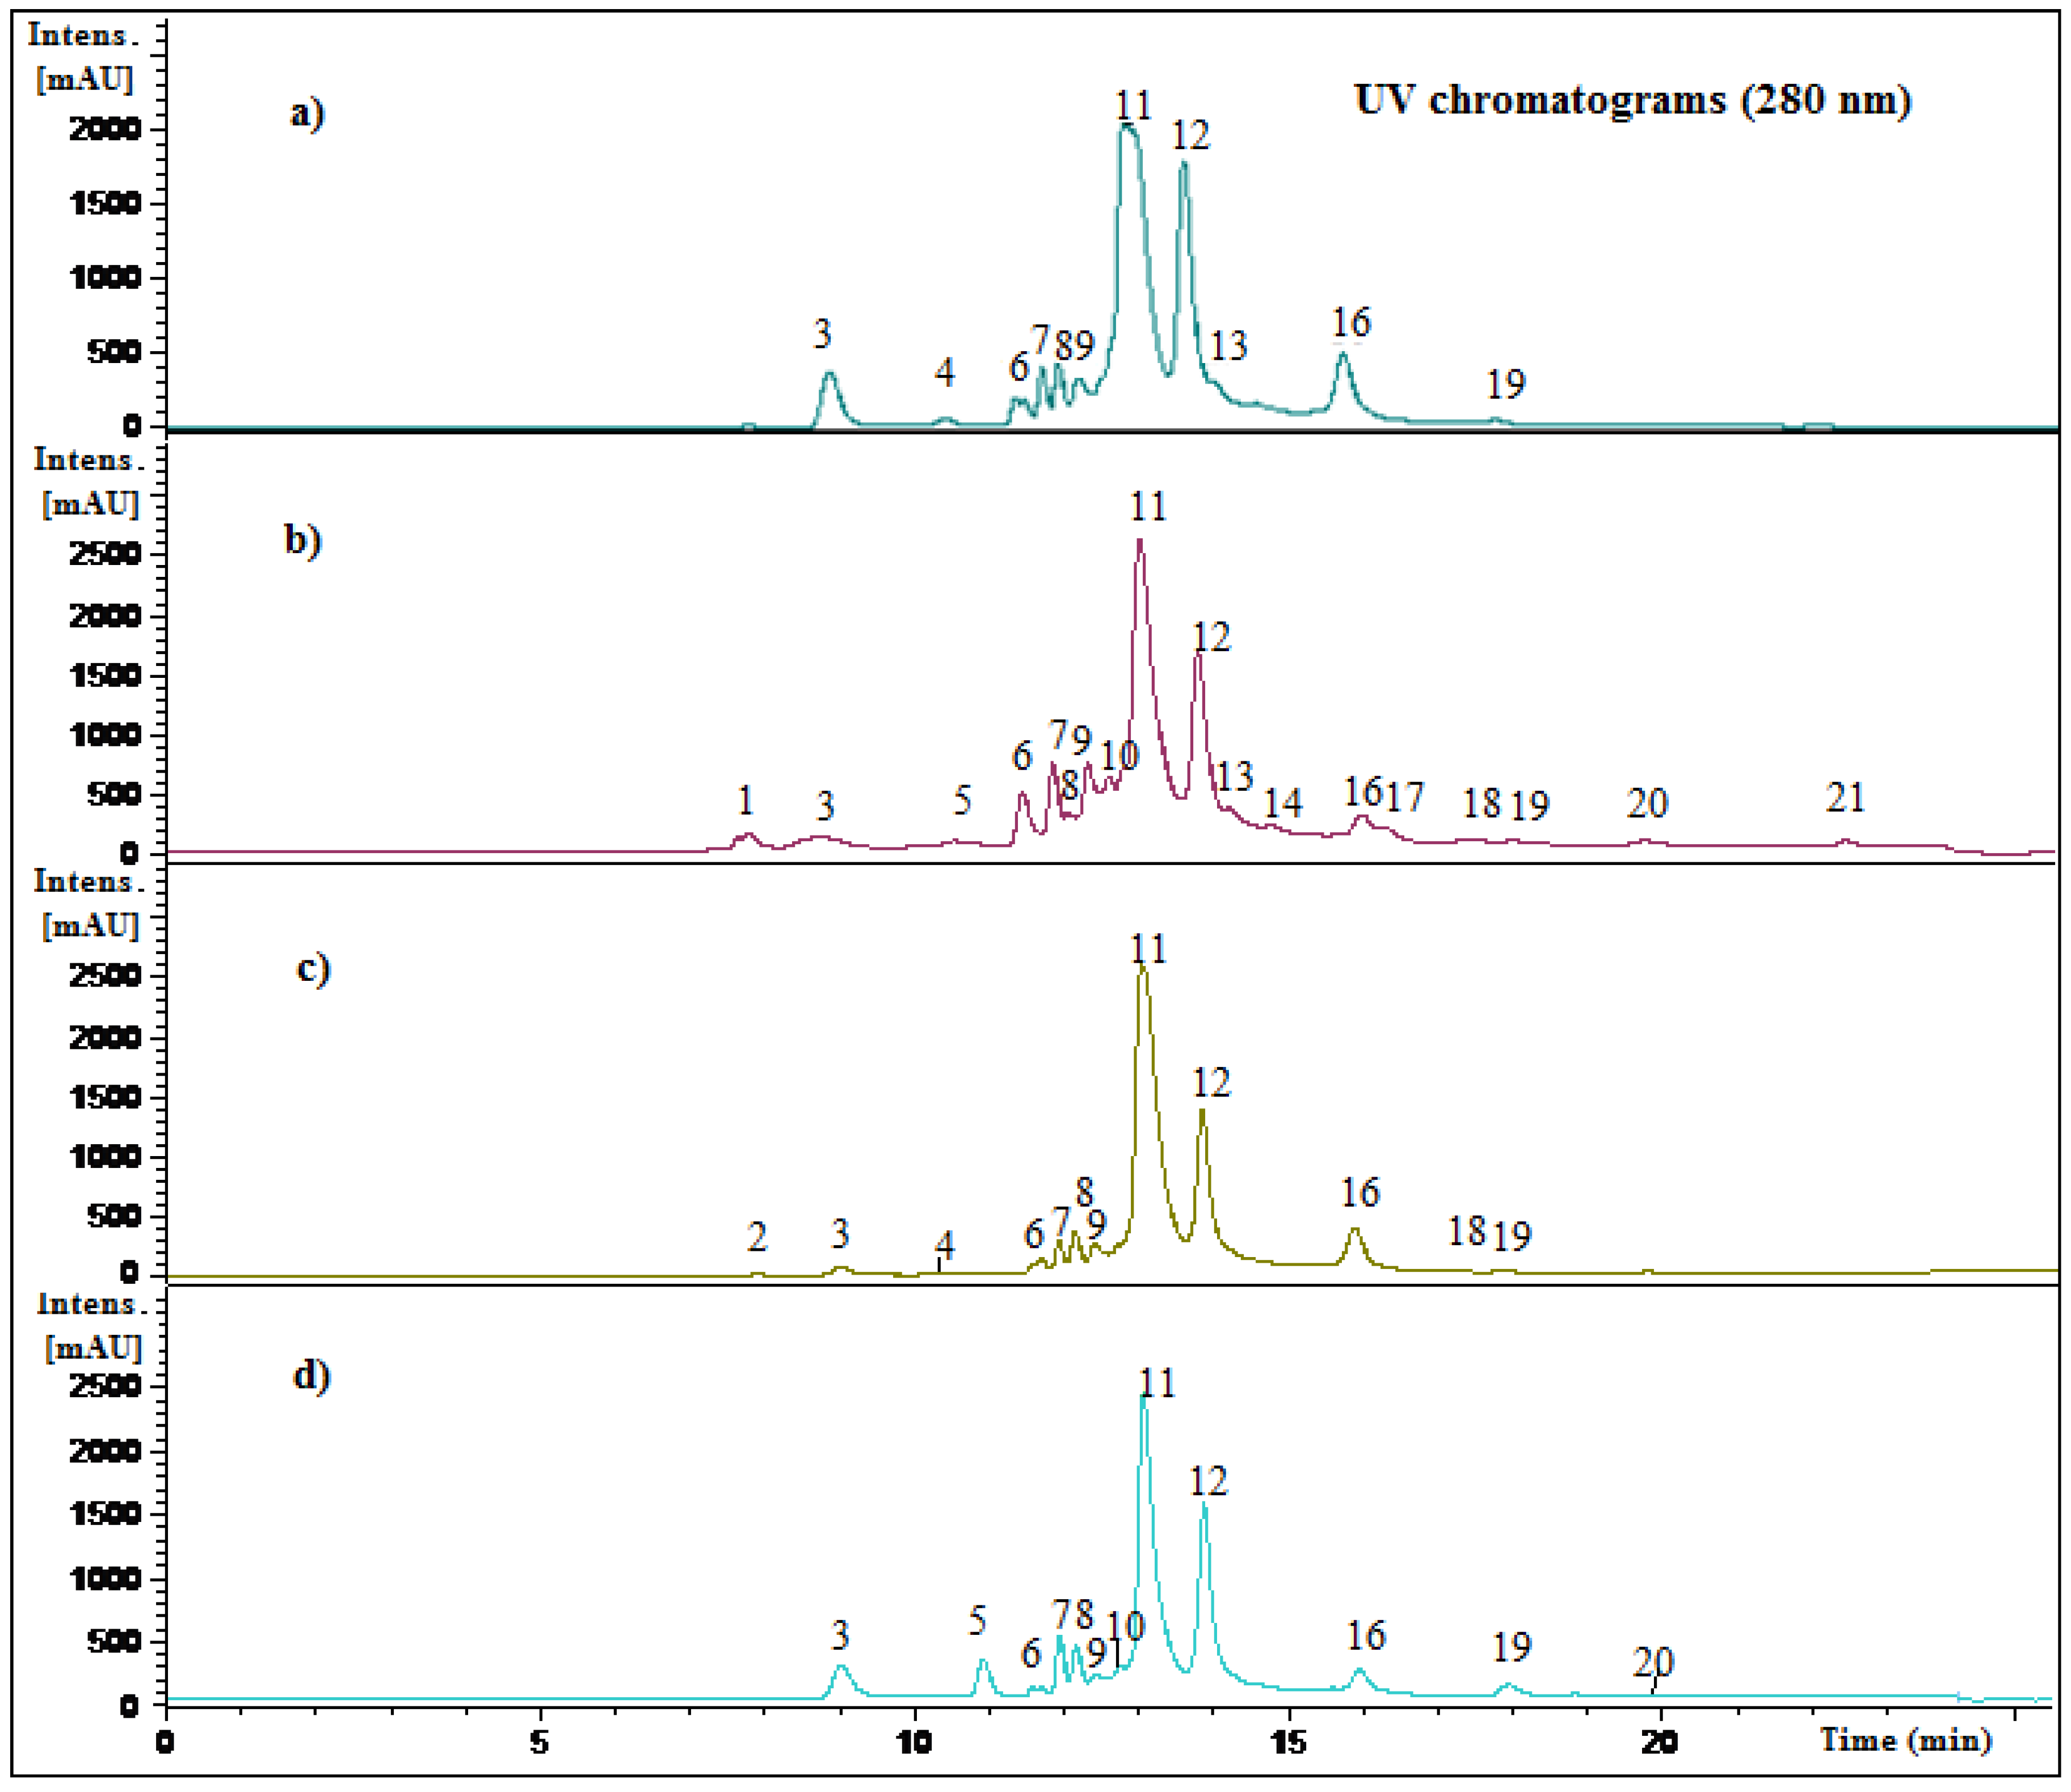
2.2. Identification of Phenolic Compounds in Mango Fruits by HPLC-DAD and ToF-ESI-MS/MS


| Peak # | Rt (min) | HPLC-DAD λ max (nm) | [M-H]− | Formula | Other MS-MS ions (m/z) | Tentative identification | Reference | Species/Fruit part |
|---|---|---|---|---|---|---|---|---|
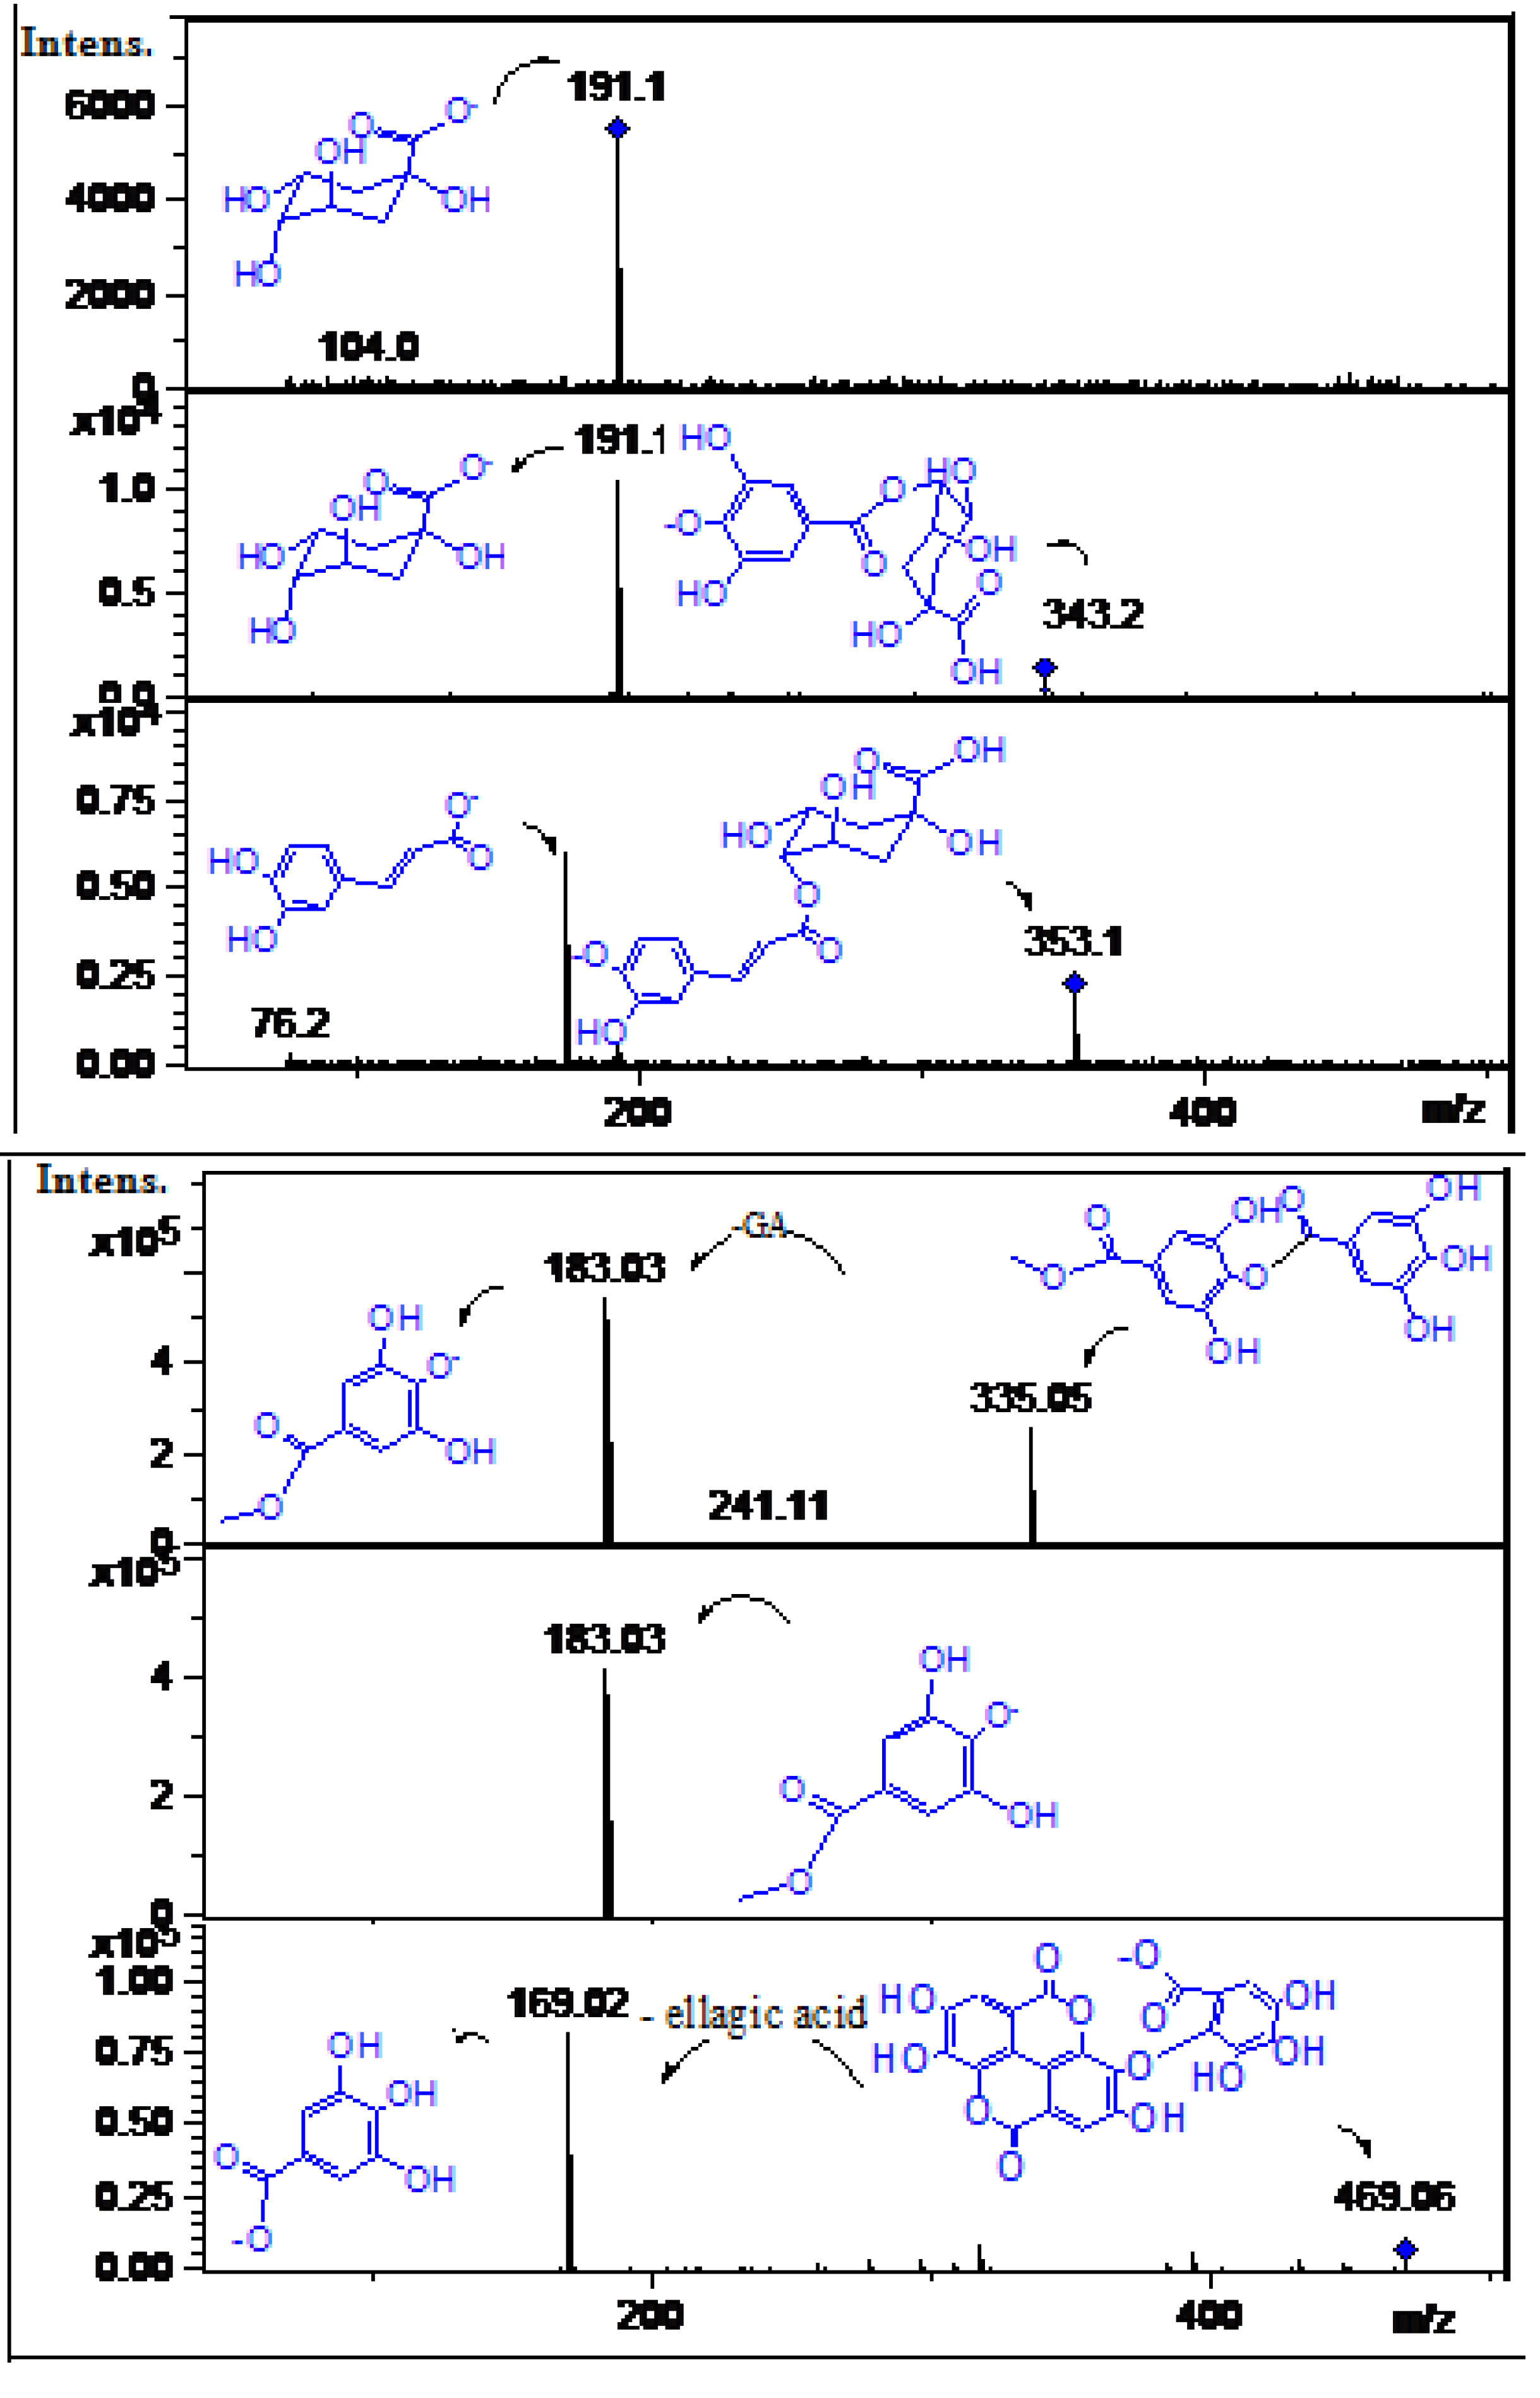
| 1 | 7.8 | 220 | 191.0 | C7H12O6 | 104.0 | Quinic acid | [22] | ppu |
| 2 | 8.0 | 273 | 335.05 | C15H12O9 | 241.11, 183.03 | Methyl-di-gallate ester | [22] | tpe |
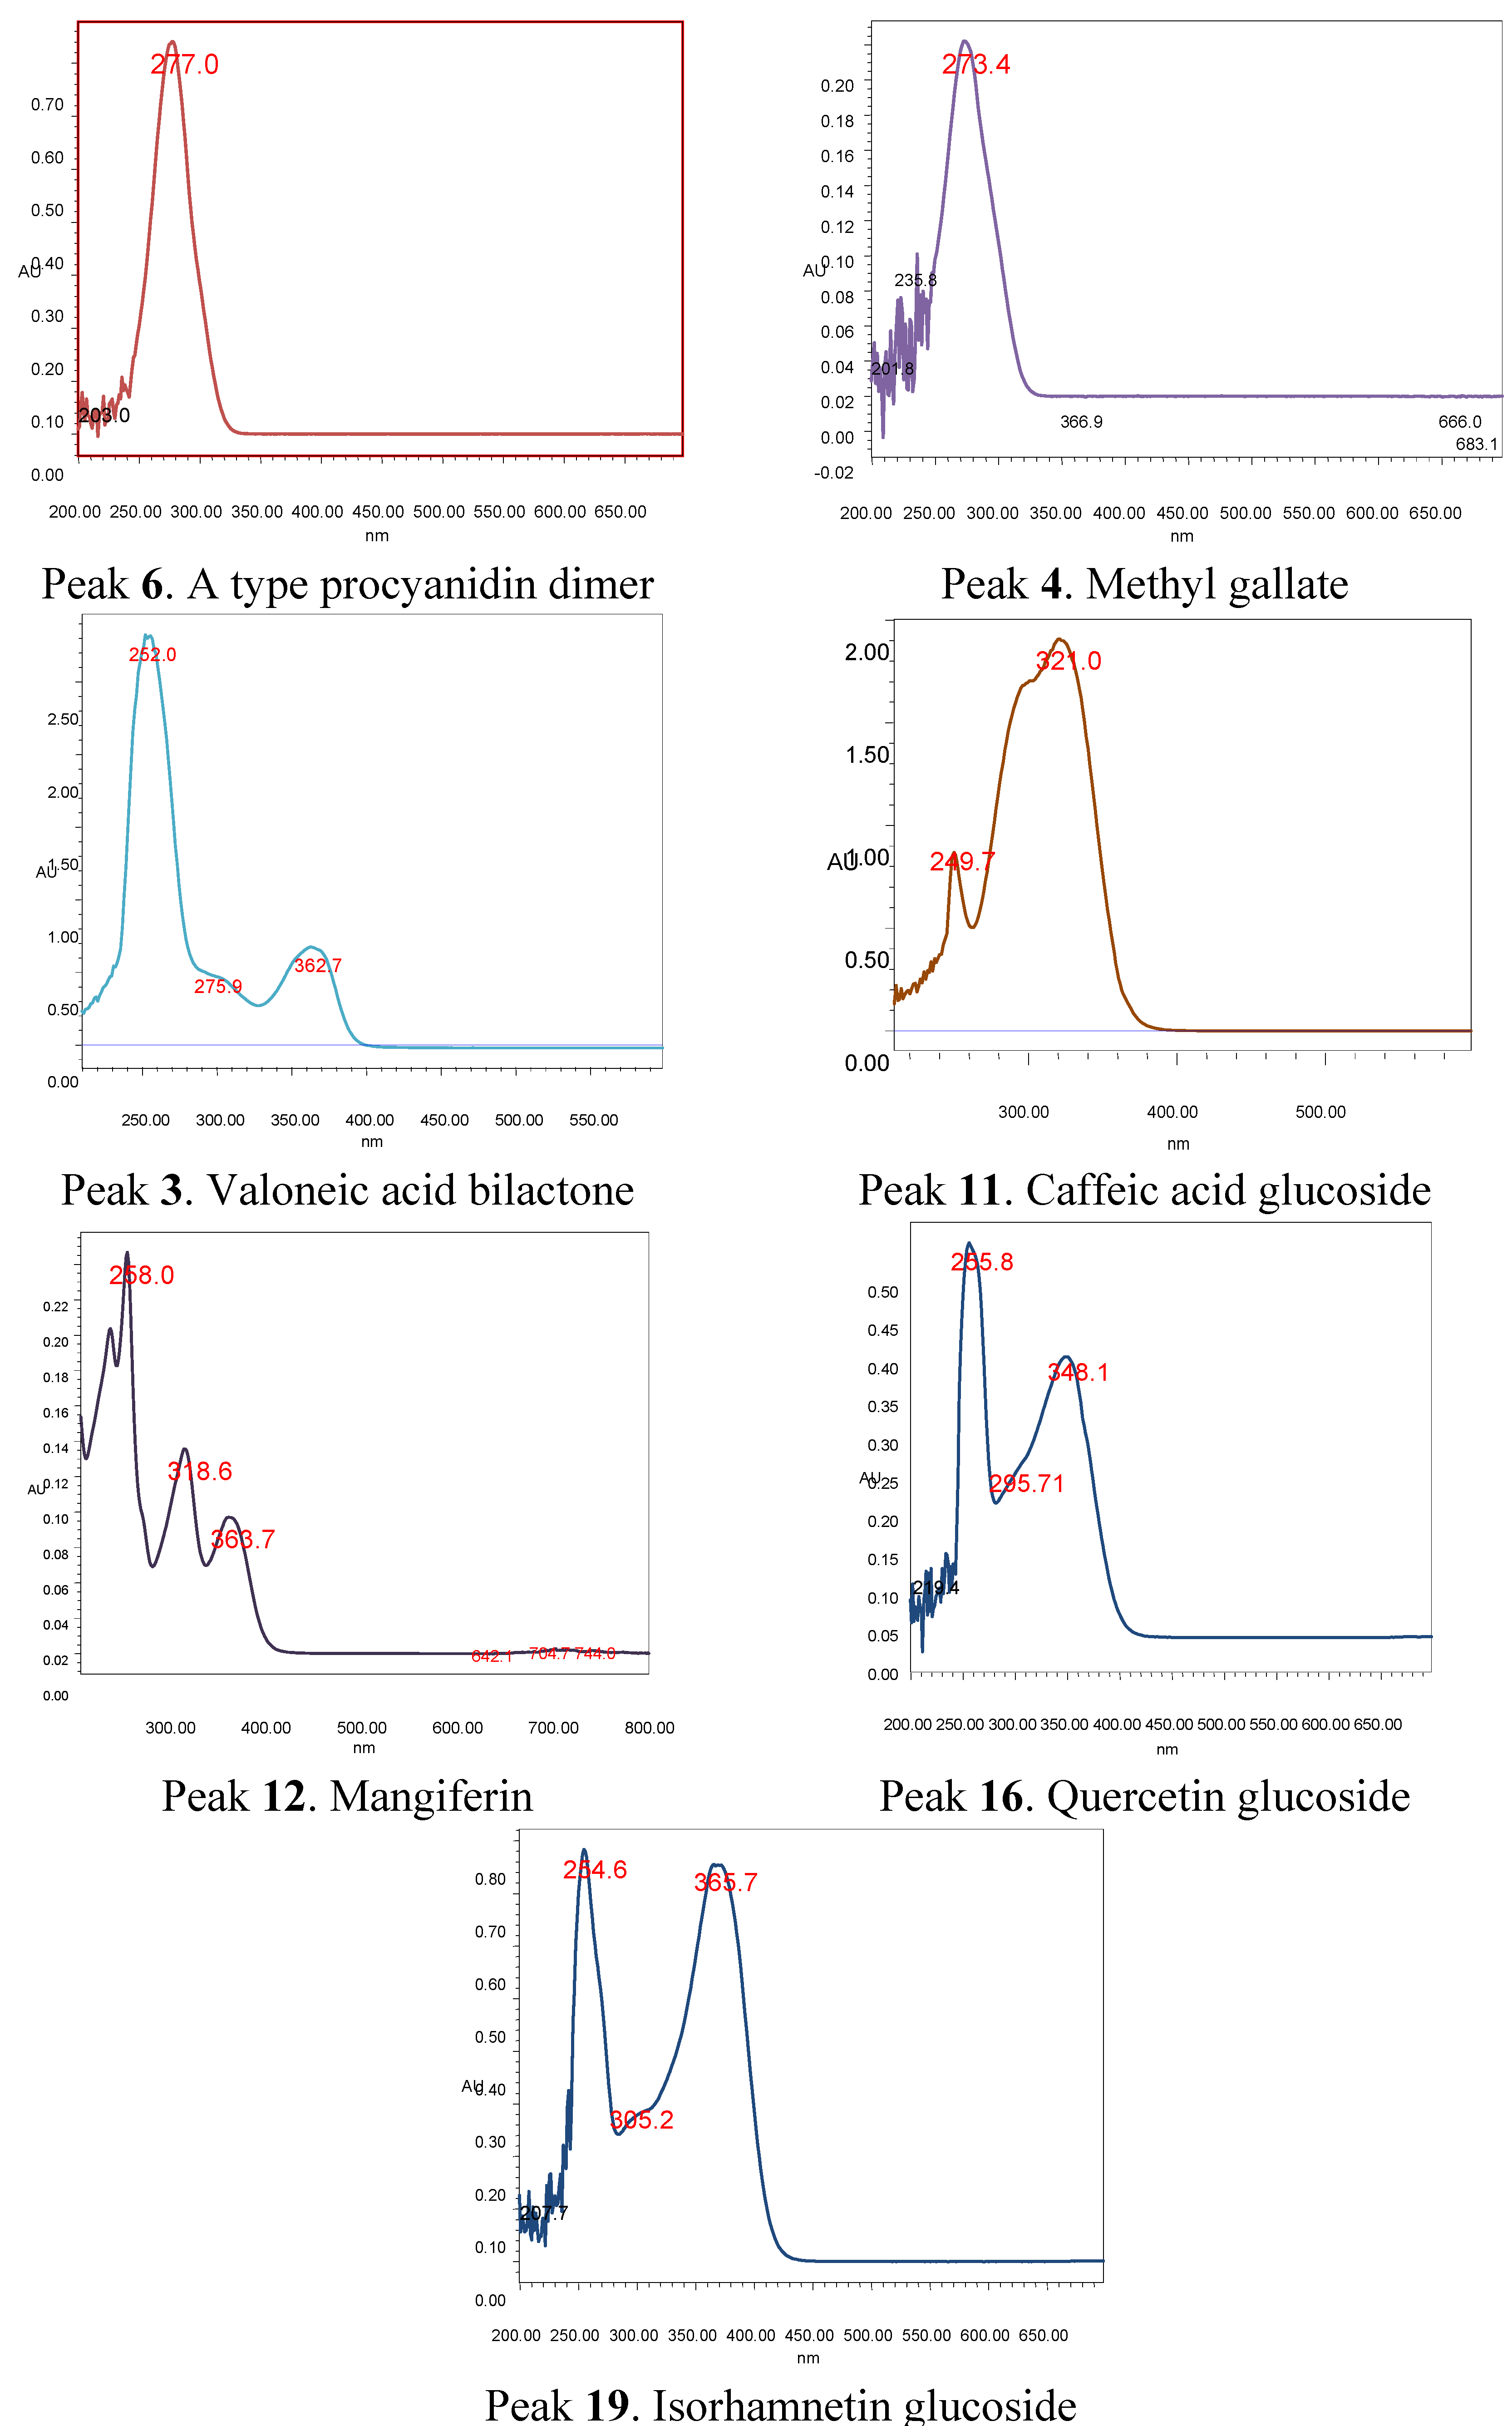
| 3 | 9.1 | 252, 275sh, 362 | 469.0 | C21H10O13 | 169.0 (gallic acid) | Valoneic acid bilactone | [23,24] | ppu, ppe tpu, tpe |
| 4 | 10.6 | 273 | 183.03 | C8H8O5 | 169.1(gallic acid) | Methyl gallate | [22] | tpu, tpe |
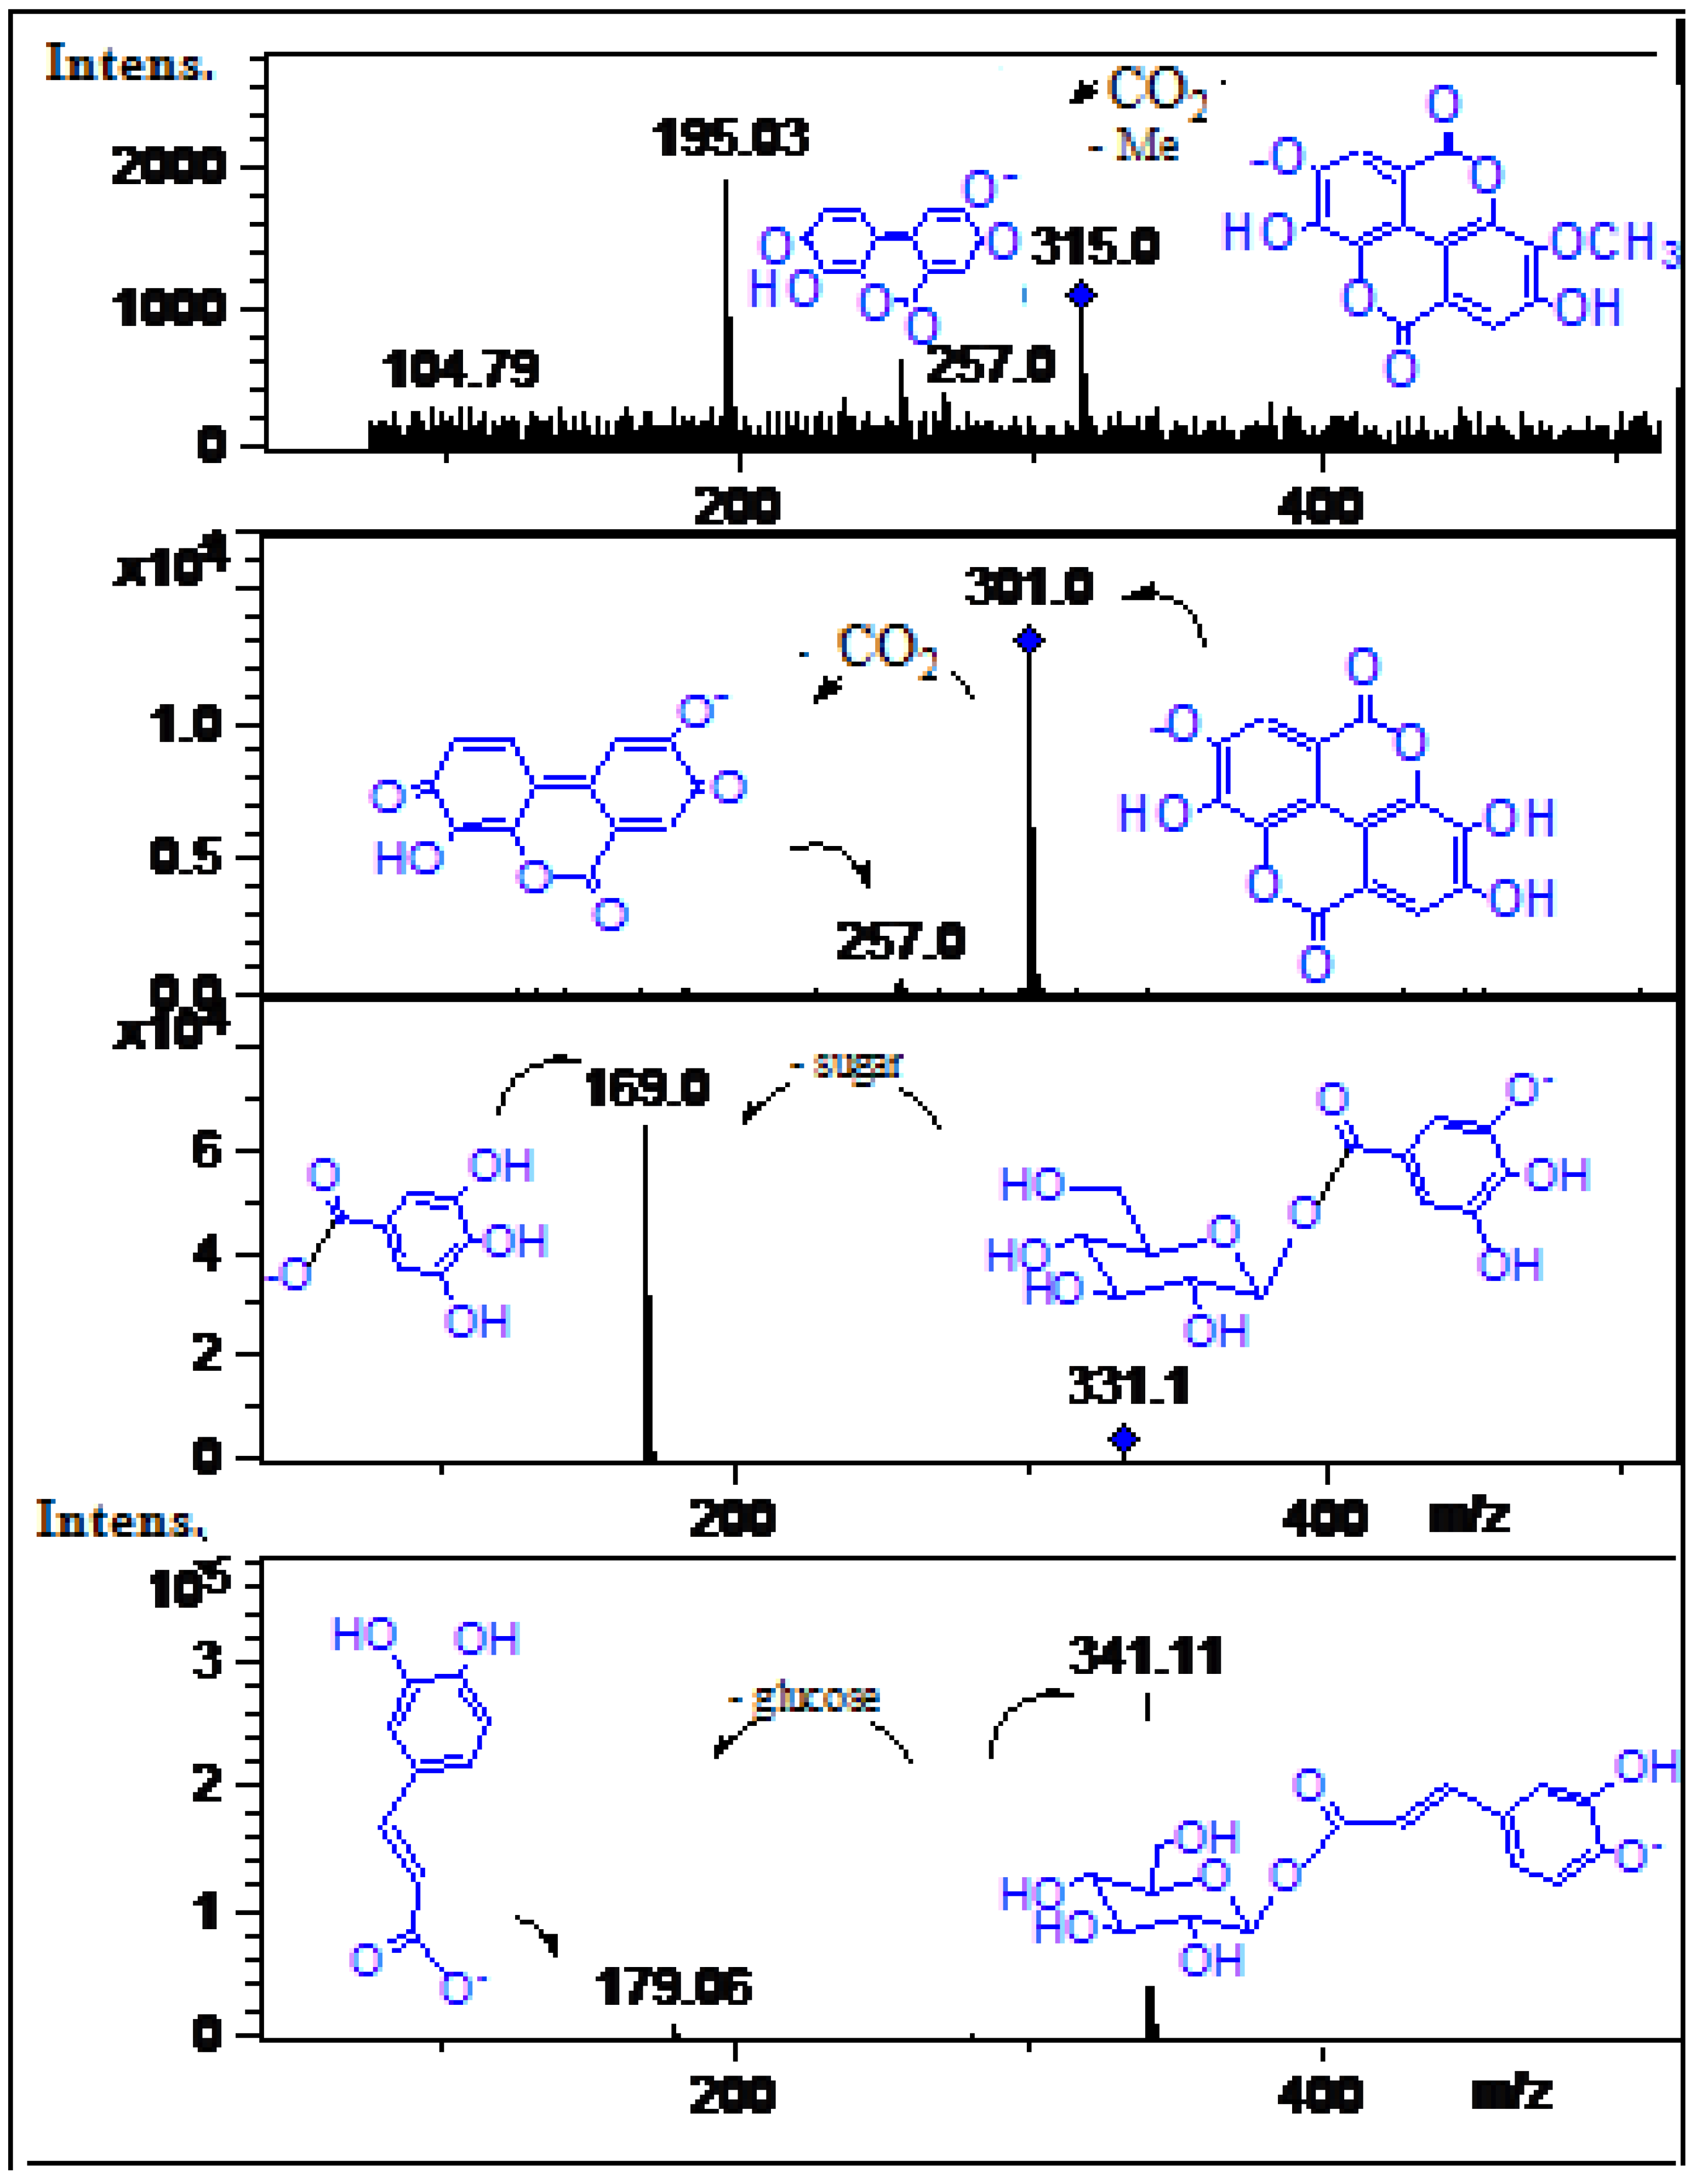
| 5 | 10.9 | 249, 321 | 353.1 | C16H18O9 | 179.0 (caffeic acid) | Caffeoyl-quinic acid | [25] | ppu, ppe |
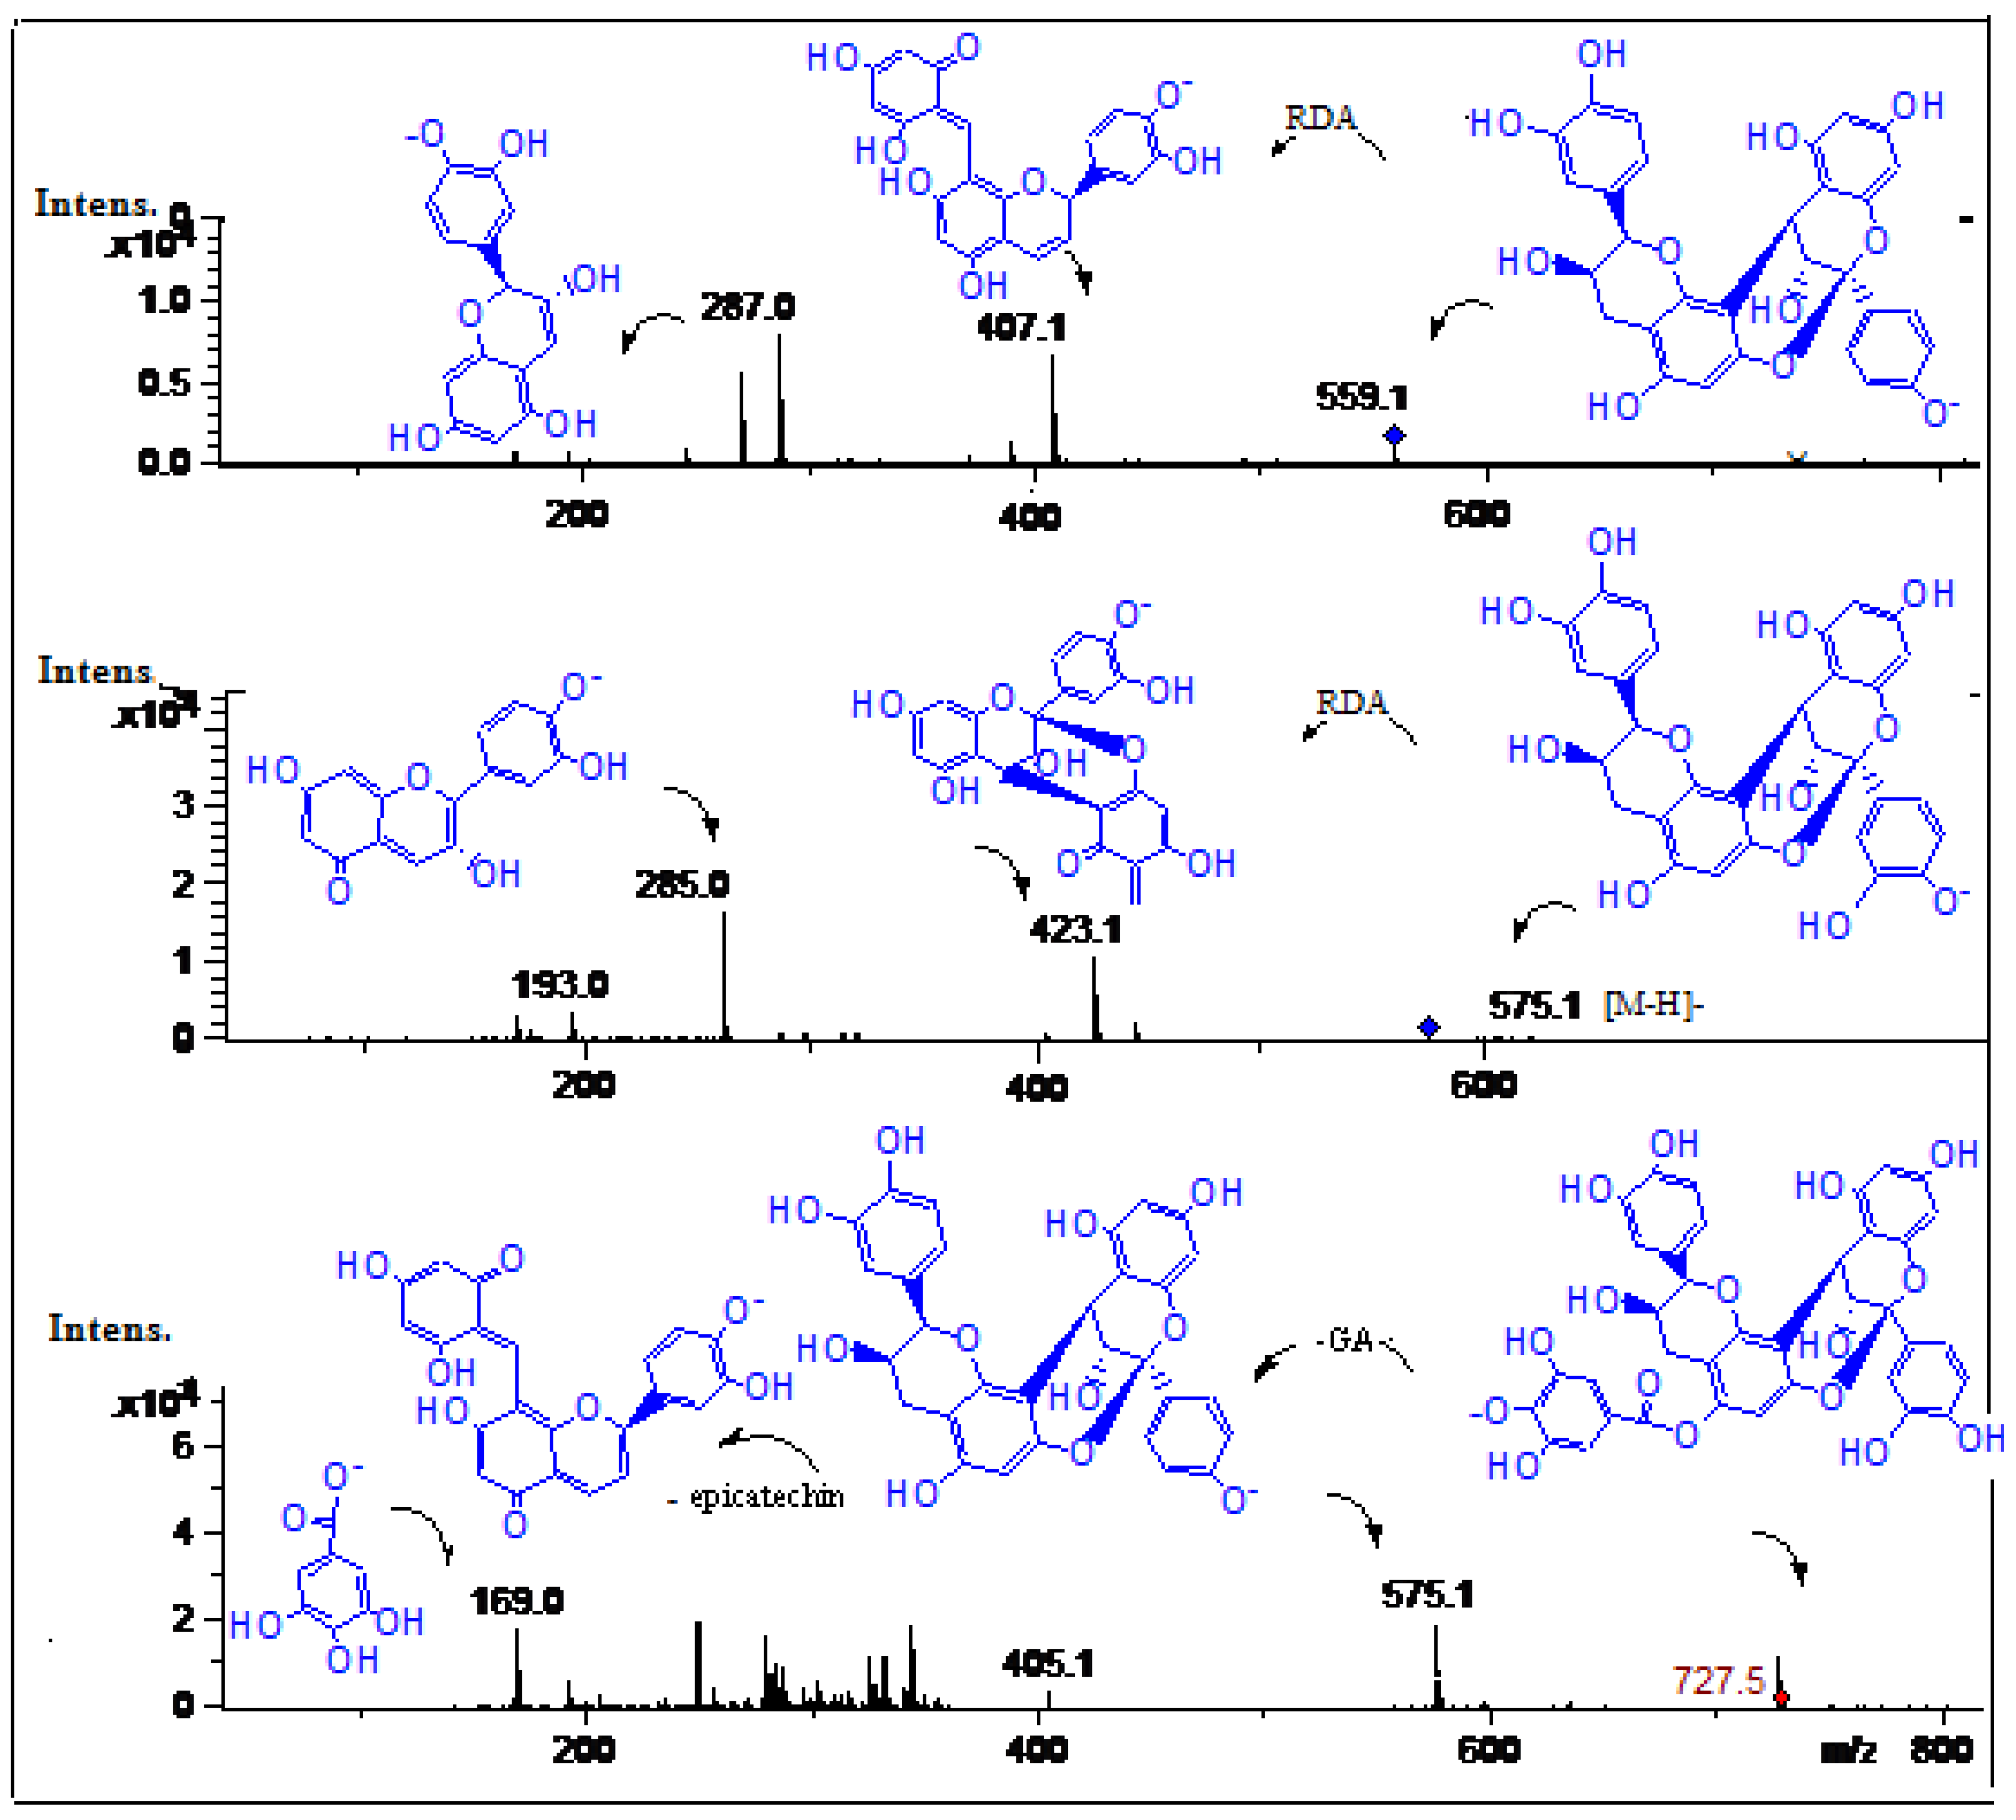
| 6 | 11.7 | 276 | 727.5 | C37H28O16 | 575.1 (procyanidin dimer), 405.1,284.0, 169.0 (gallic acid) | Galloyl-A-type procyanidin dimer | [26] | tpu, tpe ppu, ppe |
| 7 | 12.0 | 277 | 575.12 | C30H23O12 | 423.1, 285.0 (catechin), 205.1, 193.0 | A-type-procyanidin dimer | [26] | ppu, ppe tpu, tpe |
| 8 | 12.2 | 273 | 331.1 | C13H16O10 | 169.0 (gallic acid) | Galloyl glucose | [27] | ppu, ppe tpu, tpe |
| 9 | 12.5 | 277 | 559.1 | C30H23O11 | 407.1, 287.0 (catechin) | Epiafzelechin-epicatechin dimer | [28] | ppu, ppe tpu, tpe |
| 10 | 12.8 | 278, 319, 364 | 573.1 | C26H22O15 | 421.1(Mangiferin), 169.0 (gallic acid) | Mangiferin gallate | [5] | ppu, ppe |
| 11 | 13.2 | 249, 321 | 341.1 | C15H18O9 | 683.6 ([2M-H]–), 179.6 (caffeic acid) | Caffeoyl-glucose | [25] | ppu, ppe tpu, tpe |
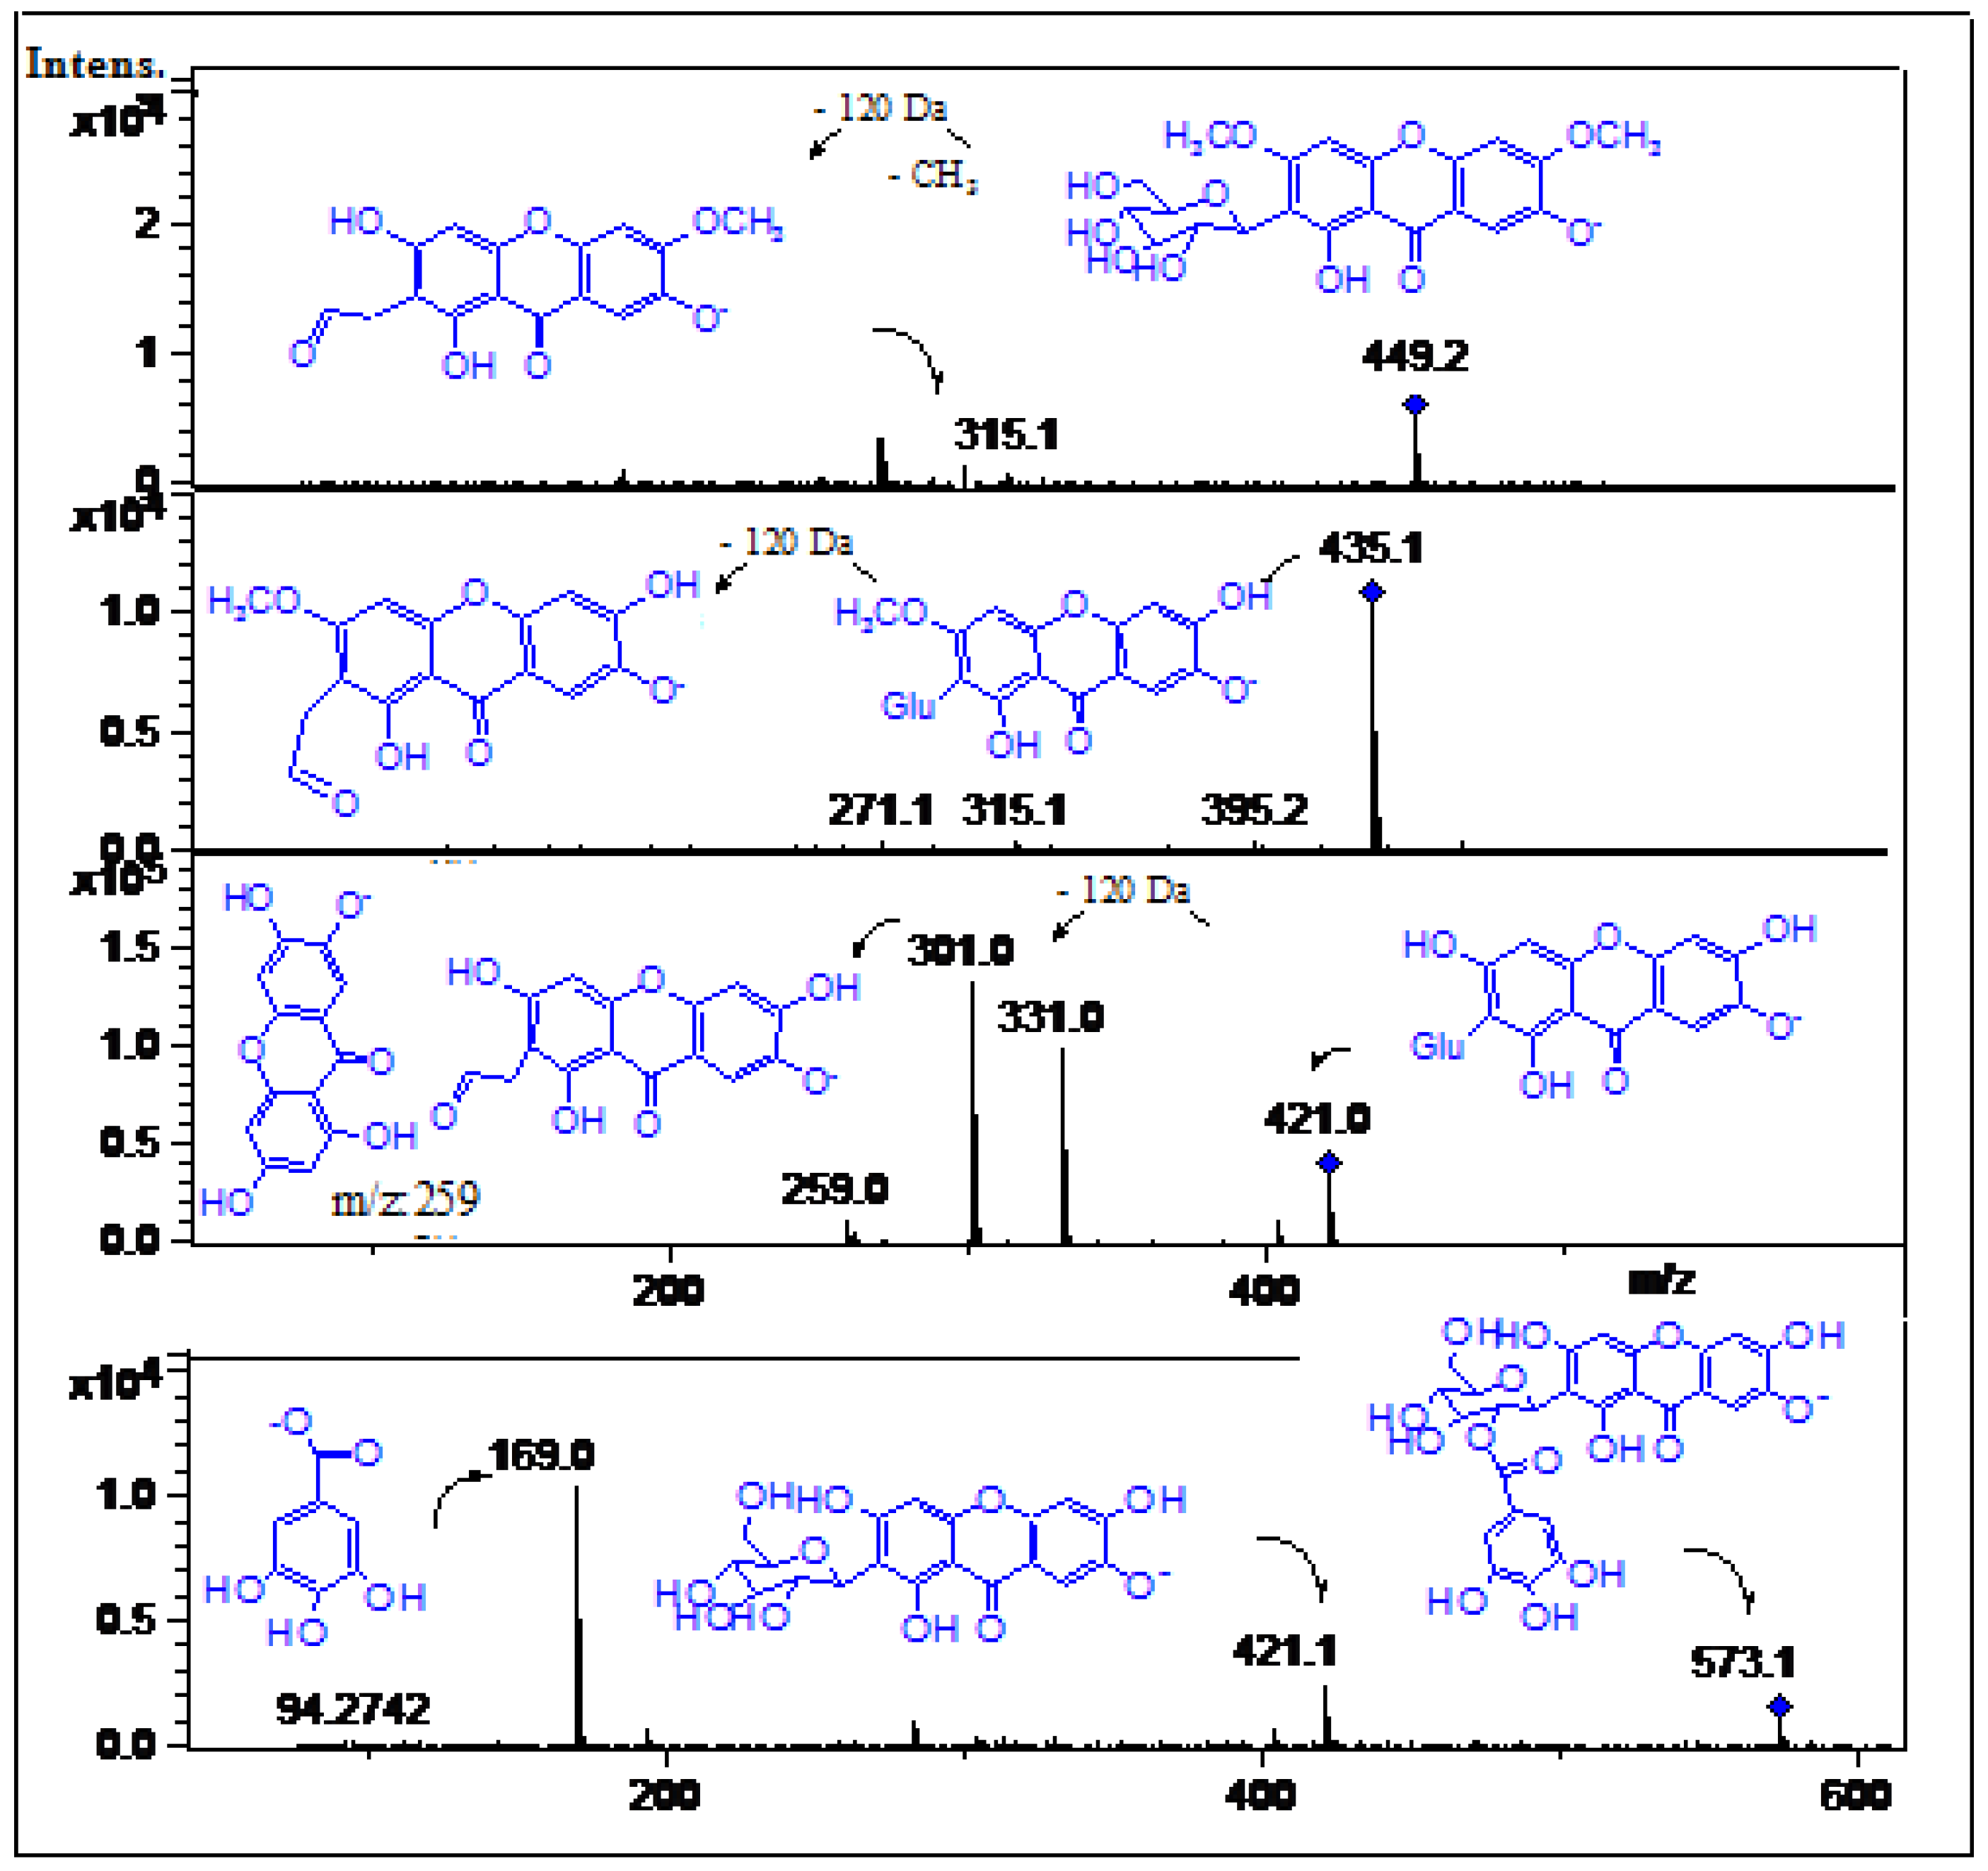
| 12 | 14.0 | 258, 319, 364 | 421.0 | C19H18O11 | 331.0 ([2M-H]−), 301.0 ([2M-H]−), | Mangiferin * | [3] | ppu, ppe tpu, tpe |
| 13 | 14.3 | 258, 319, 364 | 435.1 | C20H19O11 | 315.1([2M-H]−), 301.0, ([2M-H]–), 271.1 | Homomangiferin | [29] | tpu, ppu |
| 14 | 15.1 | 258, 319, 364 | 449.2 | C21H22O11 | 315.1([2M-H]−), 301.0([2M-H]−) | Dimethylmangiferin | [30] | ppu |
| 15 | 15.6 | 273 | 343.2 | C14H16O10 | 191.1 (quinic acid) | Galloyl-quinic acid | [22] | ppe |
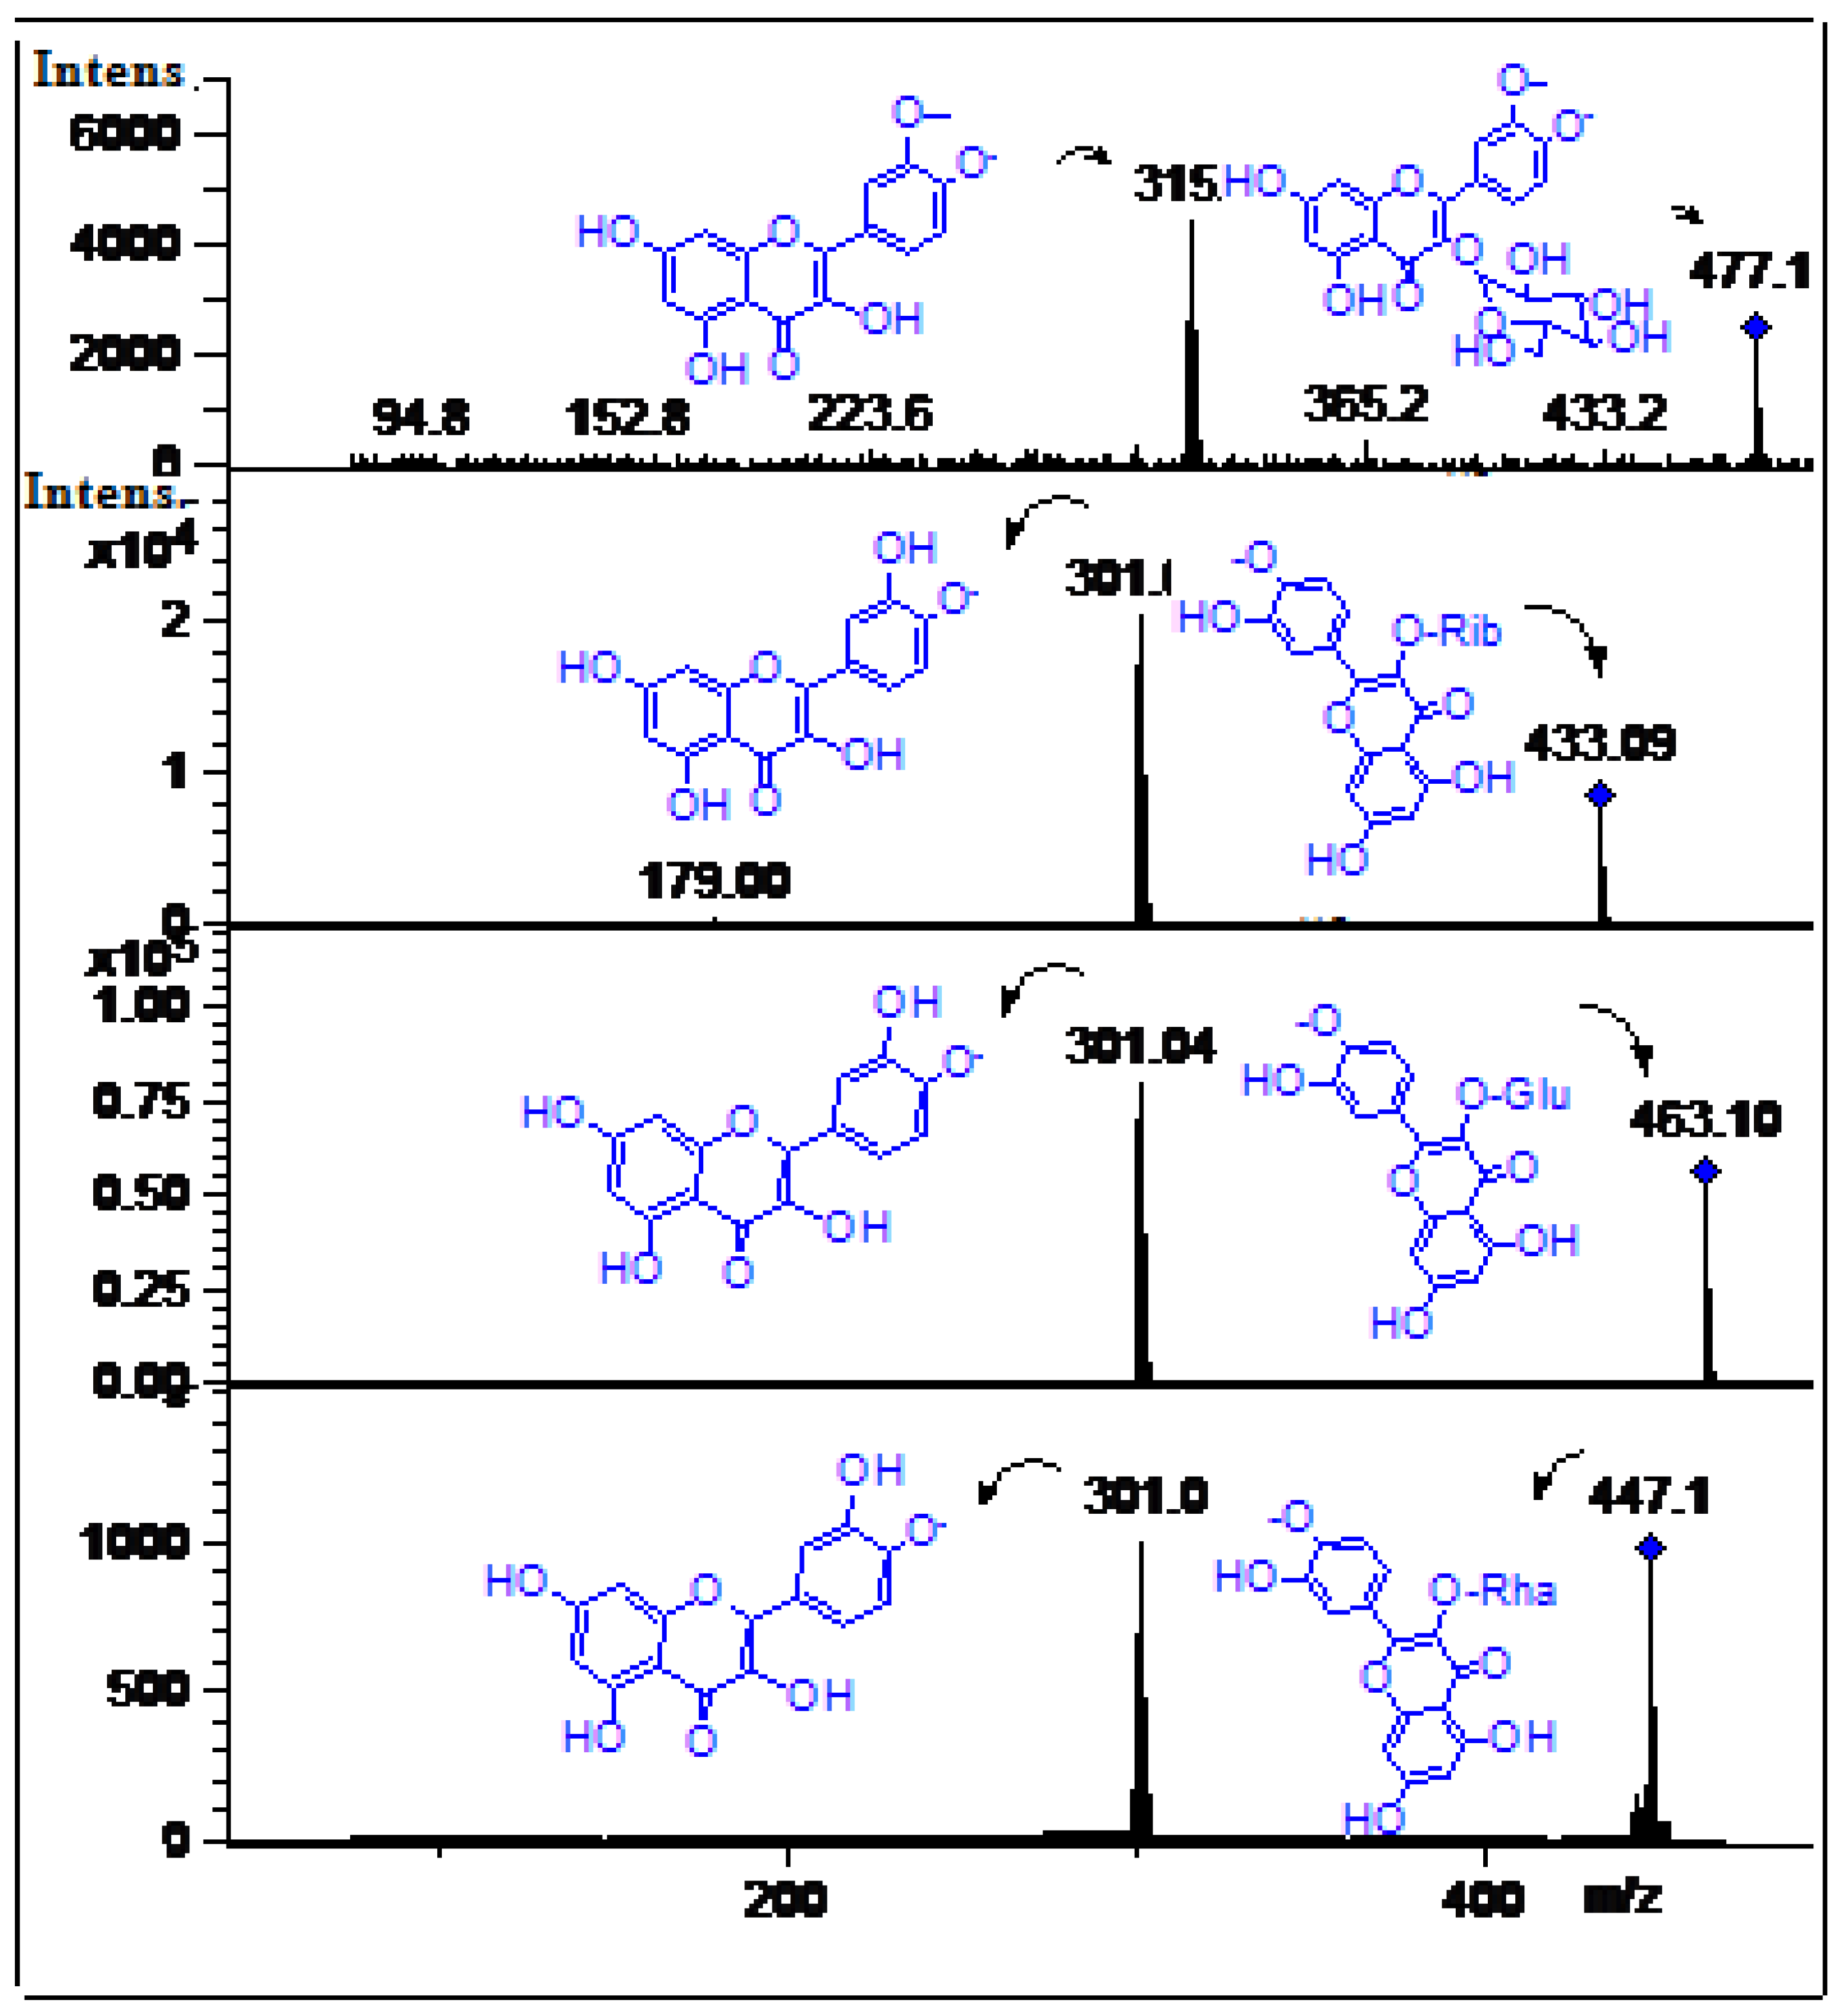
| 16 | 16.0 | 255, 350 | 463.1 | C21H20O12 | 301.04(quercetin), 179.0, 151.0 | Quercetin-3-O-glucose * | [6] | ppu, ppe tpu, tpe |
| 17 | 16.5 | 254, 290 sh, 351 | 447.1 | C21H20O11 | 301.0 (quercetin), 179.0, 151.0 | Quercetin-3-O-rhamnose | [6] | ppu |
| 18 | 17.7 | 255, 293sh, 354 | 433.09 | C20H17O11 | 301.04(quercetin), 179.0, 151.0 | Quercetin-3-O-pentose | [3] | tpe, ppu |
| 19 | 18.0 | 254, 300sh, 365 | 477.1 | C22H22O12 | 315.1(Isorhamnetin), 300.1 | Isorhamnetin-3-O-glucose * | [3] | ppu, ppe tpu, tpe |
| 20 | 19.8 | 252, 362 | 315.0 | C15H8O8 | 257.0, 195.03 | Methyl-ellagic acid | [31] | ppu, ppe |
| 21 | 22.5 | 252, 362 | 301.0 | C14H6O8 | 257.0 | Ellagic acid * | [5] | ppu |
2.2.1. Xanthones

2.2.2. Phenolic Acids, tannins and their Derivatives and/or Related Compounds

2.2.3. Flavonoids

2.2.4. Procyanidins
2.3. Quantification of Phenolic Compounds
| Compound # (mg/100 g) a | ppe | tpe | ppu | tpu | LOD-LOQ (ng/mL) | Recovery (mean ± RSD%) |
|---|---|---|---|---|---|---|
| 3 | 0.52 ± 0.01 | 0.082 ± 0.00 | 0.12 ± 0.00 | 0.34 ± 0.01 | nd | nd |
| 5 | 0.83 ± 0.02 | nd | 0.02 ± 0.00 | nd | nd | nd |
| 7 | 2.87 ± 0.01 | 1.34 ± 0.00 | 1.97 ± 0.01 | 0.86 ± 0.45 | nd | nd |
| 8 | 3.76 ± 0.02 | 2.06 ± 0.01 | 1.44 ± 0.01 | 1.34 ± 0.02 | nd | nd |
| 10 | 0.91 ± 0.00 | nd | 2.35 ± 0.03 | nd | nd | nd |
| 11 | 34.13 ± 1.77 | 25.05 ± 1.67 | 14.90 ± 1.72 | 19.18 ± 1.12 | nd | nd |
| 12 | 22.15 ± 1.14 | 9.68 ± 0.64 | 4.24 ± 0.10 | 3.25 ± 0.1 | 12.3–41.6 | 99.52 ± 1.71 |
| 13 | nd | nd | 1.96 ± 0.01 | 1.71 ± 0.02 | nd | nd |
| 14 | nd | nd | 0.65 ± 0.01 | nd | nd | nd |
| 15 | 0.09 ± 0.00 | nd | nd | nd | nd | nd |
| 16 | 0.43 ± 0.02 | 3.12 ± 0.10 | 1.70 ± 0.04 | 2.66 ± 0.08 | 26.8–88.65 | 96.52 ± 0.99 |
| 17 | nd | nd | 0.42 ± 0.00 | nd | nd | nd |
| 18 | nd | 0.37 ± 0.00 | 0.052 ± 0.00 | nd | nd | nd |
| 19 | 0.30 ± 0.04a | 0.24 ± 0.02a | 0.027 ± 0.00b | 0.031 ± 0.00b | 23.37–73.4 | 102.48 ± 1.65 |
| 20 | 0.036 ± 0.00 | nd | 0.018 ± 0.00 | nd | nd | nd |
| 21 | nd | nd | 0.031 ± 0.00 | nd | 14.46-45.27 | 103.82 ± 1.24 |
| Total | 66.02 | 41.94 | 29.89 | 29.37 | nd | nd |
3. Experimental
3.1. General
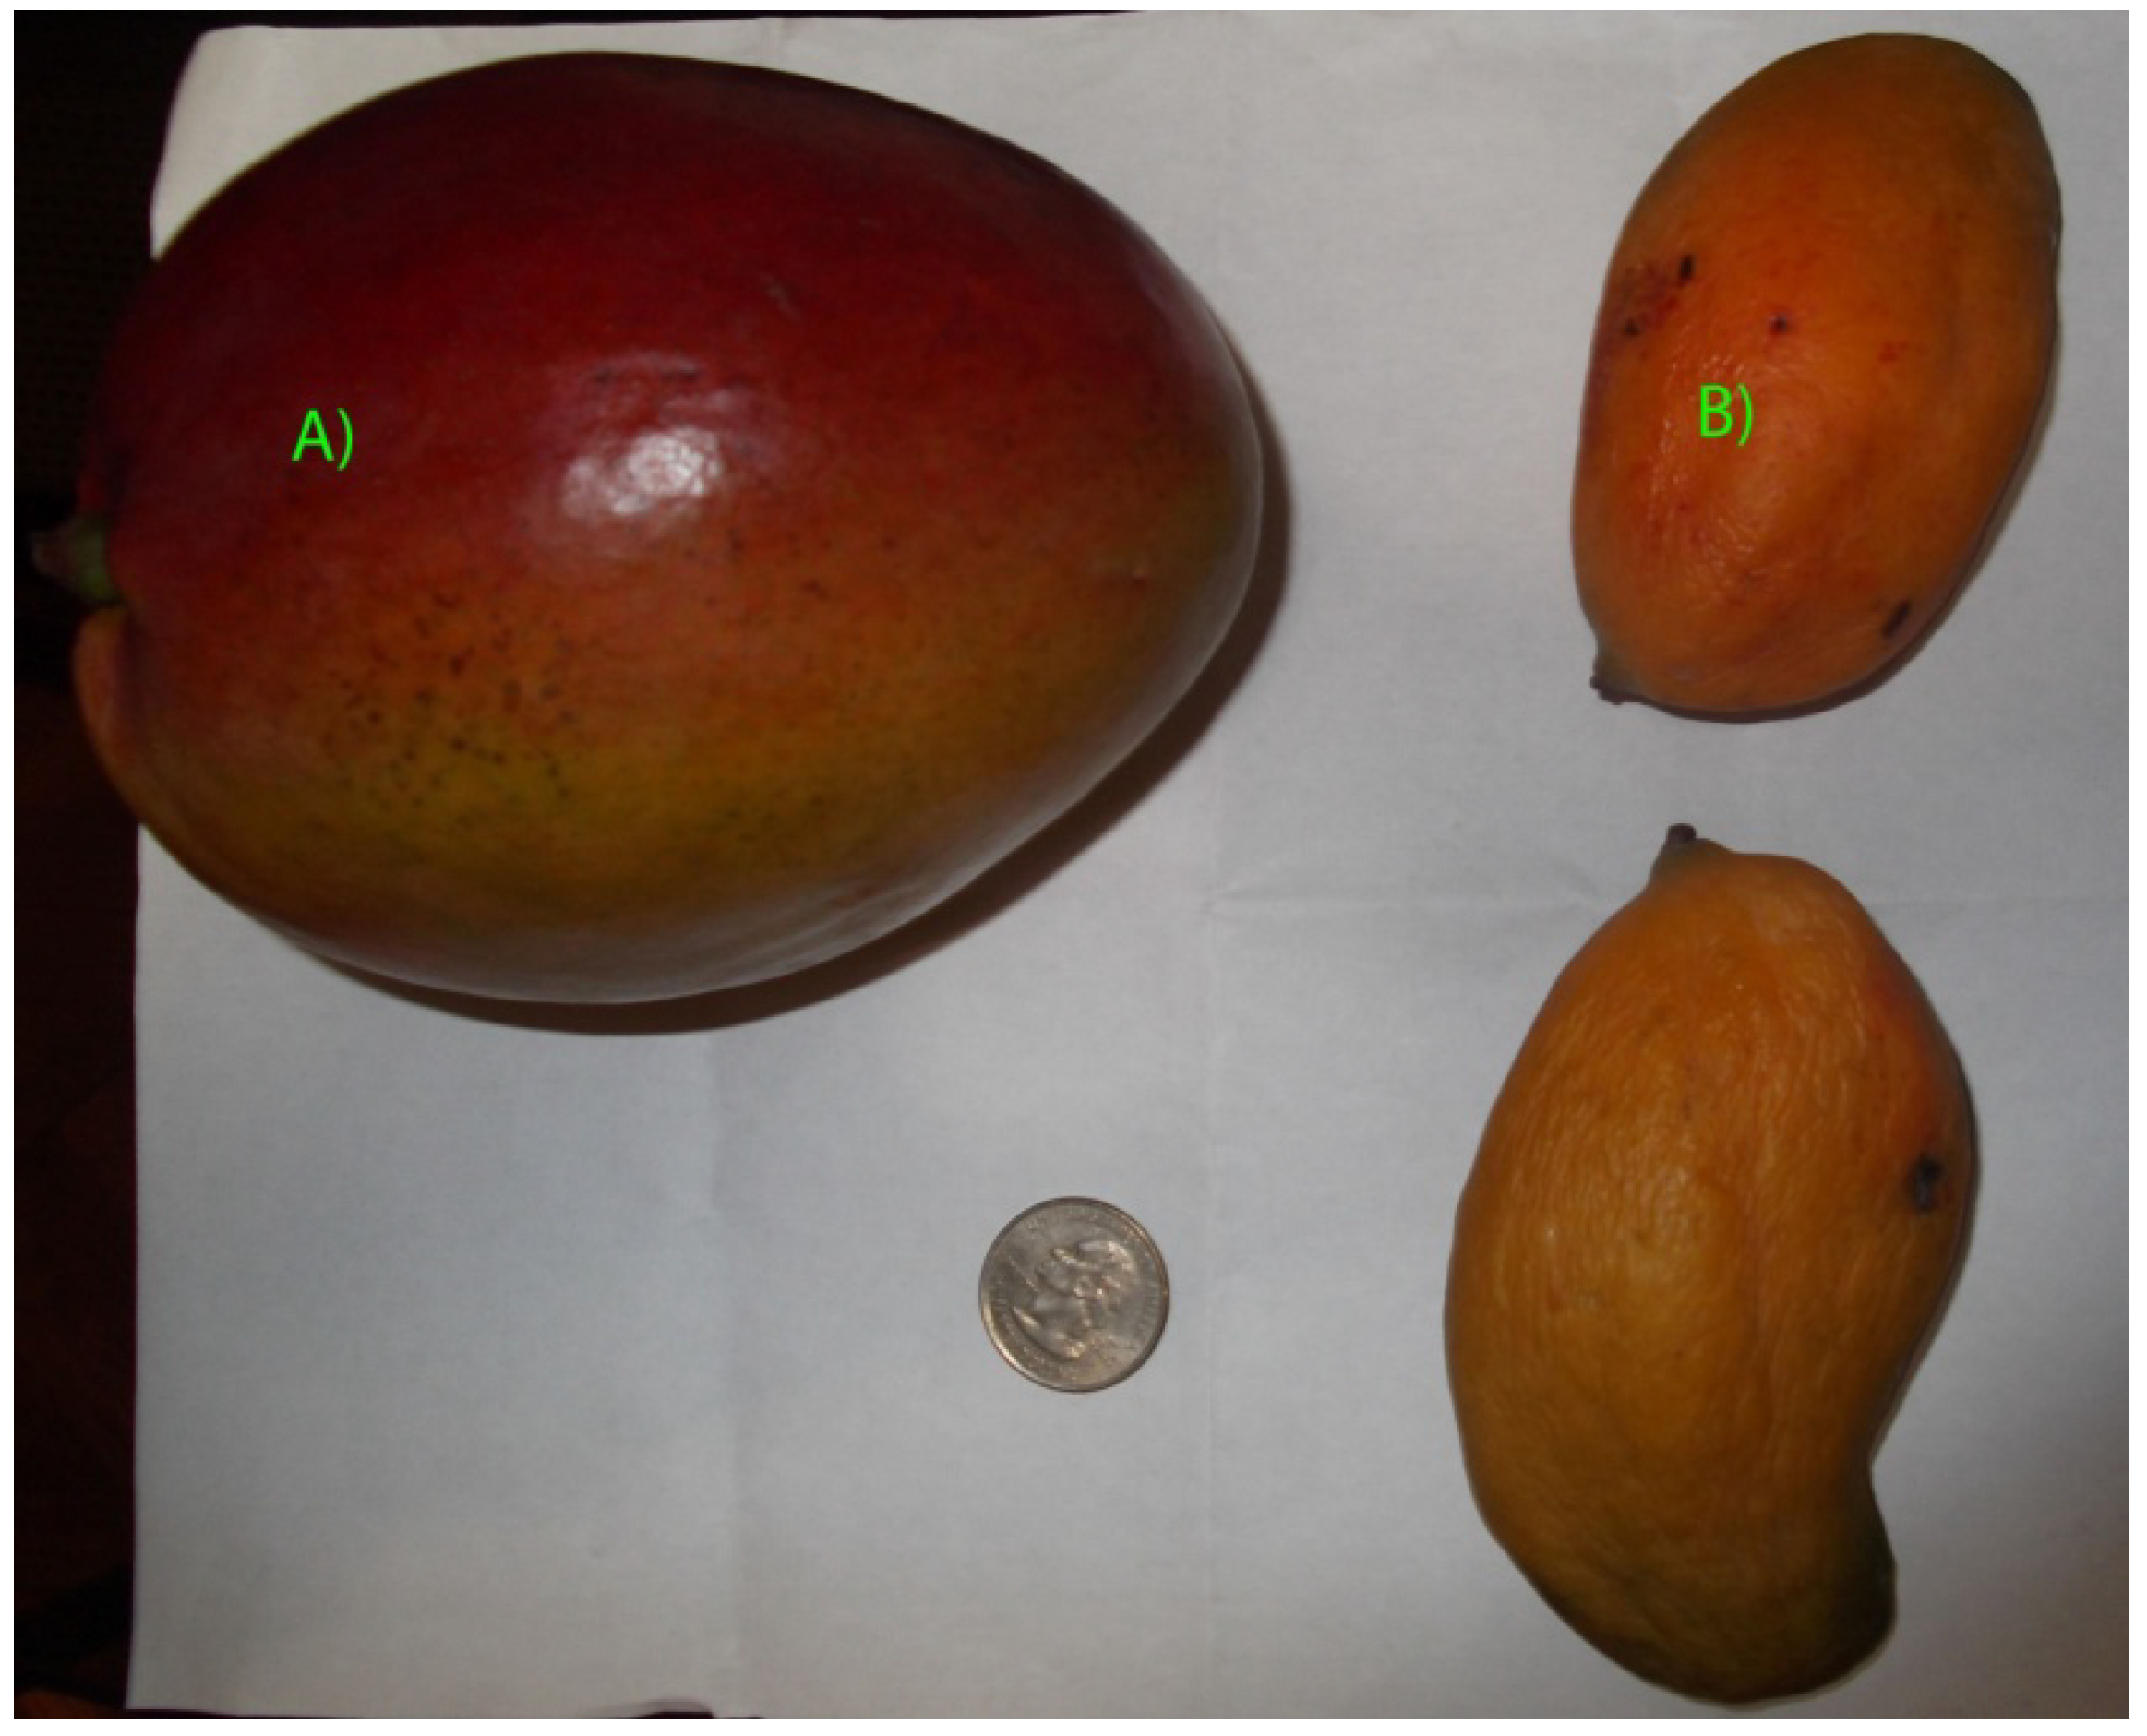
3.2. Mango Cultivars
3.3. Preparative Procedures
3.4. HPLC DAD and HR-ESI-ToF-MS Conditions
3.5. Polyphenolic Content
3.6. Antioxidant Assessment
3.6.1. Bleaching of the 2,2-Diphenyl-1-picrylhydrazyl (DPPH) Radical Assay

3.6.2. Ferric Reducing Antioxidant Power (FRAP) Assay
3.7. Quantitative Analysis
3.8. Method Validation
3.9. Statistical Analysis
4. Conclusions
Acknowledgments
Conflicts of Interest
References
- FAOSTAT database collections. Organization of agricultural data, food and agriculture. Available online: http://faostat.fao.org/ (accessed on 21 december 2013).
- Spencer, J.L.; Morris, M.P.; Kennard, W.C. Vitamin C concentration in developing and mature fruits of Mango (Mangifera indica L.). Plant Physiol. 1956, 31, 79–80. [Google Scholar] [CrossRef]
- Schieber, A.; Berardini, N.; Carle, R. Identification of flavonol and xanthone glycosides from Mango (Mangifera indica L. Cv. “Tommy Atkins”) peels by high-performance liquid chromatography-electrospray ionization mass spectrometry. J. Agric. Food Chem. 2003, 51, 5006–5011. [Google Scholar] [CrossRef]
- Varakumar, S.; Sudheer Kumar, Y.; Reddy, O.V.S. Carotenoid composition of mango (Mangifera indica L.) wine and its antioxidant activity. J. Food Biochem. 2011, 35, 1538–1547. [Google Scholar] [CrossRef]
- Barreto, J.C.; Trevisan, M.T.S.; Hull, W.E.; Erben, G.; de Brito, E.S.; Pfundstein, B.; Würtele, G.; Spiegelhalder, B.; Owen, R.W. Characterization and quantitation of polyphenolic compounds in bark, kernel, leaves, and peel of mango (Mangifera indica L.). J. Agric. Food Chem. 2008, 56, 5599–5610. [Google Scholar] [CrossRef]
- Ribeiro, S.M.R.; Barbosa, L.C.A.; Queiroz, J.H.; Knodler, M.; Schieber, A. Phenolic compounds and antioxidant capacity of Brazilian mango (Mangifera indica L.) varieties. Food Chem. 2008, 110, 620–626. [Google Scholar] [CrossRef]
- Palafox-Carlos, H.; Yahia, E.M.; González-Aguilar, G.A. Identification and quantification of major phenolic compounds from mango (Mangifera indica, cv. Ataulfo) fruit by HPLC-DAD-MS/MS-ESI and their individual contribution to the antioxidant activity during ripening. Food Chem 2012, 135, 105–111. [Google Scholar] [CrossRef]
- Elzaawely, A.A.; Tawata, S. Preliminary phytochemical investigation of Mango (Mangifera indica L.) leaves. World J. Agric. Sci. 2010, 6, 735–739. [Google Scholar]
- Jiang, L.Y.; He, S.; Pan, Y.J.; Sun, C.R. Bioassay-guided isolation and EPR-assisted antioxidant evaluation of two valuable compounds from mango peels. Food Chem. 2010, 119, 1285–1292. [Google Scholar] [CrossRef]
- Sáyago-Ayerdi, S.G.; Moreno-Hernández, C.L.; Montalvo-González, E.; García-Magaña, M.L.; Mata-Montes de Oca, M.; Lluís Torres, J.; Pérez-Jiménez, J. Mexican “Ataulfo” mango (Mangifera indica L.) as a source of hydrolyzable tannins. Analysis by MALDI-TOF/TOF MS. Food Res. Int. 2013, 51, 188–194. [Google Scholar] [CrossRef]
- Ribeiro, S.M.R.; Schieber, A. Bioactive compounds in Mango (Mangifera indica L.). In Bioactive Foods in Promoting Health; Ronald Ross, W., Victor, R.P., Eds.; Academic Press: San Diego, CA, USA, 2010; pp. 507–523. [Google Scholar]
- Fernández-Ponce, M.T.; Casas, L.; Mantell, C.; Rodríguez, M.; Martínez de la Ossa, E. Extraction of antioxidant compounds from different varieties of Mangifera indica leaves using green technologies. J. Supercrit. Fluids 2012, 72, 168–175. [Google Scholar] [CrossRef]
- Ajila, C.M.; Prasada Rao, U.J.S. Mango peel dietary fibre: Composition and associated bound phenolics. J. Funct. Foods 2013, 5, 444–450. [Google Scholar] [CrossRef]
- Benites Vílchez, J.; López Vivar, J.; Kusch Fuschlocher, F.; Gajardo Solari, S.; Jonquera Arancibia, G.; Salazar Rodríguez, G.; Rojas Arredondo, M. Antioxidant, antibacterial and analgesic activities of Mangifera indica L. pica variety extracts. Biofarbo 2010, 18, 10–19. [Google Scholar]
- Beerh, O.P.; Raghuramaiah, B.; Krishnamurthy, G.V.; Giridhar, N. Utilization of mango waste: Recovery of juice from waste pulp and peel. J. Food Sci. Tech. 1976, 13, 138–141. [Google Scholar]
- Berardini, N.; Knödler, M.; Schieber, A.; Carle, R. Utilization of mango peels as a source of pectin and polyphenolics. Inn. Food Sci. Emerg. Technol. 2005, 6, 442–452. [Google Scholar] [CrossRef]
- Ma, X.; Wu, H.; Liu, L.; Yao, Q.; Wang, S.; Zhan, R.; Xing, S.; Zhou, Y. Polyphenolic compounds and antioxidant properties in mango fruits. Sci. Hortic. 2011, 129, 102–107. [Google Scholar] [CrossRef]
- Siddiq, M.; Sogi, D.S.; Dolan, K.D. Antioxidant properties, total phenolics, and quality of fresh-cut “Tommy Atkins” mangoes as affected by different pre-treatments. LWT Food Sci. Tech. 2013, 53, 156–162. [Google Scholar] [CrossRef]
- Manthey, J.A.; Perkins-Veazie, P. Influences of harvest date and location on the levels of β-carotene, ascorbic acid, total phenols, the in vitro antioxidant capacity, and phenolic profiles of five commercial varieties of mango (Mangifera indica L.). J. Agric. Food Chem. 2009, 57, 10825–10830. [Google Scholar] [CrossRef]
- Simirgiotis, M.J.; Theoduloz, C.; Caligari, P.D.S.; Schmeda-Hirschmann, G. Comparison of phenolic composition and antioxidant properties of two native Chilean and one domestic strawberry genotypes. Food Chem. 2009, 113, 377–385. [Google Scholar]
- Simirgiotis, M.J.; Schmeda-Hirschmann, G.; Borquez, J.; Kennelly, E.J. The Passiflora tripartita (Banana Passion) fruit: A source of bioactive flavonoid c-glycosides Isolated by HSCCC and characterized by HPLC-DAD-ESI/MS/MS. Molecules 2013, 18, 1672–1692. [Google Scholar] [CrossRef] [Green Version]
- Clifford, M.N.; Stoupi, S.; Kuhnert, N. Profiling and cby LC-MSn of the galloylquinic acids of green tea, tara tannin, and tannic acid. J. Agric. Food Chem. 2007, 55, 2797–2807. [Google Scholar] [CrossRef]
- Sentandreu, E.; Cerdán-Calero, M.; Sendra, J.M. Phenolic profile characterization of pomegranate (Punica granatum) juice by high-performance liquid chromatography with diode array detection coupled to an electrospray ion trap mass analyzer. J. Food Comp. Anal. 2013, 30, 32–40. [Google Scholar] [CrossRef]
- Fischer, U.A.; Carle, R.; Kammerer, D.R. Identification and quantification of phenolic compounds from pomegranate (Punica granatum L.) peel, mesocarp, aril and differently produced juices by HPLC-DAD-ESI/MSn. Food Chem. 2011, 127, 807–821. [Google Scholar] [CrossRef]
- Markowicz Bastos, D.H.; Saldanha, L.A.; Catharino, R.R.; Sawaya, A.C.H.F.; Cunha, I.B.S.; Carvalho, P.O.; Eberlin, M.N. Phenolic antioxidants identified by ESI-MS from Yerba Maté (Ilex paraguariensis) and green tea (Camelia sinensis) extracts. Molecules 2007, 12, 423–432. [Google Scholar] [CrossRef]
- Li, S.Y.; Xiao, J.; Chen, L.; Hu, C.L.; Chen, P.; Xie, B.J.; Sun, Z.D. Identification of A-series oligomeric procyanidins from pericarp of Litchi chinensis by FT-ICR-MS and LC-MS. Food Chem. 2012, 135, 31–38. [Google Scholar] [CrossRef]
- Engels, C.; Gänzle, M.G.; Schieber, A. Fast LC-MS analysis of gallotannins from mango (Mangifera indica L.) kernels and effects of methanolysis on their antibacterial activity and iron binding capacity. Food Res. Int. 2012, 45, 422–426. [Google Scholar] [CrossRef]
- De Souza, L.M.; Cipriani, T.R.; Iacomini, M.; Gorin, P.A.; Sassaki, G.L. HPLC/ESI-MS and NMR analysis of flavonoids and tannins in bioactive extract from leaves of Maytenus ilicifolia. J. Pharm. Biomed. Anal. 2008, 47, 59–67. [Google Scholar] [CrossRef]
- Wu, Z.; Wei, G.; Lian, G.; Yu, B. Synthesis of mangiferin, isomangiferin, and homomangiferin. J. Org. Chem. 2010, 75, 5725–5728. [Google Scholar] [CrossRef]
- Liu, H.; Wang, K.; Tang, Y.; Sun, Z.; Jian, L.; Li, Z.; Wu, B.; Huang, C. Structure elucidation of in vivo and in vitro metabolites of mangiferin. J. Pharm. Biom. Anal. 2011, 55, 1075–1082. [Google Scholar] [CrossRef]
- Khallouki, F.; Haubner, R.; Hull, W.E.; Erben, G.; Spiegelhalder, B.; Bartsch, H.; Owen, R.W. Isolation, purification and identification of ellagic acid derivatives, catechins, and procyanidins from the root bark of Anisophyllea dichostyla R. Br. Food Chem. Toxicol. 2007, 45, 472–485. [Google Scholar] [CrossRef]
- Suvarnakuta, P.; Chaweerungrat, C.; Devahastin, S. Effects of drying methods on assay and antioxidant activity of xanthones in mangosteen rind. Food Chem. 2011, 125, 240–247. [Google Scholar] [CrossRef]
- Luo, F.; Lv, Q.; Zhao, Y.; Hu, G.; Huang, G.; Zhang, J.; Sun, C.; Li, X.; Chen, K. Quantification and purification of Mangiferin from Chinese mango (Mangifera indica L.) cultivars and its protective effect on human umbilical vein endothelial cells under H2O2-induced stress. Int. J. Mol. Sci. 2012, 13, 11260–11274. [Google Scholar] [CrossRef]
- Chieli, E.; Romiti, N.; Rodeiro, I.; Garrido, G. In vitro effects of Mangifera indica and polyphenols derived on ABCB1/P-glycoprotein activity. Food Chem. Toxicol. 2009, 47, 2703–2710. [Google Scholar]
- Liu, F.-X.; Fu, S.-F.; Bi, X.-F.; Chen, F.; Liao, X.-J.; Hu, X.-S.; Wu, J.-H. Physico-chemical and antioxidant properties of four mango (Mangifera indica L.) cultivars in China. Food Chem. 2013, 138, 396–405. [Google Scholar] [CrossRef]
- Passos, C.P.; Cardoso, S.M.; Domingues, M.R.M.; Domingues, P.; Silva, C.M.; Coimbra, M.A. Evidence for galloylated type-A procyanidins in grape seeds. Food Chem. 2007, 105, 1457–1467. [Google Scholar]
- American Chemical Society’s committee of environmental improvement; Subcommittee on environmental chemistry. Guidelines for data acquisition and data quality evaluation in environmental chemistry. Anal. Chem. 1980, 52, 2242–2249. [Google Scholar] [CrossRef]
- Yildirim, A.; Mavi, A.; Kara, A. Determination of antioxidant and antimicrobial activities of Rumex crispus L. extracts. J. Agric. Food Chem. 2001, 49, 4083–4089. [Google Scholar] [CrossRef]
- Simirgiotis, M.J.; Adachi, S.; To, S.; Yang, H.; Reynertson, K.A.; Basile, M.J.; Gil, R.R.; Weinstein, I.B.; Kennelly, E.J. Cytotoxic chalcones and antioxidants from the fruits of Syzygium samarangense (Wax Jambu). Food Chem. 2008, 107, 813–819. [Google Scholar] [CrossRef]
- Simirgiotis, M.J. Antioxidant Capacity and HPLC-DAD-MS profiling of Chilean peumo (Cryptocarya alba) fruits and comparison with German Peumo (Crataegus monogyna) from Southern Chile. Molecules 2013, 18, 2061–2080. [Google Scholar] [CrossRef]
- Simirgiotis, M.J.; Silva, M.; Becerra, J.; Schmeda-Hirschmann, G. Direct characterisation of phenolic antioxidants in infusions from four Mapuche medicinal plants by liquid chromatography with diode array detection (HPLC-DAD) and electrospray ionisation tandem mass spectrometry (HPLC-ESI-MS). Food Chem. 2012, 131, 318–327. [Google Scholar] [CrossRef]
- Benzie, I.F.F.; Strain, J.J. The ferric reducing ability of plasma (FRAP) as a measure of “Antioxidant Power” The FRAP assay. Anal. Biochem. 1996, 239, 70–76. [Google Scholar] [CrossRef]
- Schierle, J.; Pietsch, B.; Ceresa, A.; Fizet, C. Method for the determination of β-carotene in Supplements and raw materials by reversed-phase liquid chromatography: Single laboratory validation. J. AOAC Int. 2004, 87, 1070–1082. [Google Scholar]
- Sample Availability: Samples of mangiferin and other standard compounds and fruit extracts are available from the authors.
© 2013 by the authors. Licensee MDPI, Basel, Switzerland. This article is an open access article distributed under the terms and conditions of the Creative Commons Attribution license ( http://creativecommons.org/licenses/by/3.0/).
Share and Cite
Ramirez, J.E.; Zambrano, R.; Sepúlveda, B.; Simirgiotis, M.J. Antioxidant Properties and Hyphenated HPLC-PDA-MS Profiling of Chilean Pica Mango Fruits (Mangifera indica L. Cv. piqueño). Molecules 2014, 19, 438-458. https://doi.org/10.3390/molecules19010438
Ramirez JE, Zambrano R, Sepúlveda B, Simirgiotis MJ. Antioxidant Properties and Hyphenated HPLC-PDA-MS Profiling of Chilean Pica Mango Fruits (Mangifera indica L. Cv. piqueño). Molecules. 2014; 19(1):438-458. https://doi.org/10.3390/molecules19010438
Chicago/Turabian StyleRamirez, Javier E., Ricardo Zambrano, Beatriz Sepúlveda, and Mario J. Simirgiotis. 2014. "Antioxidant Properties and Hyphenated HPLC-PDA-MS Profiling of Chilean Pica Mango Fruits (Mangifera indica L. Cv. piqueño)" Molecules 19, no. 1: 438-458. https://doi.org/10.3390/molecules19010438