An Improved HPLC Method with the Aid of a Chemometric Protocol: Simultaneous Determination of Atorvastatin and Its Metabolites in Plasma

Abstract
:1. Introduction

2. Results and Discussion


| Factor levels | Responses | ||||||||
|---|---|---|---|---|---|---|---|---|---|
| x1 (%) | x2 (°C) | x3 (mL min−1) | Rt p-ATO | Rt ATO-l | Sym p-ATO | Sym o-ATO | Sym ATO | Sym ATO-l | RRt p-ATO |
| 65 | 35 | 1 | 2.851 | 6.982 | 1.183 | 1.122 | 1.132 | 1.102 | 1.102 |
| 65 | 35 | 1 | 2.856 | 7.089 | 1.146 | 1.098 | 1.107 | 1.121 | 1.126 |
| 65 | 30 | 1 | 3.158 | 7.445 | 0.753 | 0.779 | 0.872 | 0.979 | 1.213 |
| 65 | 35 | 1 | 2.874 | 7.251 | 1.128 | 1.168 | 1.232 | 1.246 | 1.207 |
| 65 | 35 | 1 | 3.214 | 7.861 | 1.047 | 1.119 | 1.206 | 1.123 | 1.143 |
| 70 | 30 | 1.2 | 2.905 | 7.652 | 0.441 | 0.503 | 0.427 | 0.913 | 0.556 |
| 60 | 35 | 1 | 2.134 | 7.128 | 1.148 | 1.204 | 0.986 | 0.998 | 1.162 |
| 65 | 35 | 0.8 | 2.302 | 7.636 | 0.897 | 0.962 | 1.165 | 0.946 | 1.237 |
| 65 | 35 | 1 | 2.826 | 7.241 | 1.147 | 1.201 | 1.136 | 1.121 | 1.145 |
| 70 | 30 | 0.8 | 2.342 | 8.359 | 0.595 | 0.436 | 0.661 | 0.626 | 1.362 |
| 60 | 40 | 0.8 | 1.764 | 6.352 | 0.432 | 0.553 | 0.614 | 0.661 | 1.245 |
| 60 | 30 | 0.8 | 2.089 | 6.452 | 0.559 | 0.651 | 0.801 | 0.867 | 1.268 |
| 60 | 30 | 1.2 | 2.453 | 7.753 | 0.982 | 0.812 | 0.806 | 0.995 | 0.585 |
| 70 | 40 | 1.2 | 1.472 | 6.152 | 1.284 | 0.993 | 0.898 | 0.962 | 0.565 |
| 65 | 40 | 1.0 | 1.976 | 6.573 | 1.112 | 1.085 | 0.903 | 1.011 | 1.082 |
| 60 | 40 | 1.2 | 2.543 | 8.459 | 1.052 | 1.021 | 0.984 | 0.924 | 0.581 |
| 70 | 35 | 1.0 | 1.752 | 6.561 | 1.064 | 1.011 | 1.006 | 0.922 | 1.151 |
| 65 | 35 | 1.0 | 2.847 | 7.139 | 1.152 | 1.117 | 1.127 | 1.098 | 1.142 |
| 70 | 40 | 0.8 | 0.472 | 6.083 | 1.109 | 0.595 | 0.685 | 0.538 | 1.365 |
| 65 | 35 | 1.2 | 3.367 | 8.124 | 1.203 | 1.206 | 1.167 | 1.121 | 0.536 |
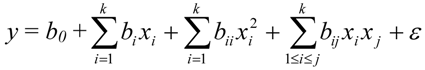
| b0 | b1 | b2 | b3 | b12 | b13 | b23 | b11 | b22 | b33 | R2 | R2 Adjusted | |
|---|---|---|---|---|---|---|---|---|---|---|---|---|
| Rt | 2.84 | −0.20 | −0.47 | 0.38 | −0.38 | −0.053 | 0.11 | −0.79 | −0.17 | −0.099 | 0.9665 | 0.9363 |
| p-ATO | 0.0001 a | 0.0043 | 0.0001 | 0.0001 | 0.0001 | 0.4182 | 0.1175 | 0.0001 | 0.1429 | 0.3732 | ||
| Rt | 7.27 | −0.13 | −0.40 | 0.33 | −0.55 | −0.51 | 0.20 | −0.44 | −0.27 | 0.6 | 0.9409 | 0.8878 |
| ATO-l | 0.0001 | 0.1042 | 0.0003 | 0.0014 | 0.0001 | 0.0001 | 0.0397 | 0.0121 | 0.0862 | 0.0018 | ||
| Sym | 1.14 | 0.032 | 0.17 | 0.14 | 0.18 | −0.13 | 0.066 | −0.033 | −0.21 | −0.089 | 0.9794 | 0.9608 |
| p-ATO | 0.0001 | 0.0834 | 0.0001 | 0.0001 | 0.0001 | 0.0001 | 0.0054 | 0.3236 | 0.0001 | 0.0187 | ||
| Sym | 1.16 | −0.070 | 0.11 | 0.13 | 0.067 | −0.020 | 0.080 | −0.086 | −0.26 | −0.11 | 0.9799 | 0.9618 |
| o-ATO | 0.0001 | 0.0013 | 0.0001 | 0.0001 | 0.0036 | 0.2755 | 0.0012 | 0.0180 | 0.0001 | 0.0048 | ||
| Sym | 1.16 | −0.051 | 0.052 | 0.036 | 0.063 | −0.049 | 0.1 | −0.16 | −0.27 | - | 0.9698 | 0.9426 |
| ATO | 0.0001 | 0.0130 | 0.0126 | 0.0632 | 0.0079 | 0.0266 | 0.0003 | 0.0006 | 0.0001 | (0.7937) | ||
| Sym | 1.12 | −0.048 | −0.028 | 0.13 | 0.030 | 0.040 | 0.034 | −0.14 | −0.11 | −0.068 | 0.9546 | 0.9138 |
| ATO-l | 0.0001 | 0.0165 | 0.1222 | 0.0001 | 0.1448 | 0.0593 | 0.1007 | 0.0013 | 0.0077 | 0.0600 | ||
| RRt | 1.14 | 0.016 | −0.015 | −0.37 | 0.005 | −0.032 | 0.003 | 0.026 | 0.017 | −0.24 | 0.9907 | 0.9823 |
| p-ATO | 0.0001 | 0.2247 | 0.2593 | 0.0001 | 0.7284 | 0.0391 | 0.8235 | 0.2831 | 0.4718 | 0.0001 |
| Response | Reduced response models * | R2 | Adj. R2 | Pred. R2 | Adequate precision | RSD (%) |
|---|---|---|---|---|---|---|
| Rt p-ATO | 2.83 − 0.02 x1 − 0.47x2 + 0.38x3 − 0.38x1x2 − 0.83x12 | 0.9454 | 0.9258 | 0.8786 | 26.388 | 7.88 |
| Rt ATO-l | 7.23 − 0.40 x2 + 0.33x3 − 0.55x1x2 − 0.051x1x3 + 0.20 x2x3 − 0.54x12 + 0.50 x32 | 0.9007 | 0.8428 | 0.7602 | 12.984 | 3.88 |
| Sym p-ATO | 1.13 + 0.17 x2 + 0.14x3 + 0.18x1x2-0.13x1x3 + 0.066x2x3 − 0.22x22 − 0.1x32 | 0.9695 | 0.9517 | 0.8050 | 22.114 | 6.01 |
| Sym o-ATO | 1.16 − 0.07 x1 + 0.11x2 + 0.13x3 + 0.067x1x2 + 0.08 x2x3 − 0.086x12 − 0.26x22 − 0.11 x32 | 0.9772 | 0.9606 | 0.9108 | 22.759 | 5.47 |
| Sym ATO | 1.16 − 0.051 x1 + 0.052x2 + 0.063x1x2 − 0.049 x1x3 + 0.1x2x3 − 0.16x12 − 0.27x22 | 0.9564 | 0.9310 | 0.7508 | 19.841 | 6.25 |
| Sym ATO-l | 1.11 + 0.13 x3 − 0.17x12 − 0.13x22 | 0.8370 | 0.8064 | 0.7443 | 15.555 | 8.27 |
| RRt p-ATO ** | 0.94 − 1.5 × 10−3x1 + 5.4x10−3x2 + 0.23x3 + 3.0 × 10−3x1x2 + 0.015x1x3 − 1.68 × 10−3x2x3 − 0.016x12 − 0.11x22 + 0.19x32 | 0.9960 | 0.9925 | 0.9806 | 45.543 | 1.59 |
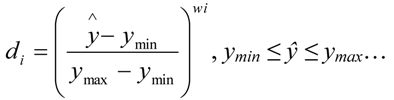
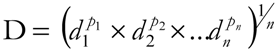
| Response | Goal | Weight | Lower limit | Upper limit | Importance |
|---|---|---|---|---|---|
| Acetonitrile | range | 1 | 60 | 70 | 3 |
| Temperature | range | 1 | 30 | 40 | 3 |
| Flow rate | range | 1 | 0.8 | 1.2 | 3 |
| Rt p-ATO | range | 1 | 0.472 | 3.367 | 3 |
| Rt ATO-l | target = 7 | 1 | 6.083 | 8.459 | 4 |
| Sym p-ATO | target = 1 | 1 | 0.432 | 1.284 | 3 |
| Sym o-ATO | target = 1 | 1 | 0.436 | 1.206 | 3 |
| Sym ATO | target = 1 | 1 | 0.427 | 1.232 | 3 |
| Sym ATO-l | target = 1 | 1 | 0.538 | 1.246 | 3 |
| RRt p-ATO | range | 1 | 0.856 | 1.366 | 3 |


3. Experimental
3.1. Chemical and Reagents
3.2. Standard Solutions
3.3. Biological Samples
3.4. Chromatographic Procedure
3.5. Software
4. Conclusions
Acknowledgments
References
- Erk, N. Development of electrochemical methods for determination of atorvastatin and analytical application to pharmaceutical products and spiked human plasma. Crit. Rev. Anal. Chem. 2004, 34, 1–6. [Google Scholar] [CrossRef]
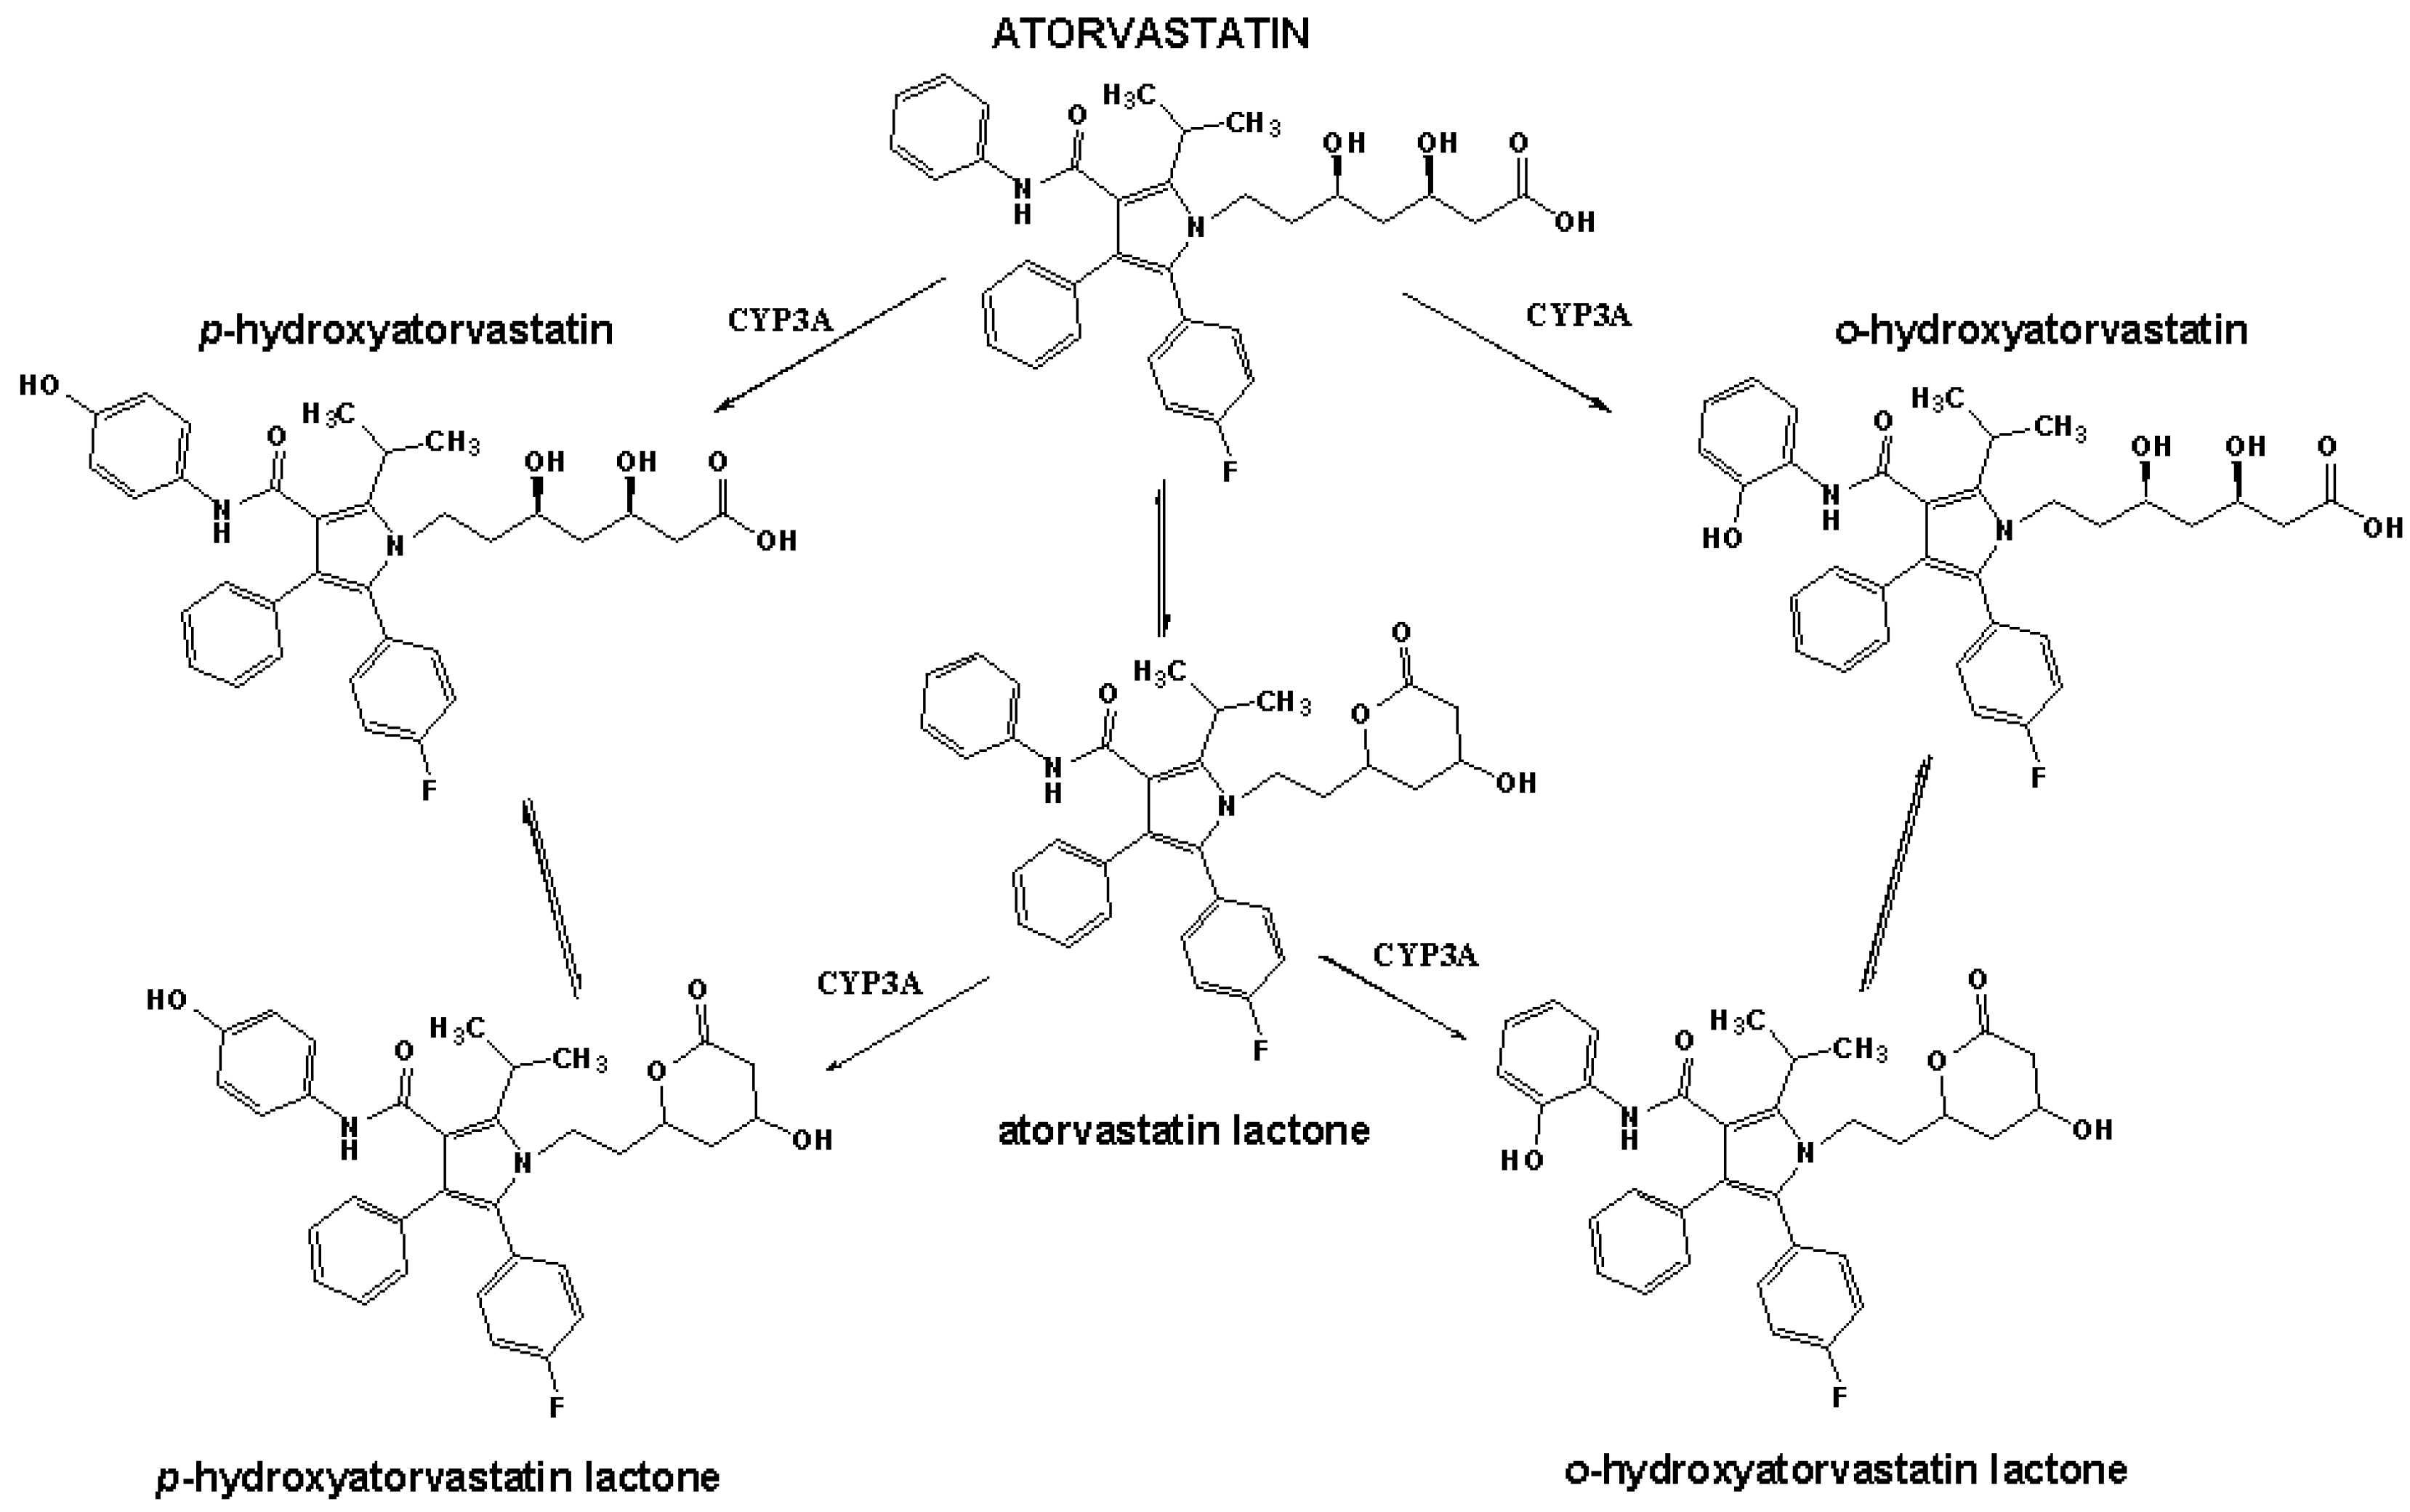
- Jacobsen, W.; Kuhn, B.; Soldner, A.; Kirchner, G.; Sewing, K.; Kollman, P.; Benet, L.; Christians, U. Lactonization is the critical first step in the disposition of the 3-hydroxy-3-methylglutaryl-Coa reductase inhibitor atorvastatin. Drug Metab. Dispos. 2000, 28, 1369–1378. [Google Scholar]
- Mishra, P.; Gupta, A.; Shah, K. Simultaneous estimation of atorvastatin calcium and amlodipine besylate from tablets. Ind. J. Pharm. Sci. 2007, 69, 831–833. [Google Scholar] [CrossRef]
- Jadhav, S.D.; Bhatia, M.S.; Thamake, S.; Pishawikar, S.A. Spectrophotometric methods for estimation of atorvastatin calcium form tablet dosage forms. Int. J. Pharm. Tech. Res. 2010, 2, 1948–1953. [Google Scholar]
- Patil, U.P.; Gandhi, S.V.; Sengar, M.R.; Rajmane, V.S. A validated densitometric method for analysis of telmisartan and atorvastatin calcium in fixed dose combination. J. Chil. Chem. Soc. 2010, 55, 94–96. [Google Scholar]
- Shum, Y.Y.; Huang, N.; Walter, G.; Black, A.; Sekerke, C.; Chang, T.; Whitfield, L.R. Development, validation, and interlaboratory comparison of an HMG-CoA reductase inhibition assay for quantitation of atorvastatin in plasma matrices. Ther. Drug Monit. 1998, 20, 41–49. [Google Scholar] [CrossRef]
- Valesky, R.J.; Liu, L.; Musson, D.G.; Zhao, J.J. Automated enzyme inhibition assay method for the determination of atorvastatin-derived HMG-CoA reductase inhibitors in human plasma using radioactivity detection. J. Pharmacol. Toxicol. Methods 2008, 57, 61–69. [Google Scholar] [CrossRef]
- Stanisz, B.; Kania, L. HPLC method for estimation of ramipril in human plasma. Acta Pol. Pharm. 2006, 63, 471–476. [Google Scholar]
- Patel, G.F.; Vekariya, N.R.; Dholakiya, R.B.; Ramani, G.K. RP-HPLC estimation of aspirin and atorvastatin calcium in combined dosage forms. J. Pharm. Res. 2009, 2, 1274–1275. [Google Scholar]
- Sharma, R.; Khanna, S.; Mishra, G.P. Development and validation of RP-HPLC method for simultaneous estimation of ramipril, aspirin and atorvastatin in pharmaceutical preparations. E J. Chem. 2012, 9, 2177–2184. [Google Scholar] [CrossRef]
- Shah, D.A.; Bhatt, K.K.; Mehta, R.S.; Shankar, M.B.; Baldania, S.L. RP-HPLC method for the determination of atorvastatin calcium and nicotinic acid in combined tablet dosage form. Ind. J. Pharm. Sci. 2007, 69, 700–703. [Google Scholar] [CrossRef]
- Shah, D.A.; Bhatt, K.K.; Shankar, M.B.; Mehta, R.S.; Gandhi, T.R.; Baldania, S.L. RP-HPLC determination of atorvastatin calcium and amlodipine besylate combination in tablets. Ind. J. Pharm. Sci. 2006, 68, 796–799. [Google Scholar] [CrossRef]
- Qutab, S.S.; Razzaq, S.N.; Khan, I.U.; Ashfaq, M.; Shuja, Z.A. Simultaneous determination of atorvastatin calcium and ezetimibe in pharmaceutical formulations by liquid chromatography. J. Food Drug Anal. 2007, 15, 139–144. [Google Scholar]
- Patel, A.; Macwana, C.; Parmar, V.; Patel, S. Simultaneous determination of atorvastatin calcium, ezetimibe, and fenofibrate in a tablet formulation by HPLC. J. AOAC Int. 2012, 95, 419–423. [Google Scholar] [CrossRef]
- Nováková, L.; Šatínský, D.; Solich, P. HPLC methods for the determination of simvastatin and atorvastatin. Trends Analyt. Chem. 2008, 27, 352–367. [Google Scholar] [CrossRef]
- Sultana, N.; Arayne, M.S.; Shah, S.N.; Shafib, N.; Naveed, S. Simultaneous determination of prazosin, atorvastatin, rosuvastatin and simvastatin in API, dosage formulations and human serum by RP-HPLC. J. Chin. Chem. Soc. 2010, 57, 1286–1292. [Google Scholar]
- Ertürk, S.; Aktaş, S.E.; Ersoy, L.; Fiçicioğlu, S. An HPLC method for the determination of atorvastatin and its impurities in bulk drug and tablets. J. Pharm. Biomed. Anal. 2003, 33, 1017–1023. [Google Scholar] [CrossRef]
- Kadav, A.A.; Vora, D.N. Stability-indicating UPLC method for simultaneous determination of atorvastatin, fenofibrate and their degradation products in tablets. J. Pharm. Biomed. Anal. 2008, 48, 120–126. [Google Scholar] [CrossRef]
- Zarghi, A.; Shafaati, A.; Foroutan, S.M.; Khoddam, A. A simple and rapid HPLC method for the determination of atorvastatin in human plasma with UV detection and its application to pharmacokinetic studies. Arzneimittelforschung 2005, 55, 451–455. [Google Scholar]
- Lins, R.L.; Matthys, K.E.; Verpooten, G.A.; Peeters, P.C.; Dratwa, M.; Stolear, J.C.; Lameire, N.H. Pharmacokinetics of atorvastatin and its metabolites after single and multiple dosing in hypercholesterolaemic haemodialysis patients. Nephrol. Dial. Transplant. 2003, 18, 967–976. [Google Scholar] [CrossRef]
- Bořek-Dohalský, V.; Huclová, J.; Barrett, B.; Němec, B.; Ulč, I.; Jelínek, I. Validated HPLC-MS-MS method for simultaneous determination of atorvastatin and 2-hydroxyatorvastatin in human plasma-pharmacokinetic study. Anal. Bioanal. Chem. 2006, 386, 275–285. [Google Scholar] [CrossRef]
- Macwan, J.S.; Ionita, I.A.; Dostalek, M.; Akhlaghi, F. Development and validation of a sensitive simple and rapid method for simultaneous quantitation of atorvastatin and its acid and lactone metabolites by liquid chromatography-tandem mass spectrometry LC-MS/MS. Anal. Bioanal. Chem. 2011, 400, 423–433. [Google Scholar] [CrossRef]
- Ghosh, C.; Jain, I.; Gaur, S.; Patel, N.; Upadhyay, A.; Chakraborty, B.S. Simultaneous estimation of atorvastatin and its two metabolites from human plasma by ESI-LC-MS/MS. Drug Test. Anal. 2011, 3, 352–362. [Google Scholar] [CrossRef]
- Hermann, M.; Christensen, H.; Reubsaet, J.L.E. Determination of atorvastatin and metabolites in human plasma with solid-phase extraction followed by LC-tandem MS. Anal. Bioanal. Chem. 2005, 382, 1242–1249. [Google Scholar] [CrossRef]
- Myers, R.H.; Montgomery, D.C. Response Surface Methodology: Process and Product Optimization Using Designed Experiments, 2nd ed; John Wiley & Sons Inc.: New York, NY, USA, 2002. [Google Scholar]
- Sivakumar, T.; Manavalan, R.; Valliappan, K. Global optimization using Derringer’s desirability function: enantioselective determination of ketoprofen in formulations and in biological matrices. Acta Chromatogr. 2007, 19, 29–47. [Google Scholar]
- Vujic, Z.; Mulavdic, N.; Smajic, M.; Brboric, J.; Stankovic, P. Simultaneous analysis of irbesartan and hydrochlorothiazide: an improved HPLC method with the aid of a chemometric protocol. Molecules 2012, 17, 3461–3474. [Google Scholar] [CrossRef]
- Jocić, B.; Zecević, M.; Zivanović, Lj.; Protić, A.; Jadranin, M.; Vajs, V. Study of forced degradation behavior of eletriptan hydrobromide by LC and LC-MS and development of stability-indicating method. J. Pharm. Biomed. Anal. 2008, 46, 622–629. [Google Scholar]
- Derringer, G.; Suich, R. Simultaneous optimization of several response variables. J. Qual. Techn. 1980, 12, 214–219. [Google Scholar]
- Sample Availability: Samples of the compounds are not available from the authors.
© 2013 by the authors; licensee MDPI, Basel, Switzerland. This article is an open access article distributed under the terms and conditions of the Creative Commons Attribution license (http://creativecommons.org/licenses/by/3.0/).
Share and Cite
Crevar-Sakač, M.; Vujić, Z.; Brborić, J.; Kuntić, V.; Uskoković-Marković, S. An Improved HPLC Method with the Aid of a Chemometric Protocol: Simultaneous Determination of Atorvastatin and Its Metabolites in Plasma. Molecules 2013, 18, 2469-2482. https://doi.org/10.3390/molecules18032469
Crevar-Sakač M, Vujić Z, Brborić J, Kuntić V, Uskoković-Marković S. An Improved HPLC Method with the Aid of a Chemometric Protocol: Simultaneous Determination of Atorvastatin and Its Metabolites in Plasma. Molecules. 2013; 18(3):2469-2482. https://doi.org/10.3390/molecules18032469
Chicago/Turabian StyleCrevar-Sakač, Milkica, Zorica Vujić, Jasmina Brborić, Vesna Kuntić, and Snežana Uskoković-Marković. 2013. "An Improved HPLC Method with the Aid of a Chemometric Protocol: Simultaneous Determination of Atorvastatin and Its Metabolites in Plasma" Molecules 18, no. 3: 2469-2482. https://doi.org/10.3390/molecules18032469