Quality Evaluation of Panax ginseng Roots Using a Rapid Resolution LC-QTOF/MS-Based Metabolomics Approach

 ,
, 
Abstract
:1. Introduction
2. Results and Discussion
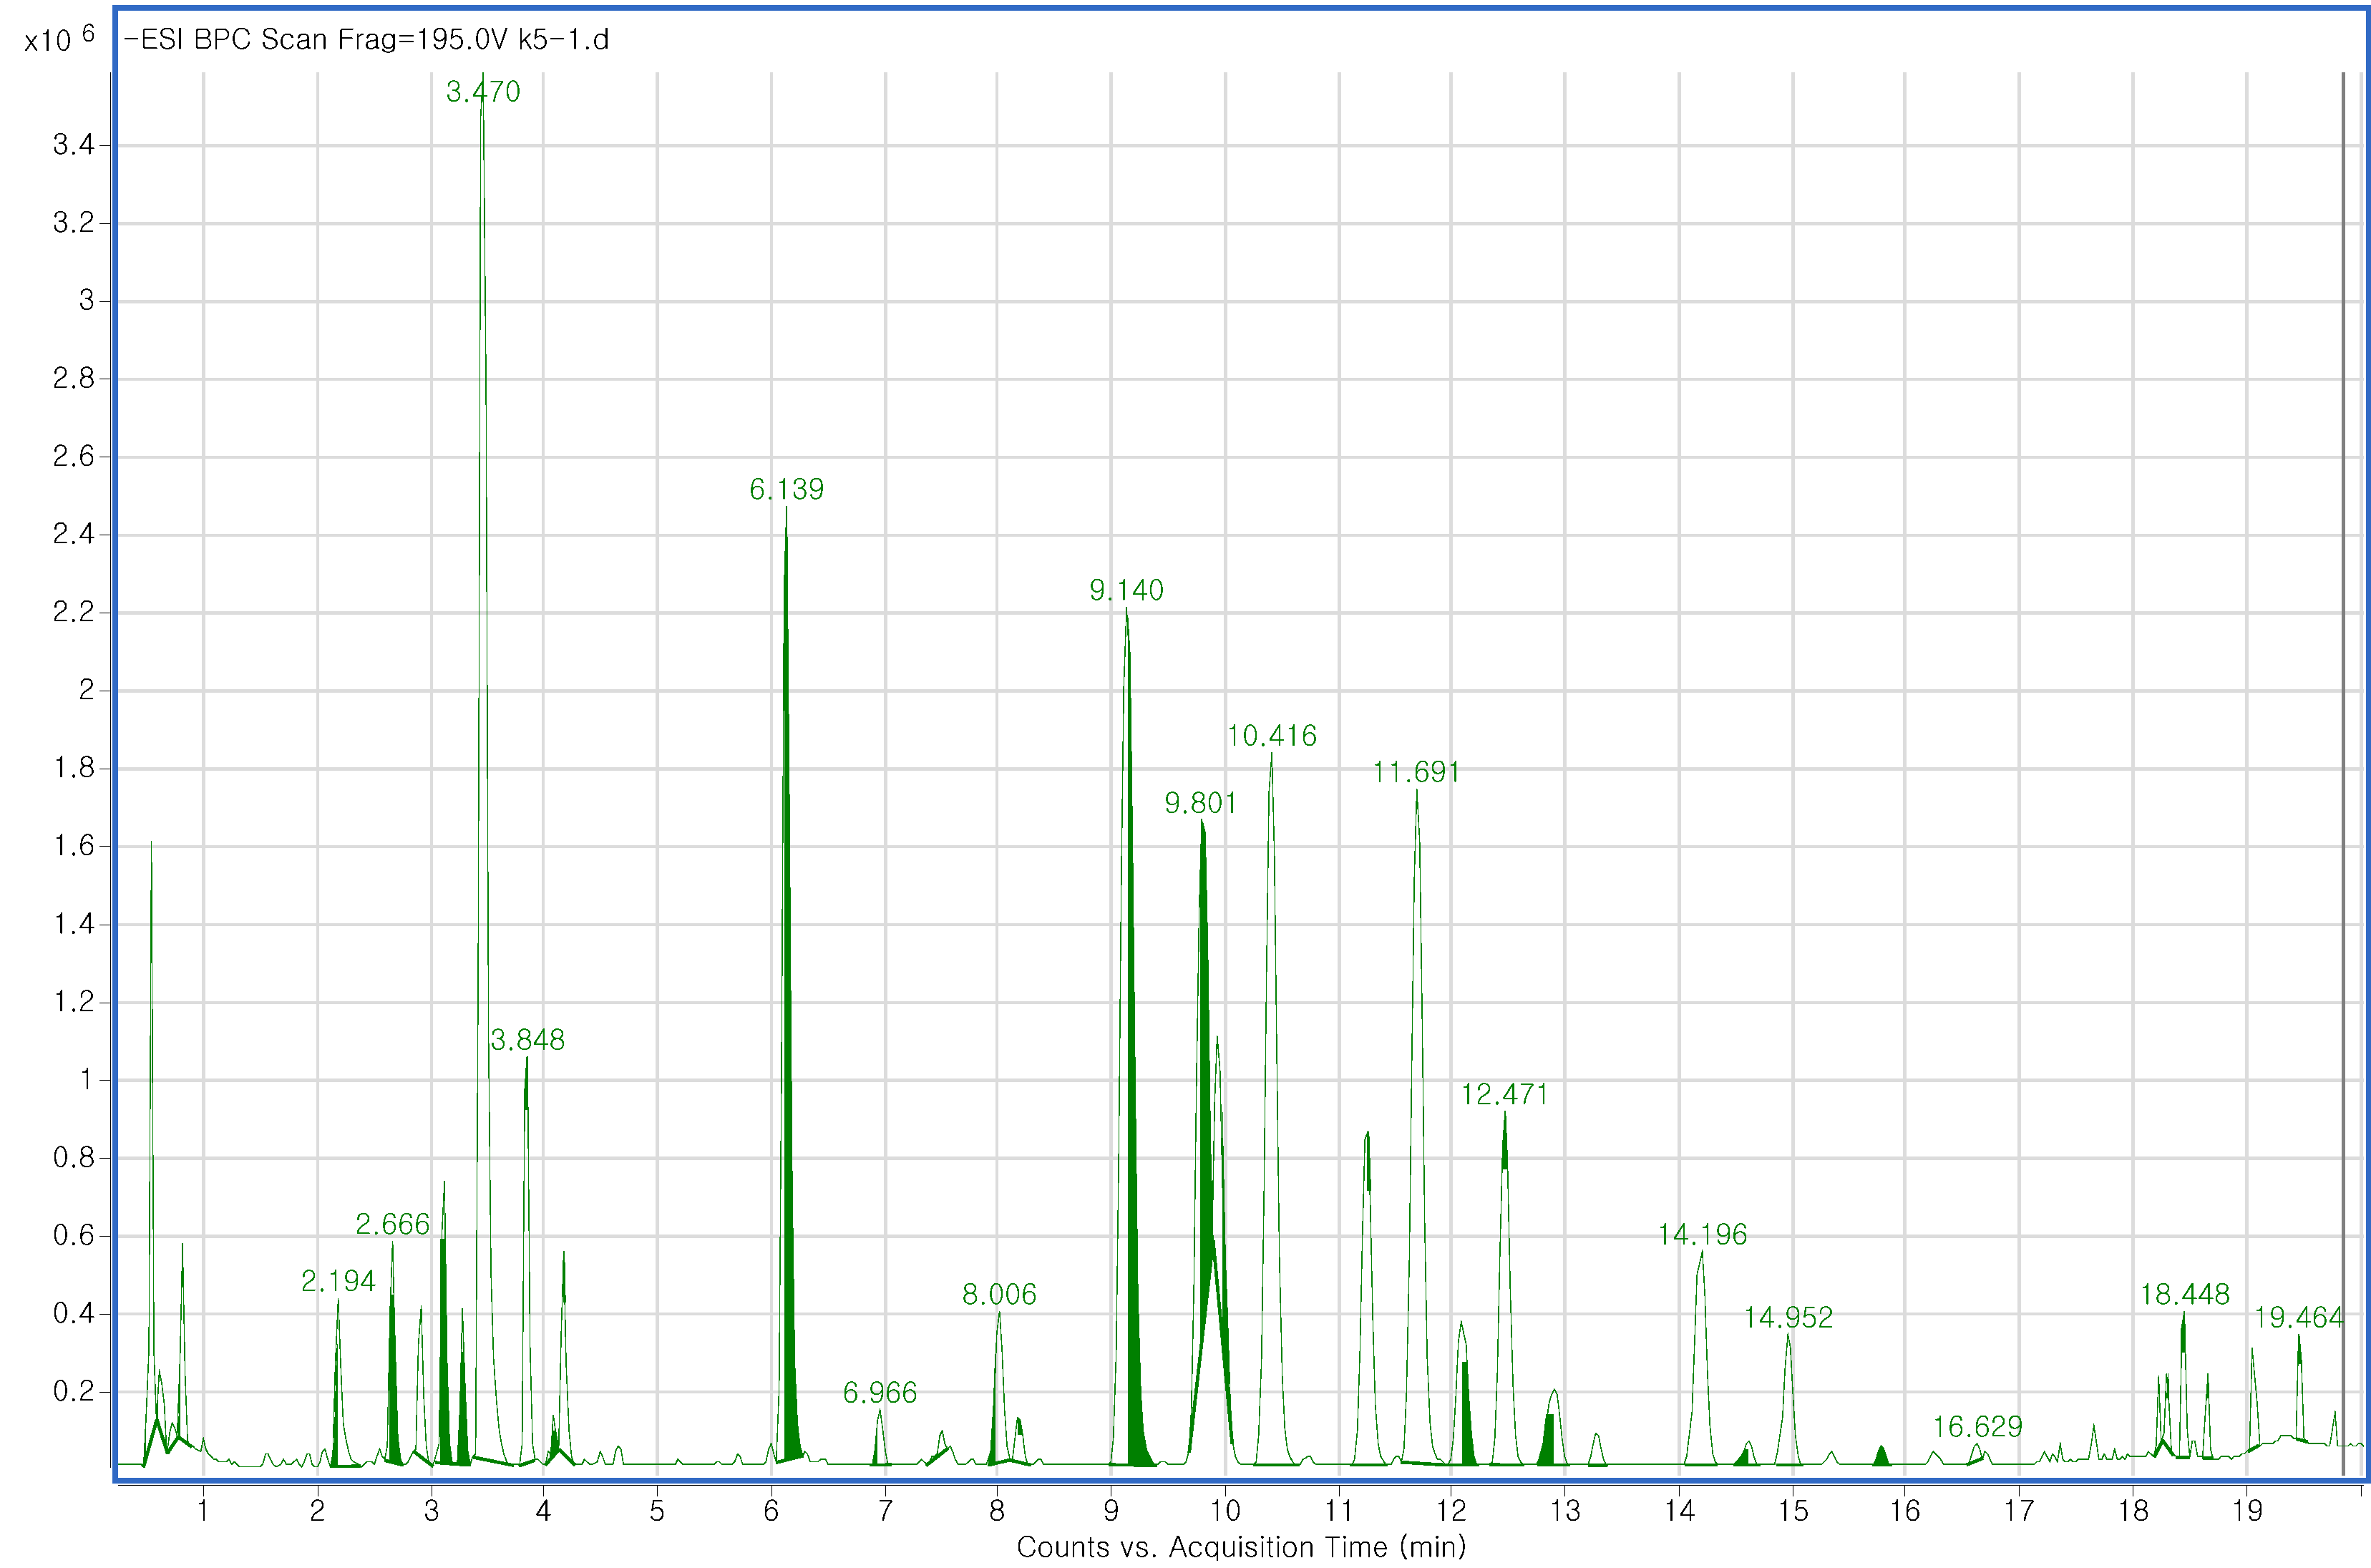
2.1. Investigation of RRLC-MS Conditions
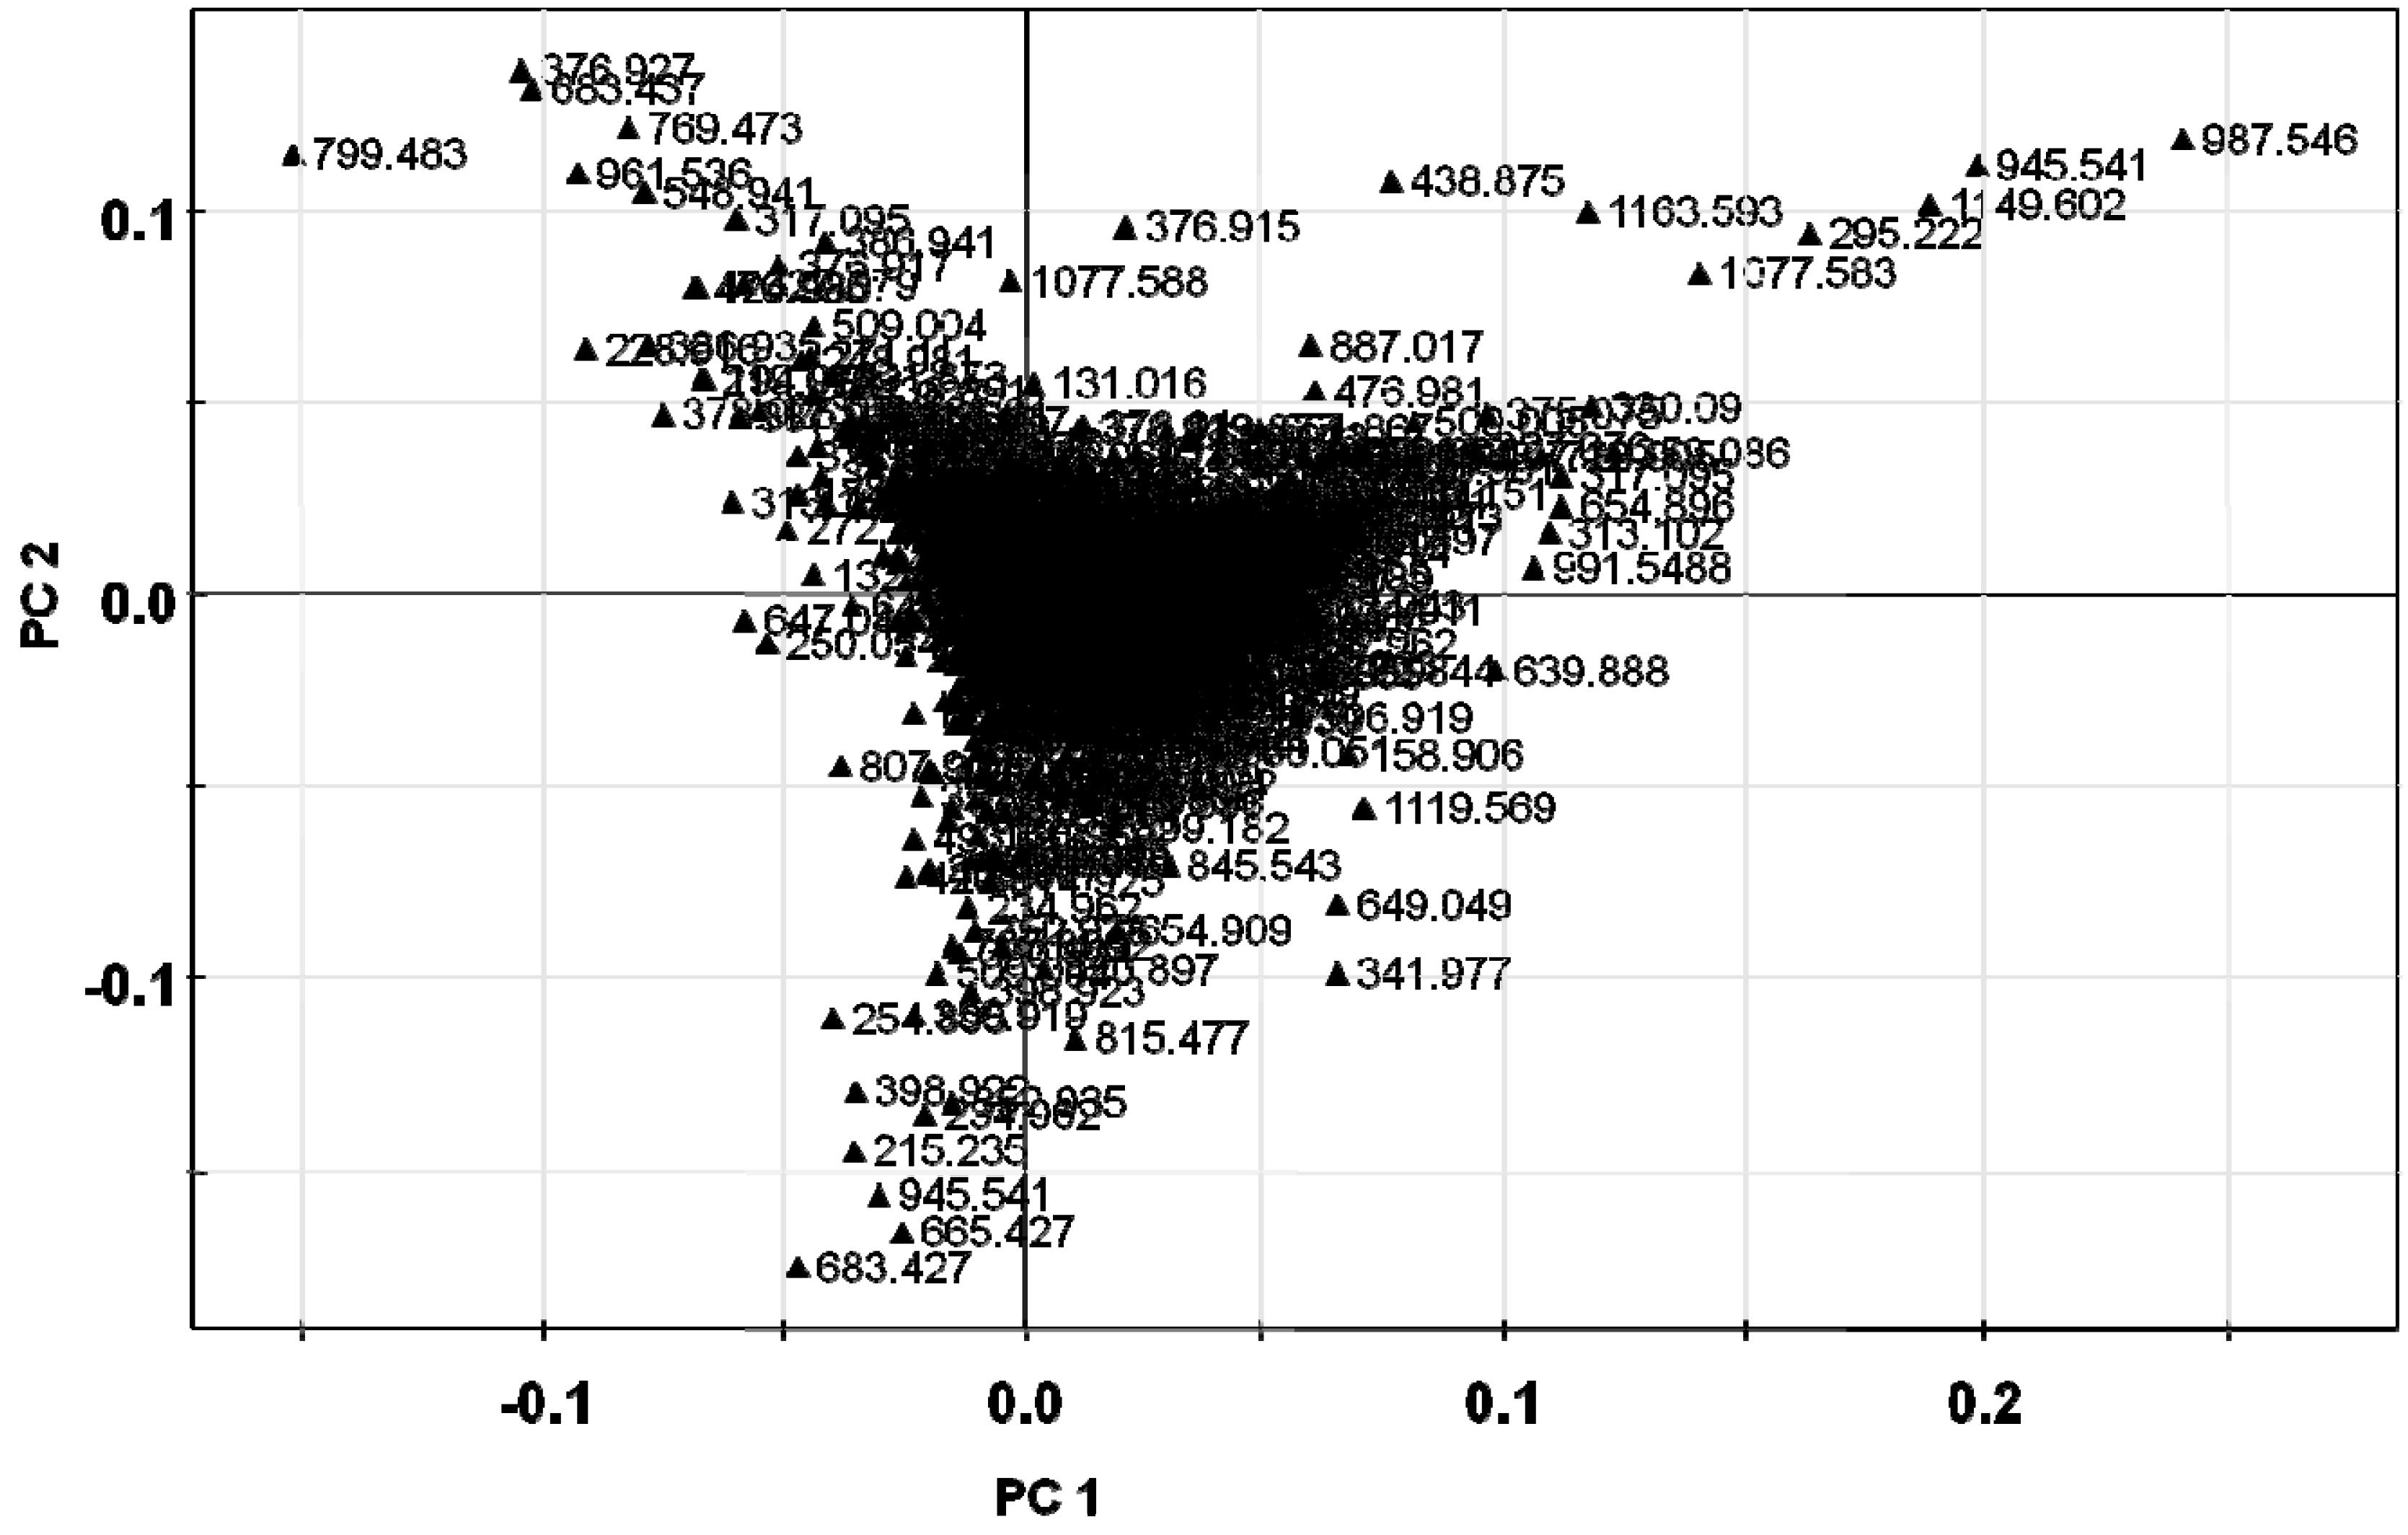
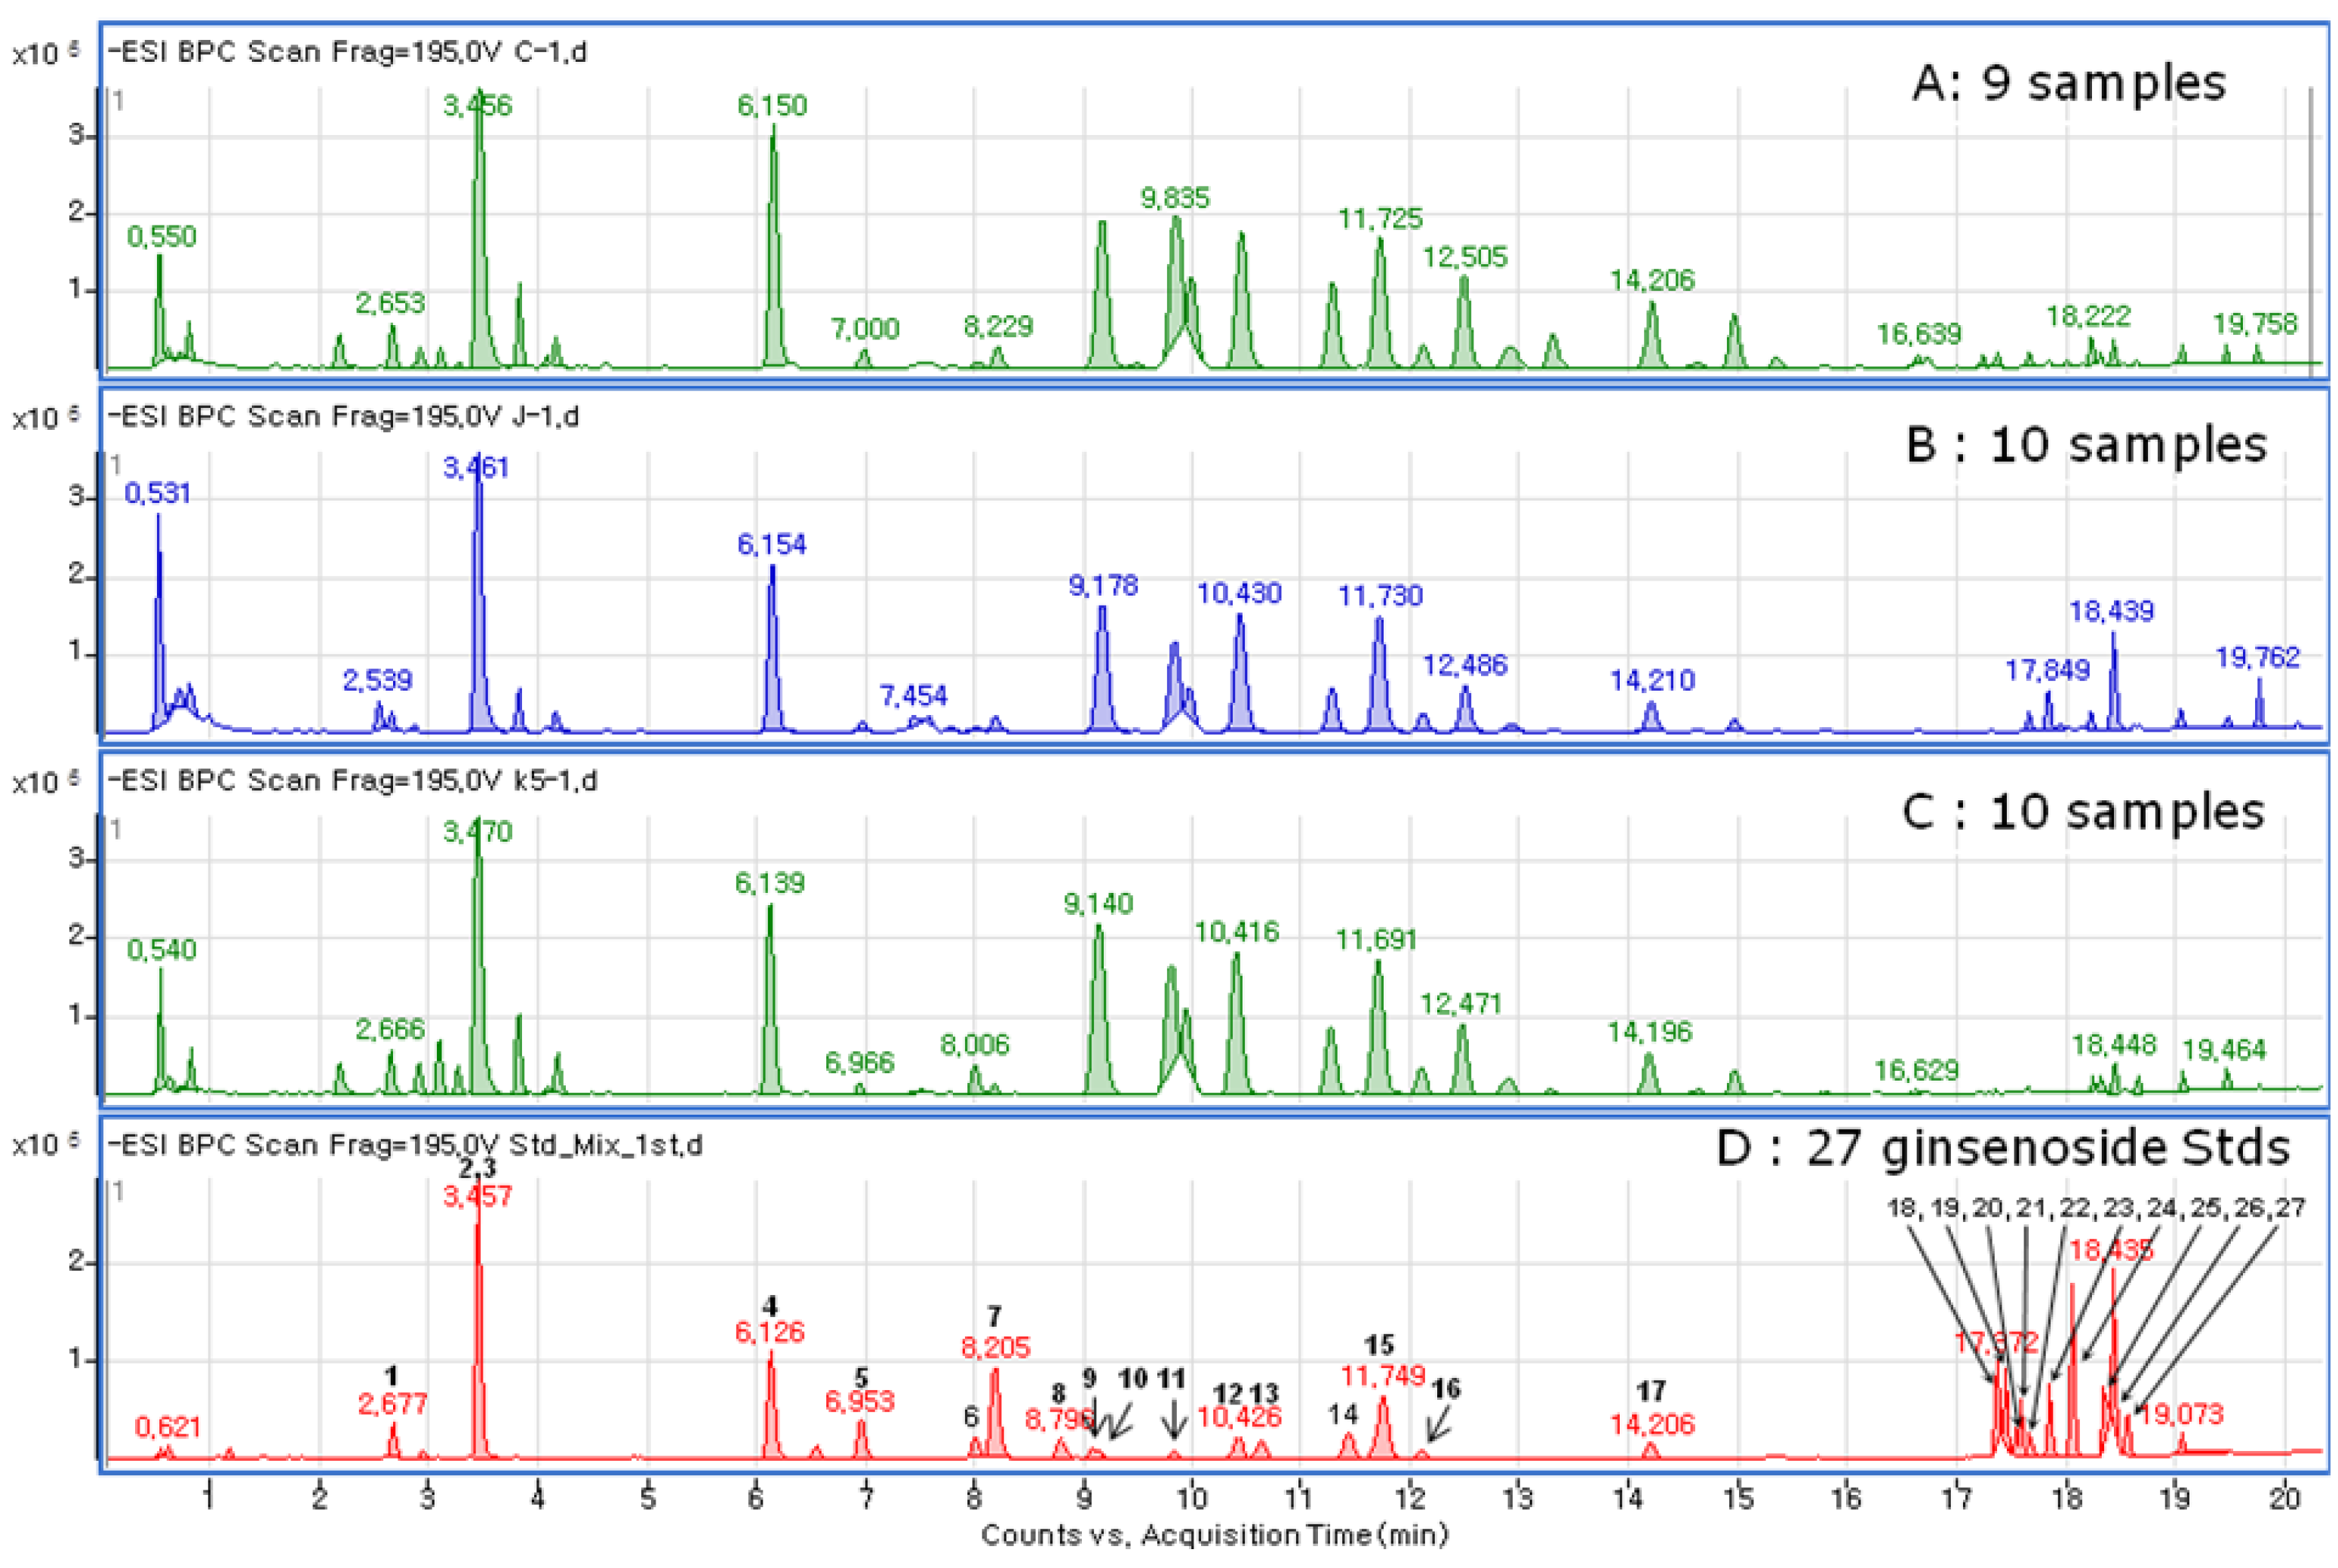
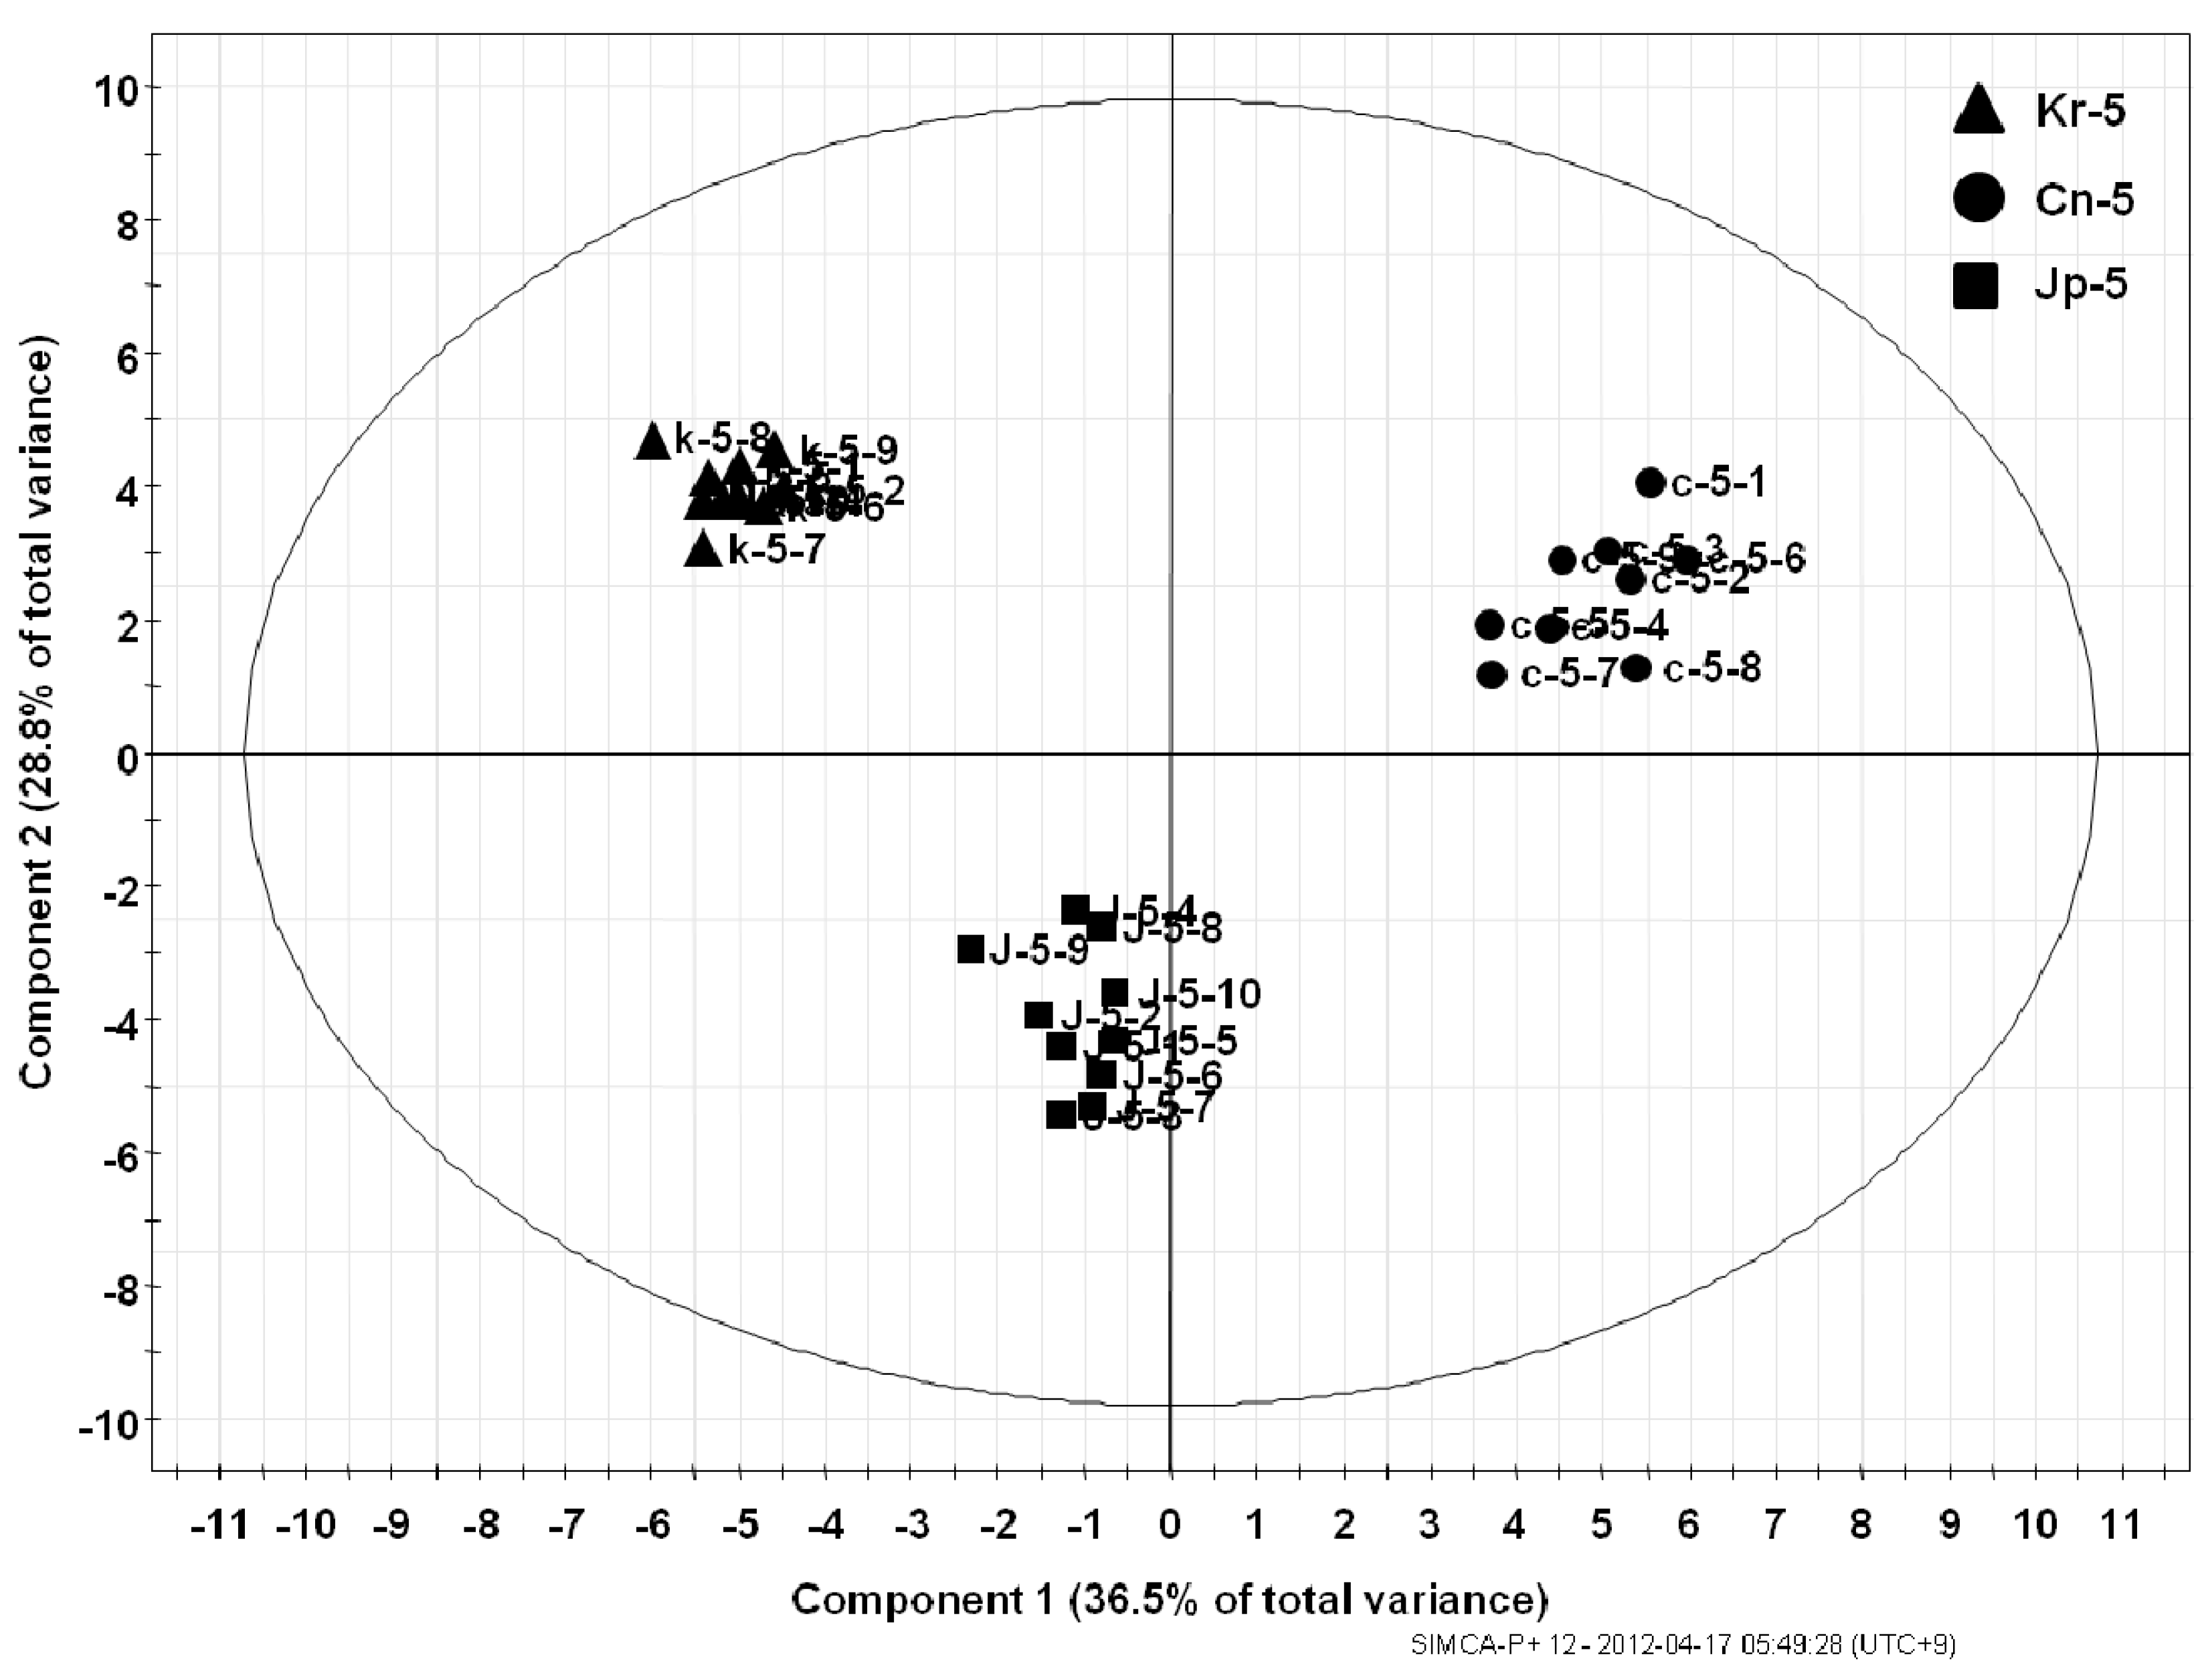
2.2. PCA of Ginseng Root Samples


| No. | R.T. (min) | Identification | Molecualr formula | Theoretical accutare mass [M]+ | Calculated mass [M−H]− | QTOF/MS (ESI−) [M−H]− | Mass accuracy (ppm) |
|---|---|---|---|---|---|---|---|
| 1 | 2.659 | 20-O-gluco-ginsenoside Rf | C48H82O19 | 962.5450 | 961.5372 | 961.5360 | −1.2 |
| 2 | 3.431 | ginsenoside Rg1 | C42H72O14 | 800.4922 | 799.4844 | 845.4912 [M−H+HCOOH]− | 1.3 |
| 3 | 3.435 | ginsenoside Re | C48H82O18 | 946.5501 | 945.5423 | 945.5415 | −0.8 |
| 4 | 6.109 | ginsenoside Rf | C42H72O14 | 800.4922 | 799.4844 | 799.4835 | −1.1 |
| 5 | 6.942 | notoginsenoside R2 | C41H70O13 | 770.4816 | 769.4738 | 769.4731 | −0.9 |
| 6 | 8.002 | ginsenoside Rg2 | C42H72O13 | 784.4973 | 783.4894 | 783.4830 | −8.1 |
| 7 | 8.154 | ginsenoside Rh1 | C36H62O9 | 638.4394 | 637.4315 | 683.4275 [M−H+HCOOH]− | 5.9 |
| 8 | 8.747 | ginsenoside Ra2 | C58H98O26 | 1210.6346 | 1209.6268 | 1209.6303 | 2.9 |
| 9 | 9.087 | ginsenoside Rb1 | C54H92O23 | 1108.6029 | 1107.5951 | 1107.5886 | 5.8 |
| 10 | 9.107 | ginsenoside Ra3 | C59H100O27 | 1240.6452 | 1239.6373 | 1239.6312 | −4.9 |
| 11 | 9.723 | ginsenoside Ro | C48H76O19 | 956.4981 | 955.4902 | 955.4922 | 2.0 |
| 12 | 10.380 | ginsenoside Rc | C53H90O22 | 1078.5923 | 1077.5845 | 1077.5835 | −0.9 |
| 13 | 10.600 | ginsenoside Ra1 | C58H98O26 | 1210.6346 | 1209.6268 | 1209.6298 | −2.5 |
| 14 | 11.679 | ginsenoside F1 | C36H62O9 | 638.4394 | 637.4315 | 683.4375 [M−H+HCOOH]− | 0.9 |
| 15 | 11.703 | ginsenoside Rb2 | C53H90O22 | 1078.5923 | 1077.5845 | 1077.5885 | 3.7 |
| 16 | 12.018 | ginsenoside Rb3 | C53H90O22 | 1078.5923 | 1077.5845 | 1077.5896 | 4.7 |
| 17 | 14.143 | ginsenoside Rd | C48H82O18 | 946.5501 | 945.5423 | 945.5416 | −0.7 |
| 18 | 17.424 | ginsenoside Rg6 | C42H70O12 | 766.4867 | 765.4789 | 765.4766 | −3.0 |
| 19 | 17.572 | ginsenoside Rk3 | C36H60O8 | 620.4288 | 619.4195 | 665.427 [M−H+HCOOH]− | 1.1 |
| 20 | 17.583 | ginsenoside F4 | C42H70O12 | 766.4867 | 765.4789 | 765.4700 | 11.6 |
| 21 | 17.656 | ginsenoside F2 | C42H72O13 | 784.4973 | 783.4894 | 783.4823 | 9.1 |
| 22 | 17.680 | ginsenoside Rh4 | C36H60O8 | 620.4288 | 619.4210 | 665.4254 [M−H+HCOOH]− | −1.7 |
| 23 | 17.845 | ginsenoside Rg3 | C42H72O13 | 784.4973 | 783.4894 | 783.4849 | −5.7 |
| 24 | 18.357 | ginsenoside Rk1 | C42H70O12 | 766.4867 | 765.4789 | 765.4812 | 3.0 |
| 25 | 18.398 | ginsenoside Rg5 | C42H70O12 | 766.4867 | 765.4789 | 765.4799 | 1.3 |
| 26 | 18.436 | compound K | C36H62O8 | 622.4445 | 621.4366 | 621.4358 | −1.2 |
| 27 | 18.564 | ginsenoside Rh2 | C36H62O8 | 622.4445 | 621.4366 | 667.4415 | −0.9 |
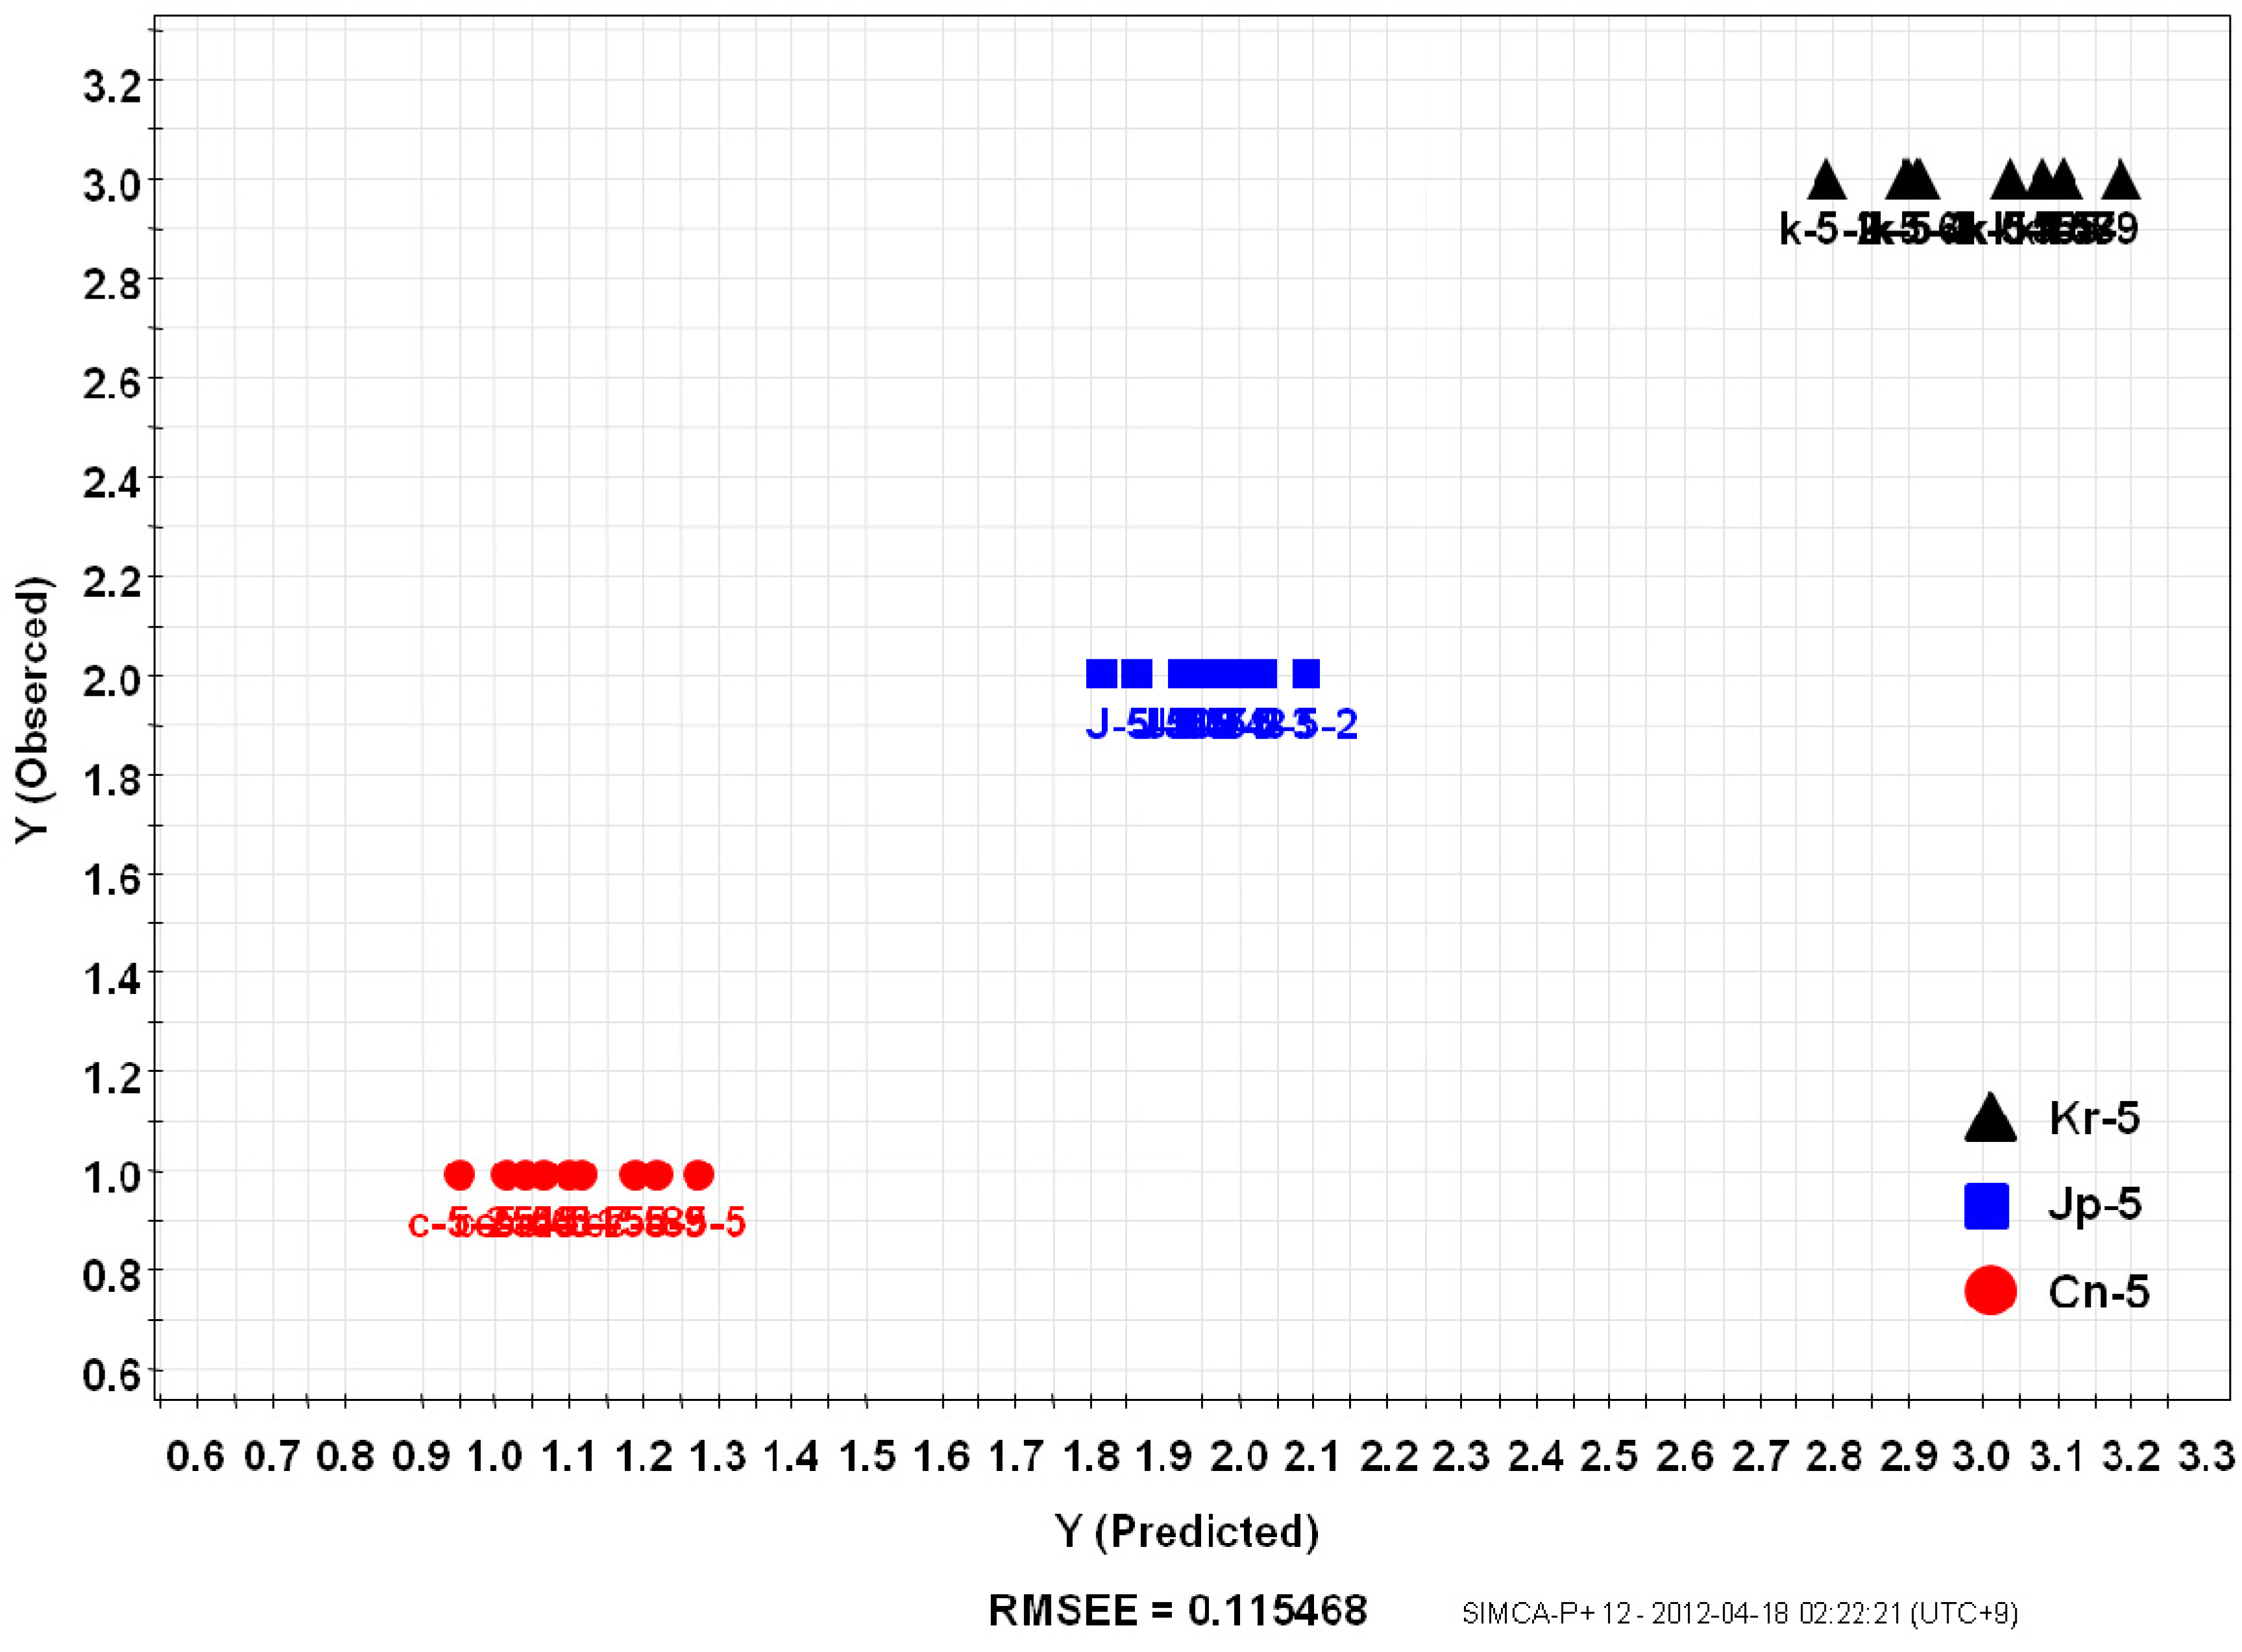
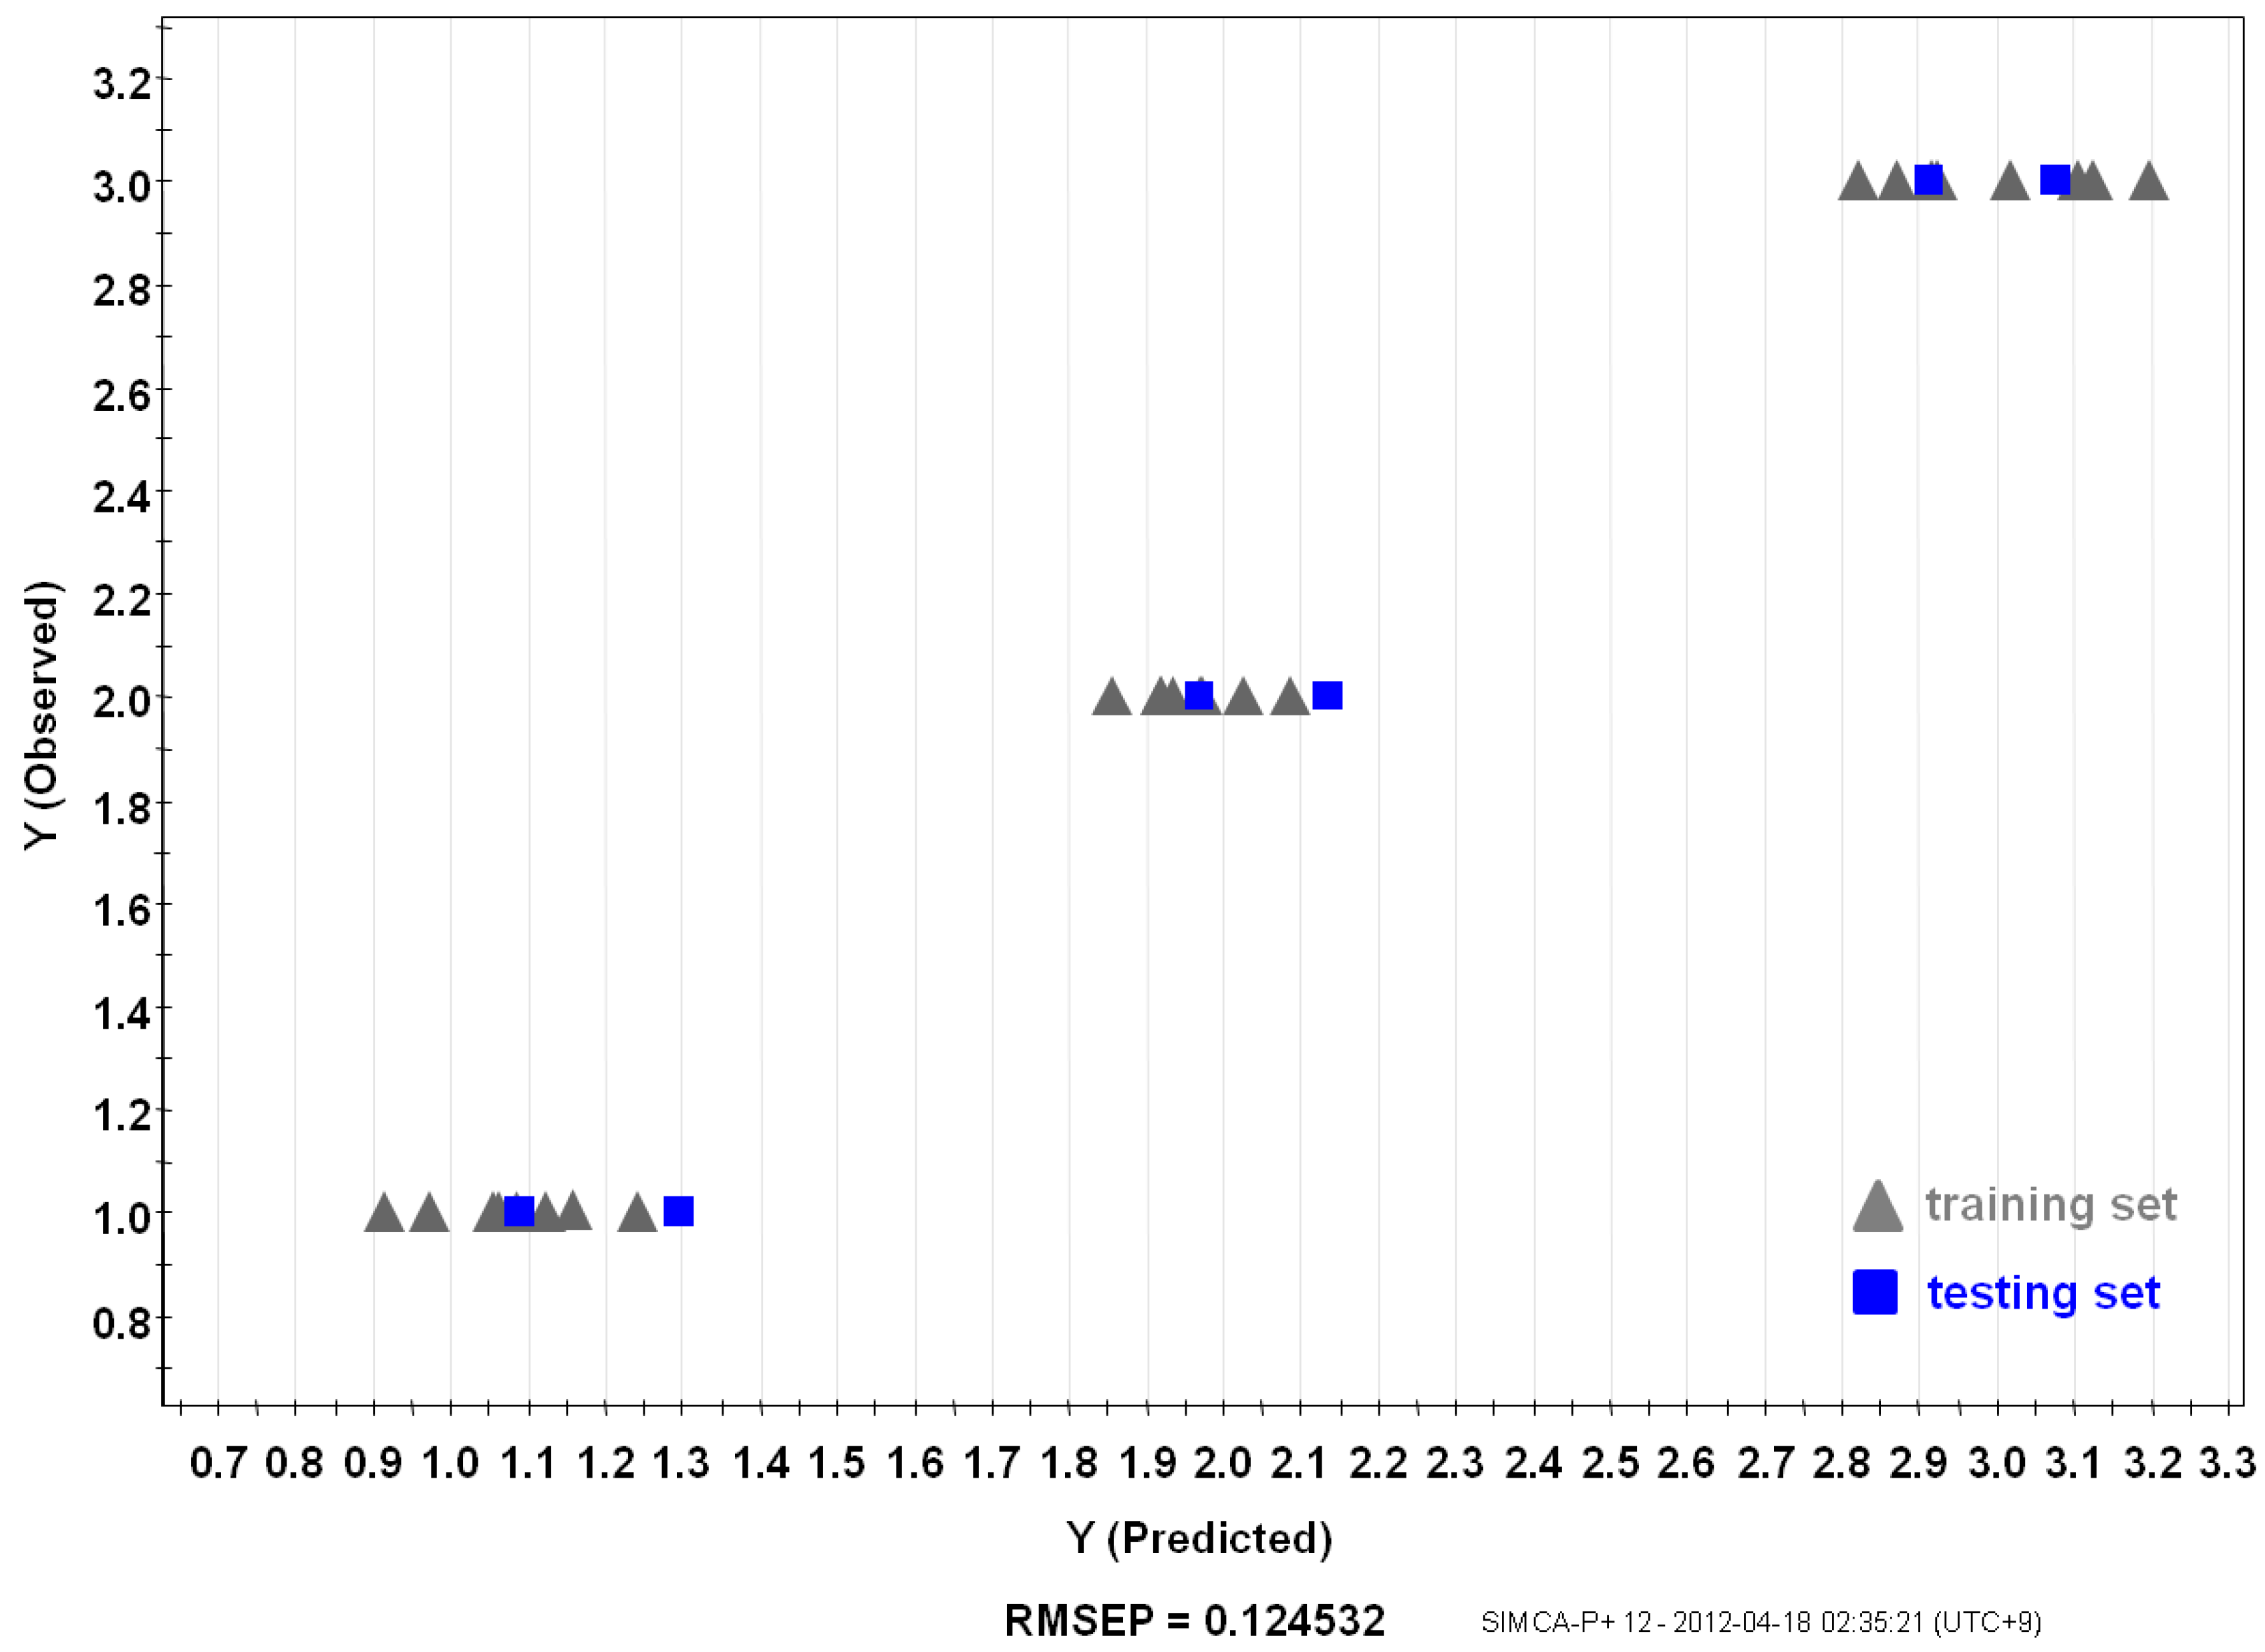
2.3. Prediction of Ginseng Origin with PLS


3. Experimental
3.1. Panax ginseng Samples
3.2. Standard Constituents and Reagents
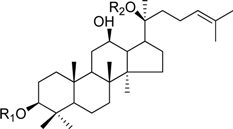
| Chemical structures | Saponins | R1 | R2 |
|---|---|---|---|
 | ginsenoside Rb1 | -Glc2-Glc | -Glc6-Glc |
| ginsenoside Ra2 | -Glc2-Glc | -Glc6-Ara(f)2-Xyl | |
| ginsenoside Ra3 | -Glc2-Glc | -Glc6-Glc3-Xyl | |
| ginsenoside Rc | -Glc2-Glc | -Glc6-Ara(p) | |
| ginsenoside Ra1 | -Glc2-Glc | -Glc6-Ara(p)4-Xyl | |
| ginsenoside Rb2 | -Glc2-Glc | -Glc6-Ara(f) | |
| ginsenoside Rb3 | -Glc2-Glc | -Glc6-Xyl | |
| ginsenoside Rd | -Glc2-Glc | -Glc | |
| ginsenoside F2 | -Glc | -Glc | |
| ginsenoside Rg3 | -Glc2-Glc | -Glc6-Glc | |
| compound K | -H | -Glc | |
| ginsenoside Rh2 | -Glc | -H | |
 | 20-O-gluco-ginsenoside Rf | -Glc2-Glc | -Glc |
| ginsenoside Rg1 | -Glc | -Glc | |
| ginsenoside Rg2 | -Glc2-Rha | -H | |
| ginsenoside Re | -Glc2-Rha | -Glc | |
| ginsenoside Rf | -Glc2-Glc | -OH | |
| ginsenoside Rh1 | -Glc | -H | |
| notoginsenoside R2 | -Glc2-Xyl | -H | |
| ginsenoside F1 | -OH | -Glc | |
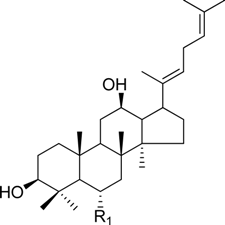 | ginsenoside Rg6 | -Glc2-Rha | |
| ginsenoside Rk3 | -Glc | ||
 | ginsenoside F4 | -H | -Glc2-Rha |
| ginsenoside Rh4 | -H | -Glc | |
| ginsenoside Rg5 | -Glc2-Glc | -H | |
 | Ginsenoside Rk1 | -Glc2-Glc | |
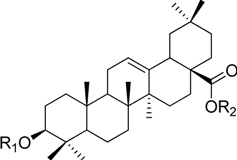 | Ginsenoside Ro | -GlcU2-Glc | -Glc |
3.3. Sample Preparation
3.4. RRLC-QTOF-MS Analysis
3.5. Data Preprocessing
3.6. Multivariate Analysis
4. Conclusions
Supplementary Materials
Acknowledgments
Conflicts of Interest
References and Notes
- Akerele, O. WHO guideline for assessment of herbal medicines. Fitoterapia 1992, 63, 99–118. [Google Scholar]
- Cicero, A.F.G.; Vitale, G.; Savino, G.; Arletti, R. Panax notoginseng (Burk.) effects on fibrinogen and lipid plasma level in rats fed on a high-fat diet. Phytother. Res. 2003, 17, 174–178. [Google Scholar] [CrossRef]
- Kim, A.J.; Kang, S.J.; Lee, K.H.; Lee, M.S.; Ha, S.D.; Cha, Y.S.; Kim, S.Y. The chemopreventive potential and anti-inflammatory activities of Korean black ginseng in colon 26-M3.1 carcinoma cells and macrophages. J. Korean Soc. Appl. Biol. Chem. 2010, 53, 101–105. [Google Scholar]
- Sun, H.; Yang, Z.; Ye, Y. Structure and biological activity of protopanaxatriol-type saponins from the roots of Panax notoginseng. Int. Immunopharmacol. 2005, 6, 14–25. [Google Scholar]
- Li, W.; Fitzolff, J.F. HPLC with evaporative light scattering detection as a tool to distinguish Asian ginseng (Panax ginseng) and North American ginseng (Panax quinquefolius). J. Liq. Chromatogr. Relat. Technol. 2002, 25, 17–27. [Google Scholar] [CrossRef]
- Yuan, C.S.; Wang, X.; Wu, J.A.; Attele, A.S.; Xie, J.T.; Gu, M. Effects of Panax quinquefolius L. on brainstem neuronal activities: Comparison between Wisconsin-cultivated and Illinois-cultivated roots. Phytomedicine 2001, 8, 178–183. [Google Scholar] [CrossRef]
- Yoshida, T.; Majors, R.E. High-speed analyses using rapid resolution liquid chromatography on 1.8-μm porous particles. J. Sep. Sci. 2006, 29, 2421–2432. [Google Scholar] [CrossRef]
- Nguyen, D.T.T.; Guillarme, D.; Rudaz, S.; Veuthey, J.L. Validation of an ultra-fast UPLC-UV method for the separation of antituberculosis tablets. J. Sep. Sci. 2008, 31, 1050–1056. [Google Scholar]
- Tolonen, A.; Uusitalo, J. Fast screening method for the analysis of total flavonoid content in plants and foodstuffs by high-performance liquid chromatography/electrospray ionization time-of-flight mass spectrometry with polarity switching. Rapid Commun. Mass Spectrom. 2004, 18, 3113–3122. [Google Scholar] [CrossRef]
- Xia, L.; Liu, H.L.; Li, P.; Zhou, J.L.; Qi, L.W.; Yi, L.; Chen, J. Rapid and sensitive analysis of multiple bioactive constituents in compound Danshen preparations using LC-ESI-TOF-MS. J. Sep. Sci. 2008, 31, 3156–3169. [Google Scholar] [CrossRef]
- Eriksson, L.; Johansson, E.; Kettaneh-Wold, N.; Wold, S. Multi and Megavariate Data Analysis; Umetrics Acad: Umea, Sweden, 2006. [Google Scholar]
- Cho, J.G.; Lee, M.K.; Lee, J.W.; Park, H.J.; Lee, D.Y.; Lee, Y.H.; Yang, D.C.; Baek, N.I. Physicochemical characterization and NMR assignments of ginsenosides Rb1, Rb2, Rc, and Rd isolated from Panax ginseng. J. Ginseng Res. 2010, 34, 113–121. [Google Scholar] [CrossRef]
- Zhu, G.Y.; Li, Y.W.; Hau, D.K.-P.; Jiang, Z.H.; Yu, Z.-L.; Fong, W.-F. Acylated protopanaxadiol-type ginsenosides from the root of Panax ginseng. Chem. Biodiver. 2011, 8, 1853–1863. [Google Scholar] [CrossRef]
- Sanada, S.; Shoji, J. Studies on the saponins of ginseng III. Structures of ginsenoside-Rb3 and 20-glucoginsenoside-Rf. Chem. Pharm. Bull. 1978, 26, 1694–1697. [Google Scholar] [CrossRef]
- Ko, S.R.; Suzuki, Y.; Suzuki, K.; Choi, K.J.; Cho, B.G. Marked production of ginsenosides Rd, F2, Rg3, and compound K by enzymatic method. Chem. Pharm. Bull. 2007, 55, 1522–1527. [Google Scholar] [CrossRef]
- Baek, N.I.; Kim, D.S.; Lee, Y.H.; Park, J.D.; Jeong, S.Y.; Lee, C.B.; Kim, S.I. Complete assignment of 1H- and 13C-NMR signals for (20S)- and (20R)-ginsenoside Rh2 by 2D-NMR techniques. J. Korean Soc. Appl. Biol. Chem. 1995, 38, 184–189. [Google Scholar]
- Teng, R.; Li, H.; Chen, J.; Wang, D.; He, Y.; Yang, C. Complete assignments of 1H and 13C NMR data for nine protopanaxatriol glycosides. Magn. Reson. Chem. 2002, 40, 483–488. [Google Scholar] [CrossRef]
- Zhou, J.; Wu, M.Z.; Taniyasu, S.; Besso, H.; Tanaka, O.; Saruwatari, Y.; Fuwa, T. Dammarane-saponins of Sanchi-ginseng, roots of Panax notoginseng (BURK.) F.H. CHEN (Araliaceae): Structures of new saponins, notoginsenosides-R1 and -R2, and identification of ginsenosides-Rg2 and -Rh1. Chem. Pharm. Bull. 1981, 29, 2844–2850. [Google Scholar] [CrossRef]
- Ko, S.R.; Choi, K.J.; Suzuki, K.; Suzuki, Y. Enzymatic preparation of ginsenosides Rg2, Rh1, and F1. Chem. Pharm. Bull. 2003, 51, 404–408. [Google Scholar] [CrossRef]
- Liu, G.Y.; Li, X.W.; Wang, N.B.; Zhou, H.Y.; Wei, W.; Gui, M.Y.; Yang, B.; Jin, Y.-R. Three new dammarane-type triterpene saponins from the leaves of Panax ginseng C.A. Meyer. J. Asian Nat. Prod. Res. 2010, 12, 865–873. [Google Scholar]
- Park, I.H.; Kim, N.Y.; Han, S.B.; Kim, J.M.; Kwon, S.W.; Kim, H.J.; Park, M.K.; Park, J.H. Three new dammarane glycosides from heat processed ginseng. Arch. Pharm. Res. 2002, 25, 428–432. [Google Scholar] [CrossRef]
- Wang, Z.; Jia, Z.J.; Zhu, Z.Q.; Yang, C.R.; Zhou, J.; Ryoji, K. The triterpenoid saponins of rhizomes of Panax japonicus C. A. Meyer var. Angustifolius (burk.) Cheng et Chu. Acta Bot. Sin. 1985, 27, 618–621. [Google Scholar]
- Zhang, S.; Takeda, T.; Zhu, T.; Chen, Y.; Yao, X.; Tanaka, O.; Ogihara, Y. A new minor saponin from the leaves of Panax ginseng. Planta Med. 1990, 56, 298–300. [Google Scholar]
- Kim, S.I.; Park, J.H.; Ryu, J.H.; Park, J.D.; Lee, Y.H.; Park, J.H.; Kim, T.H.; Kim, J.M.; Baek, N.I. Ginsenoside Rg5, a genuine dammarane glycoside from Korean red ginseng. Arch. Pharm. Res. 1996, 19, 551–553. [Google Scholar] [CrossRef]
- Pluskal, T.; Castillo, S.; Villar-Briones, A.; Oresic, M. MZmine 2: modular framework for processing, visualizing, and analyzing mass spectrometry-based molecularprofile data. BMC Bioinform. 2010, 11, 52–78. [Google Scholar] [CrossRef]
- Sample Availability: Not available.
© 2013 by the authors; licensee MDPI, Basel, Switzerland. This article is an open access article distributed under the terms and conditions of the Creative Commons Attribution license (http://creativecommons.org/licenses/by/3.0/).
Share and Cite
Lee, D.-Y.; Kim, J.K.; Shrestha, S.; Seo, K.-H.; Lee, Y.-H.; Noh, H.-J.; Kim, G.-S.; Kim, Y.-B.; Kim, S.-Y.; Baek, N.-I. Quality Evaluation of Panax ginseng Roots Using a Rapid Resolution LC-QTOF/MS-Based Metabolomics Approach. Molecules 2013, 18, 14849-14861. https://doi.org/10.3390/molecules181214849
Lee D-Y, Kim JK, Shrestha S, Seo K-H, Lee Y-H, Noh H-J, Kim G-S, Kim Y-B, Kim S-Y, Baek N-I. Quality Evaluation of Panax ginseng Roots Using a Rapid Resolution LC-QTOF/MS-Based Metabolomics Approach. Molecules. 2013; 18(12):14849-14861. https://doi.org/10.3390/molecules181214849
Chicago/Turabian StyleLee, Dae-Young, Jae Kwang Kim, Sabina Shrestha, Kyeong-Hwa Seo, Youn-Hyung Lee, Hyung-Jun Noh, Geum-Soog Kim, Yong-Bum Kim, Seung-Yu Kim, and Nam-In Baek. 2013. "Quality Evaluation of Panax ginseng Roots Using a Rapid Resolution LC-QTOF/MS-Based Metabolomics Approach" Molecules 18, no. 12: 14849-14861. https://doi.org/10.3390/molecules181214849