2.1. Surface Characterisation of Plasma-Treated Samples
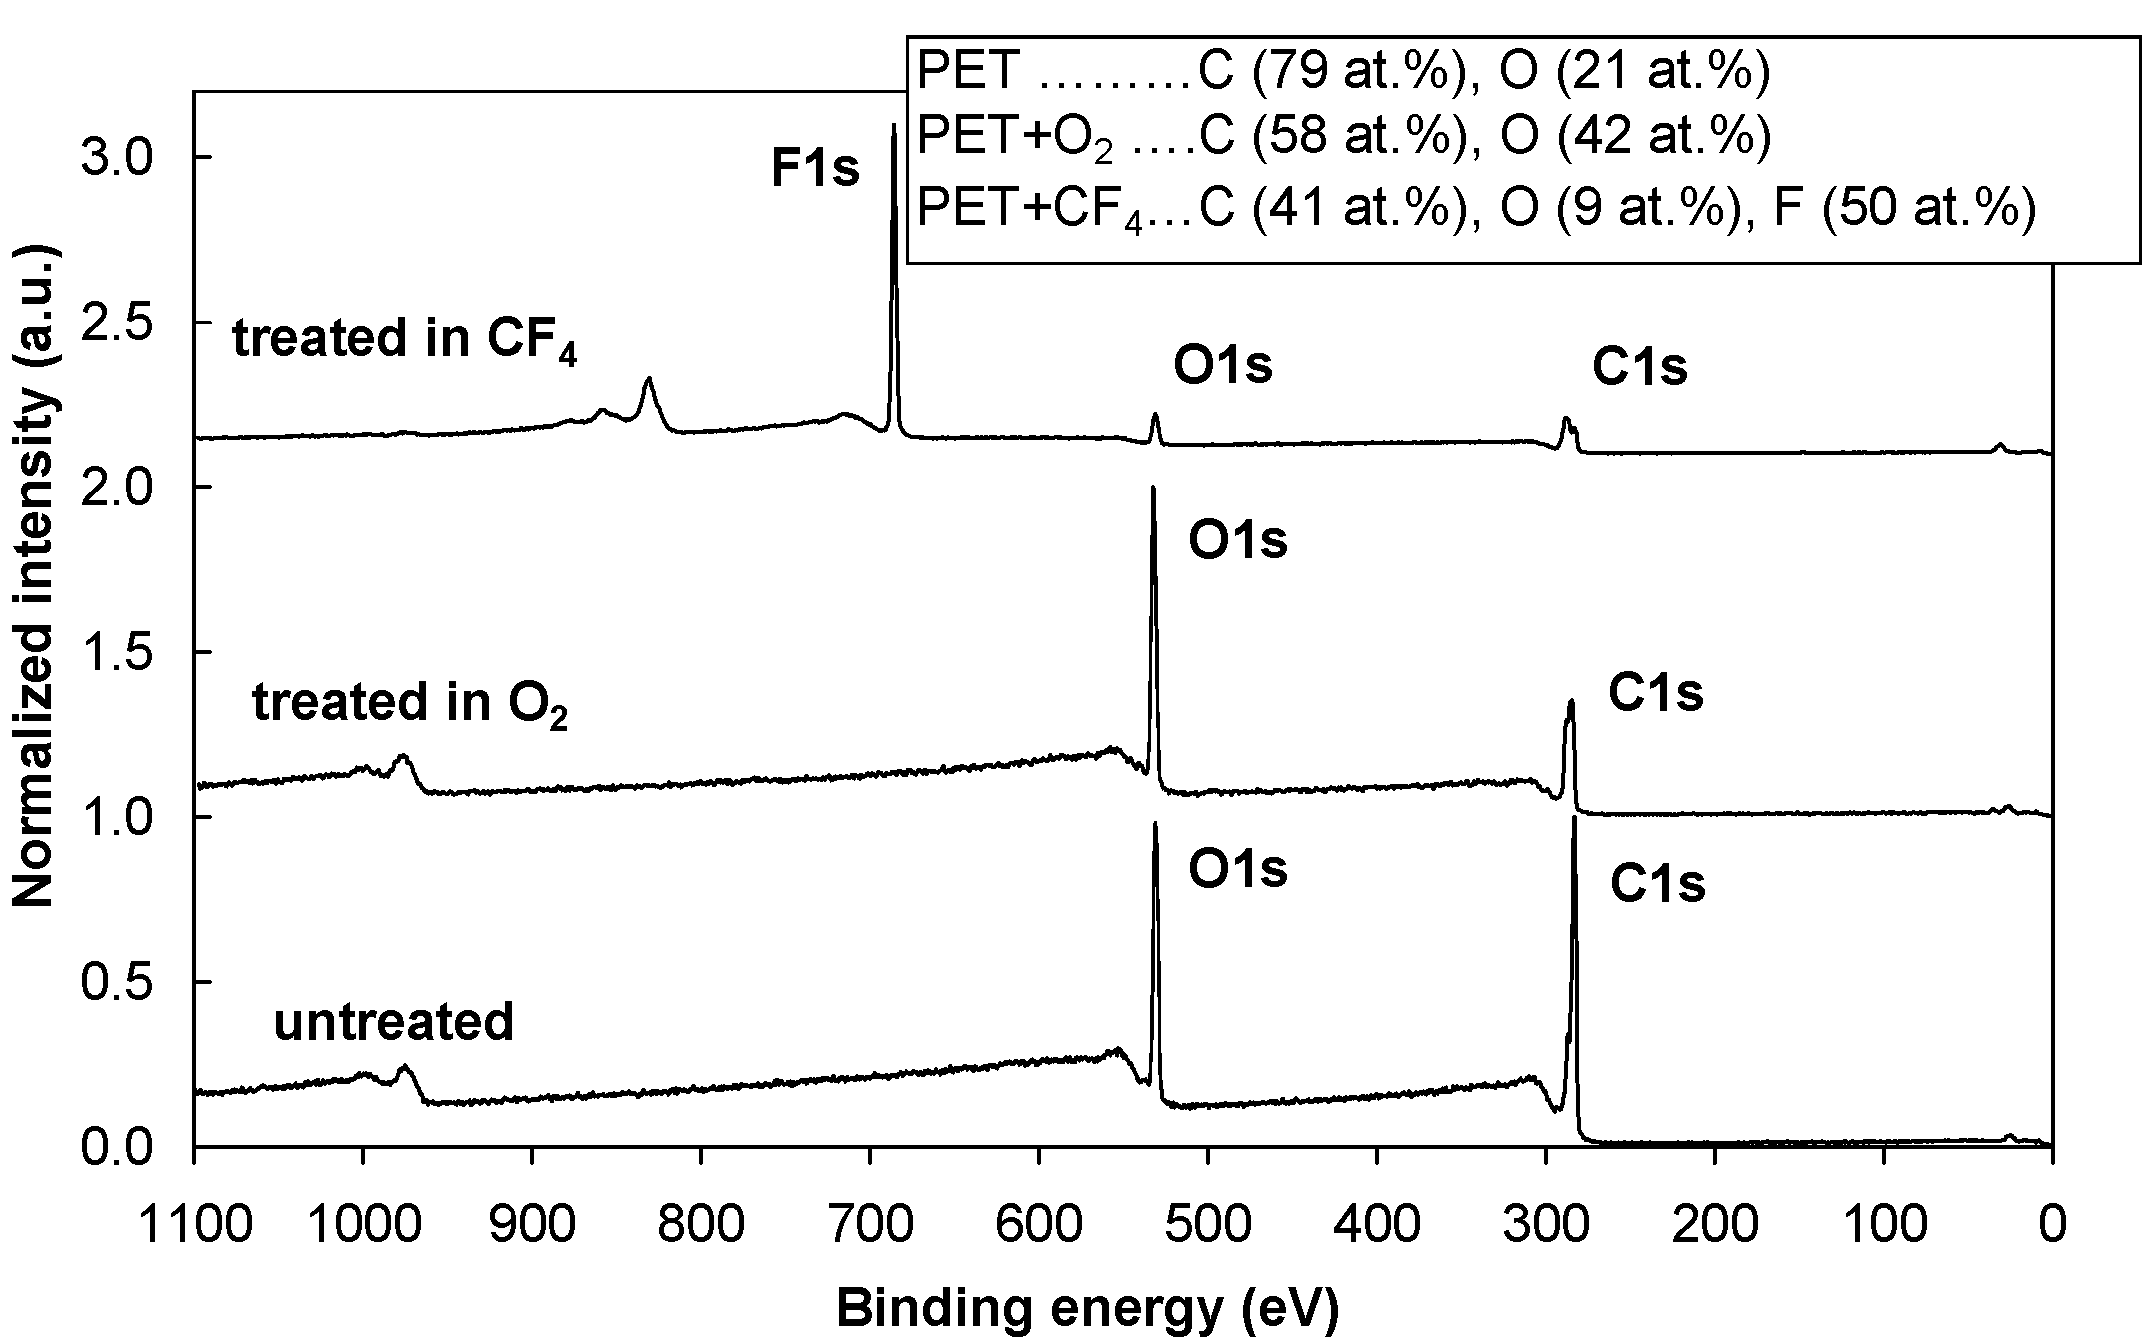
Figure 1 shows an XPS survey spectrum for the control (untreated) PET sample and the PET samples treated in oxygen (O
2) and tetrafluoromethane (CF
4) plasmas. After the oxygen plasma treatment, the oxygen concentration on the surface doubled. Treating the polymer in CF
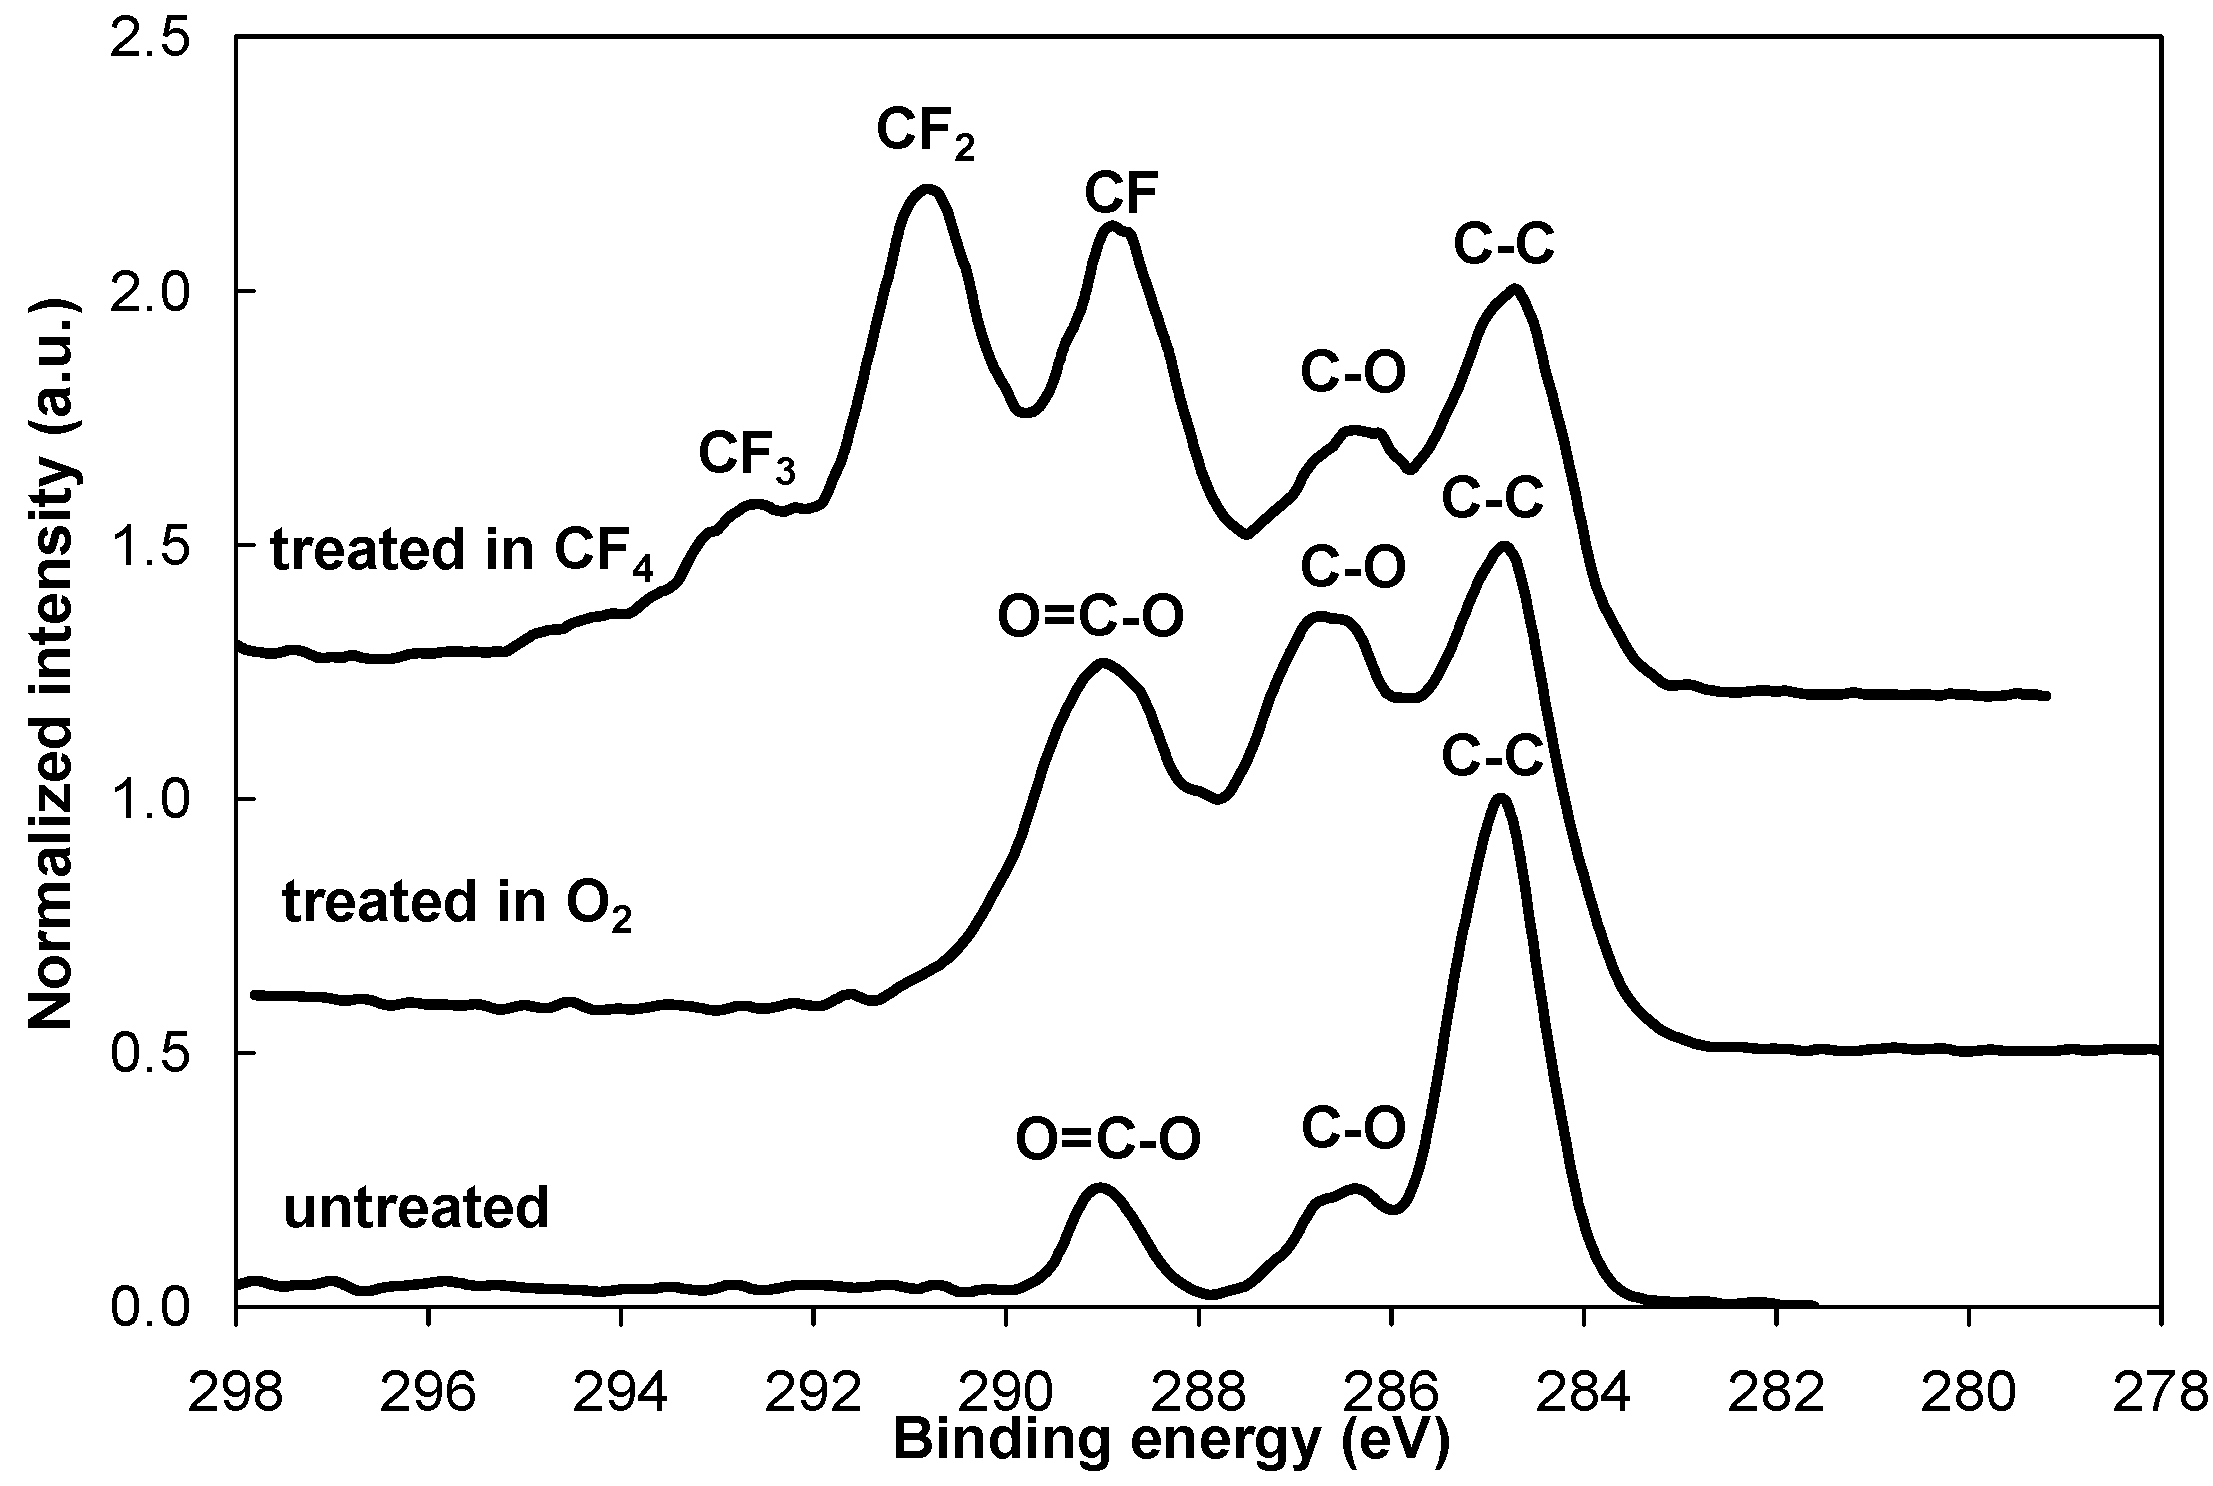
4 plasma significantly reduced the oxygen concentration, and approximately 50 atomic % of fluorine is found. The incorporation of oxygen and fluorine species into the polymer surface during the plasma treatment resulted in the formation of different functional groups. As shown in
Figure 2, the intensity of the peaks from C–O and O=C–O groups increased after the oxygen plasma treatment. Different fluorine groups are observed for the CF
4 plasma treatment. The majority are CF
2 groups, followed by CF groups and CF
3 in smaller concentrations. Our results for both plasma treatments are consistent with previously published results [
15,
16,
28,
29,
30,
31]. The functional groups formed after treatments also alter the surface wettability. Therefore, O
2 plasma treatment resulted in a very hydrophilic surface with a contact angle of only a few degrees, while CF
4 plasma treatment resulted in the formation of a hydrophobic surface with a contact angle of 110°.
Figure 1.
XPS survey spectra for the control (untreated) PET sample and for PET samples treated in O2 and CF4 plasma.
Figure 1.
XPS survey spectra for the control (untreated) PET sample and for PET samples treated in O2 and CF4 plasma.
Figure 2.
XPS high-resolution spectra of carbon C1s for the control PET sample and for the PET samples treated in O2 and CF4 plasma.
Figure 2.
XPS high-resolution spectra of carbon C1s for the control PET sample and for the PET samples treated in O2 and CF4 plasma.
2.2. Surface Characterisation of the Adsorbed Protein Layer
Plasma-treated samples were incubated in various protein solutions,
i.e., a pure albumin (ALB) solution and a protein mixture used as a cell culture medium (FCS/DMEM), for different periods: 1, 10, 100 and 1,000 s.
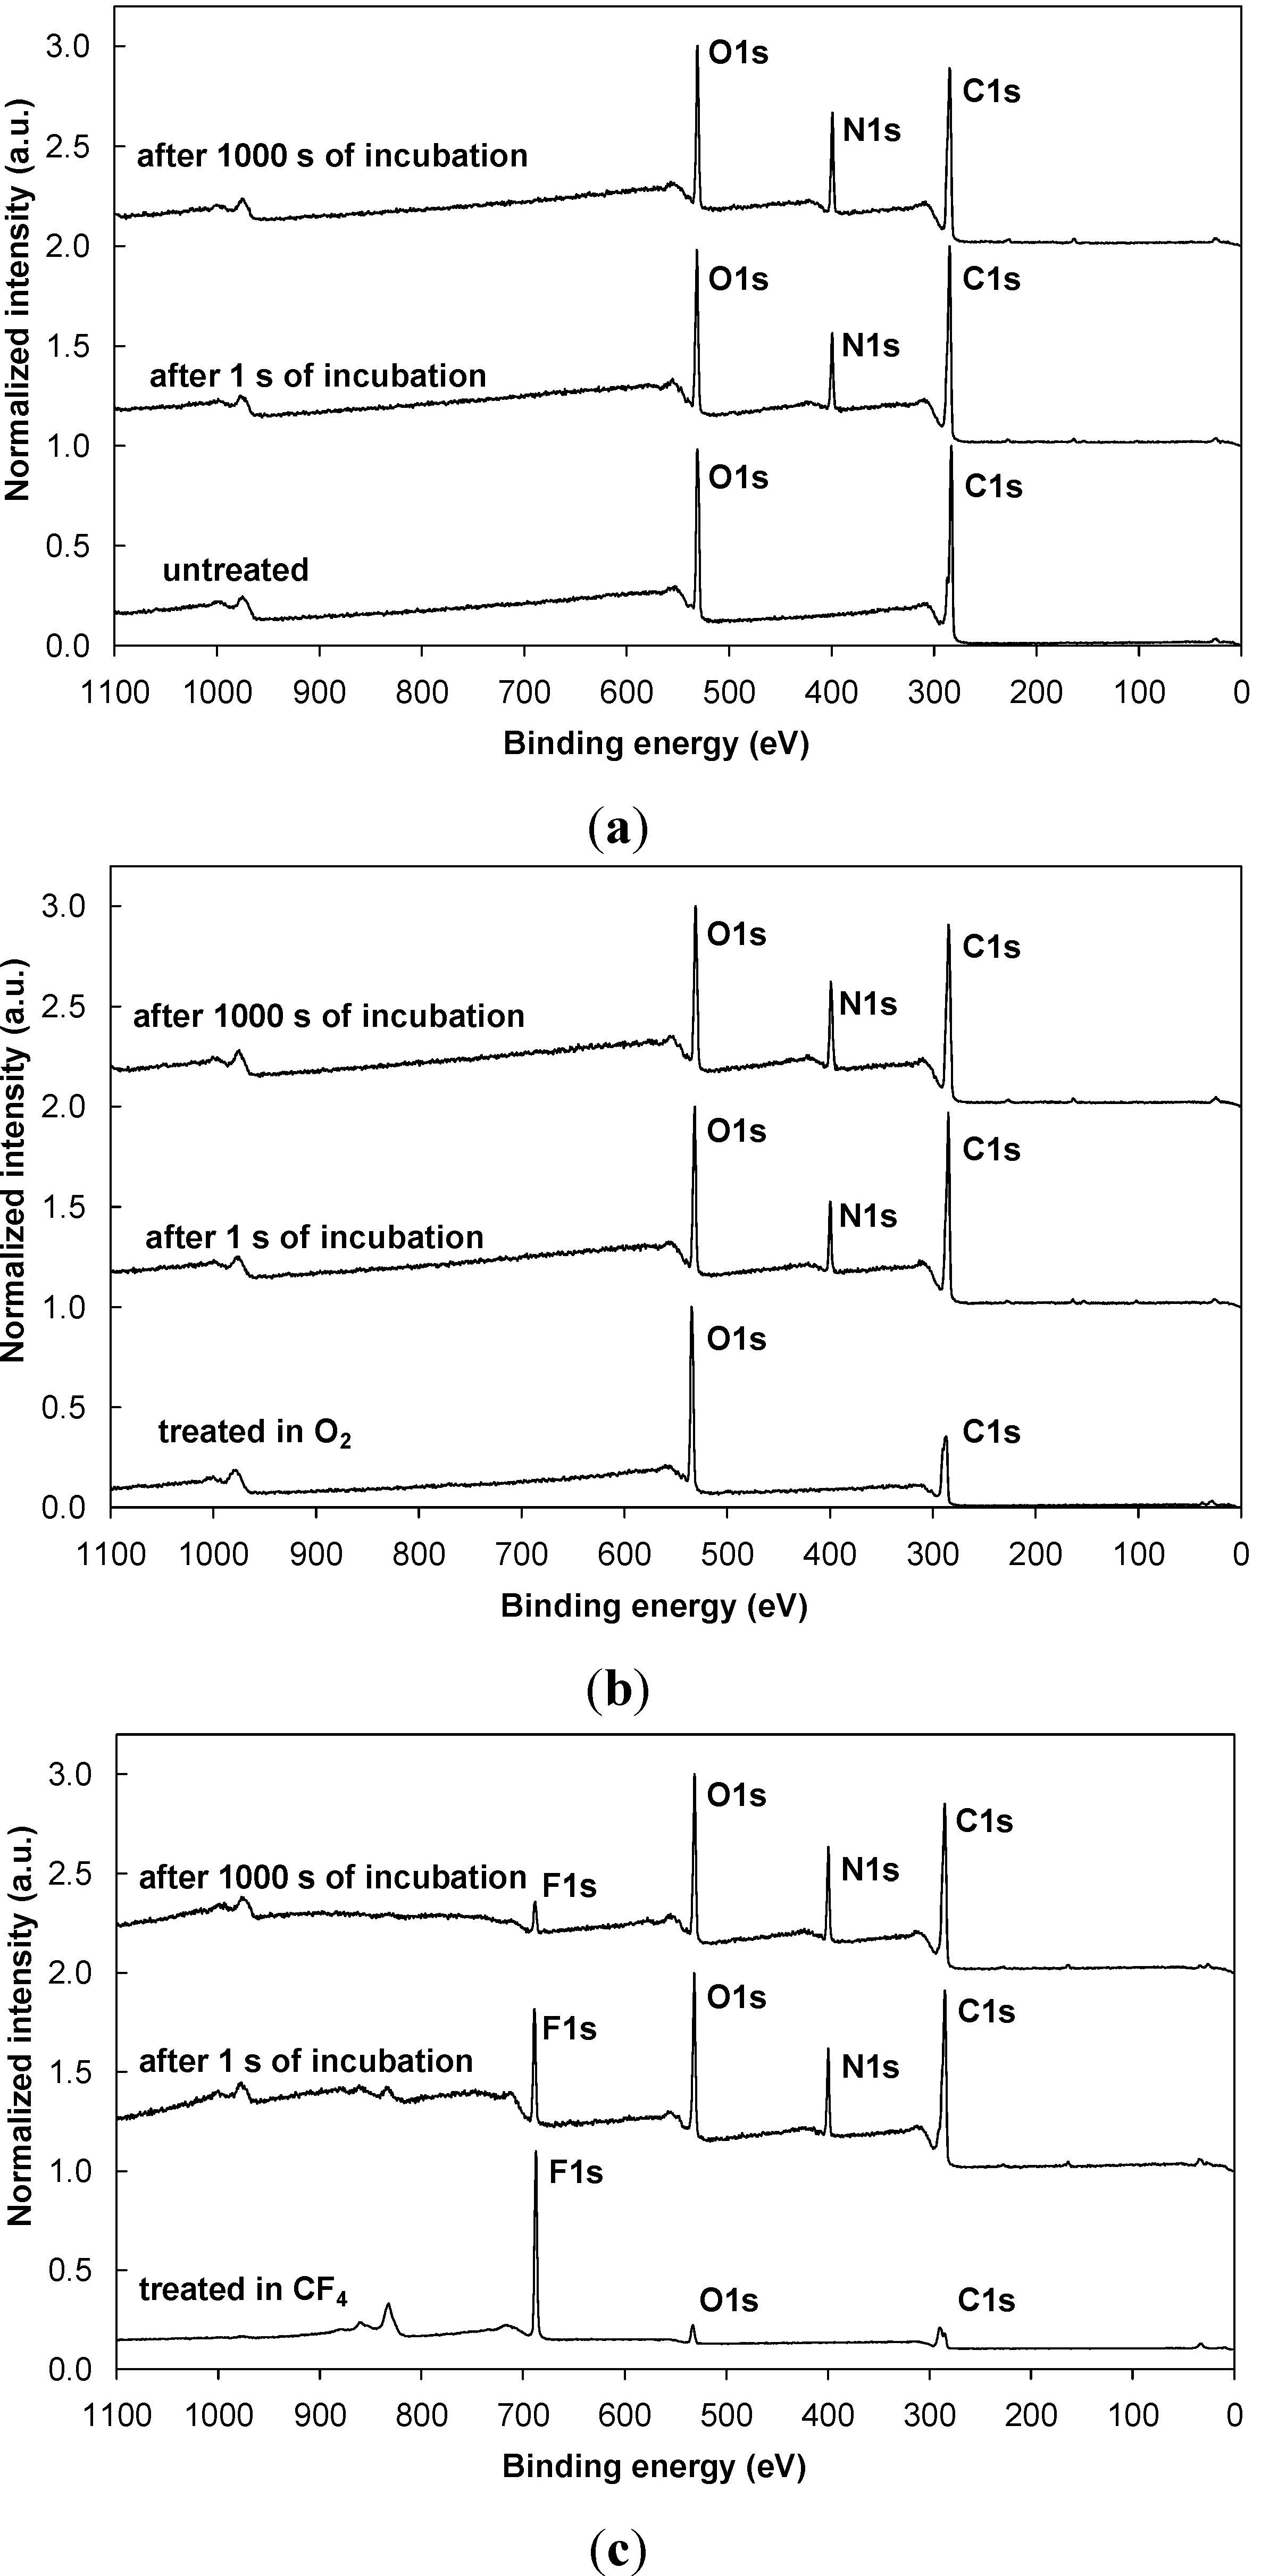
Figure 3 shows typical XPS survey spectra for albumin adsorption for the shortest (1 s) and the longest (1,000 s) incubation times. Similar spectra were also observed for the FCS/DMEM solution.
Figure 3a shows typical spectra for albumin adsorption on the untreated sample (control sample), while
Figure 3b,c show the spectra for the samples treated in O
2 and CF
4 plasma, respectively.
Figure 3a clearly shows the formation of a new peak after the incubation of the untreated sample in a protein solution; this peak is caused by the nitrogen that originates from the adsorbed albumin layer, regardless of whether the sample was exposed to the protein solution for 1 s or 1,000 s. Results similar to those obtained for the control samples were also observed for the plasma-treated samples—
i.e., a nitrogen peak appeared as a result of the adsorbed protein. Supplementing the information in
Figure 3,
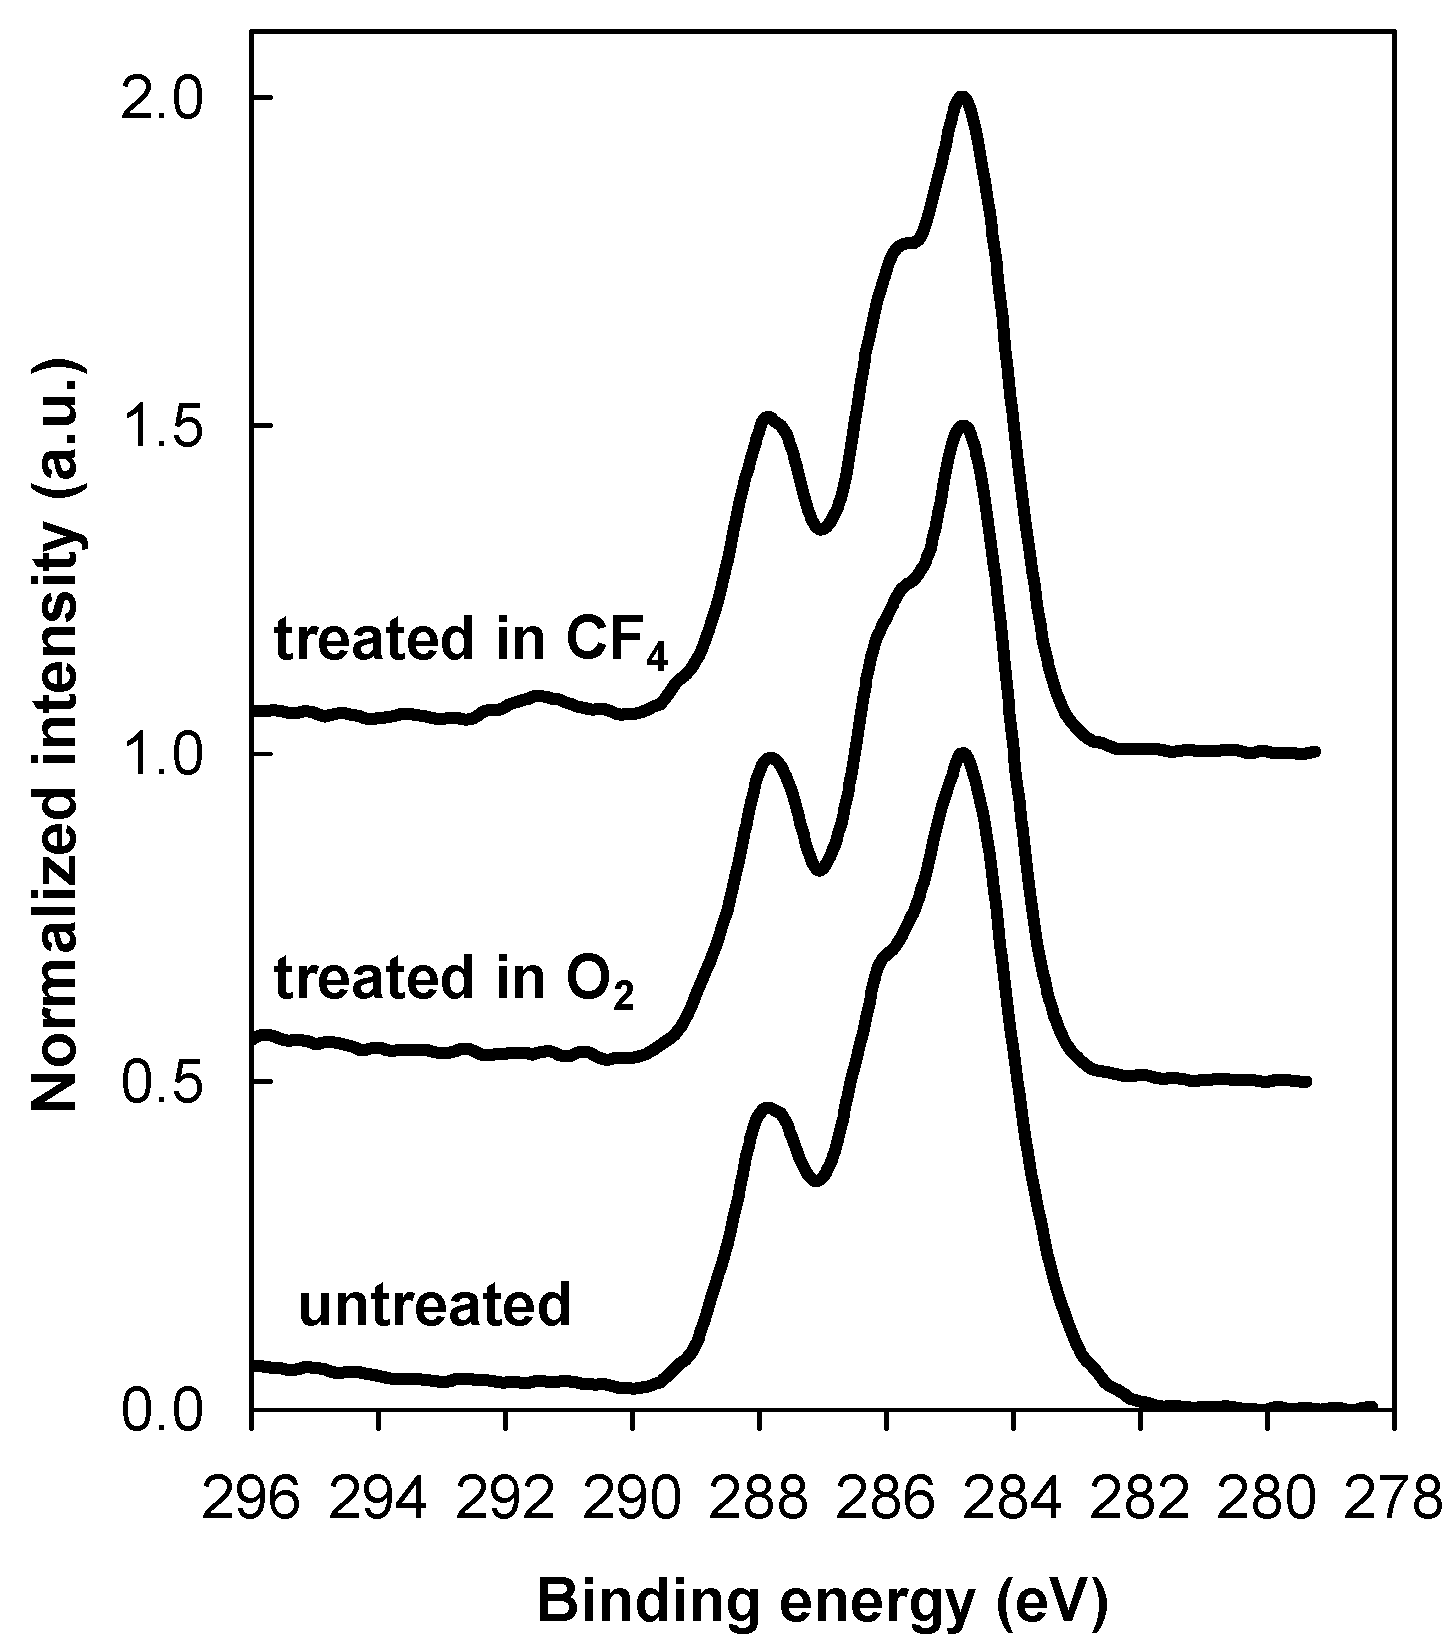
Figure 4 shows the high-resolution XPS spectra of the carbon peak recorded from the untreated sample and both plasma-treated samples after 1,000 s of incubation.
Figure 4 shows that there is no pre-treatment difference between the various samples. In all cases, the shape of the spectrum is similar and typical for proteins and shows the presence of peptide and amine groups. Comparing
Figure 4 with
Figure 2 indicates that after 1,000 s of incubation, a layer of protein almost completely masks the plasma-treated substrate, because functional groups from the plasma-treated substrate are no longer visible.
Figure 3 shows another interesting phenomenon. The CF
4 plasma-treated sample still contains a fluorine peak that originates from the plasma-treated layer (
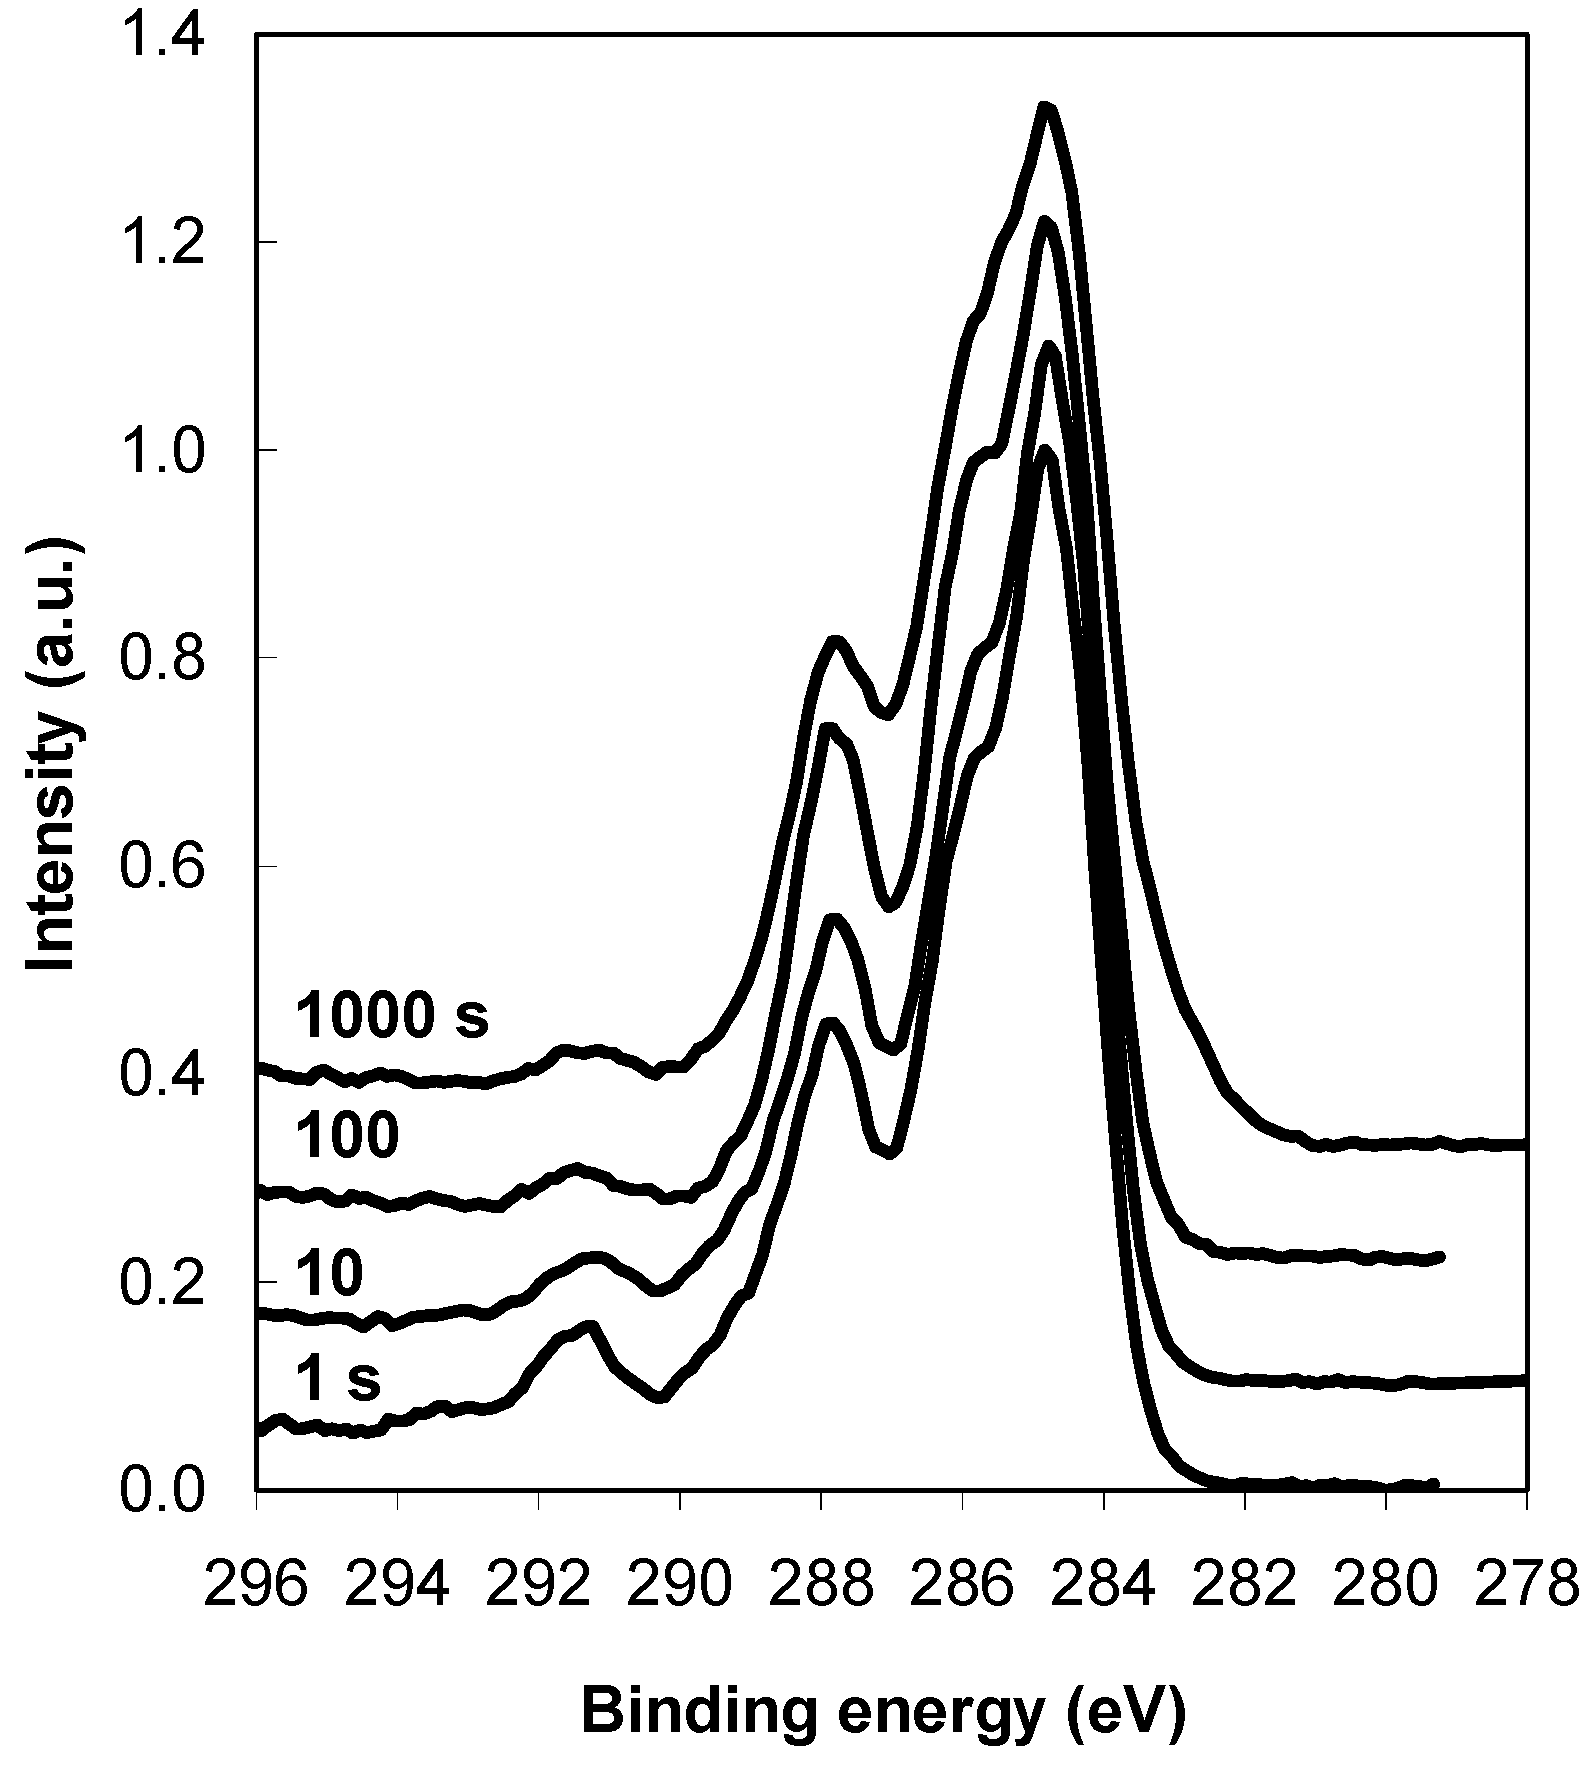
Figure 3c). This finding indicates that the adsorbed protein layer is thinner than the detection depth of XPS. Supplementing the information in
Figure 3c and
Figure 5a compares the high–resolution carbon peaks for various incubation times for the CF
4 plasma-treated PET sample. In addition to the typical protein peaks, another small peak is positioned near the 292 eV binding energy. This peak is due to the CF
2 groups from the interface between the protein coating and the plasma-treated substrate (this peak was the most significant on the plasma-treated sample shown in
Figure 2). Thus, in agreement with the XPS survey spectra (
Figure 3c), we can therefore also observe traces of fluorine peaks in the high-resolution spectra shown in
Figure 5.
Figure 3.
XPS survey spectrum for: (a) the control (untreated) PET sample before and after incubation for 1 s and 1,000 s; (b) the PET sample treated in O2 plasma before and after incubation for 1 s and 1,000 s and (c) the PET sample treated in CF4 plasma before and after incubation for 1 s and 1,000 s in albumin solution.
Figure 4.
XPS high-resolution spectra of carbon C1s for the untreated sample and both plasma-treated samples after incubation in an albumin solution for 1,000 s.
Figure 4.
XPS high-resolution spectra of carbon C1s for the untreated sample and both plasma-treated samples after incubation in an albumin solution for 1,000 s.
Figure 5.
XPS high-resolution spectra of carbon C1s for the CF4 plasma-treated PET sample after incubation in an albumin solution for various periods.
Figure 5.
XPS high-resolution spectra of carbon C1s for the CF4 plasma-treated PET sample after incubation in an albumin solution for various periods.
From the intensity of the fluorine signal (
Figure 3c), we can roughly estimate the protein layer thickness for the CF
4 plasma-treated sample. The fluorine signal (
IF0) from the interface between the polymer substrate and the protein layer is attenuated by passing through a protein layer with a thickness
d, as described in the following relation [
21]:
where
IF is the measured fluorine signal emerging through the protein layer,
IF0 is the measured fluorine signal of plasma-treated sample without the protein layer,
λ is the inelastic mean free path for F1s electrons passing through the protein layer (~3 nm), and
θ is the electron take-off angle (45°). After rearranging Equation (1), the protein thickness can be calculated from the following:
The protein thickness was calculated for all incubation times and is shown in
Table 1, along with the fluorine concentration and F/C ratio. A lower fluorine signal indicates a thicker protein layer (because some of the signal was lost when passing through the protein layer).
Table 1 shows that the protein thickness first increases with incubation time and later becomes constant. These results refer only to the case of the fluorine plasma-treated sample. For the oxygen plasma-treated sample, it is not possible to calculate the layer thickness because the oxygen originates not only from the polymer but also from the overlying protein. Therefore, additional information about the quantity of adsorbed proteins can be obtained only by QCM.
Table 1.
Fluorine concentration and calculated protein film thickness versus incubation time in albumin solution for the CF4 plasma-treated PET sample.
Table 1.
Fluorine concentration and calculated protein film thickness versus incubation time in albumin solution for the CF4 plasma-treated PET sample.
| t (s) | F (at.%) | F/C | d (nm) |
|---|
| 1 | 8.4 | 0.14 | 1.9 |
| 10 | 4.4 | 0.07 | 4.2 |
| 100 | 2.8 | 0.04 | 5.3 |
| 1000 | 2.7 | 0.04 | 5.3 |
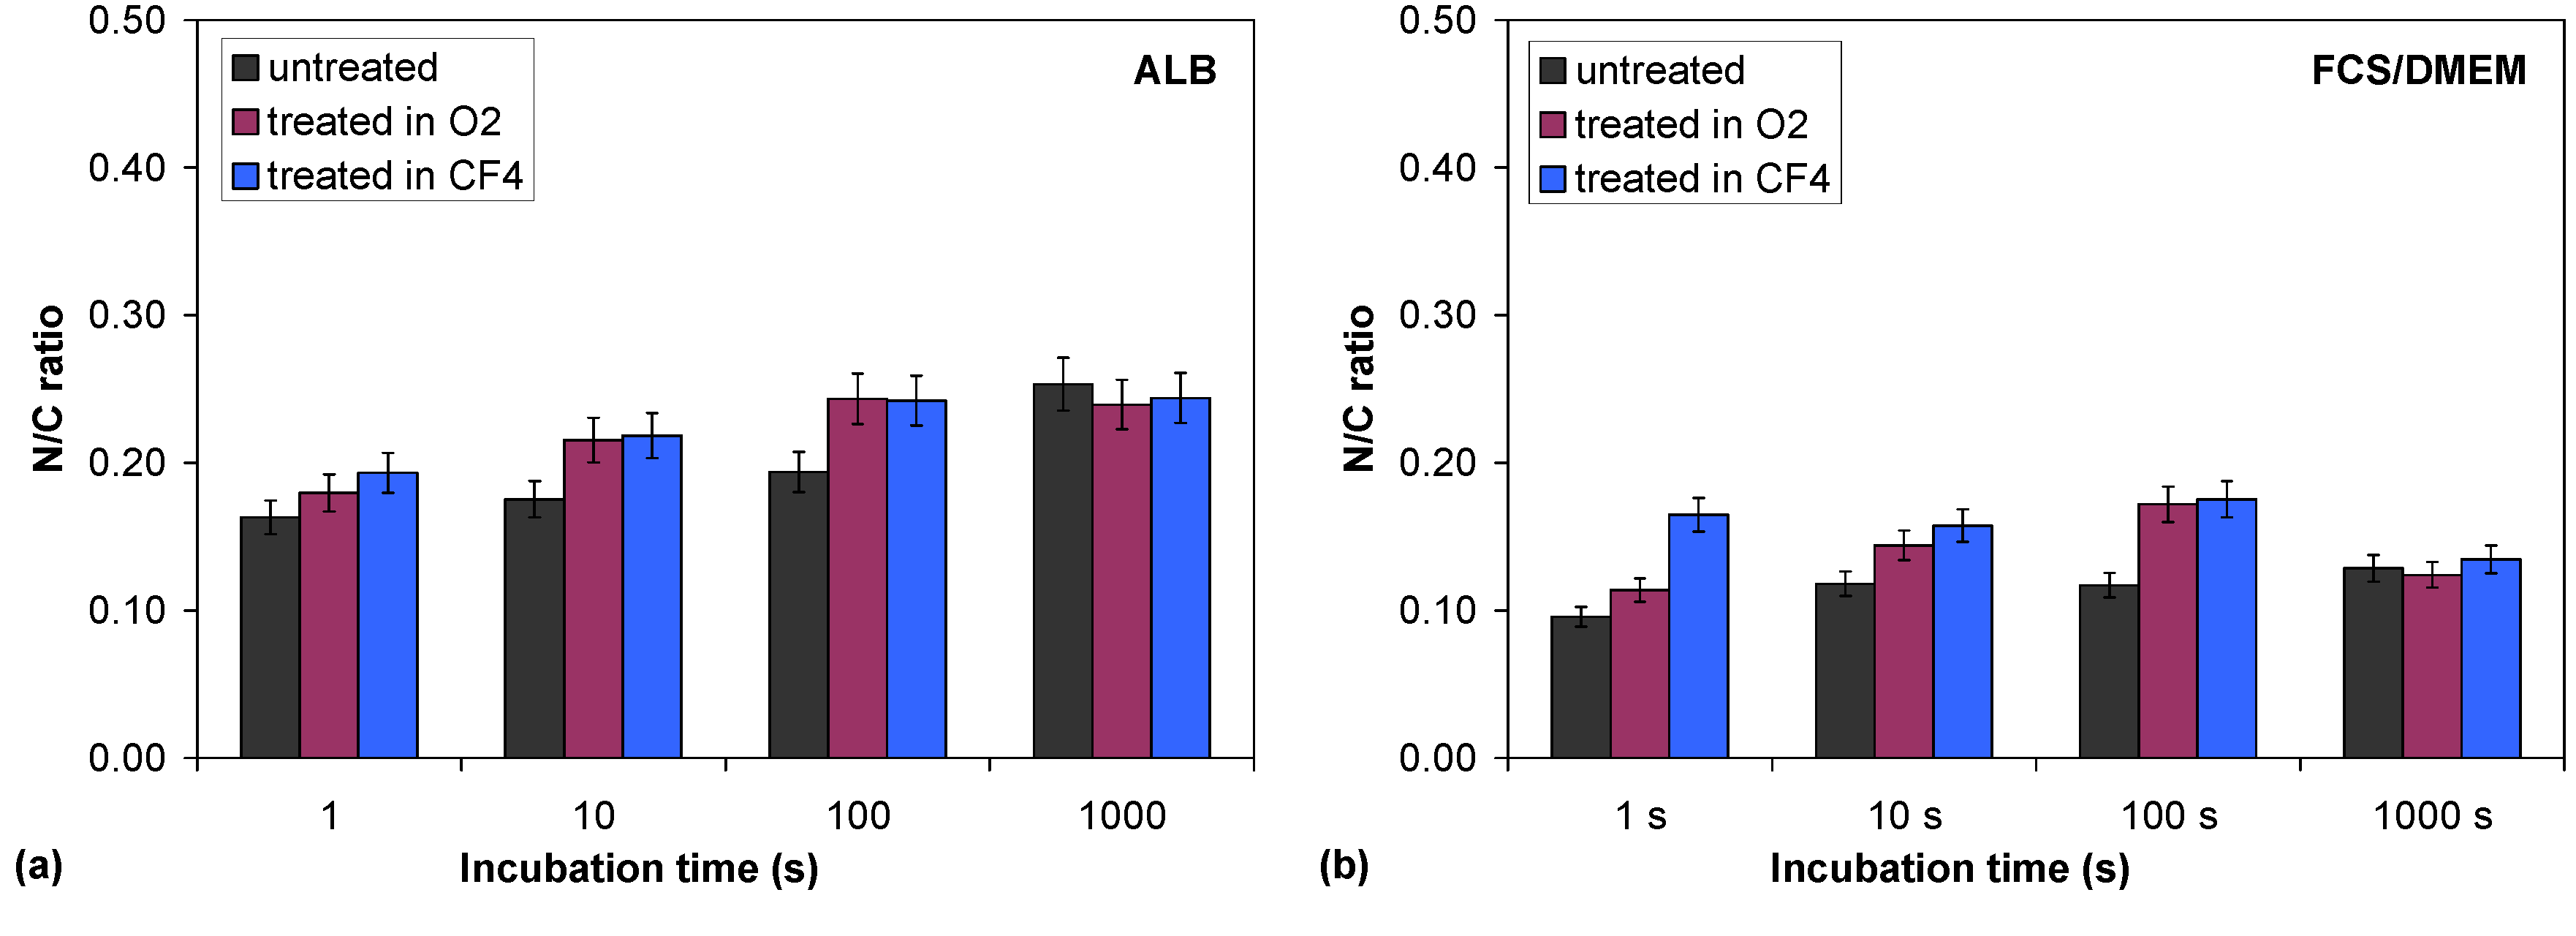
Furthermore, to find additional information about albumin adhesion, the intensity of the nitrogen N1s peak was measured because the nitrogen peak originates only from the adsorbed layer of the protein albumin and not from the polymer substrate. The N/C ratio was calculated for the various samples, and the results are shown in
Table 2 and
Figure 6a. The adsorption of albumin to the polymer surfaces starts very quickly because after just 1 second there is already a substantial amount of nitrogen on the surface. With increasing incubation time, the nitrogen concentration is slightly increased.
Table 2.
Surface composition of the samples after incubation in albumin solution (in atomic %).
Table 2.
Surface composition of the samples after incubation in albumin solution (in atomic %).
| PET ctrl | C | H | O | S | F | N/C |
|---|
| 1 s | 67.2 | 11.0 | 21.3 | 0.6 | / | 0.16 |
| 10 s | 69.8 | 12.2 | 17.5 | 0.5 | / | 0.18 |
| 100 s | 66.6 | 12.9 | 20.1 | 0.5 | / | 0.19 |
| 1000 s | 63.8 | 16.2 | 19.3 | 0.8 | / | 0.25 |
| PET + O2 | C | N | O | S | F | N/C |
| 1 s | 66.1 | 12.0 | 21.3 | 0.6 | / | 0.18 |
| 10 s | 64.3 | 13.8 | 21.3 | 0.6 | / | 0.22 |
| 100 s | 63.6 | 15.5 | 20.2 | 0.7 | / | 0.24 |
| 1000 s | 63.6 | 15.2 | 20.5 | 0.7 | / | 0.24 |
| PET + CF4 | C | N | O | S | F | N/C |
| 1 s | 61.4 | 11.9 | 17.7 | 0.7 | 8.4 | 0.19 |
| 10 s | 61.9 | 13.5 | 17.7 | 0.6 | 4.4 | 0.22 |
| 100 s | 61.8 | 15.0 | 19.8 | 0.7 | 2.8 | 0.24 |
| 1000 s | 61.9 | 15.1 | 19.7 | 0.7 | 2.7 | 0.24 |
Figure 6.
Comparison of the N/C ratio after incubation of untreated PET samples and O2 and CF4 plasma-treated samples in albumin solution (a) and FCS/DMEM solution (b).
Figure 6.
Comparison of the N/C ratio after incubation of untreated PET samples and O2 and CF4 plasma-treated samples in albumin solution (a) and FCS/DMEM solution (b).
Careful examination of
Figure 6a shows differences between the untreated and the plasma-treated samples, e.g., the nitrogen content is lower in the untreated sample in the first 100 s of relative to that in both plasma-treated samples (hydrophilic and hydrophobic ones). This difference in nitrogen content disappeared after 1,000 s of incubation—the nitrogen content on the polymer surface was then practically the same for all samples regardless of whether they were treated in the plasma. The nitrogen content differs only in the first few minutes of incubation; therefore, the protein adsorption is slightly faster on the two plasma-treated samples than on the untreated sample, but this difference vanished later. The protein adhesion trend for the FCS/DMEM protein mixture (
Figure 6b) was similar to that of albumin. In addition, we can find more nitrogen on the surface of the plasma-treated samples in the first 100 s of incubation, while this difference later diminishes.
These results are also supported by QCM measurements, as shown later in the text. The results clearly show that proteins very quickly reach and adsorb on the polymer surface. This adsorbed layer of proteins then governs the further adhesion of cells that appear much later.
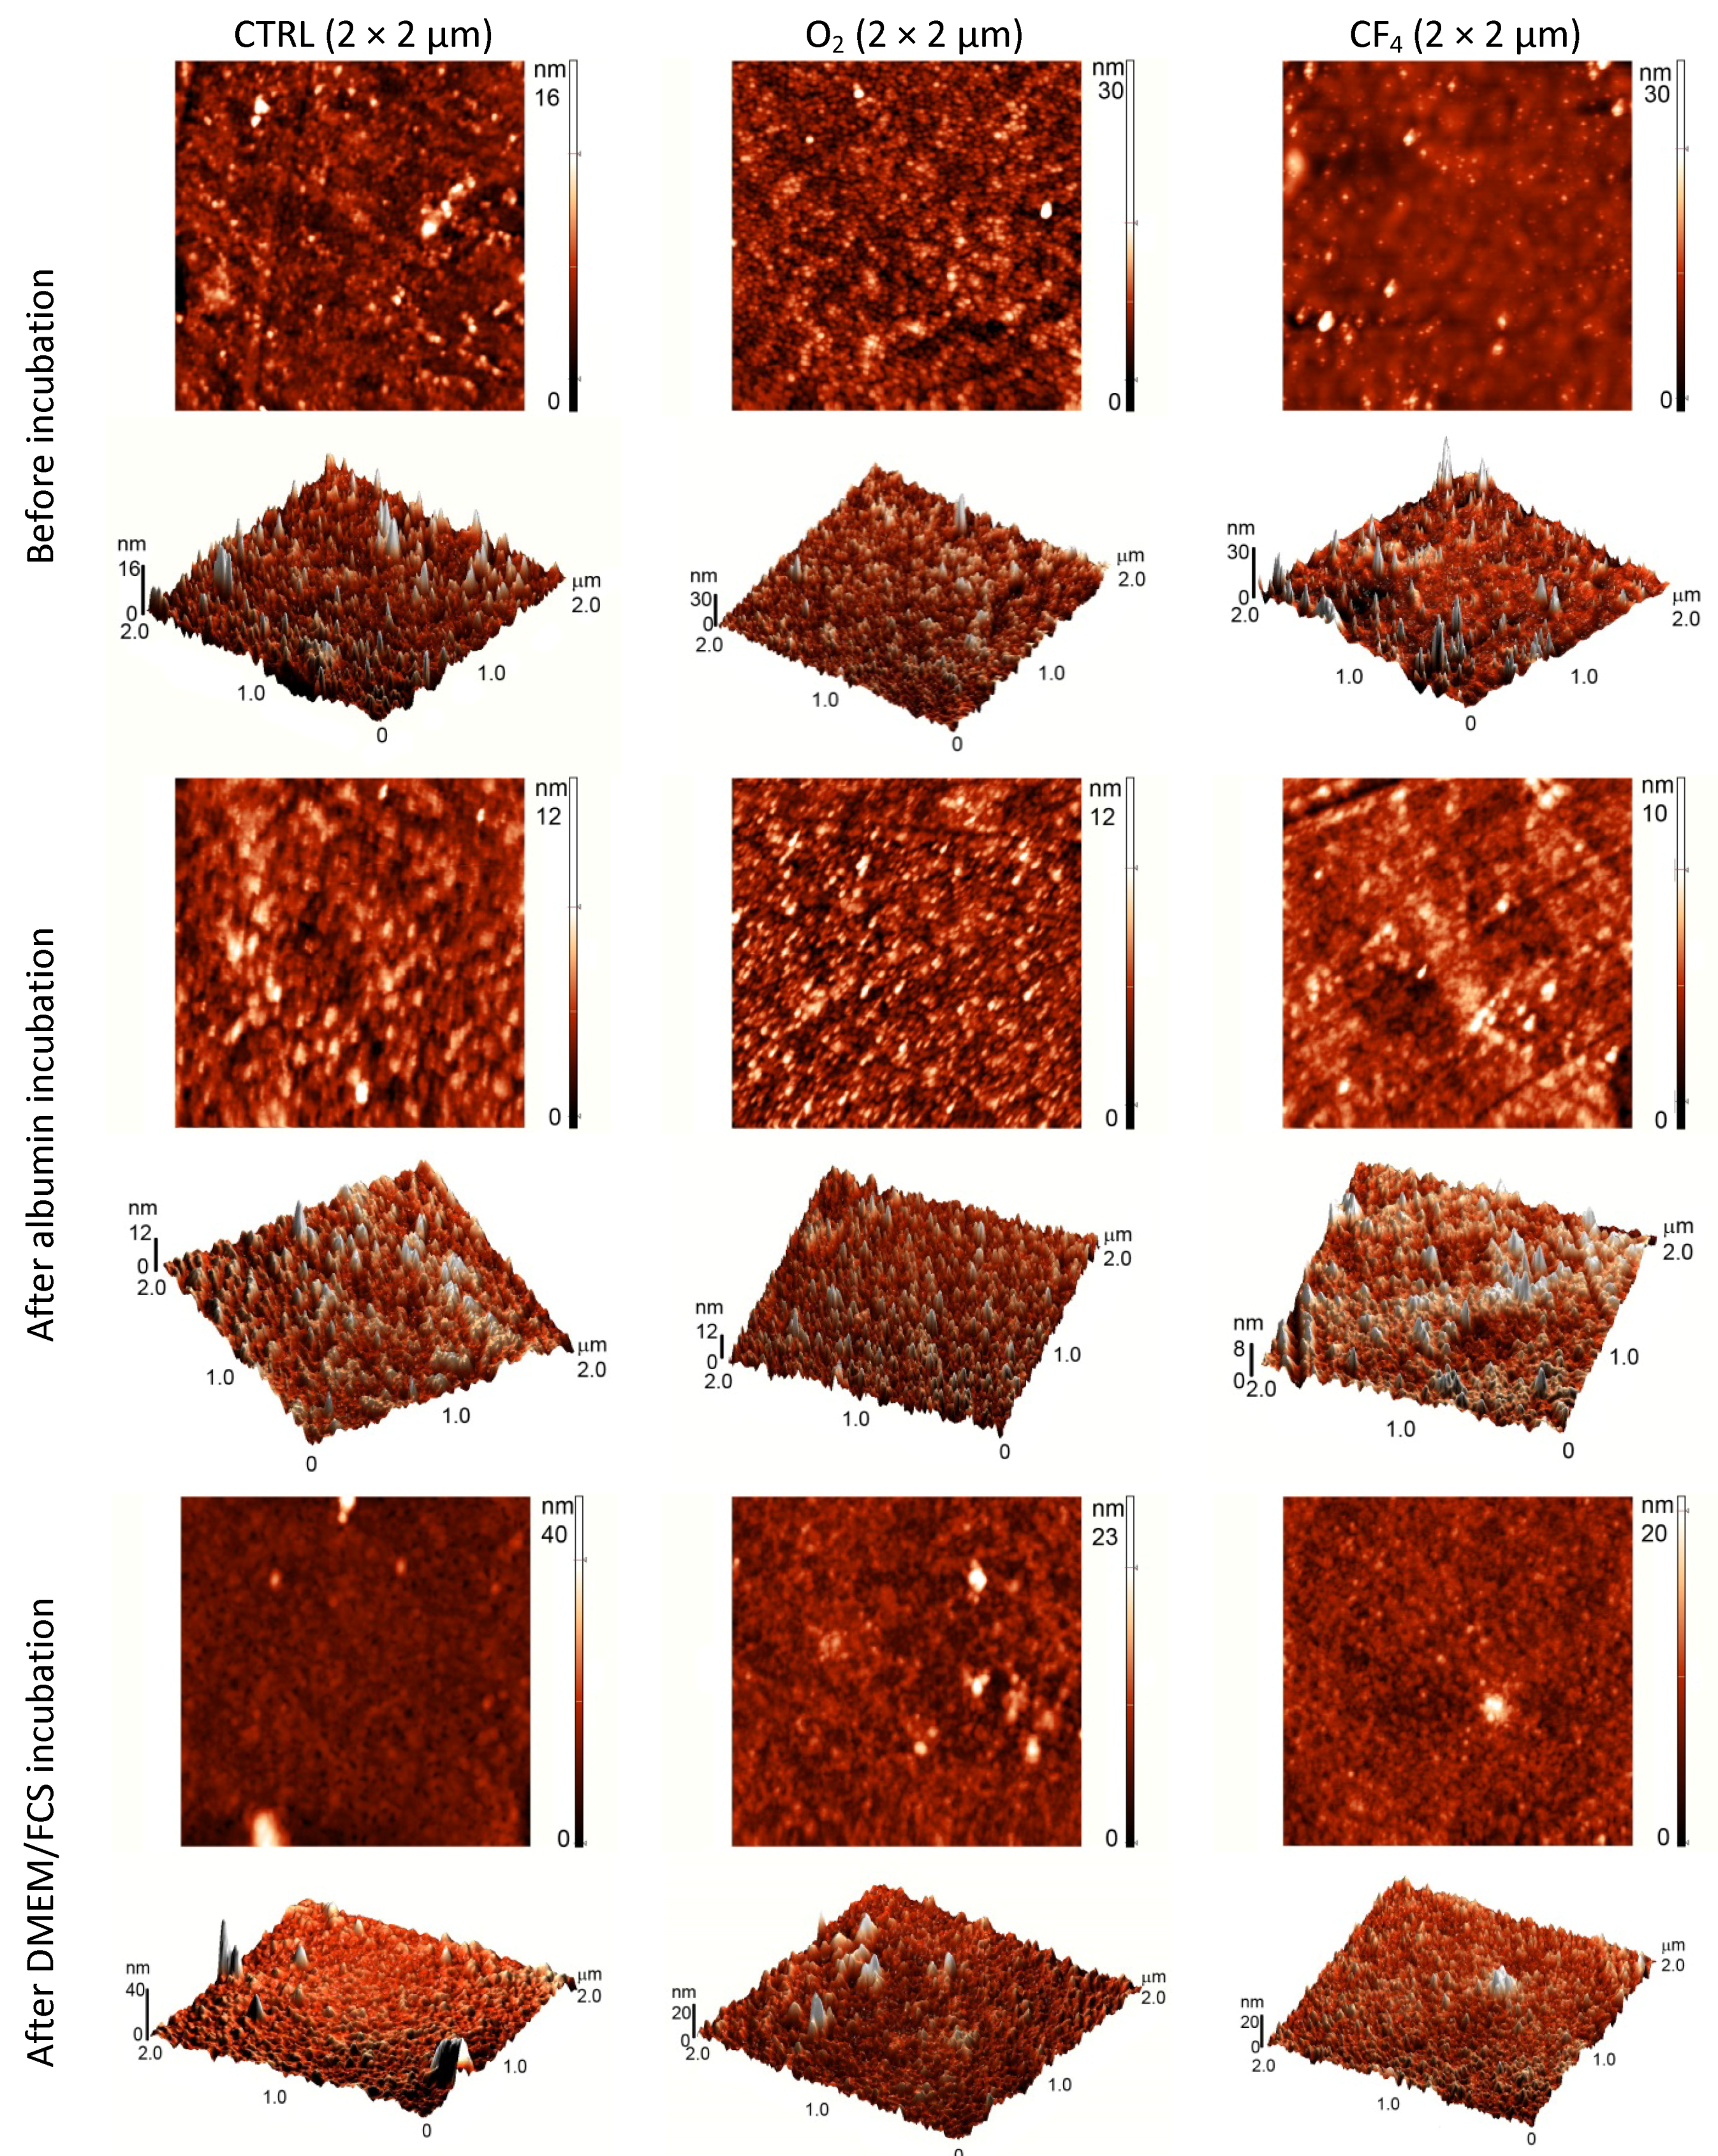
To obtain additional information regarding the surface characteristics of the plasma-treated samples, AFM analyses were performed to determine the surface topography, which can also influence protein and cell adhesion. The AFM images are shown in
Figure 7.
After oxygen plasma treatment, the surface has a highly oriented structure and is rougher compared with the control sample. The fluorine plasma-treated surface does not show any oriented structure, but several peaks are observed. After incubation in albumin, the samples do not show any significant difference in surface morphology. By contrast, after incubation in FCS/DMEM solution, the surface becomes smoother except from unevenly distributed features. These isolated peaks formed upon incubation might be protein agglomerates.
Figure 7.
AFM images (2 × 2 µm) of different plasma-treated surfaces before and after incubation in a protein solution.
Figure 7.
AFM images (2 × 2 µm) of different plasma-treated surfaces before and after incubation in a protein solution.
2.3. Adsorption Kinetics of Proteins Studied by QCM
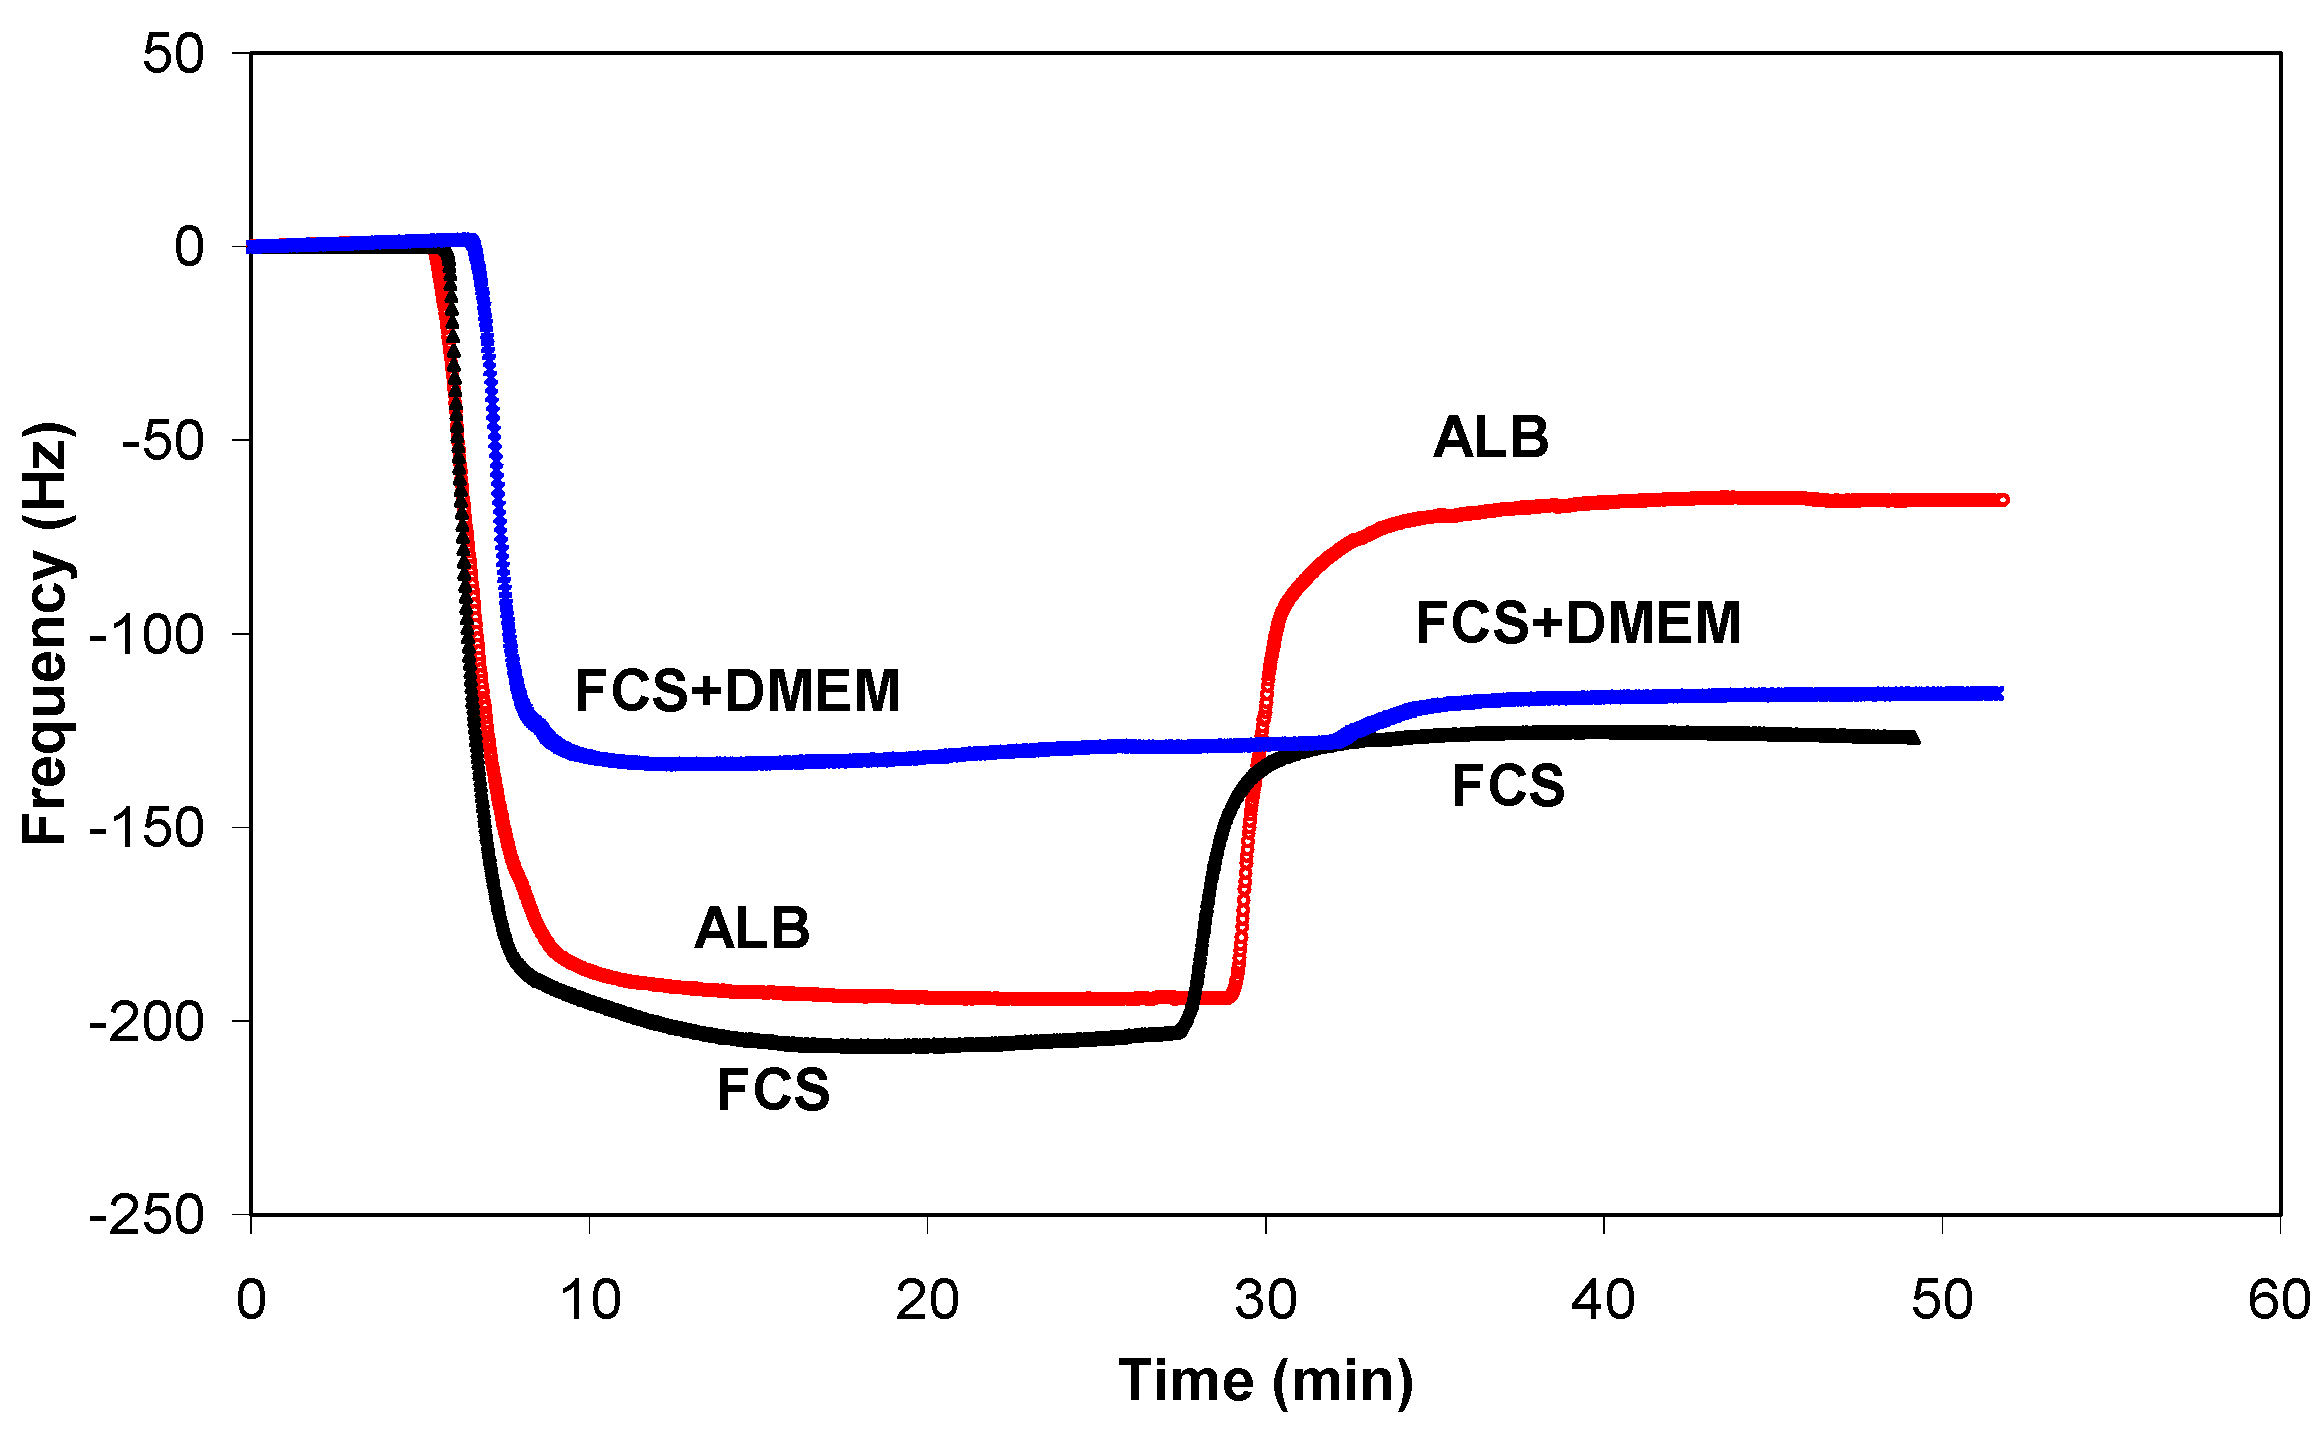
One of the best methods for studying the adsorption kinetics of proteins is QCM, which measures the mass per unit area by measuring the change in frequency of a quartz crystal resonator. Typical adsorption curves,
i.e., change in frequency as a function of time, for albumin are shown in
Figure 8a, while the adsorption curves for FCS and FCS/DMEM are shown in
Figure 9a and
Figure 10a, respectively.
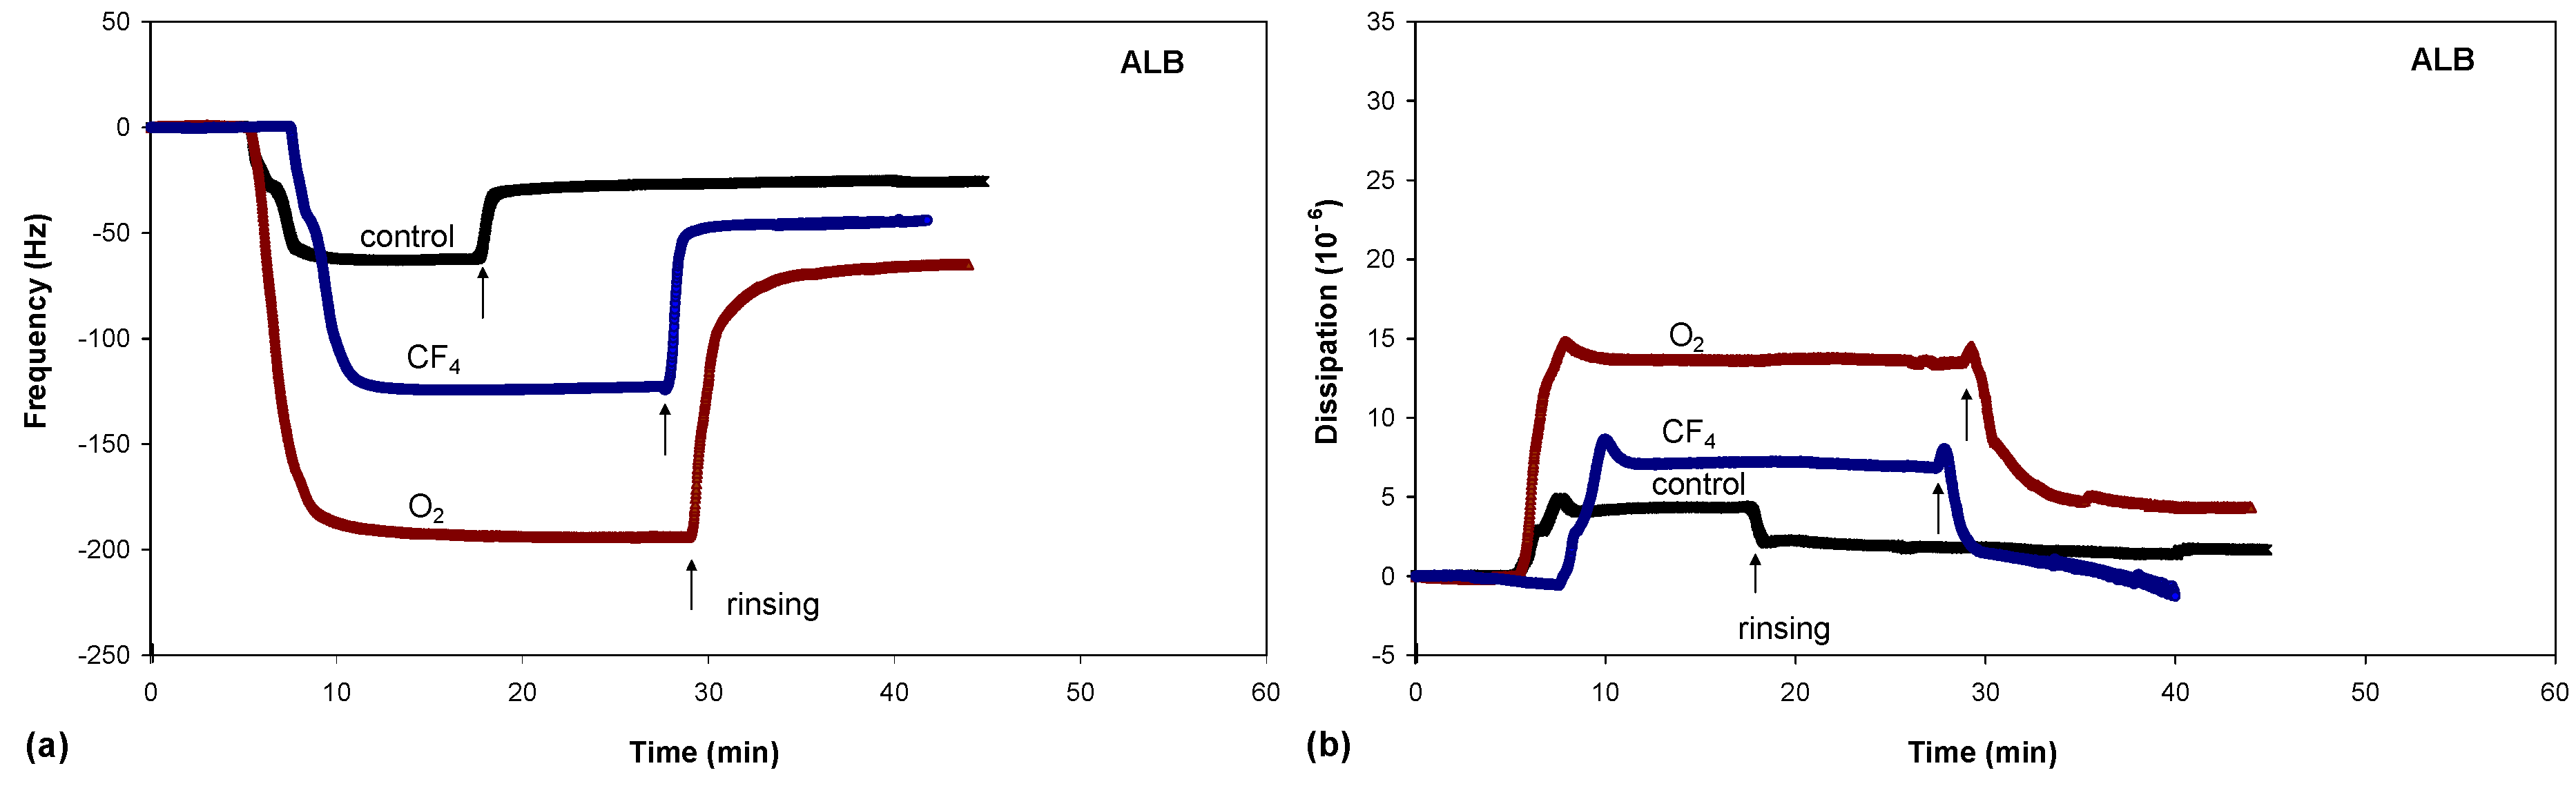
Figure 8.
Frequency changes (a) and dissipation changes (b) for albumin adsorption on untreated and plasma-treated PET substrates.
Figure 8.
Frequency changes (a) and dissipation changes (b) for albumin adsorption on untreated and plasma-treated PET substrates.
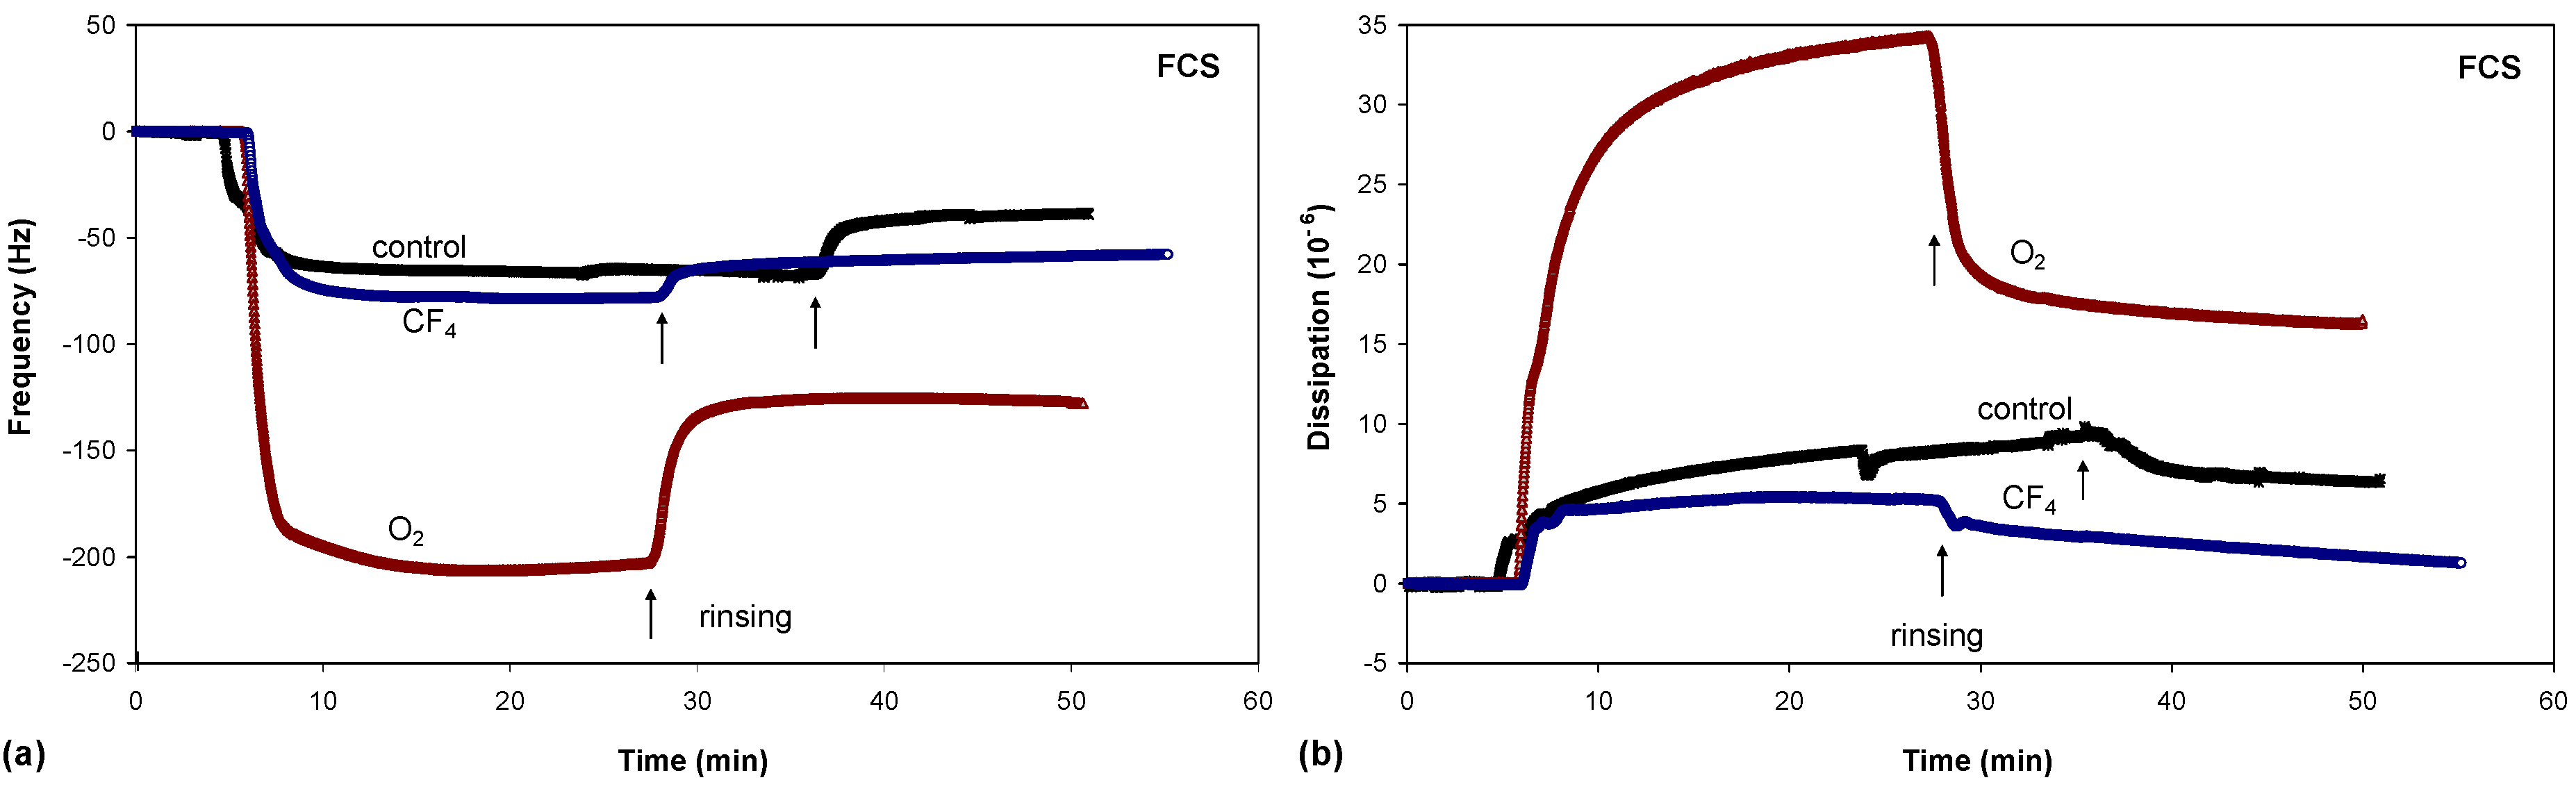
Figure 9.
Frequency changes (a) and dissipation changes (b) for FCS adsorption on untreated and plasma-treated PET substrates.
Figure 9.
Frequency changes (a) and dissipation changes (b) for FCS adsorption on untreated and plasma-treated PET substrates.
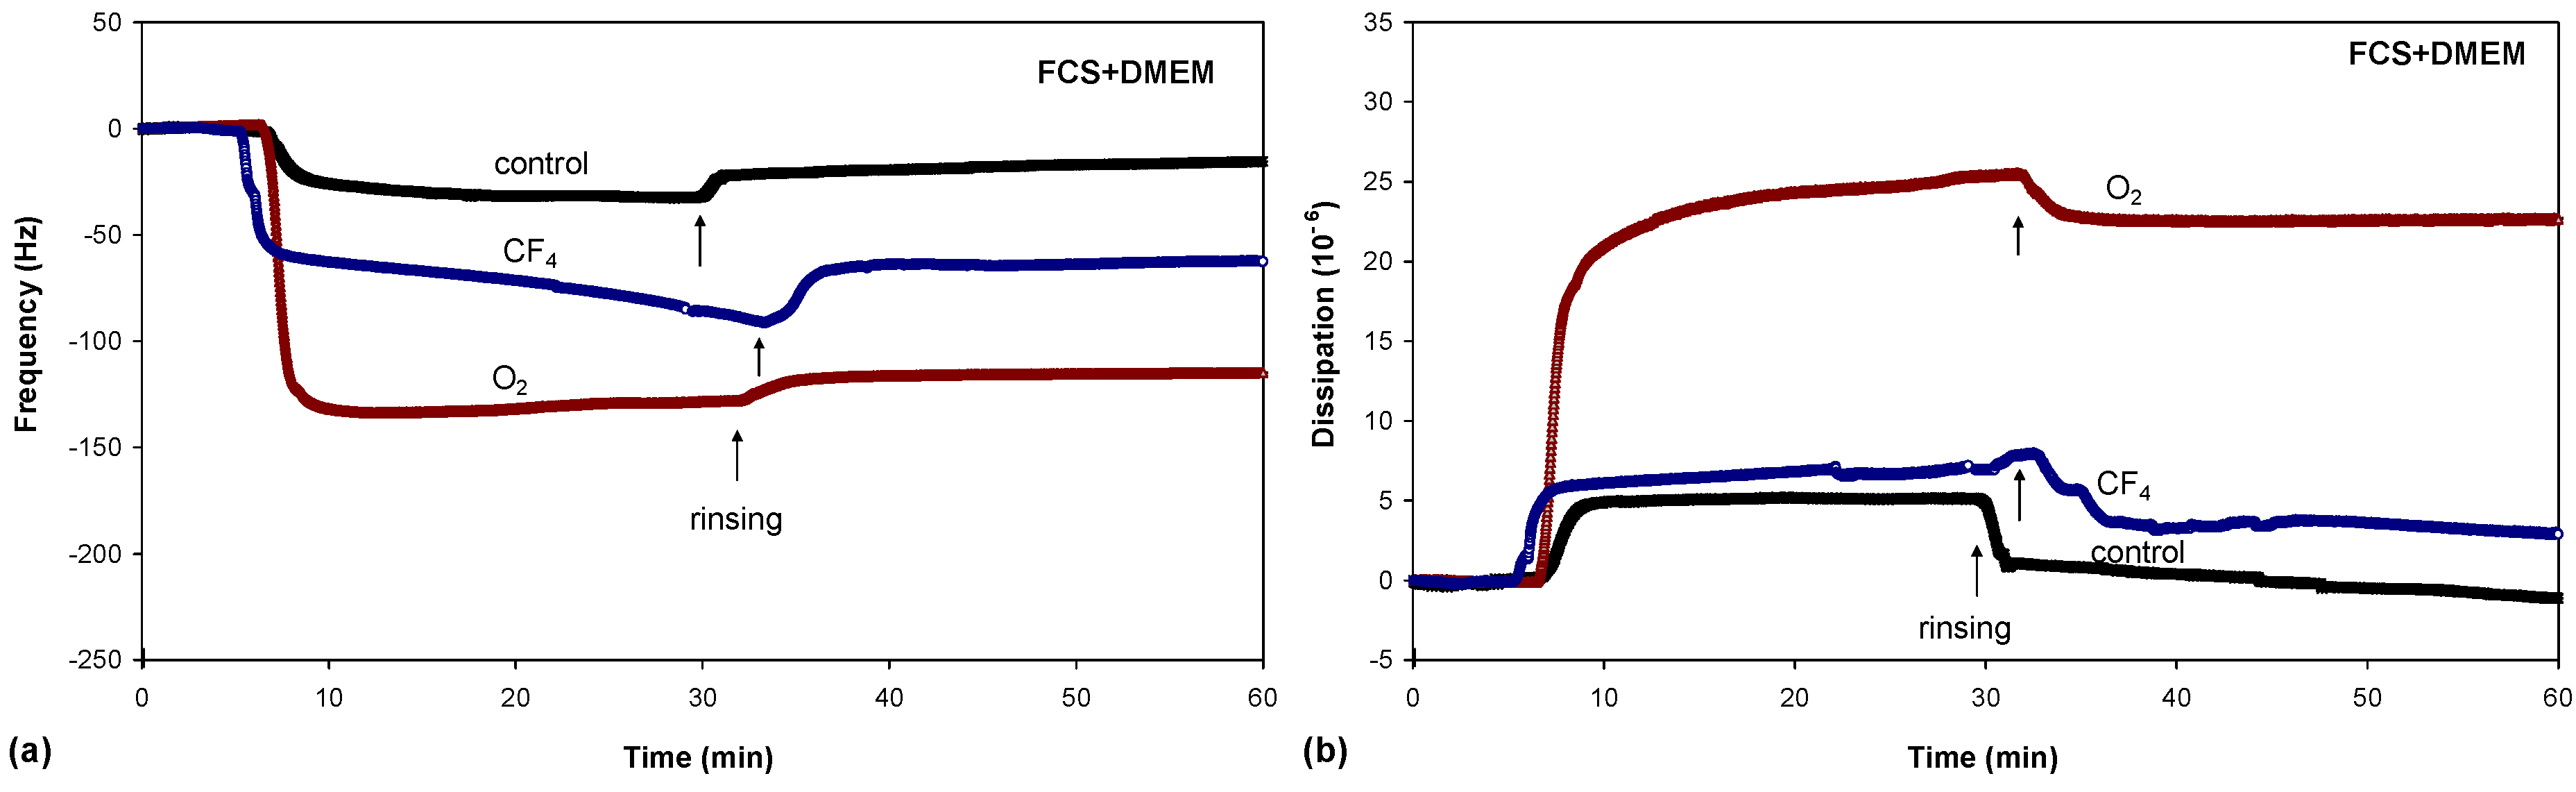
Figure 10.
Frequency changes (a) and dissipation changes (b) for FCS/DMEM adsorption on untreated and plasma-treated PET substrates.
Figure 10.
Frequency changes (a) and dissipation changes (b) for FCS/DMEM adsorption on untreated and plasma-treated PET substrates.
There were significant differences in protein adsorption on the plasma-treated PET surfaces. The results presented in
Figure 8,
Figure 9 and
Figure 10 show that the protein adsorption is very fast at the beginning and later slows down, slowly reaching equilibrium when the surface becomes saturated. The adsorption is fastest for the oxygen plasma-treated PET sample; by contrast, the control sample and the fluorine plasma-treated sample show no important differences. This finding is true for all three protein solutions used.
Another conclusion can be drawn from
Figure 8,
Figure 9 and
Figure 10. In the case of albumin, the adsorption equilibrium was reached at Δ
f = −63 Hz for the control sample, Δ
f = −124 Hz for the fluorine plasma-treated sample and Δ
f = −194 Hz for the oxygen plasma-treated sample. This frequency difference between the samples indicates that the mass of adsorbed proteins was lowest on the control sample and highest on the oxygen plasma-treated sample. By contrast, for the fluorine plasma-treated sample, the adsorbed mass was between these two values. The same results were also observed for FCS and for FCS with DMEM–in all cases, more proteins adsorbed on the O
2 plasma-treated surface.
After the samples were rinsed with PBS solution (the starting point of rinsing is marked with arrows in
Figure 8,
Figure 9 and
Figure 10), the resonant frequency changes, indicating the desorption of loosely bound proteins. The desorption is the most pronounced for the control sample, for which the majority of the proteins was desorbed. The plasma-treated samples also showed high desorption, but because of the higher mass of pre-adsorbed proteins, many proteins remain on the surface in comparison to the control sample. In particular, the oxygen plasma showed the most favourable conditions;
i.e., the majority of the proteins remained on the surface, and we probably have several monolayers of protein, which was further proved with dissipation measurements. These results therefore show that more proteins were adsorbed on the hydrophilic (polar) surface than on the hydrophobic (non-polar) one.
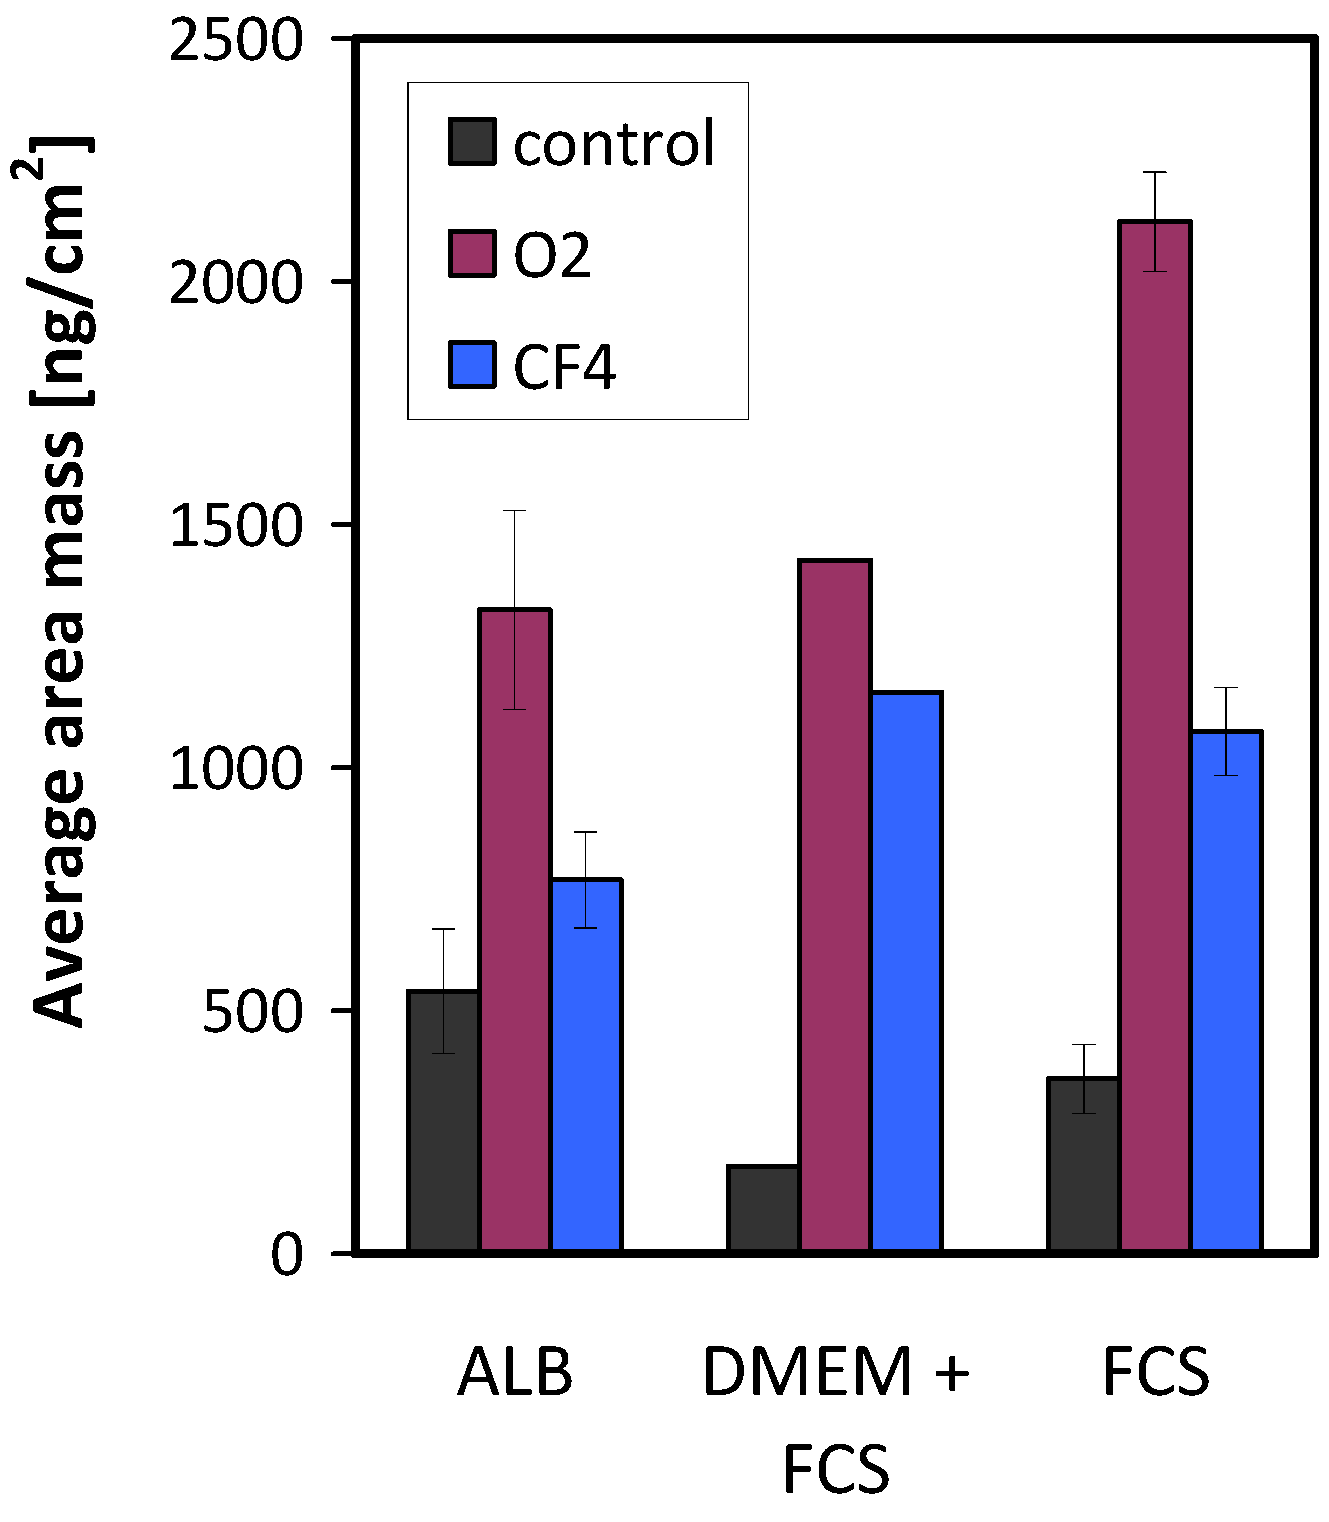
The mass of the adsorbed proteins on the various plasma-treated samples is shown in
Figure 11. Again, all protein solutions show a similar result: the largest amount of adsorbed proteins was on the oxygen plasma-treated surface, and the lowest amount was found on the surface of the control (untreated) sample.
Figure 11.
Mass of adsorbed proteins on untreated and plasma-treated samples.
Figure 11.
Mass of adsorbed proteins on untreated and plasma-treated samples.
Another finding is the huge change in the frequency following rinsing in the case of albumin and FCS; by contrast, in the case of FCS with the addition of DMEM, the difference is very small (desorption following rinsing is negligible).
Figure 12 presents this finding more clearly and shows only the adsorption curves for all three protein solutions on the surface of the oxygen plasma-treated samples. The situation for the control sample or the sample treated in CF
4 plasma is similar to that for oxygen. The presence of DMEM appears to affect protein adsorption kinetics. One important component of DMEM is salt; the type of salt can vary, and the salt is a source of various ions. Furthermore, as reported in the literature, dissolved ions (
i.e., the ionic strength) can change the protein adsorption process [
19]. This is probably the reason for more stable adsorption of proteins on the polymer surface with FCS compared with the surface with DMEM.
Figure 12.
Comparison of the adsorption process of different protein solutions to the oxygen plasma-treated surface.
Figure 12.
Comparison of the adsorption process of different protein solutions to the oxygen plasma-treated surface.
In conjunction with the measured QCM frequency, dissipation measurements can provide further information regarding protein adsorption (
Figure 8b,
Figure 9b and
Figure 10b). The change in dissipation was smaller for the CF
4 plasma-treated sample than for the O
2 plasma-treated sample. The lowest dissipation was found for the control sample, except for FCS adsorption (
Figure 9b). The dissipation was the largest for the oxygen plasma-treated sample; therefore, the adsorbed protein layer was thicker and less compact than that on the CF
4 plasma-treated sample or the control sample. This difference can also be caused by the different conformation of proteins on the surface or the binding/trapping of more water molecules in the adsorbed protein film [
26].
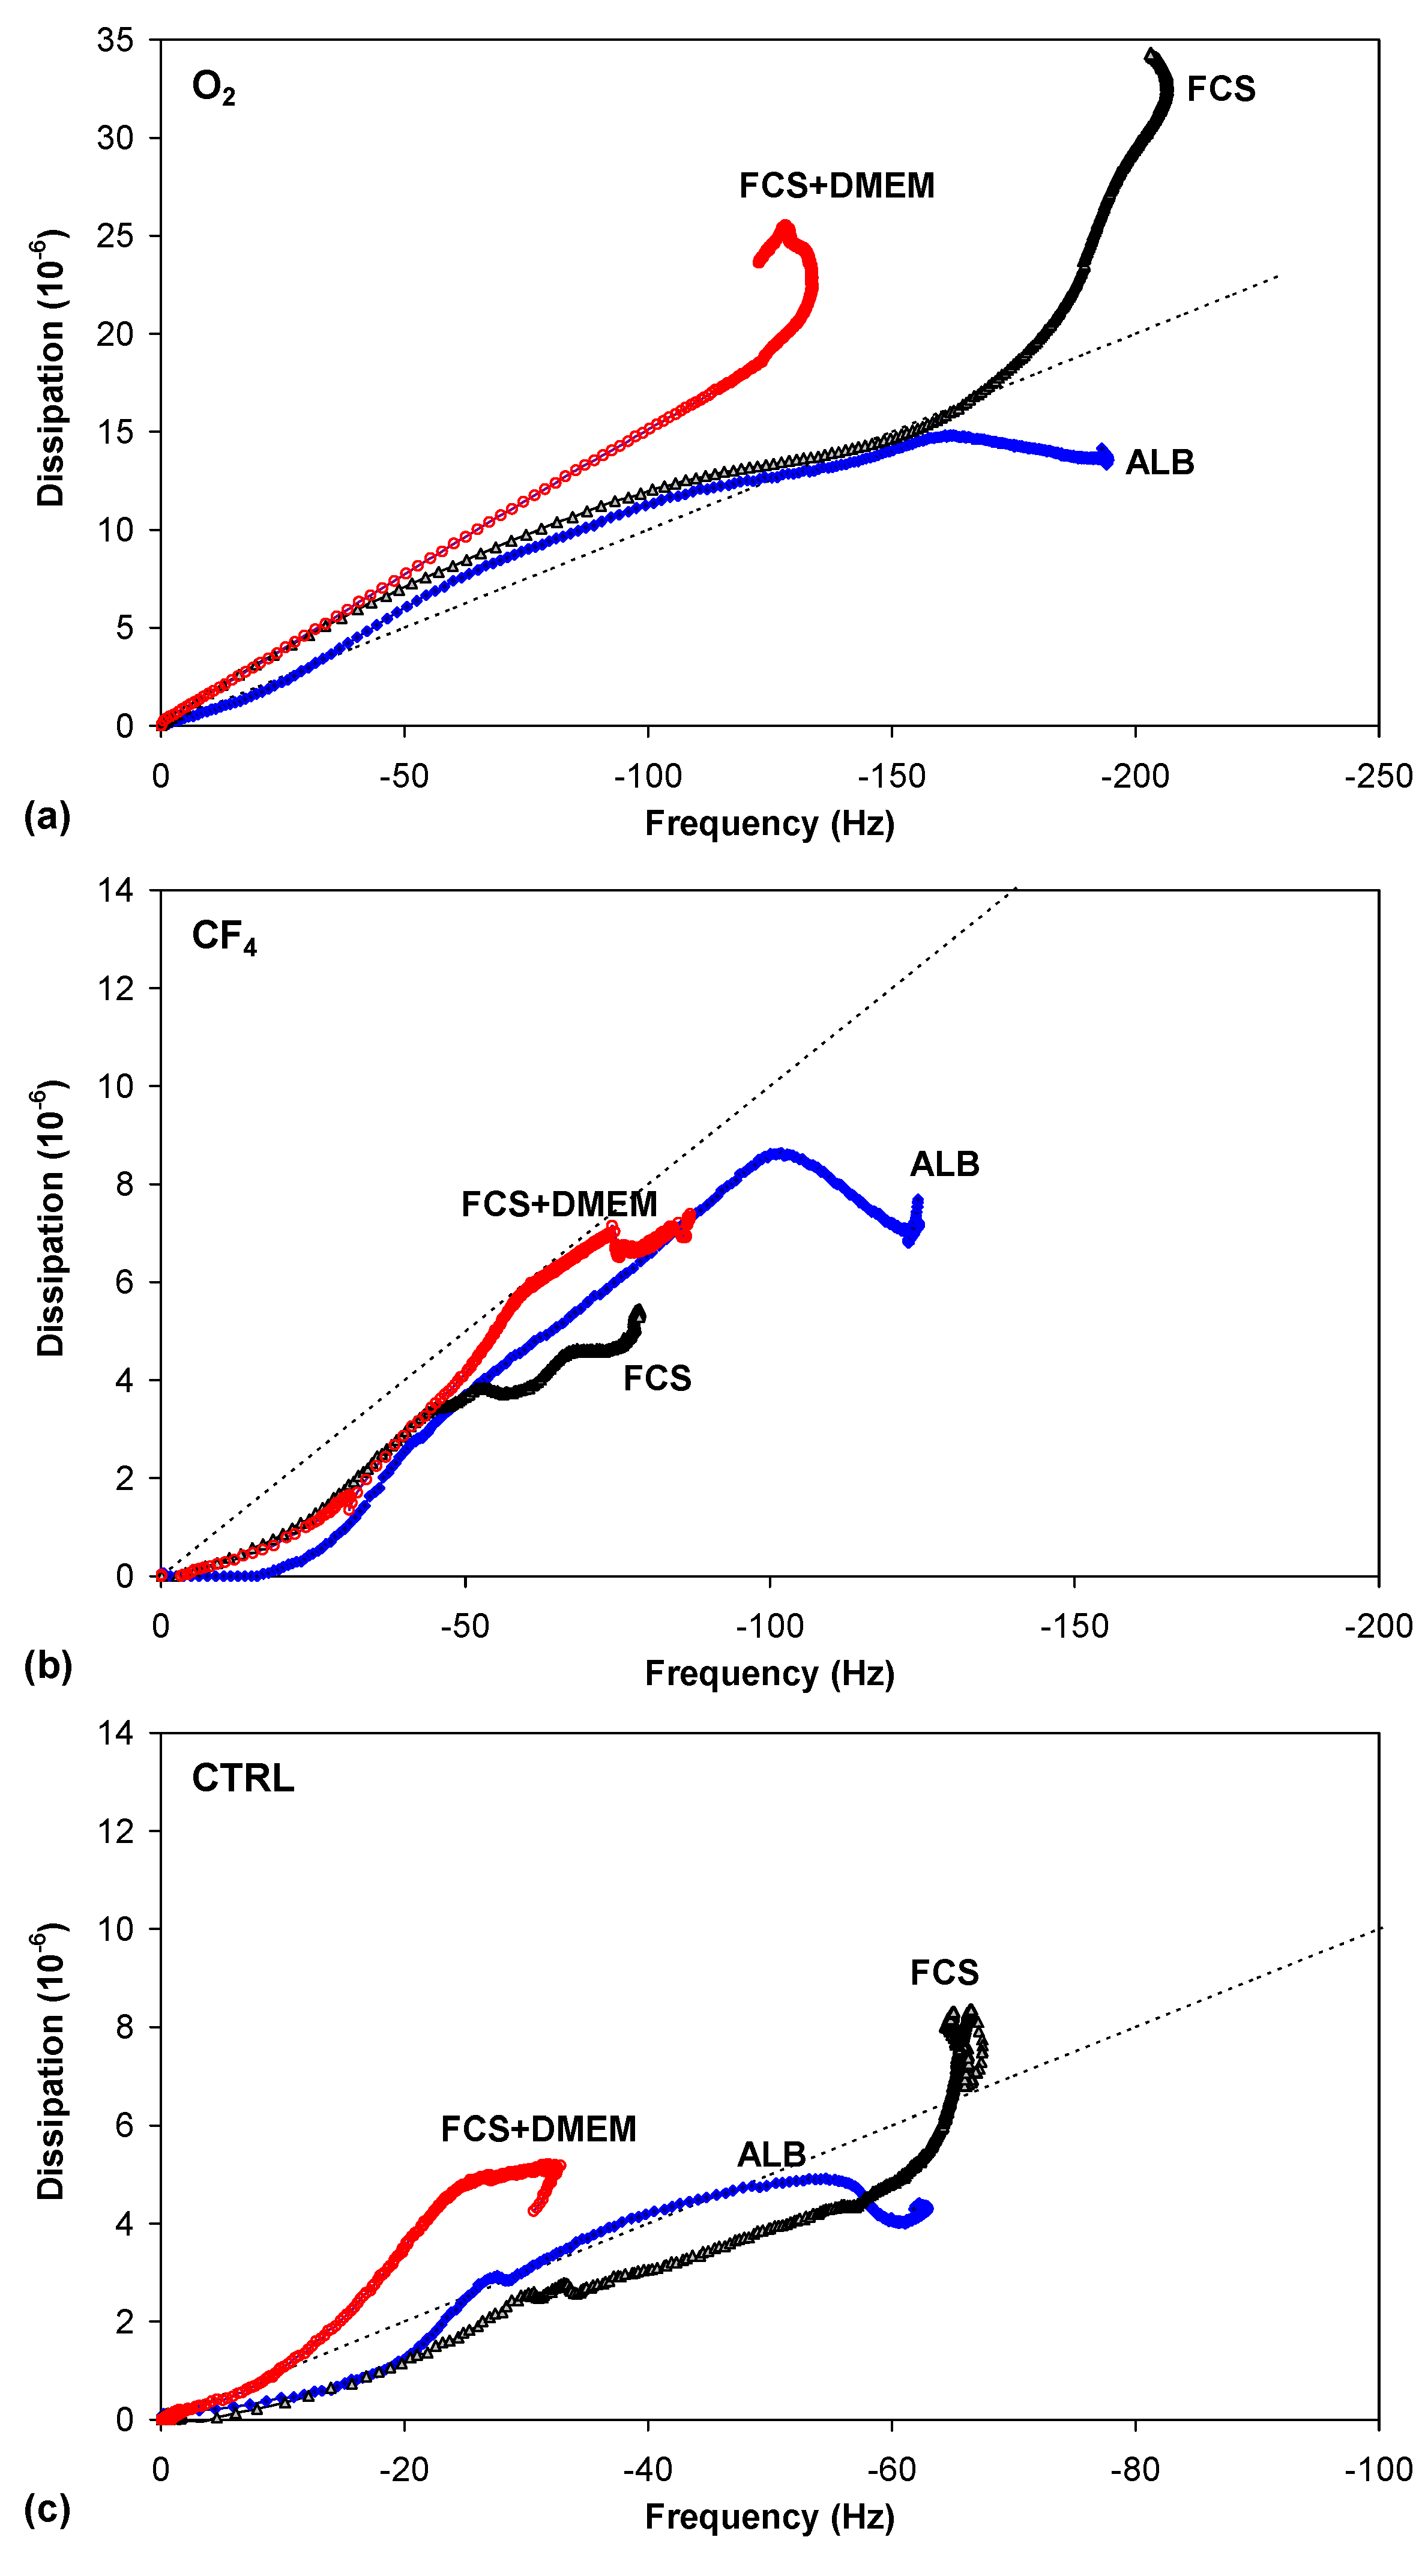
Figure 13 plots the dissipation change
versus frequency change (Δ
D = f(Δ
f) plot), which can provide important information about the softness/rigidity of the protein layer formed during adsorption. A lower slope indicates a more dense and rigid layer, while a higher slope indicates the formation of a softer and more dissipating layer [
26]. For the oxygen plasma, at the beginning, the spacing between the data points is greater, whereas the data points later become closertogether. This indicates faster adsorption kinetics at the beginning [
25]. Additionally, the adsorption is uniform at the beginning, whereas the slope of the adsorption curve changes later (
Figure 13a). For FCS and FCS/DMEM, the slope increased because of the faster deposition of mass, which might be caused by a change in conformation or even by multilayer adsorption. By contrast, for albumin, the slope decreased afterwards.
Figure 13a also shows that all of the curves are positioned close together at the beginning. Shortly thereafter, the curve for FCS/DMEM turns away, while the curves for FCS and ALB remain very close for a longer time before finally turning away in opposite directions.
Figure 13.
ΔD = f(Δf) function for protein adsorption on plasma-treated PET substrates for albumin (a), FCS (b) and FCS with DMEM (c).
Figure 13.
ΔD = f(Δf) function for protein adsorption on plasma-treated PET substrates for albumin (a), FCS (b) and FCS with DMEM (c).
The slope of the curve for the CF
4 plasma treatment (
Figure 13b) is much less steep, indicating a more densely adsorbed layer, in contrast to the oxygen plasma treatment, which has a very steep curve, indicating a more loosely bound layer. Thus, for the oxygen plasma treatment, the curve is always above the dotted line, showing the so-called “soft-rigid” boundary. By contrast, for the CF
4 plasma treatment, the adsorption curve is always below the dotted line. For the control sample (
Figure 13c), the slope is occasionally very close to the “soft-rigid” boundary, but only lies above this boundary for FCS/DMEM.
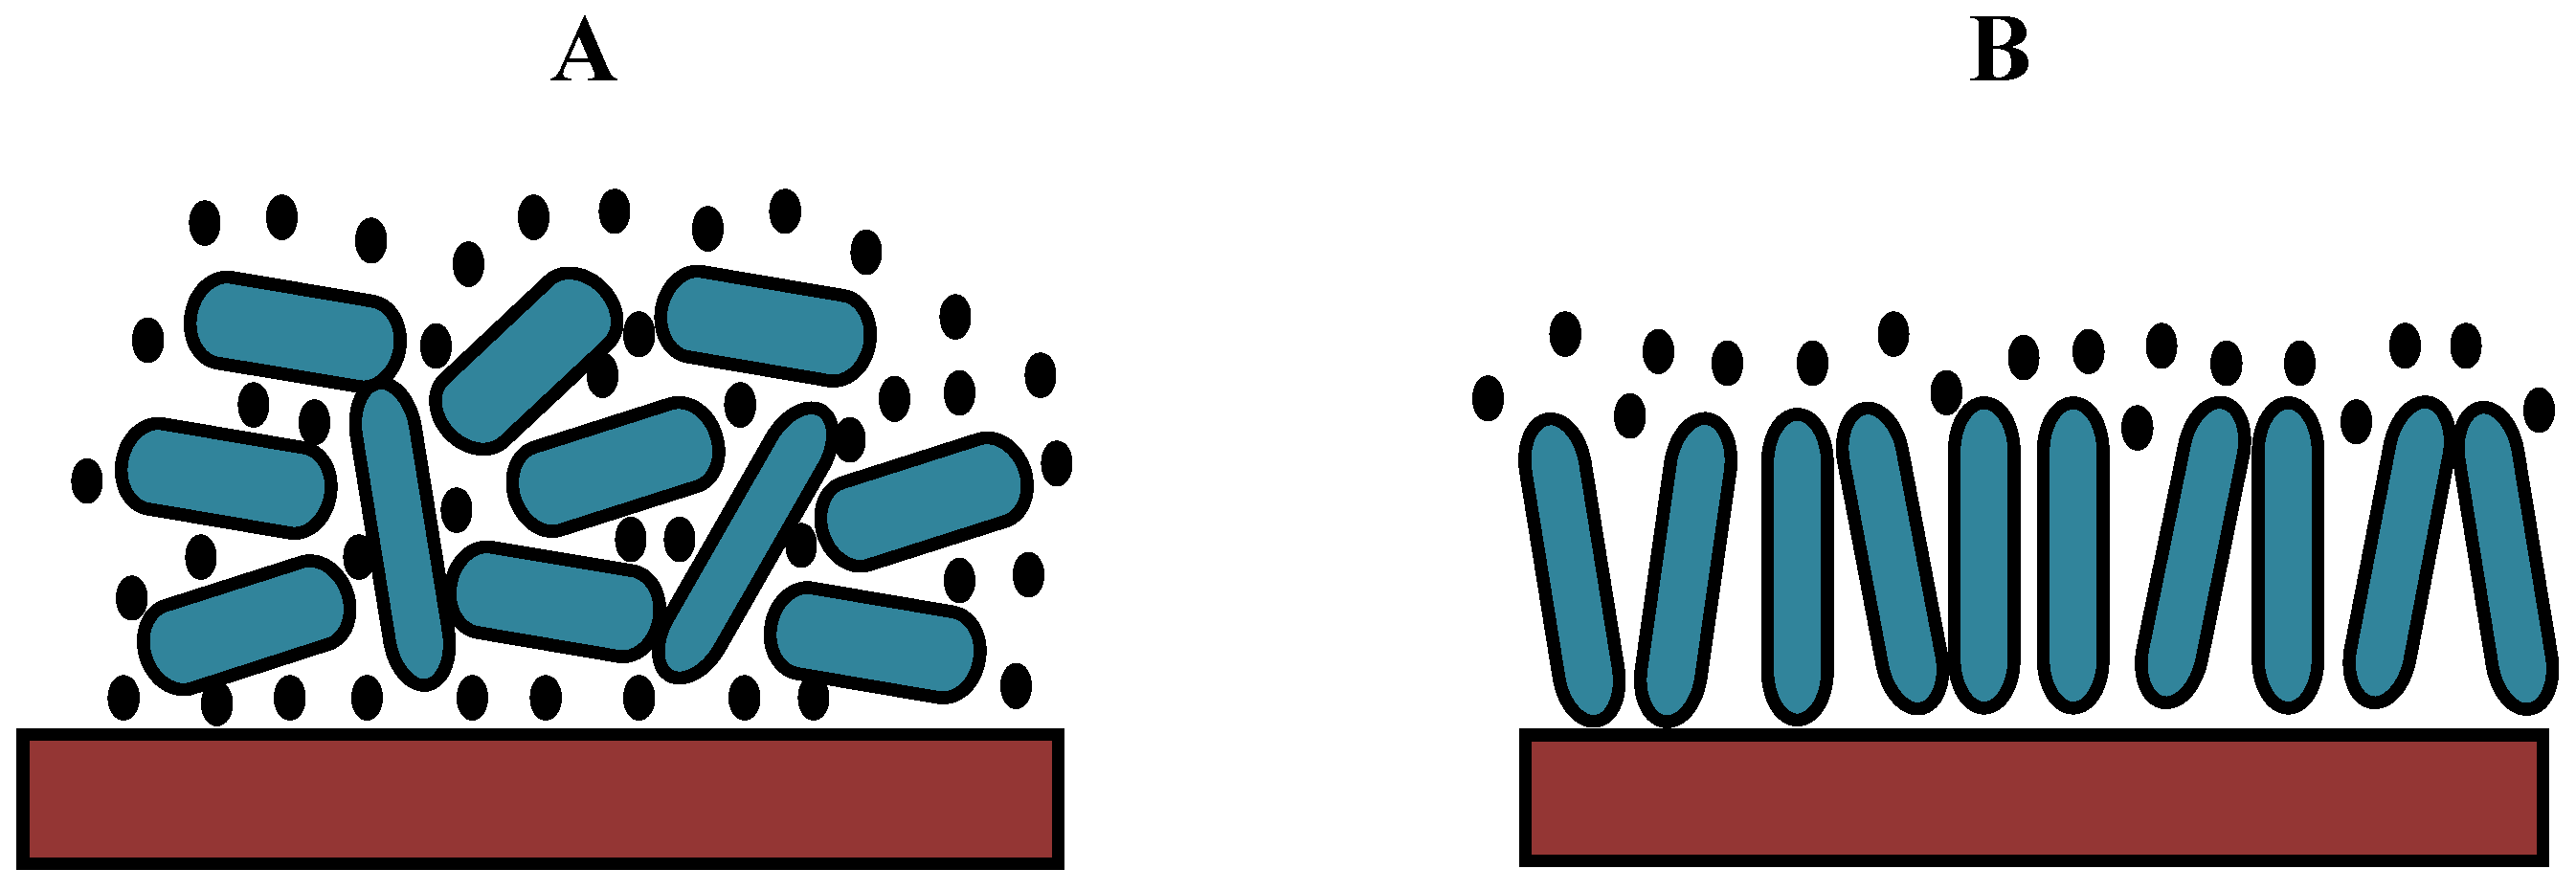
On the basis of these results, we can propose a hypothetical model for protein adsorption on hydrophilic or hydrophobic surfaces (
Figure 14). Albumin can be adsorbed in two different orientations: side-on or end-on [
32,
33]. Because the layer is more rigid for the CF
4 plasma, the protein should be more closely packed, which can only be achieved in the end-on orientation. By contrast, the oxygen plasma results in a more loosely bound layer; thus, the protein is probably adsorbed in such a way that its configuration is similar to the side-on orientation (
Figure 14). In this case, multilayer adsorption is likely to occur.
Figure 14.
A hypothetical model for protein adsorption on an oxygen plasma-treated (hydrophilic) surface with trapped water molecules (A) and a CF4 plasma-treated (hydrophobic) surface (B).
Figure 14.
A hypothetical model for protein adsorption on an oxygen plasma-treated (hydrophilic) surface with trapped water molecules (A) and a CF4 plasma-treated (hydrophobic) surface (B).
2.4. Cellular Response to Plasma-Treated Surfaces
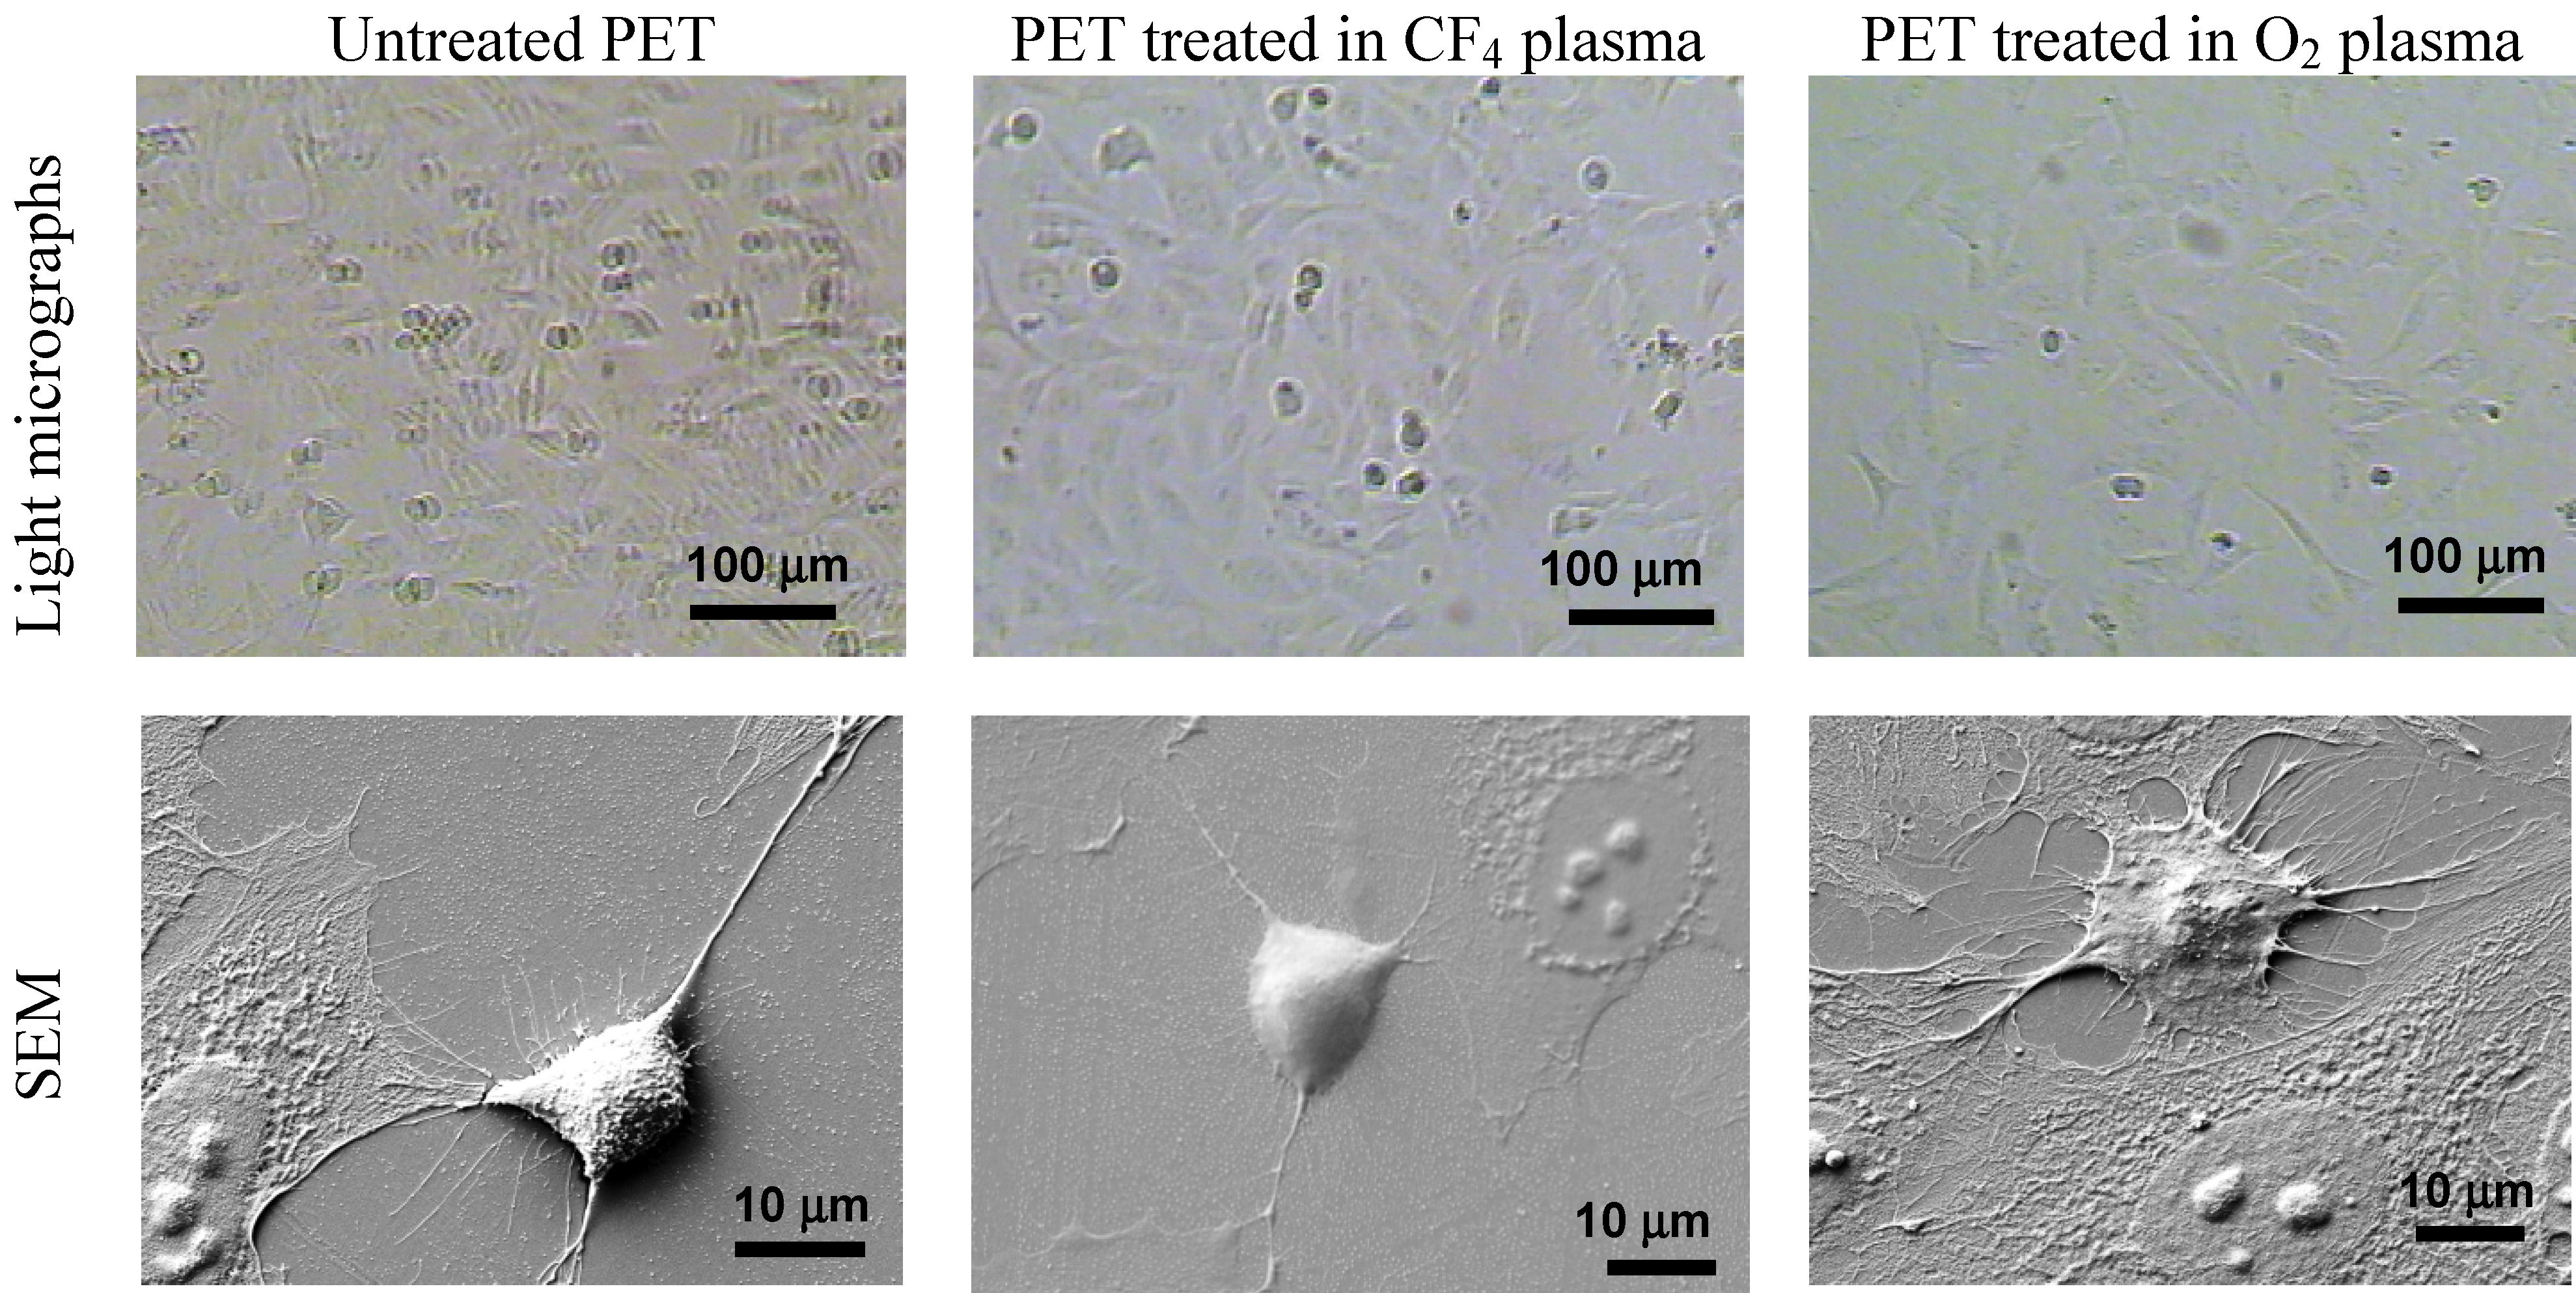
Finally, to observe the influence of plasma treatment and protein adhesion on cell proliferation, we studied human osteosarcoma (HOS) cell adhesion. The characteristics of the cell adhesion and the morphology of HOS cells on different polymers were investigated with optical microscopy and SEM (
Figure 15). The best adhesion of HOS cells was observed on the oxygen-plasma-treated samples, while there was no significant difference in cell adhesion between the control (untreated) and the fluorine-treated samples. Some differences between the samples can be observed in
Figure 15.
For the control samples after 1 day of incubation, we observed spread cells that form some microvilli and active margins, allowing the cells to connect to each other. By contrast, on the oxygen plasma-treated polymers, we observed extensively spread cells. The majority of the cells pulled in their thinner margins, while others were already in mitosis. More microvilli and active margins, which connect between themselves and form an extracellular matrix for cells to adhere on the surface, were visible. Such cell morphology occurs in a suitable environment for cell growth, which we have provided with the oxygen-treated polymer surface.
On the fluorine plasma-treated polymers after 1 day of incubation, the cells have a morphology similar to that of the control sample. Most cells are spread with a flattened nuclear region and are relatively free of microvilli, while some are similar to the spread cells observed in the control samples and are slightly rounded with raised nuclear regions.
Figure 15.
HOS cell adhesion and morphology on the PET polymer surface after plasma treatment, as measured using light microscopy and SEM analysis after 1 day of incubation.
Figure 15.
HOS cell adhesion and morphology on the PET polymer surface after plasma treatment, as measured using light microscopy and SEM analysis after 1 day of incubation.
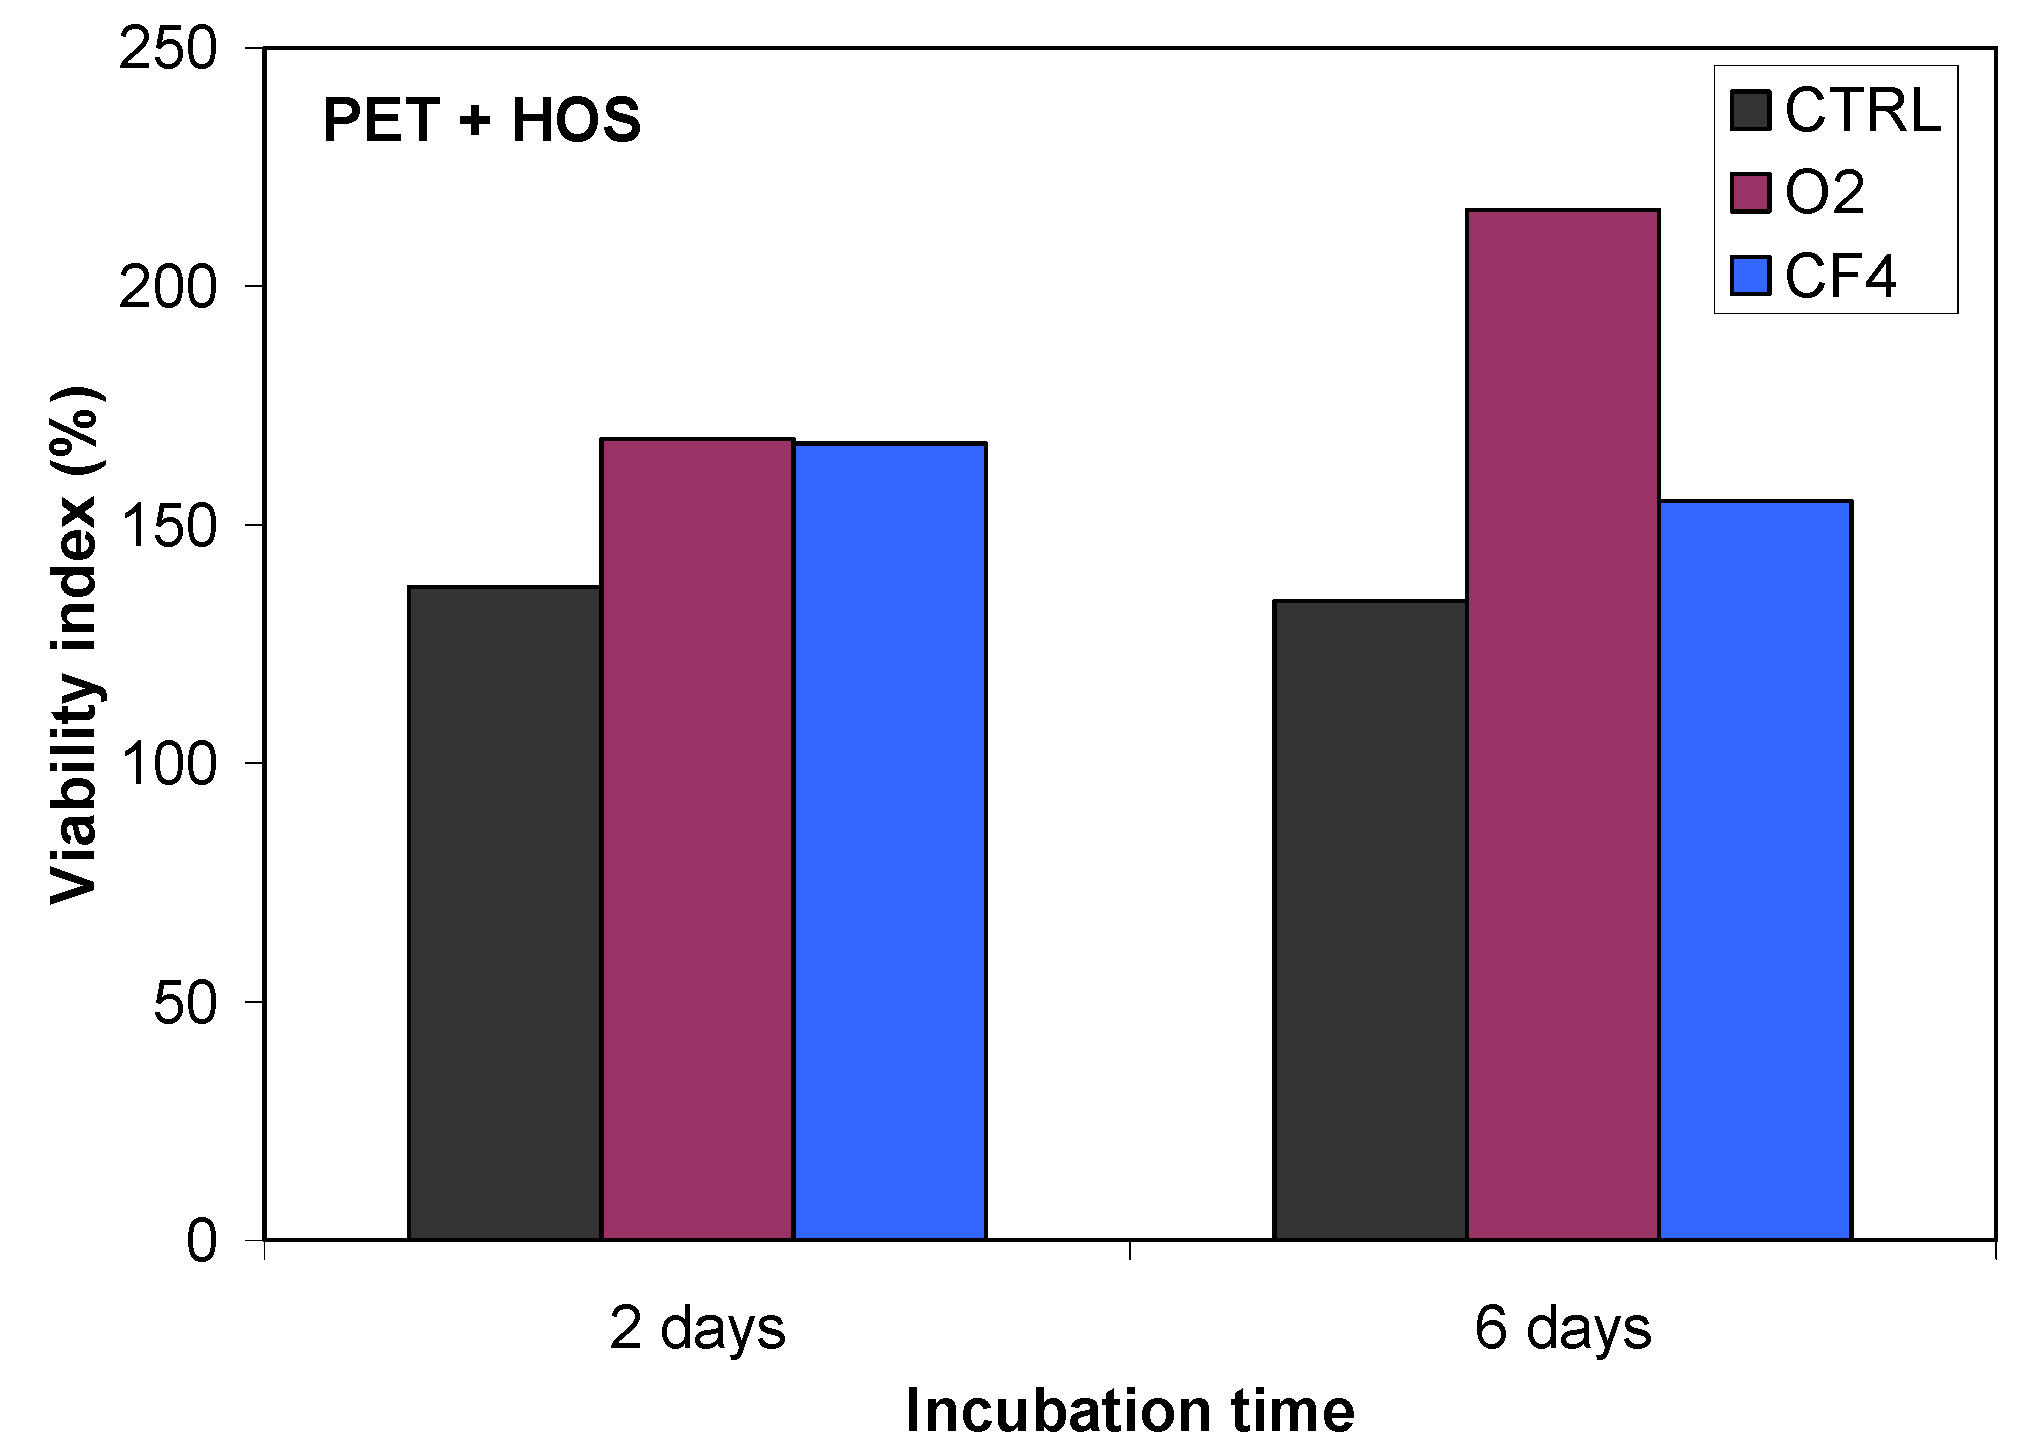
Plasma-treated samples were also tested for cell adhesion and proliferation (
Figure 16), and a substantial difference in cell adhesion was found on the plasma-treated surfaces. The results of the MTT ((3-(4,5-dimethylthiazol-2-yl)-2,5-diphenyltetrazolium bromide) colorimetric assay for HOS cell incubation after 2 and 6 days are shown in
Figure 16. This figure shows the much better cell proliferation for the O
2 plasma-treated PET sample treated in compared with that for the CF
4 plasma-treated sample. As demonstrated by QCM, this finding can be explained by the different protein conformation on the surface and the different mass of adsorbed proteins.
Figure 16.
Proliferation of HOS cells on untreated and plasma-treated PET polymers, as measured using an MTT assay.
Figure 16.
Proliferation of HOS cells on untreated and plasma-treated PET polymers, as measured using an MTT assay.
Our QCM results are consistent with our study of cell proliferation, where we have observed improved cell proliferation and adhesion on the oxygen plasma-treated surface relative to that in the control sample or the CF
4 plasma-treated sample. The improved cell proliferation occurs because the oxygen plasma-treated surface promotes protein adsorption. Furthermore, proteins are likely to maintain their active form on a hydrophilic surface; it was reported that on a hydrophilic surface, proteins prefer to maintain their conformations, whereas on a hydrophobic surface, proteins denature [
34].
2.5. Discussion of Cell- and Protein-Material Interactions
A similar study was performed by Kurniawan
et al. [
35]. They used O
2 and CF
4 plasmas to modify the surface properties of bacterial cellulose (BC) fibres and study the adhesion of fibroblasts and Chinese hamster ovary cells. Interestingly, they found better cell adhesion on the CF
4 plasma-treated surface than on the surface treated with O
2 plasma. This was explained by the higher quantity of proteins adsorbed to the CF
4 plasma-treated surface. Because those researchers used a different substrate material that has a fibrous structure (and not a foil) and different cells, it is difficult to correlate their work with ours. Furthermore, reports from some other authors support our finding that CF
4 plasma is not optimal for cell adhesion [
36,
37]. In addition, Blackstone
et al. found better cell adhesion of cancer cells on an air plasma-treated surface than on a CF
4 plasma-treated surface [
38].
Different authors may observe different results because of the complexity of plasma treatments. We have mentioned that plasma treatments can modify different surface properties of polymer materials, including the surface chemistry, polarity, roughness and hydrophilicity. It is difficult to perform a plasma treatment in a manner that changes only one surface property; therefore, it is not possible to determine explicitly which surface parameter is most important for cell and protein adhesion, e.g., the surface hydrophilicity can be varied using polar functional groups at the surface as well as by changing the surface roughness. Furthermore, surfaces with the same hydrophilicity may have different types of functional groups. For example, treating polymers with oxygen-containing plasma increases the surface hydrophilicity; however, osteoblast cells adhered to a pure oxygen plasma-treated surface, whereas there was less adhesion on the surface treated in sulphur dioxide plasma [
39]. Jacobs
et al. [
39] and Griesser
et al. [
17] provide good reviews of plasma treatments and cell adhesion. Griesser reports that nitrogen-containing plasmas were used to improve cell adhesion because of the ability to induce amine groups on the surface [
17,
18]. Normally, the results showed an increase in cell adhesion with increasing nitrogen content, but some authors have also concluded that amine groups rather than the total nitrogen content is important. By contrast, other authors have found that amide groups appear to be the main surface chemical group that promotes cell adhesion [
18]. The same problem arises with oxygen plasma, which also improves cell adhesion; however, it is also not clear which functional group promotes better adhesion of cells. Enhanced cell adhesion did not always correlate with the amount of oxygen at the surface. It appears that the surface chemistry must play an important role in surface interactions. Nevertheless, as shown in a review paper by Jacobs
et al. [
39], plasma treatments in O
2, CO
2, air and ammonia lead to improved cell elongation, attachment and/or proliferation; unfortunately, other plasmas, such as CF
4, were not mentioned.
There are also interesting studies on the influence of surface hydrophilicity on cell adhesion. Lee
et al. have performed a special corona treatment to make a wettability gradient along a polymer surface (from 97° to 48°) [
40]. They found that moderately hydrophilic surfaces with a contact angle of 65° showed the best proliferation rate. By contrast, we can find reports of very good cell proliferation on very hydrophilic oxygen plasma-treated surfaces with a water contact angle below 10° [
41]. Some authors, such as Dowling
et al., have also studied the effect of surface wettability and roughness on cell proliferation [
42]. Surfaces with a contact angle from 12° to 155° were obtained through a combination of modifying surface roughness (by grinding), deposition of siloxane coatings and surface fluorination. These researchers also reported optimum cell adhesion at 64°. The only problem is that they also changed two parameters: surface roughness and surface chemistry. When they changed only the surface roughness, cell adhesion increased with increasing surface roughness in the range of 19–2,365 nm.
Surface roughness in combination with morphology can have an important influence on cell spreading. Therefore, there have been many previous attempts to study cell “contact-guidance” along specially patterned micro-structured surfaces. Good reviews of such studies have been published [
43,
44]. In recent years, nano-rough surfaces have been used to study cell adhesion. Besenbacher
et al. provide a good review of the influence of nanoscale surface topography with surface features smaller than 100 nm [
45]. From the review, it is obvious that nano-rough surfaces change protein conformations. Proteins with dimensions of the same order as the surface are not conformationally altered, while proteins with dimensions much smaller or larger than the surface roughness are conformationally altered upon adsorption. There appears to be no general trend in the amount of adsorbed proteins because different results were obtained. The same is true for cell proliferation. Some authors found enhanced cell proliferation and sometimes the cells were aligned along the nanogrooves, but some authors also found reduced cell adhesion. The type of cell appears to play an important role. Furthermore, the detailed shape of the nanofeatures may be important. Cells will normally align along the groves, but other topographical features, such as wells, pits or pillars, do not result in such a clear cell alignment [
43]. We can only conclude that surface wettability, roughness and chemistry must be optimised for different polymer materials and different cell types.

 ,
, 


