Article

Thermal and Rheological Properties of a Family of Botryosphaerans Produced by Botryosphaeria rhodina MAMB-05

by
Paulo R.M.S. Fonseca
1,
Robert F.H. Dekker
2,
Aneli M. Barbosa
3,
Joana L.M. Silveira
4,
Ana F.D. Vasconcelos
1,
Nilson K. Monteiro
1,
Gabriel Aranda-Selverio
1 and
Maria de Lourdes Corradi Da Silva
1,*
1
Department of Physics, Chemistry and Biology, Faculty of Science and Technology, University Estadual Paulista, Presidente Prudente 19060900, Brazil
2
Biorefining Research Initiative, Lakehead University, Thunder Bay, ON, P7B 5E1, Canada
3
Department of Biochemistry and Biotechnology, CCE, State University of Londrina, Londrina 86051990, Brazil
4
Department of Biochemistry and Molecular Biology, Federal University of Paraná, Curitiba 81531990, Brazil
*
Author to whom correspondence should be addressed.
Molecules 2011, 16(9), 7488-7501; https://doi.org/10.3390/molecules16097488
Submission received: 12 July 2011 / Revised: 18 August 2011 / Accepted: 23 August 2011 / Published: 2 September 2011

Abstract

:
Differential scanning calorimetry (DSC), thermogravimetry (TG) and Fourier-transform infra-red spectroscopy (FT-IR) analyses were performed to investigate changes in the physico-chemical properties of botryosphaerans, a family of exopolysaccharides (EPS) produced by the fungus Botryosphaeria rhodina MAMB-05 grown on glucose (EPSGLC), sucrose (EPSSUC) and fructose (EPSFRU). A slight endothermic transition and small mass loss attributable to the removal of water of hydration were observed in the DSC and TG analyses, respectively, for the three EPS samples. The FT-IR spectra confirmed no structural changes occurred during thermal treatment. Viscometry was utilized to obtain information on the rheological behaviour of the EPS in aqueous solutions. The Power Law and Cross Equations determined the natural pseudoplastic characteristics of the EPS. Comparatively, results obtained for EPS produced when B. rhodina MAMB-05 was grown on each of the three carbohydrate sources demonstrated similar apparent viscosity values for EPSGLC and EPSSUC, while EPSFRU displayed the lowest apparent viscosity of the three botryosphaerans, suggesting a higher degree of ramification and lower Mw. EPSGLC and EPSSUC possessed similar degrees of ramification. The slight differences found in their viscosities can be explained by the differences in the type of branching among the three botryosphaerans, thus varying the strength of intermolecular interactions and consequently, consistency and viscosity. The physico-chemical studies of botryosphaerans represent the originality of this work, and the knowledge of these properties is an important criterion for potential applications.

Graphical Abstract

1. Introduction

Biopolymers such as the polysaccharides find wide commercial applications because of their capacity to form viscous solutions or dispersions at low concentrations when hydrated [1,2]. The properties of some of these polysaccharides, such as thickening or gelling effects, the ability to stabilise emulsions or suspend solid particles, and the control of stability and texture of some products, find use mainly in the pharmaceutical and food industries [3,4]. Because biopolymers are abundant and largely derived from renewable resources, they are relatively inexpensive, non-toxic and amenable to both chemical and biochemical modifications tailored for specific applications [2]. Furthermore, the stabilising properties of these polysaccharides have also found widespread use in the preservation of fragile biological materials [5]. There is increasing interest in exopolysaccharides (EPS) derived from microbial species as potential substitutes for plant and algal-derived gums.
An important criterion in considering potential applications of EPS is that knowledge be available about their physicochemical properties ‑ thermal stability, rheology ‑ as well as possible molecular structural modifications that may occur during their handling and treatment. For example, their use in medical therapy requires that the EPS be sterilised, and this is generally achievable through autoclaving. It is therefore important that following thermal treatment, the EPS maintains its original conformation in order not to lose any of its desirable physical, chemical and biological properties.
Thermal analysis studies, such as differential scanning calorimetry (DSC) and thermogravimetry (TG), are common on polysaccharides [1,6,7] because they determine the effects of temperature associated with physical and/or chemical alterations, such as phase transitions and dehydration reactions (endothermic effects), and crystallization and oxidation (exothermic effects) [8]. Infra-red spectroscopy (FT-IR) is frequently used with polysaccharides [9], as this largely determines their structural features such as macromolecular conformation, and inter- and intramolecular interactions [10].
The group of EPS known as the β-glucans display high viscosity in aqueous solutions due to their high molecular weight (Mw), conformation and interactive properties. Since potential use of β-glucans as food hydrocolloids has been proposed based upon their rheological characteristics [11], it is necessary to have knowledge of these properties. Some parameters important in comparing EPS are, for example, consistency index (k, related to molecule relaxation time) and zero-shear rate viscosity (η0) [7,12]. Fluids that present a linear relationship between shear rate (γ) and shear stress (τ) are called Newtonian, and when this relationship is not maintained, they are considered non-Newtonian. Aqueous solutions of polysaccharides in may behave as non-Newtonian or Newtonian fluids. The viscosity is a function of shear rate and depends on the molecular weights and the polymer concentration [13]. The most important of these are the pseudoplastic group, where shear rate is dependent only upon shear stress and the apparent viscosity, which decreases as shear rate increases [14].
The fungus Botryosphaeria rhodina MAMB-05 produces an exopolysaccharide responsible for the high viscosity of the culture medium when cultured on glucose as sole carbon source [15]. This EPS, named botryosphaeran, forms a strong gel, and was characterized as a (1→3; 1→6)-β-D-glucan [16]. Furthermore, a family of botryosphaerans were produced when B. rhodina MAMB-05 was cultured on sucrose and fructose as carbon sources [17].
The triple helical conformation of polysaccharide structure in non-cellulosic β-glucans, which is stabilized by hydrogen bonds between the hydroxyl groups of the polysaccharide chains, appears to be responsible for the stable behaviour of these macromolecules. The presence of (1→6)-β linked gluco-oligosaccharide side-branches does not appear to interfere with the formation of the triple helix [18,19].
The aim of the present study was to investigate the physicochemical properties, thermal and rheological behaviour of botryosphaerans utilizing thermal, FT-IR and viscometry techniques. The botryosphaerans utilized in this paper were produced by B. rhodina MAMB-05 grown on three different carbohydrate substrates as sole carbon sources: glucose, sucrose and fructose, and are designated EPSGLC, EPSSUC and EPSFRU, respectively.

2. Results and Discussion
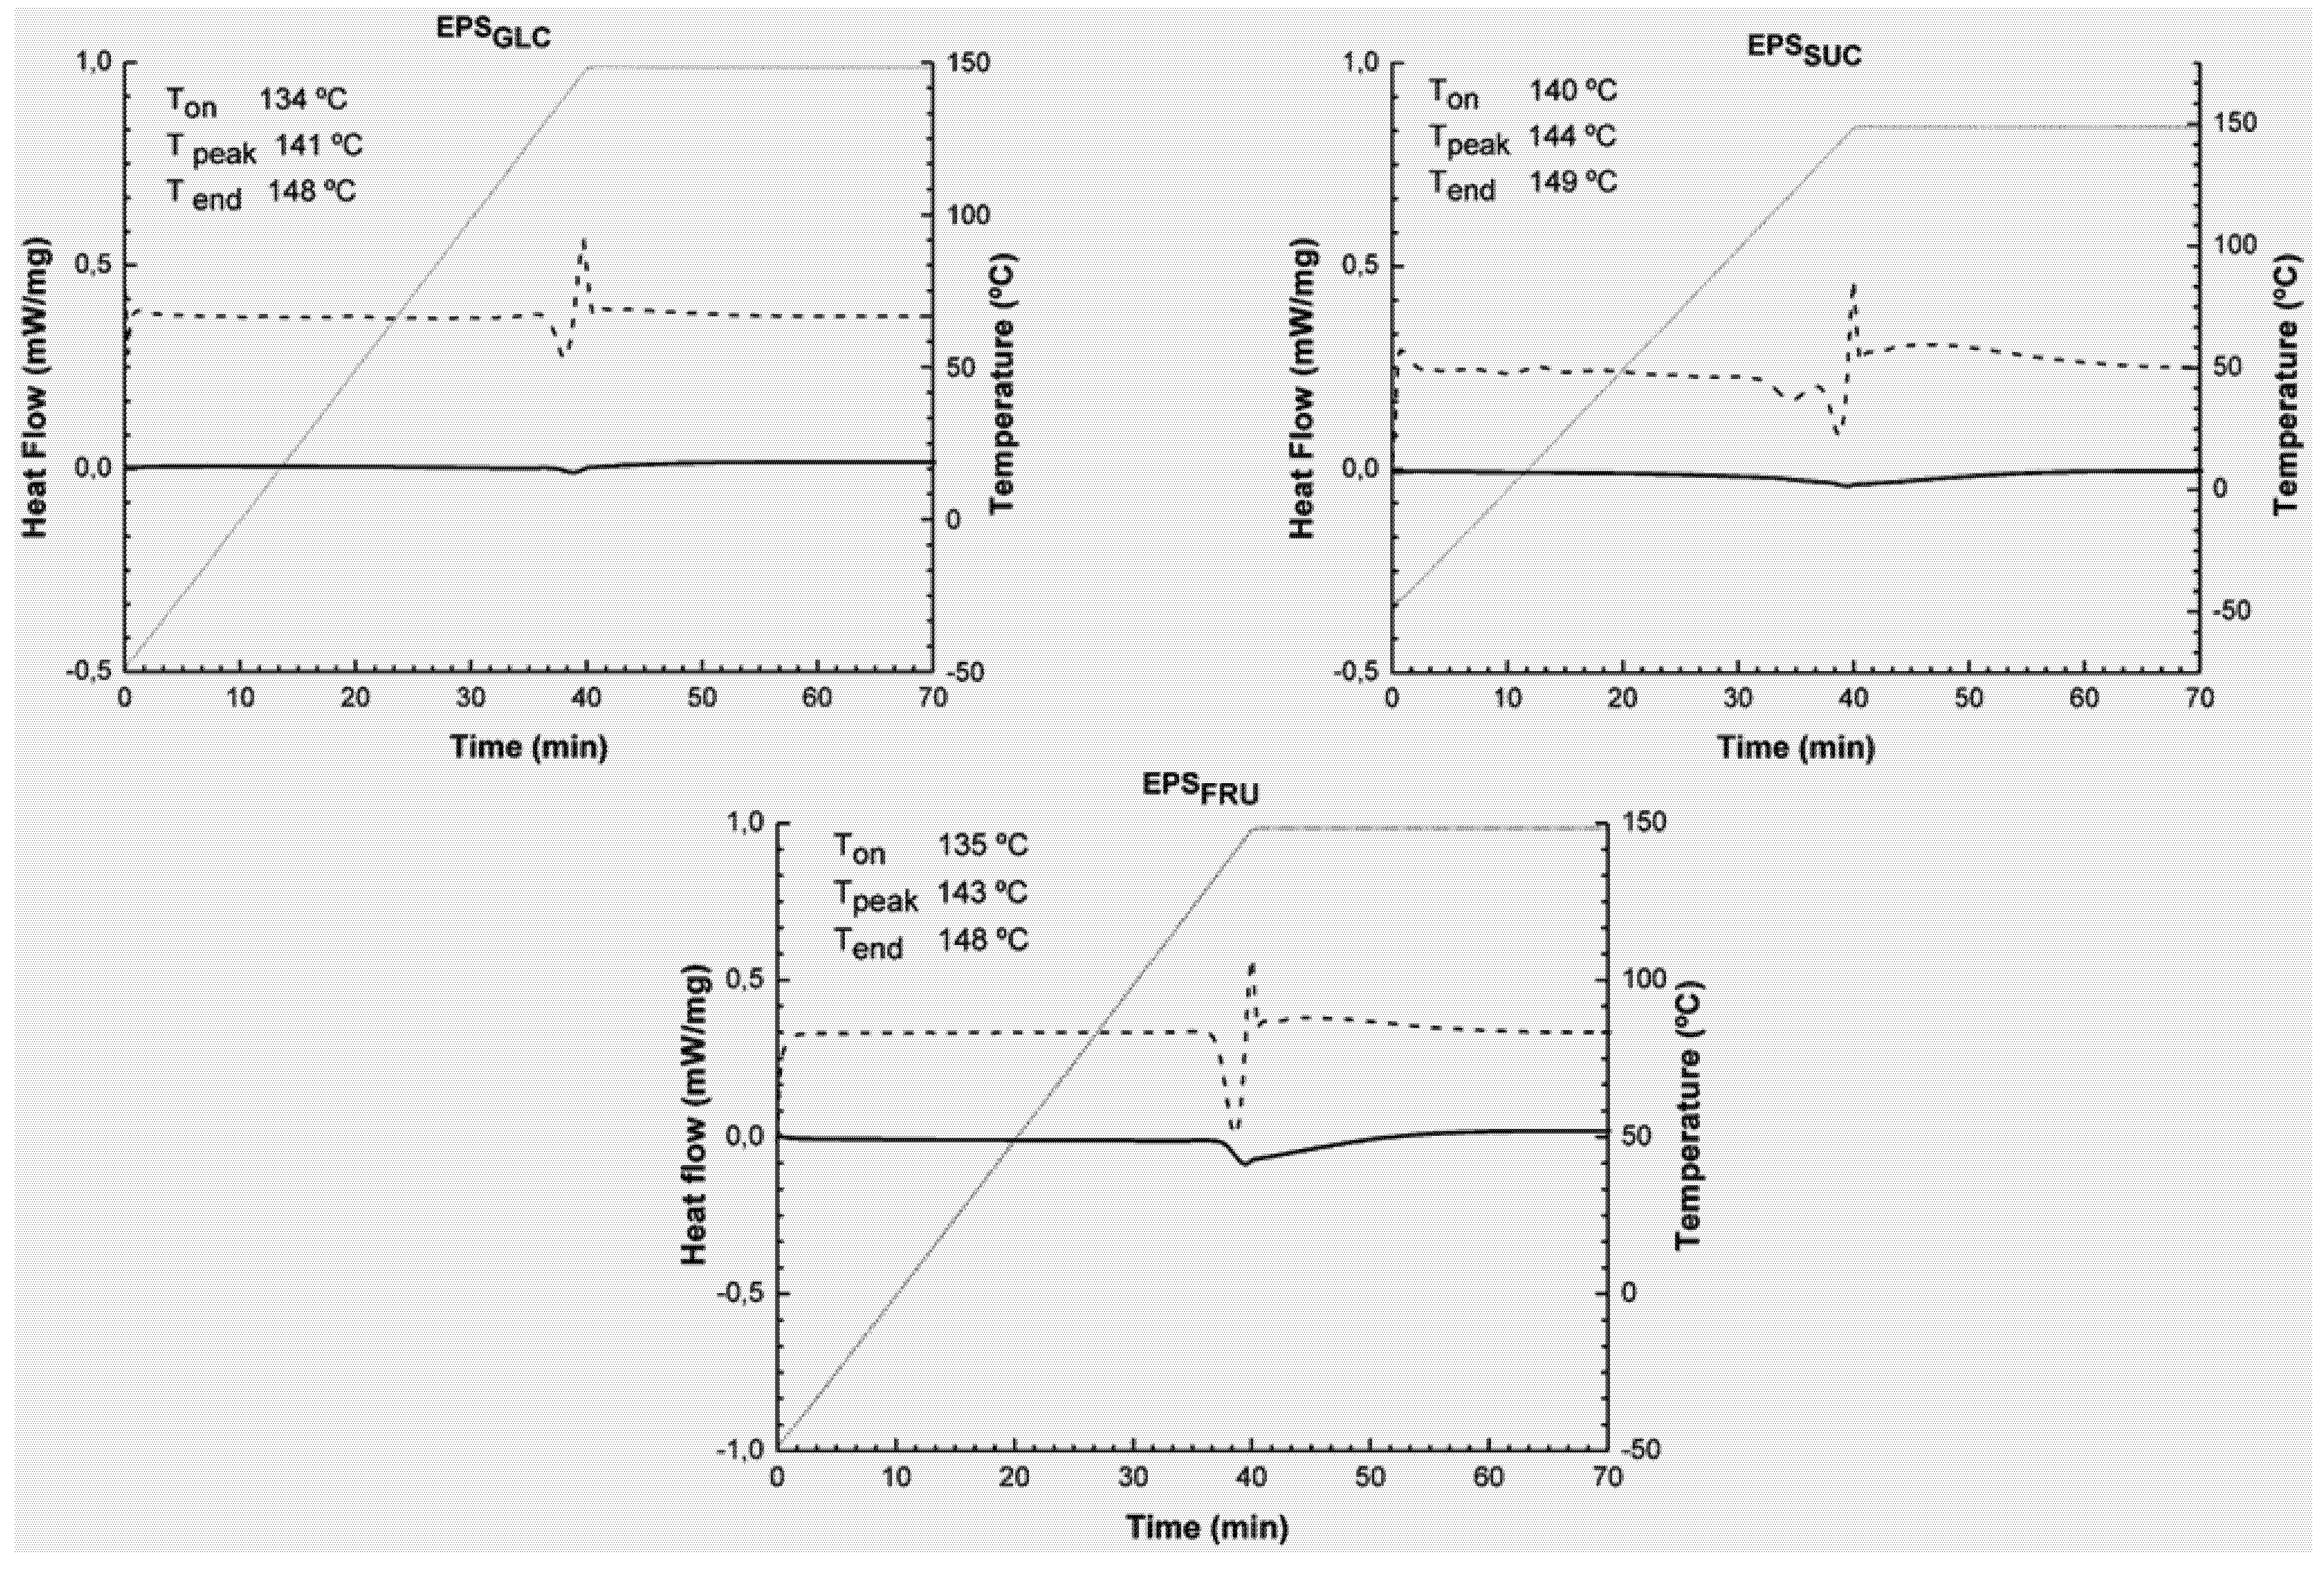
2.1. DSC Studies

Figure 1 shows that the EPS material behaved in a stable manner and did not present either exo- or endothermic peaks that are characteristic of physical and chemical transformations of the EPS. Only a small endothermic variation was observed, beginning at 137 °C, and more pronounced for EPSFRU. This slight transition is more visible on examining the derivative curve (Figure 1), and presented evidence of the start (Ton), middle (Tpeak) and end (Tend) temperatures of the DSC process. The slightly higher temperature of EPSSUC in relation to EPSGLC and EPSFRU can be due to some conformational variability of the molecules, since these EPS are derived from different carbon sources. However, the stable behaviour did not change with structural differences between the EPS molecules.
An endothermic transition was observed within a 134–149 °C temperature range, which is considered to be relatively high and can be attributed to water removal through evaporation since EPS is a very hydrophilic molecule. In a thermal study on natural and modified gums, Zohuriaan et al. [2] found endothermic peaks in the 63–143 °C temperature range, which they attributed to loss of water. Generally, depolymerisation and pyrolytic decomposition of polysaccharides occurs at much higher temperatures: about 350 °C [2]. To confirm that the observed endothermic variations corresponded to water of hydration, DSC was performed on EPSGLC, EPSSUC and EPSFRU beginning at ambient temperature and increasing to 200 °C (heating rate of 5 °C/min). Thereafter, the material was immediately cooled to 30 °C followed again by heating to 200 °C at the same heating rate as before. Results obtained for EPSGLC, EPSSUC and EPSFRU were similar: in the first heating run there was an endothermic variation at about 145 °C, which did not occur during the second run. A likely explanation for this observation is that the EPS was freed from hydration water after the first heating step, and endothermic variation corresponded to loss of these water molecules, which did not appear during the second heating run. This observation indicated that there was no change in the chemistry of the main polymer chain.
Figure 1. DSC (—) and DDSC (---) curves for botryosphaerans EPSGLC, EPSSUC and EPSFRU over the 50–150 °C temperature range. The heating rate was 5 °C/min, with an isothermal hold at 150 °C for 30 min.
Molecules 16 07488 g001

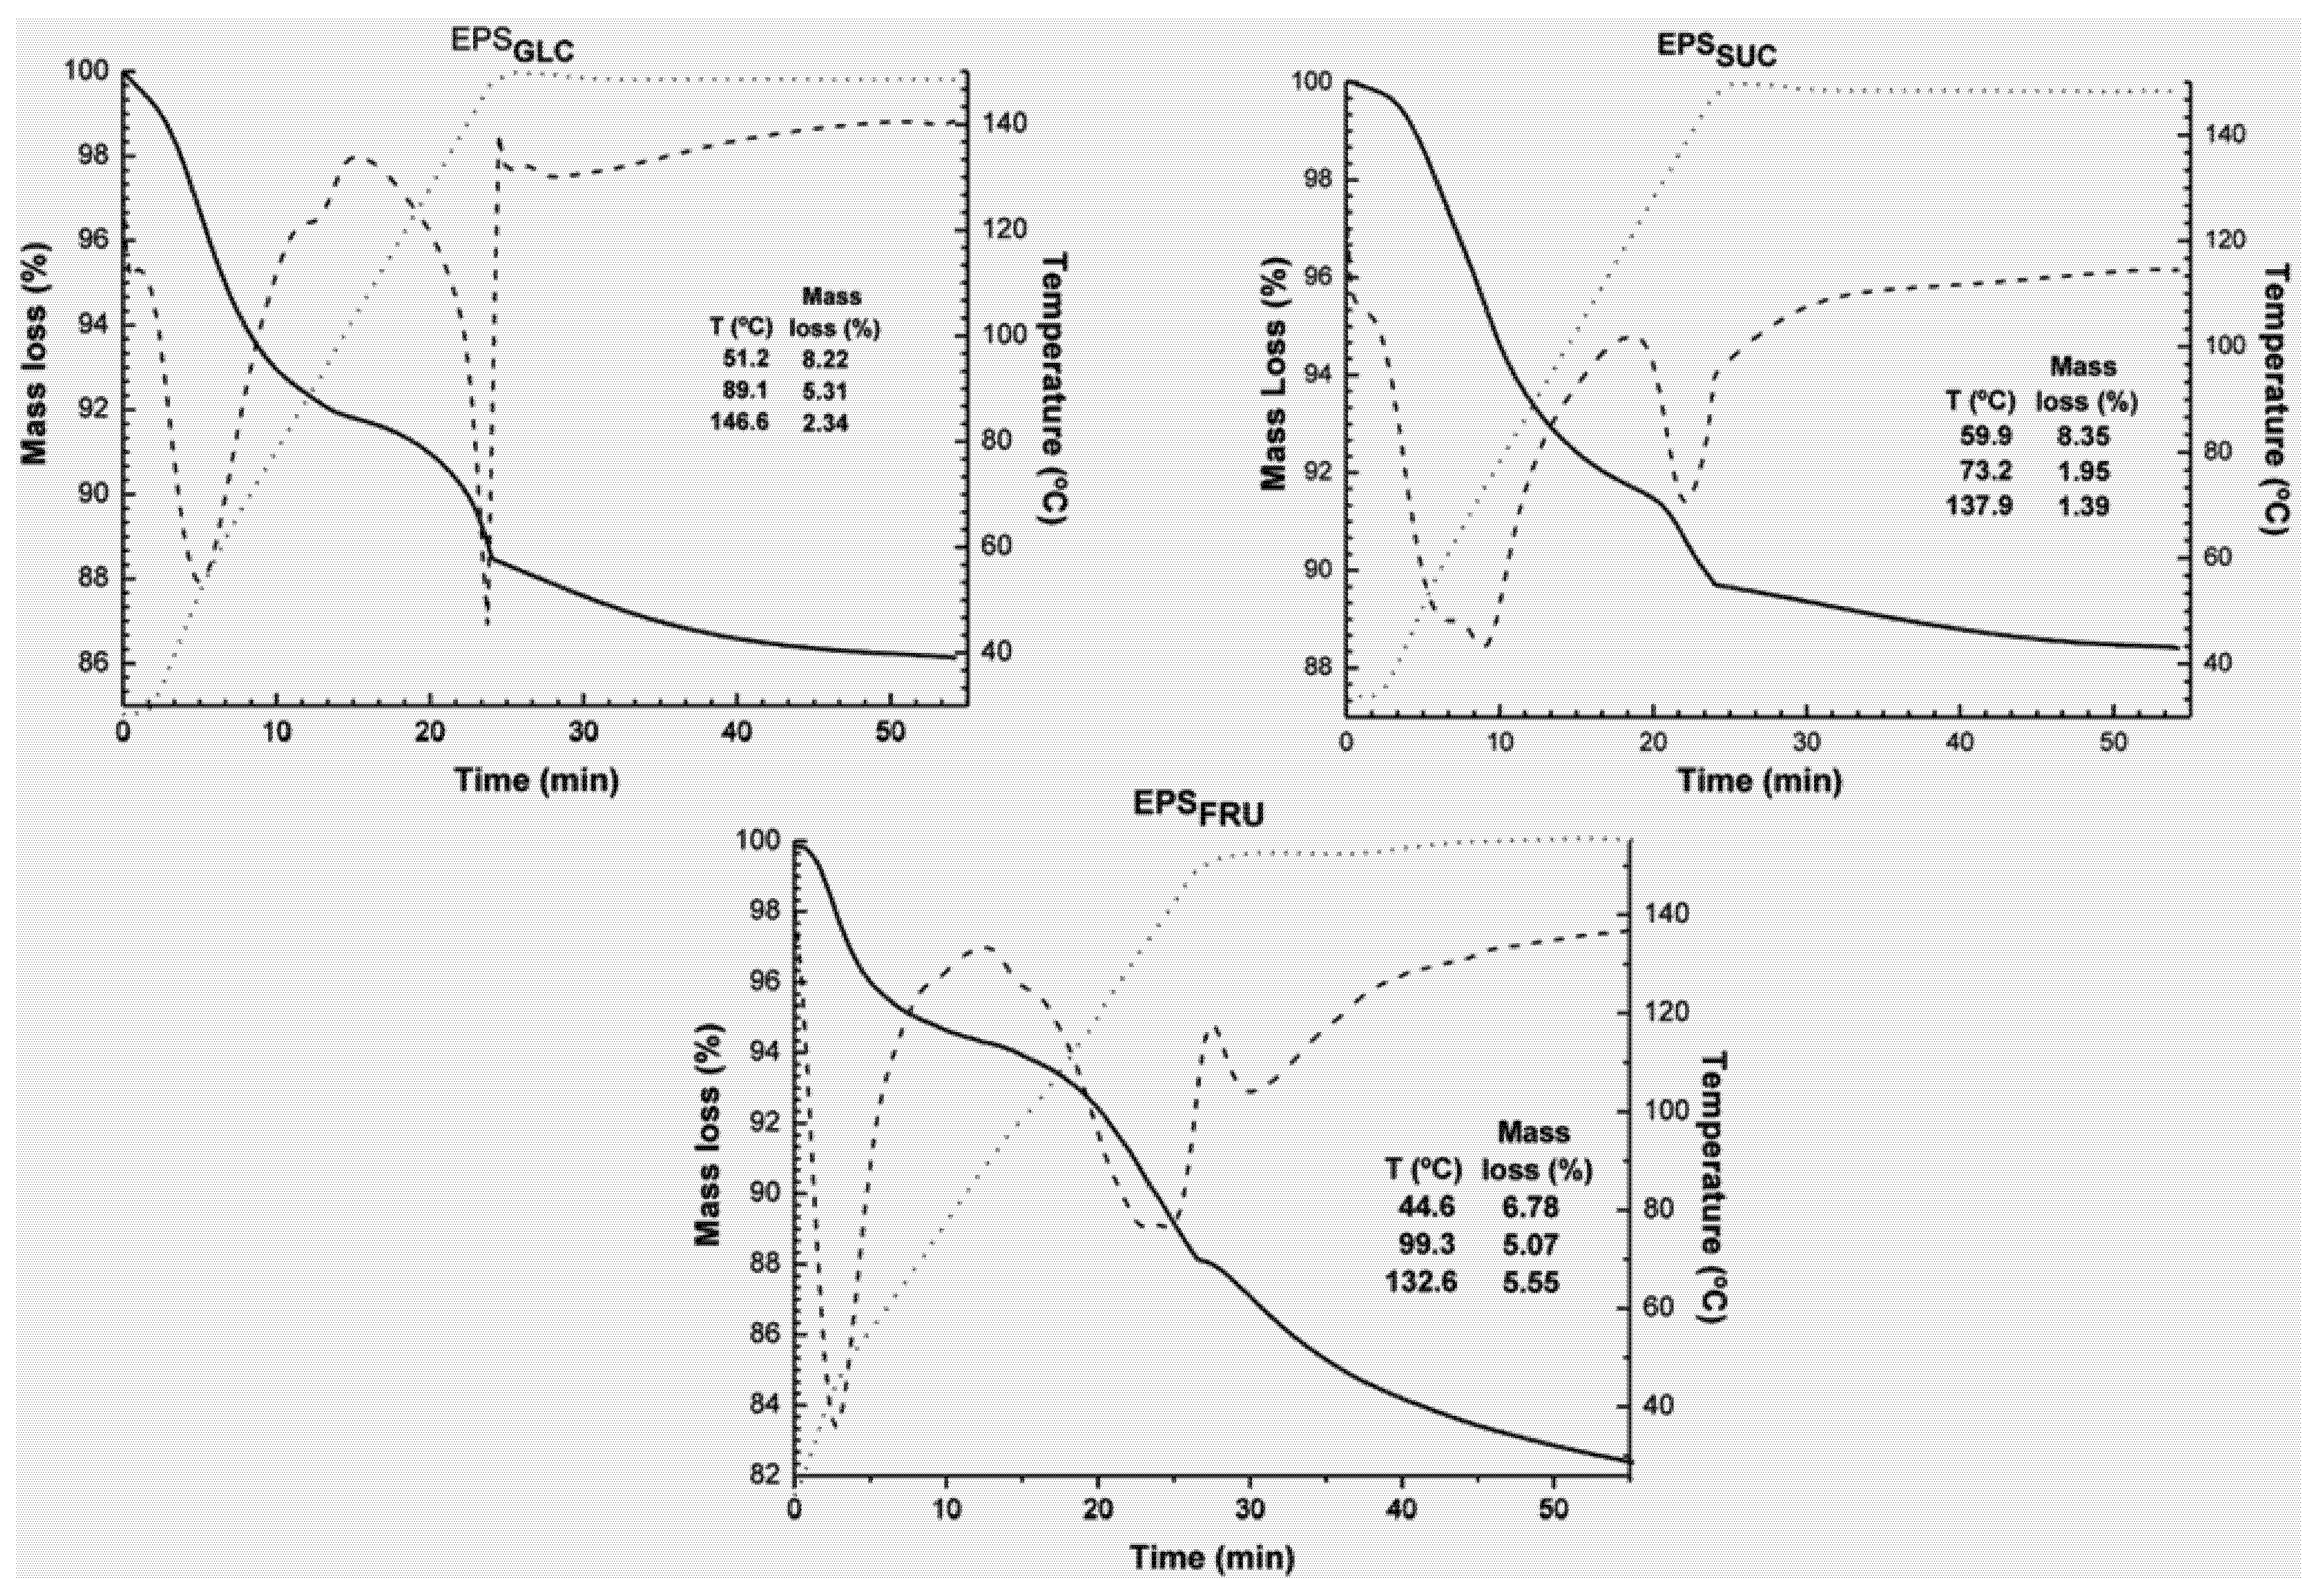
2.2. Thermogravimetric Studies

Thermogravimetric (TG) analysis was employed to study the thermal stability of EPS. This determined the mass loss (%) during the heating interval of the sample. Figure 2 shows the TG curve profiles of the EPS samples, demonstrating the similar thermal behaviour of all three botryosphaerans. The mass loss of EPS can be divided into three stages, although it refers to removal of water molecules (i.e., water of hydration). The initial mass loss demonstrated by the first peak on the derivative curve (DTG), refers to water absorbed by the material during preparation for analysis, because the heating stage was conducted in an open pan. The second large peak, at 132–146 °C, was related to a small endothermic transition found by DSC analysis, and was also a consequence of removal of hydration water. The mass loss by EPSSUC appeared to start at a slightly higher temperature in relation to EPSGLC and corresponded to what was found by DSC analysis. The third and last stage corresponded to a mass loss by evaporation, and remained virtually constant as this occurred where there was no further rise in temperature. Figure 2 shows the mass losses in terms of percentages, and was highest for EPSFRU (17.40%), probably because this sample was more hydrated, which might be related to its higher degree of ramification [16,17].
Figure 2. TG (—) and DTG (---) curves for botryosphaerans EPSGLC, EPSSUC and EPSFRU within the 30–150 °C temperature range. The heating rate was 5 °C/min, with an isothermal hold at 150 °C for 30 min.
Molecules 16 07488 g002

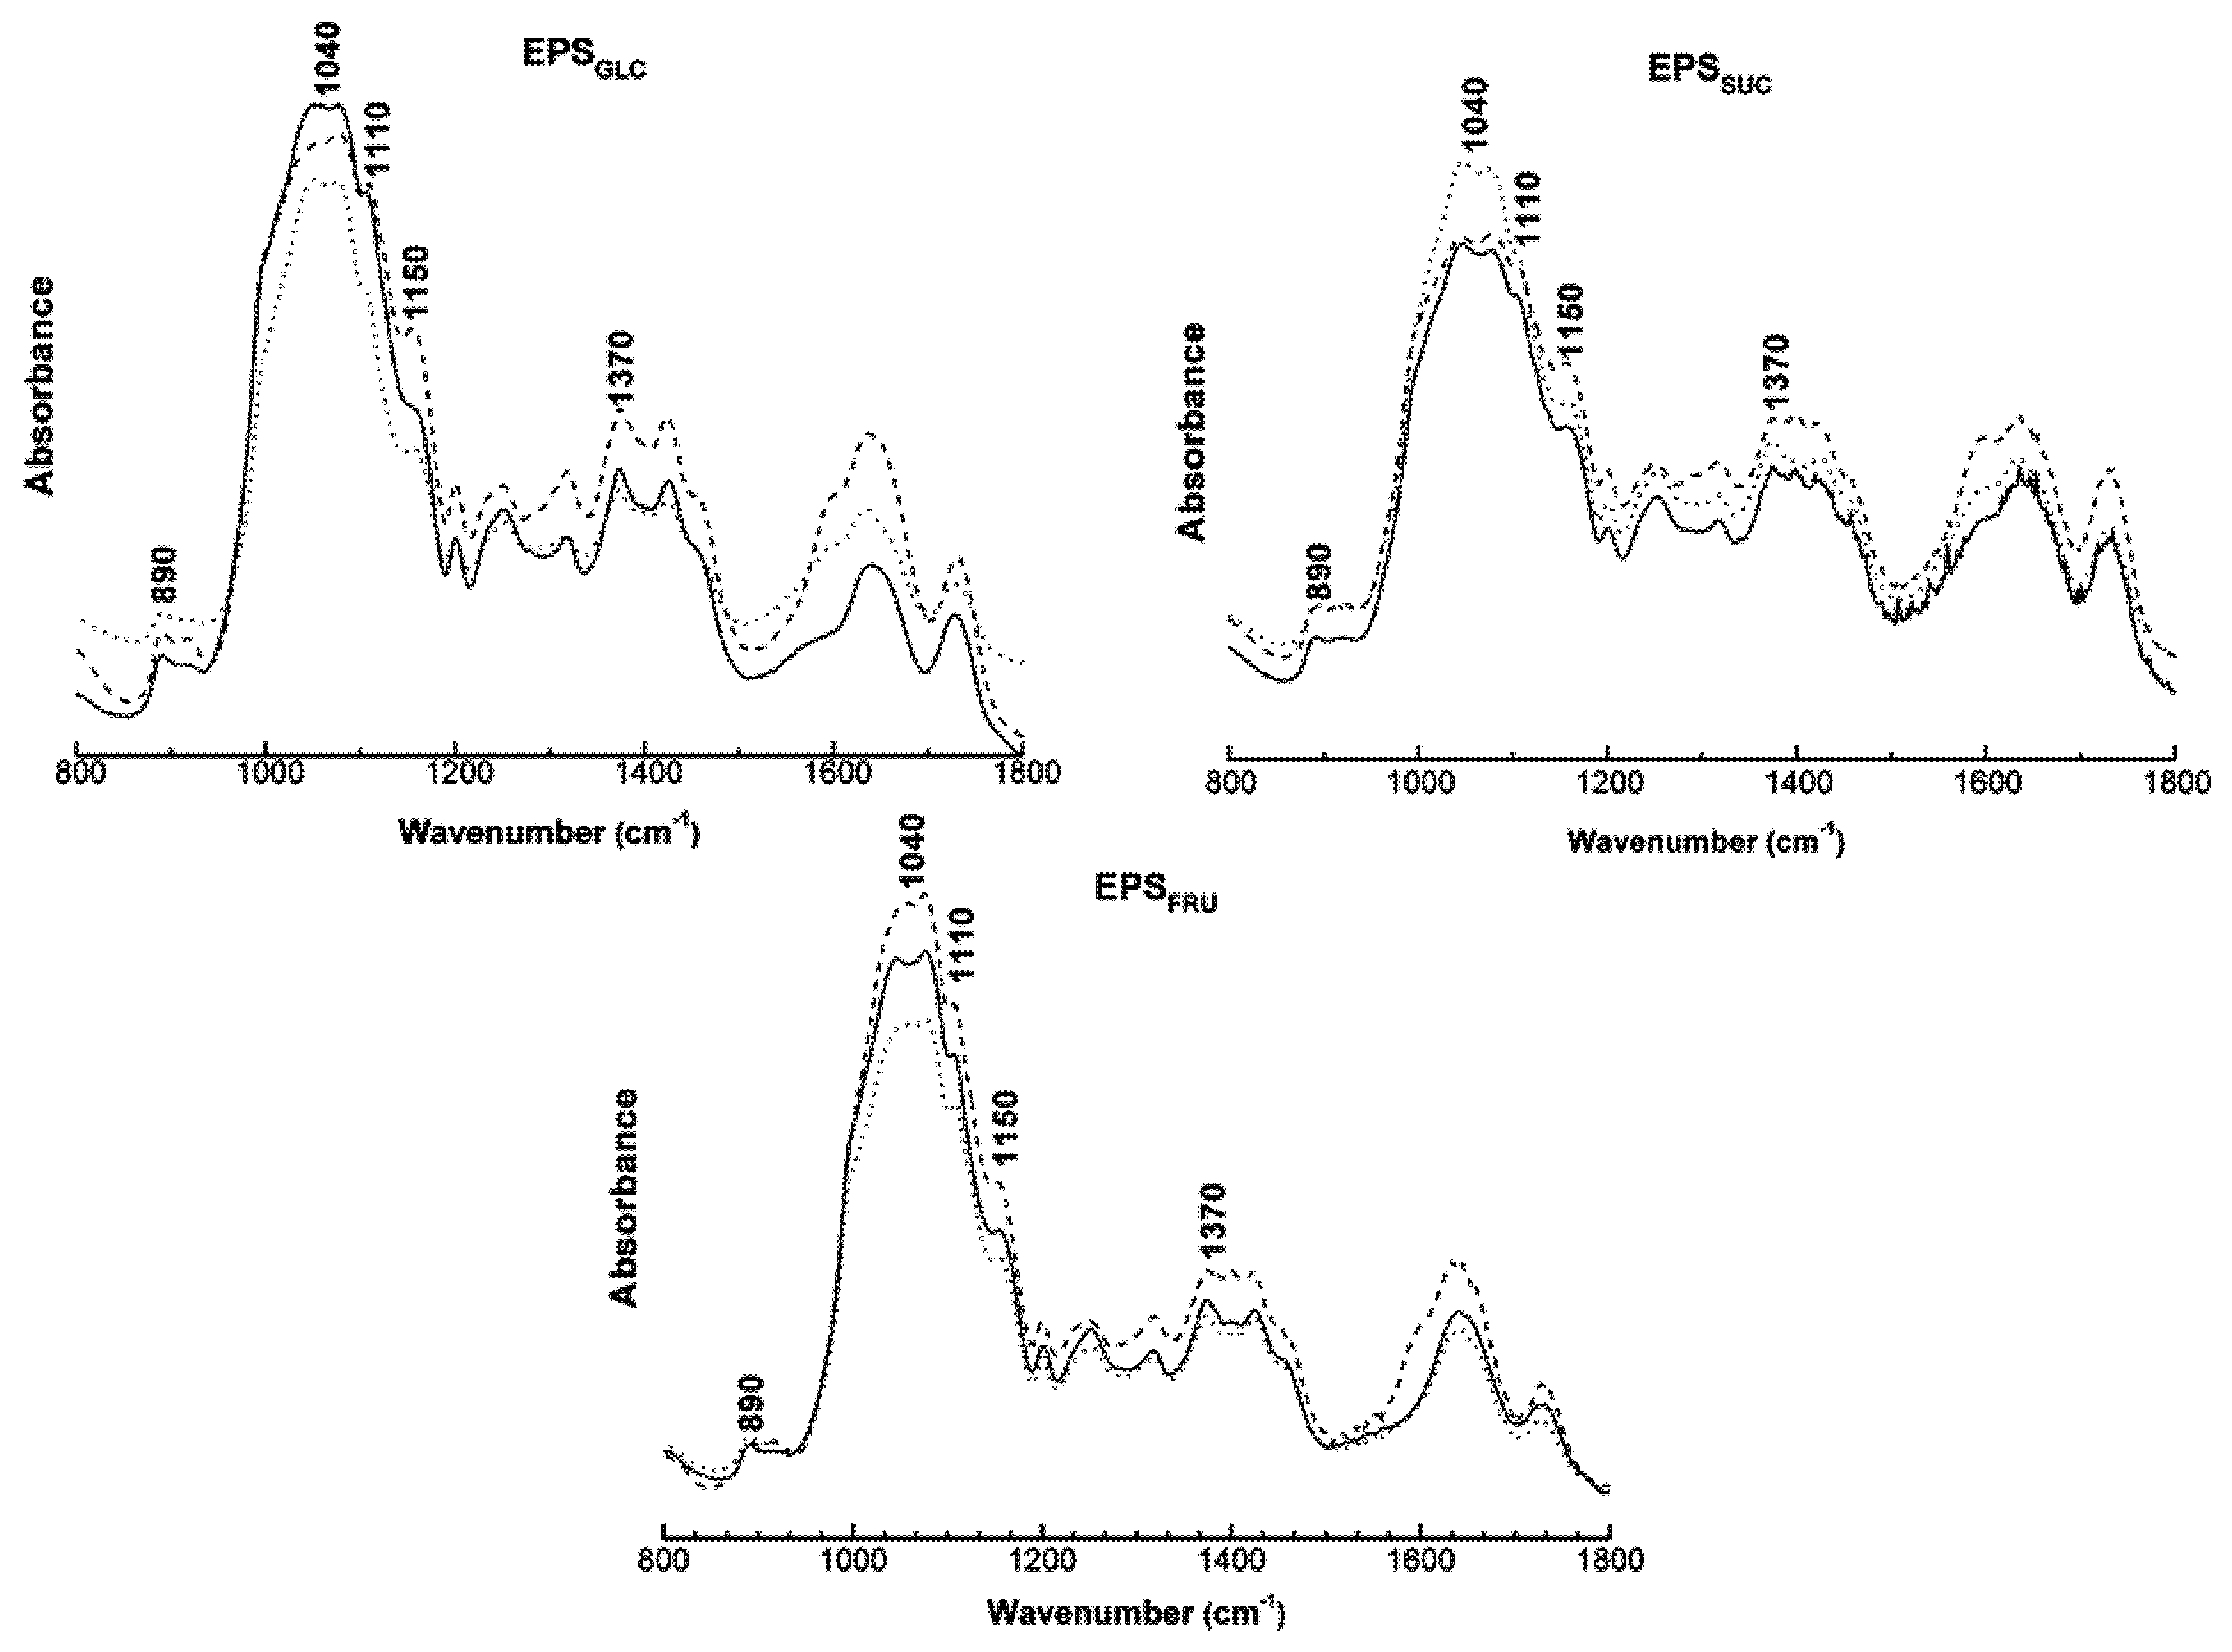
2.3. FT-IR Spectroscopy Studies

FT-IR was used to compare the results of analysis of the original EPS samples with those obtained after the samples were heated; in other words, before and after each thermal treatment. The spectra presented in Figure 3 showed similar results for all three of the botryosphaeran samples. The shoulder bands formed in the region between 1,500 and 900 cm−1 demonstrated there was no significant change (or alteration) of linkages corresponding to these bands. The bands at 1,040, 1,110 and 1,150 cm−1 corresponded to glucosidic linkages of the (1→3) type. The bands at 890 and 1,370 cm−1 corresponded to glucosidic linkages with a β-configuration. The characteristic β-glucan (1→3) linkages remained unchanged after each thermal treatment. The small variations that occurred in the spectra were not significant and were probably associated with the mild mass loss (removal of hydration water) and the endothermic transition found in the TG and DSC analyses, respectively.
Figure 3. FT-IR Spectra for botryosphaerans EPSGLC, EPSSUC and EPSFRU before analysis (---), after TG (___) and after DSC (….), showing the characteristic bands of glucosidic linkages.
Molecules 16 07488 g003

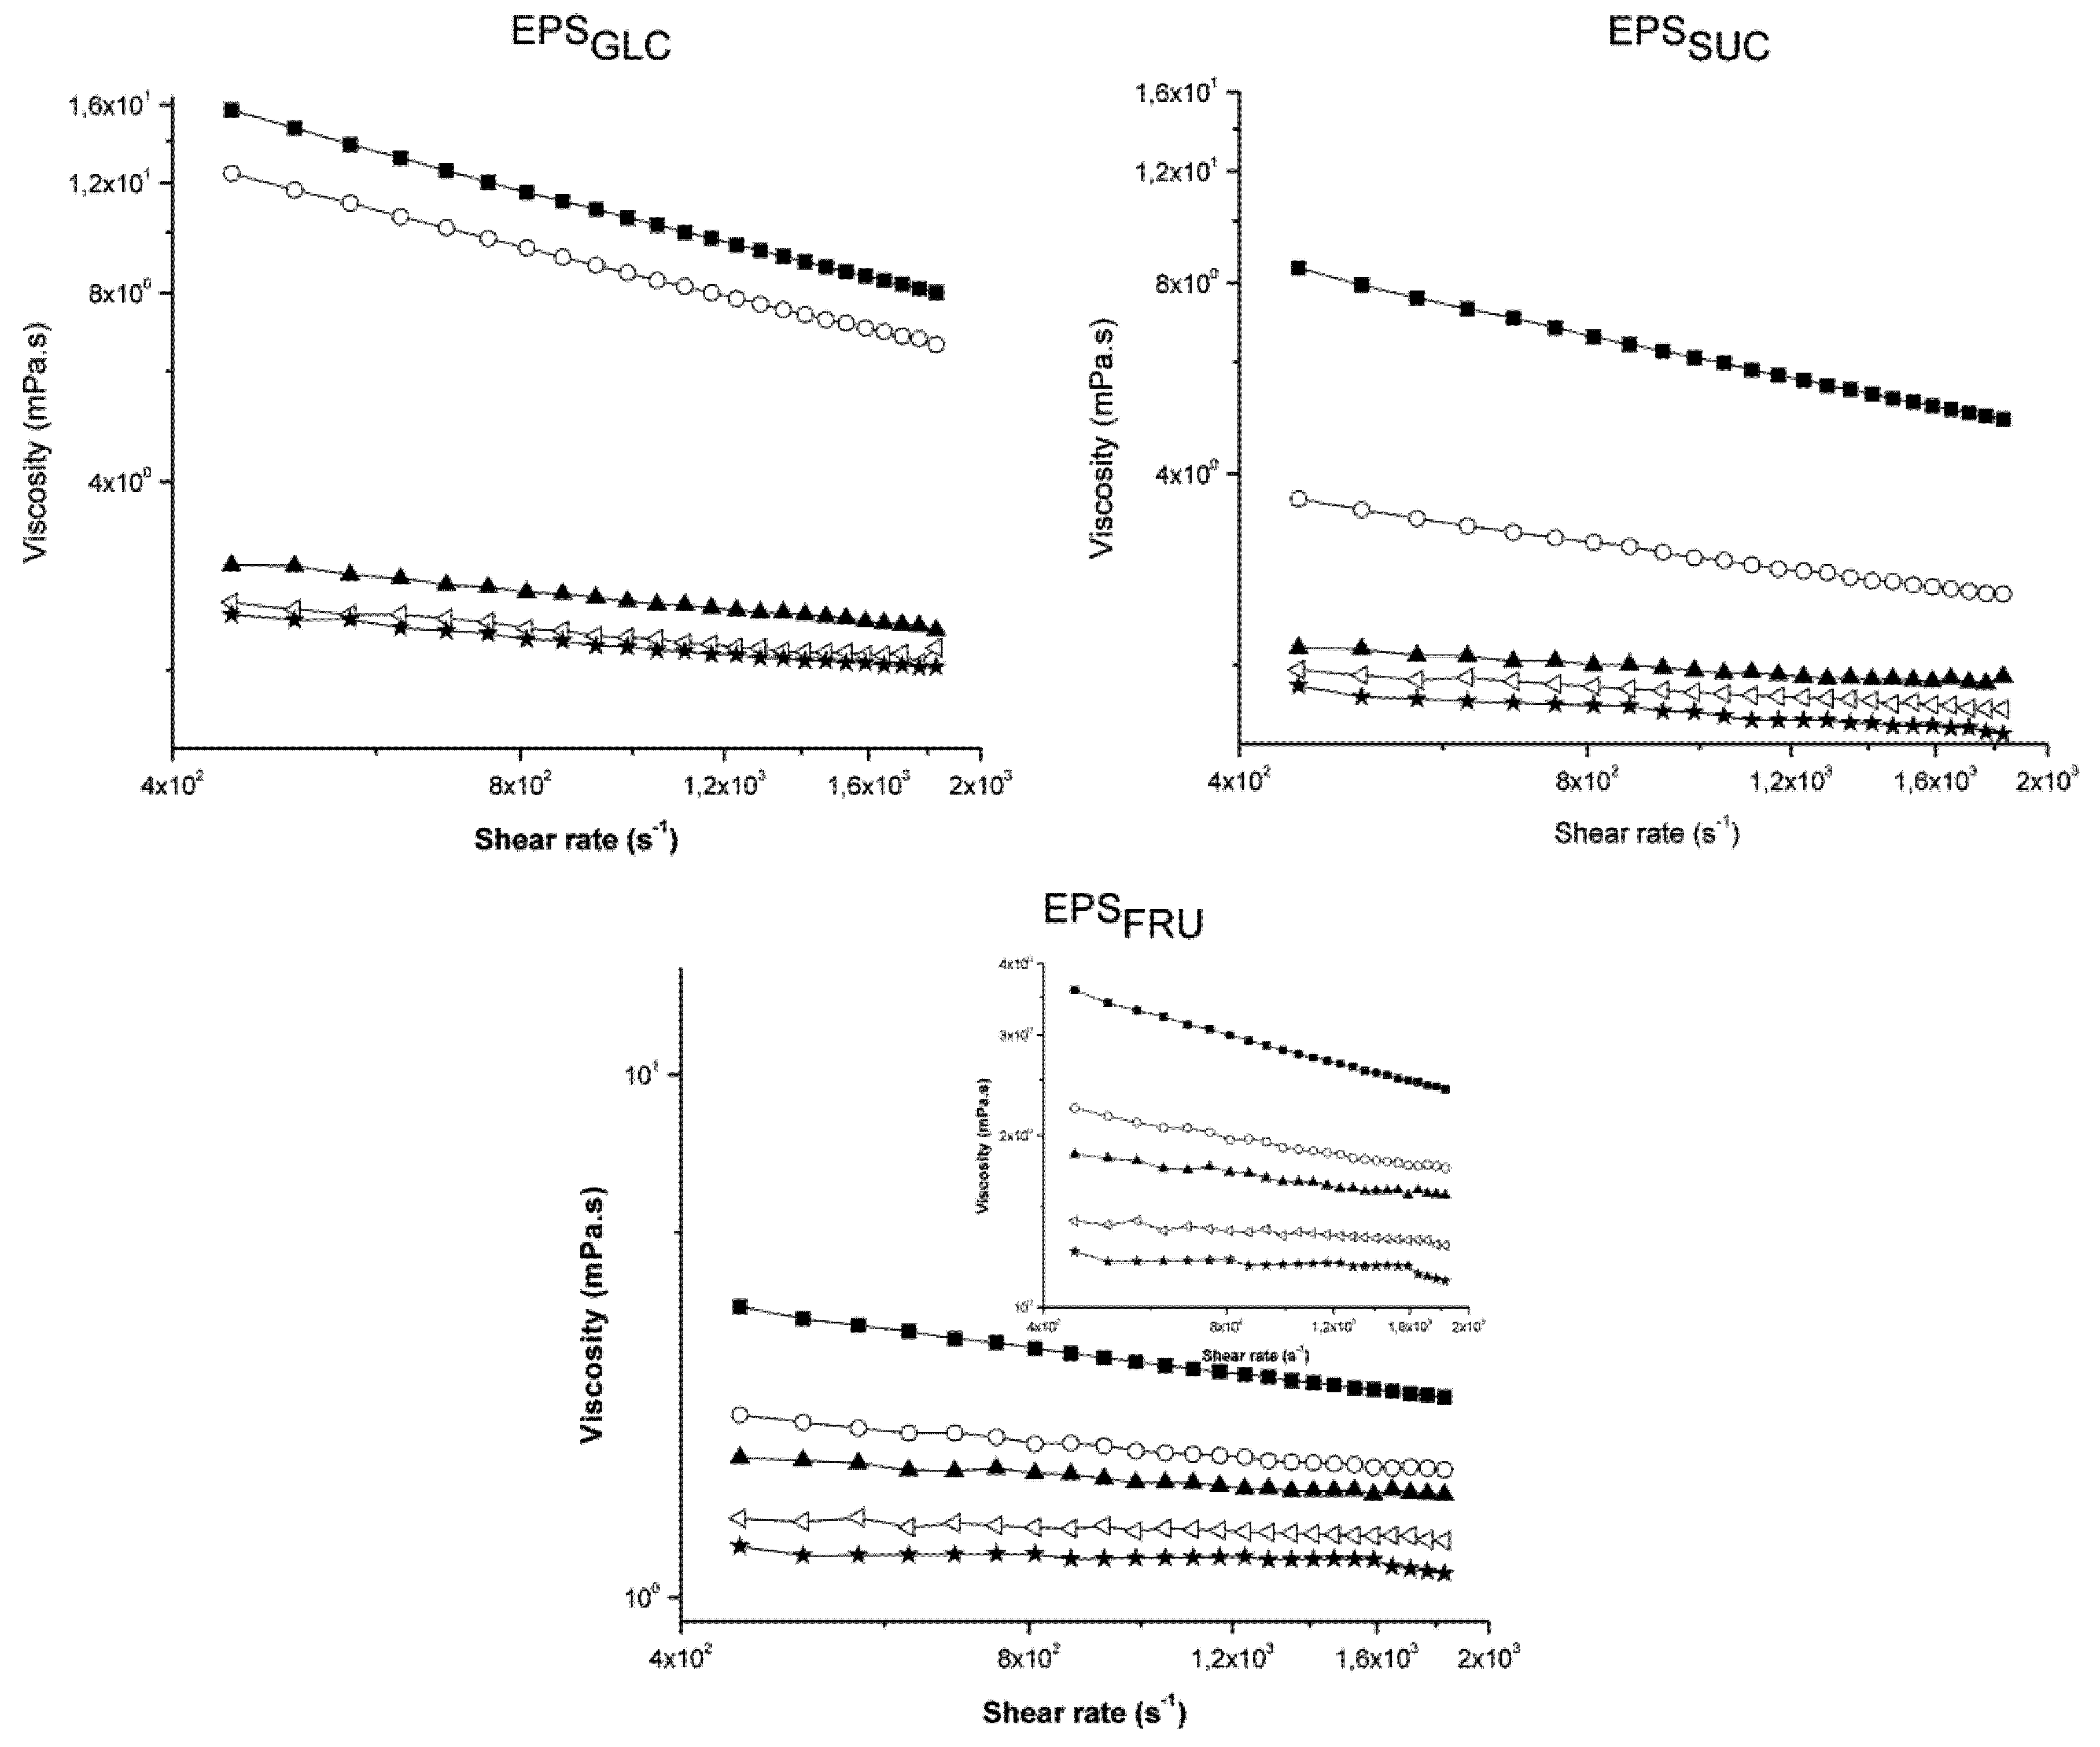
2.4. Rheological Analysis

Rheological studies conducted on the different EPS produced by B. rhodina MAMB-05 demonstrated the pseudoplasticity of these biopolymers. Ding. et al. [6] studied the EPS produced by the bacterium Erwinia chrysanthemi using capillary viscometry to qualitatively compare EPS pseudoplasticity and rotational rheometry (cone-and-plate) to obtain η0 values using the Cross equation. Morris et al. [20] used the Cross Equation to extrapolate shear rate at zero, and found η0, for an EPS from the cyanobacterium Aphanothece halophytica GR02, and compared this with xanthan derived from Xanthomonas campestris.
Figure 4 shows a plot of the apparent viscosity (η) versus shear rate (γ) of the three botryosphaeran samples. At concentrations less than 3 g/L for EPSGLC and EPSSUC, and less than 4 g/L for EPSFRU, the EPS apparent viscosities did not show any significant variations, just a slight decrease with a rise in γ, thus demonstrating an apparent Newtonian fluid behaviour. However, at concentrations of 4 g/L and 5 g/L for EPSGLC and EPSSUC, and 5 g/L for EPSFRU, the viscosity of the EPS solutions declined (exponentially) with an increase in shear rate. This behaviour is consistent with pseudoplasticity, and was non-thixotropic because increases and decreases in the shear rate produced the same curve for each EPS concentration (data not shown).
Figure 4. The apparent viscosity (η) versus shear rate (γ) in log scale for botryosphaerans at different concentrations: 1.0 g/L (-★-), 2.0 g/L (-▭-), 3.0 g/L(-▲-), 4.0 g/L (-○-) and 5.0 g/L (-■-). a) EPSGLC; b) EPSSUC; c) EPSFRU. The inset EPSFRU graph is shown on a different scale to demonstrate “shear thinning” of EPSFRU.
Molecules 16 07488 g004
The Power Law Equation [(1), Section 3.6] is one of the most widespread models in the literature for determining apparent viscosity data, and most of the calculation procedures related to non-Newtonian fluids are based on this equation [14,21]. Table 1 shows the k and a values for each EPS at each of the concentrations examined.
Table 1. Values for consistency index or relaxation time (k) and Power Law index (a) for each concentration of the different botryosphaerans. These values confirmed the information presented in Figure 4.
Concentration (g/L)EPSGLCEPSSUCEPSFRU
k *ak *ak *a
10.0050.8630.0020.8910.0020.966
20.0060.8600.0030.9000.0020.960
30.0080.8330.0030.9210.0030.891
40.1800.5600.0150.7360.0060.834
50.2650.5330.0840.6210.0180.730
* The unit of consistency index is mPa·s.
As all of the a values were found to be less than 1, this finding constitutes evidence of pseudoplasticity for each of the botryosphaerans. The a values at the three lowest concentrations of EPS examined were also close to 1, corroborating what was demonstrated in Figure 4. In other words, the EPS solutions tended to become Newtonian at low concentrations, in dilute regimes, as the a values approached 1. These viscometric properties were similar to those reported for xanthan and the EPS produced by several E. chrysanthemi species [22,23].
When tension is applied to a fluid constituted of macromolecules, the polymer chains adapt so that they become oriented in the direction of the flow. If the shear stress increases, the conformation of the biopolymer chains reaches maximum orientation. At this point, viscosity reaches a minimum and does not appear to be influenced by any further increases in shear stress [24]. Ding et al. [22] found similar rheological characteristics in a study with an EPS from E. chrysanthemi.
In comparing the data obtained for each botryosphaeran (Figure 4), the apparent viscosity of EPSGLC presented higher values than EPSSUC, which, in turn, was higher than EPSFRU. If η is large at low concentrations, the macromolecule must have a high axial ratio and, conversely, if η is small at high concentrations, the molecule must be somewhat compact [25]. The high η values of EPSGLC suggested that its molecular axial ratio was larger than that of EPSFRU, which possessed a more compact axial ratio with more ramifications. The higher and lower k values (Table 1) also confirmed this conclusion, thus demonstrating that EPSGLC had the highest viscosity and consistency in relation to the botryosphaerans produced on fructose and sucrose.
If η decreases significantly with increasing shear rate, the axial ratio must be high, because it is easier for a long and thin molecule to become oriented during flow than one that is short and thick [25]. Therefore, the more branched the molecule, the shorter and thicker it will be, and consequently, the more difficult its orientation during flow becomes. Less shear-thinning will therefore occur, suggesting that the degree of ramification of botryosphaeran produced on fructose as carbon source was higher than that produced when the fungus was grown on glucose. This finding was substantiated through the characterization of the chemical structure of these botryosphaerans [16,17].
The Cross Equation [(2), Section 3.6], a non-Newtonian mathematical model, has proved to give an excellent fit to the experimental flow curves of several polysaccharide solutions [26,27]. In these cases, the k constant was also related to the molecule’s structural relaxation time, which corresponds to the time it takes to break (during shearing) the entanglements formed by non-bonded interactions between the EPS molecular chains. The more concentrated the solution, the more intermolecular associations that EPS forms. Consequently, the freedom of movement of individual chains becomes progressively restricted, resulting in increases in the time required to form new entanglements to replace those disrupted by an externally imposed shear [7].
Pseudoplastic behaviour can be explained by the disruption of the structure formed by long polymer chains with an increase in the shear speed. These chains tend to align themselves in parallel to the normal orientation of the chains, decreasing the resistance to flow [14]. The k values for the three botryosphaerans are summarized in Table 1, from which it was concluded that the higher viscosity, the higher will be the molecular structural relaxation time.
The chemical structures of the botryosphaerans produced by Botryosphaeria rhodina MAMB-05, when grown on glucose, sucrose and fructose, have been determined [16,17]. According to the results of methylation and Smith degradation, EPSFRU was shown to have the highest degree of ramification (see data presented in Table 2). The degree of ramification of EPSGLC and EPSSUC were very similar. Nevertheless, they were distinctly different in the type and extent of the branched substituents. In addition, gel permeation chromatography determined that EPSGLC possessed a higher Mwthan the EPS produced on the other two carbon sources, with the EPSFRU having the lowestMw.
Table 2. The degree of branching, proportion of glucose and gentiobiose branch units, elution volume, and η0 of the three botryosphaerans.
SamplesExtent of branching (%) *Proportion of branches (%) *Elution volume (mL) **η0 of EPS solution (mPa.s) at substrate concentration of (g/L)
GlucoseGentiobiose15
EPSGLC22 61620.83.27120.52
EPSSUC2112921.32.0833.24
EPSFRU31161522.41.346.96
* From [17]; ** gel permeation chromatography on Sepharose CL-6B
Thus, a plausible explanation for the viscosity differences found between EPSGLC and EPSSUC can be influenced by the type, and degree, of ramification by the substituents on the interaction among the β-(1→3)-glucan chains. Added to this, the highest molecular weight of botryosphaeran was that produced on glucose (EPSGLC) according to gel filtration, and this also determined the highest viscosity.

2.5. Capillary Viscometry

Using the Martin Equation [(3), Section 3.6] and extrapolating the viscosity values of each botryosphaeran to zero, resulted in the logarithmic values of the intrinsic viscosity, which were in agreement with the sequence of higher and lower viscosity values found by rotational rheometry.
An empirical relationship exists between the weight-averaged molar mass (Mw) and the intrinsic viscosity [η], and is directly proportional for same-pair polymer solvent systems at the same temperature [24]. The intrinsic viscosity for EPSGLC (54.95 dL/g) was much higher than that of EPSFRU (16.98 dL/g). From this information we concluded that the Mw of EPSGLC was highest, and that of EPSFRU the lowest. EPSSUC possessed a lower Mw than EPSGLC, but not greatly different, and this explains why its [η] value (41.69 dL/g) was close. These intrinsic viscosity values may be compared to literature values of other polysaccharides. For example, the EPS from Propionibacterium acidi-propiocini had an intrinsic viscosity of 22 dL/g that corresponded to a Mw of the order of 106 g/mol [7]. An intrinsic viscosity value of 45 dL/g was found for an EPS from red microalga [28] with an expected Mw of ~6 × 10⁶ g/mol, while the intrinsic viscosity of oat β-glucans was lower and varied between 0.67 and 3.38 dL/g with the Mw ranging from 35 to 250 × 103 g/mol [11]. These literature findings allowed us to infer that the botryosphaerans have a high Mw, and this might explain why they become extremely viscous in aqueous solutions at low concentrations. The Mw reported for a polysaccharide from another B. rhodina strain (viz., DABAC-P82) was of the order of 4.875 × 10⁶ [3], thus indicating the high Mw of the polysaccharides produced by B. rhodina.
The conformation of polysaccharides in solutions, especially in aqueous solutions, can be investigated according to the theory of dilute polymer solutions. The intrinsic viscosity [η] is a characteristic property of polysaccharide solution [29,30]. Intrinsic viscosity also provides a convenient measure of the hydrodynamic volume of individual polymers coils, and when this is multiplied by concentration gives an index of total degree of “space-occupancy”, the reduced concentration (c[η]). For the three botryosphaerans the hydrodynamic volume of EPSFRU showed lower values, while EPSGLC and EPSSUC had fairly similar values over the ranges studied (data not shown). In aqueous solution, linear chains expand (“space-occupancy”) much more than branched chains because the linkages among the chains limit their expansion coefficients [24]. From this information it was concluded that EPSFRU was the most branched, as it possessed the lowest hydrodynamic volume among the botryosphaerans produced on the three carbon sources studied.

3. Experimental

3.1. Production of Botryosphaeran

Botryosphaerans (EPS) was produced by cultivating the fungus Botryosphaeria rhodina MAMB-05 on minimal salts medium containing either glucose (EPSGLC), fructose (EPSFRU) or sucrose (EPSSUC) as the sole carbon source, and were recovered from the cell-free culture fluid by precipitation with 4 volumes of ethanol as described previously [16,17].

3.2. Differential Scanning Calorimetry (DSC)

DSC measurements were carried out with a Netzsch 204 Phoenix Thermal Analyzer (Netzsch -Gerätebau GmbH, Selb, Germany). All measurements were conducted in duplicate using hermetically sealed 25 μL volume aluminium pans, containing 4 mg of each dried EPS sample (EPSGLC, EPSSUC and EPSFRU). An empty aluminium pan was used as reference. DSC analyses were performed under nitrogen at a flow rate of 20 mL/min. Samples were heated at a rate of 5 °C/min from −50 °C to 150 °C, and were then kept isothermal for 30 min. Derivative curves of DSC (DDSC) were recorded, and the thermograms analysed using the Proteus Software for Thermal Analysis (Netzsch) for Microsoft Windows 95/98 NT 4.0/2000.

3.3. Thermogravimetric (TG) Analysis

TG measurements were carried out with a Netzsch 209 Iris Thermal Analyzer (Netzsch). Measurements were performed in duplicate using 40-μL volume open aluminium pans containing 5 mg of each dried sample (EPSGLC, EPSSUC and EPSFRU). TG analyses were conducted under nitrogen at a flow rate of 15 mL/min. Heating was performed in the range of 30–150 °C with a temperature rate increase of 5 °C/min, and then maintained at 150 °C for 30 min. Derivative curves of TG (DTG) were recorded and analysed using Proteus Software for Thermal Analysis.

3.4. Fourier-Transform Infra-red Spectroscopy (FT-IR)

FT-IR spectroscopy was carried out using a Bruker Vector 22 Model FT-IR Spectrometer (Bruker Optik GmbH, Ettlingen, Germany) on 4–5 mg of each freeze-dried botryosphaeran sample in 250 mg of KBr. Scans were performed within the 1,800–800 cm−1 range at a resolution of 2 cm−1. Spectra were taken before and after each thermal analysis, and OPUS/IR NT4.0 Spectroscopic Software was used to control the spectrometer and for the acquired and manipulated spectra.

3.5. Gel permeation Chromatography

Solutions of each EPS (1 g/L) were centrifuged at 3000 × g/10 min, and 1 mL aliquots applied to a column of Sepharose CL-6B (23.5 cm × 1.6 cm). The column was then eluted with distilled water at a flow rate of 0.52 mL/min, and 2.5 mL fractions collected. The void volume (17.9 mL) of the column was determined with Blue Dextran [16,17].

3.6. Rheology

Rotational rheometer measurements were performed in triplicate on aqueous solutions of botryosphaeran at concentrations of: 1, 2, 3, 4 and 5 g/L at 25 °C using a Brookfield rotational rheometer (RV DV-III model, Brookfield Engineering Laboratories, Stoughton, MA, USA) equipped with a cone-plate attachment (spindle CP 40) operating at shear rates within the range of 450–1830 s−1 and at speeds from 60–244 rpm. Rheological data was acquired via a personal computer using the Rheocalc V2.3 software (Brookfield Engineering Laboratories).
The Power Law equation used to analyse the rheological behaviour of the EPS is described by:
τ = kγ a
where τ is the shear stress, k is the consistency index (apparent viscosity at a shear rate of 1 s−1), γ is the shear rate, and a represents a constant that characterizes a material. If a = 1, the fluid is Newtonian; if a < 1, pseudoplastic; and if a > 1, dilatant. In relation to k, the higher its value, the more consistent (or viscous) is the fluid.
The Cross equation was used to obtain appropriate values for zero-shear rate viscosity (η0) by extrapolation of the experimental data. The Cross equation is given by:
η = η + [(η0 − η) / (1 + kγa)]
where η is the limiting viscosity estimated at infinite shear rate. The k, γ and a symbols are the same as aforementioned.
The Martin equation:
log(ηsp/c) = log[η] + KM [η]c
where ηsp is the specific viscosity, [η] is the intrinsic viscosity, and KM is a dimensionless parameter that depends upon the given polymer-solvent pair, was used to determine the intrinsic viscosity. An Ubbelodhe Cannon E-534 Viscometer (Cannon Instrument Co, State College, PA, USA) was used for capillary viscometric analysis. Each concentrated exopolysaccharide solution (10 g/L) was prepared by dispersing the dried hydrocolloids in water at 25 °C under constant stirring and diluting to concentrations of 0.1, 0.5, 0.75, 1.0, 1.5, 2.0 and 2.5 g/L. The analyses were performed in triplicate, at a temperature of 25 °C, in 10 min. intervals.

4. Conclusions

Under the conditions examined, the botryosphaerans produced by B. rhodina MAMB-05 grown on glucose and sucrose showed similar thermal behaviour, inasmuch as both EPSs presented slight endothermic variation and mass loss on thermal analysis. Small variations in the respective FT-IR spectra after heating were also observed, and most probably were a consequence of the removal of water of hydration. As none of the botryosphaerans samples presented exothermic peaks, large mass loss and/or significant spectral alterations after thermal analysis, this suggested that the EPSGLC, EPSSUC and EPSFRU possessed good thermal stability in the temperature range generally used to sterilise biomaterials. In addition, the species with the highest molecular mass, EPSGLC (determined by gel filtration), was influenced by the effect of the type and degree of ramification on the strengths of the intermolecular interactions among the exopolysaccharide chains, and can be a plausible explanation for the viscosity differences found among the three botryosphaerans. The higher k values of EPSGLC also suggested a higher structural relaxation time than of EPSSUC and EPSFRU.

Acknowledgements

The authors are grateful to FAPESP (São Paulo), CNPq and PROPPG-UEL for financial support.

Conflict of Interest

The authors declare no conflict of interest.
  • Sample Availability: Samples of the different botryosphaerans are available from the authors (Contact: Dr. Aneli M. Barbosa, E-Mail: [email protected]).

References

  1. Villain-Simonnet, A.; Milas, M.; Rinaudo, M. A new polysaccharide (YAS34). I. Characterization of the conformations and conformational transition. Int. J. Biol. Macromol. 2000, 27, 65–75. [Google Scholar] [CrossRef]
  2. Zohuriaan, M.J.; Shokrolahi, F. Thermal studies on natural and modified gums. Polym, Test. 2004, 23, 575–579. [Google Scholar] [CrossRef]
  3. Selbmann, L.; Stingele, F.; Petruccioli, M. Exopolysaccharide production by filamentous fungi: The example of Botryosphaeria rhodina. Antonie Leeuw. 2003, 84, 135–145. [Google Scholar] [CrossRef]
  4. Ikeda, S.; Nitta, Y.; Kim, S.B.; Temsiripong, T.; Pongsawatmanit, R.; Nishinari, K. Single-phase mixed gels of xyloglucan and gellan. Food Hydrocoll. 2004, 18, 669–675. [Google Scholar] [CrossRef]
  5. Wolkers, W.F.; Oliver, A.E.; Tablin, F.; Crowe, J.H. A Fourier-transform infrared spectroscopy study of sugar glasses. Carbohydr. Res. 2004, 339, 1077–1085. [Google Scholar] [CrossRef]
  6. Ding, Q.; Labelle, M.; Yang, B.Y.; Montgomery, R. Physicochemical studies of extracellular polysaccharides of Erwinia chrysanthemi spp. Carbohydr. Polym. 2003, 51, 333–346. [Google Scholar] [CrossRef]
  7. Gorret, N.; Renard, C.M.G.C.; Famelart, M.H.; Maubois, J.L.; Doublier, J.L. Rheological characterization of the EPS produced by P. acidi-propionici on milk microfiltrate. Carbohydr. Polym. 2003, 51, 149–158. [Google Scholar] [CrossRef]
  8. Fengel, D.A.; Wegener, G. Wood Chemistry, Ultrastructure and Reactions, 1st ed; Walter de Gruyter: Berlin, Germany, 1984. [Google Scholar]
  9. Gray, J.S.S.; Yang, B.Y.; Montgomery, R. Montgomery, R. Extracellular polysaccharide of Erwinia chrysanthemi A350 and ribotyping of Erwinia chrysanthemi spp. Carbohydr. Res. 2000, 324, 255–267. [Google Scholar] [CrossRef]
  10. Zhbankov, R.G.; Korolik, E.V.; Petrov, P.T.; Lapkovski, M.P.; Tsarenkov, V.M.; Marchewka, M.K.; Ratajczak, H. Vibrational spectra and the structure of medical biopolymers. J. Mol. Struct. 2000, 555, 85–96. [Google Scholar] [CrossRef]
  11. Lazaridou, A.; Biliaderis, C.G.; Izydorczyk, M.S. Molecular size effects on rheological properties of oat β-glucans in solution and gels. Food Hydrocoll. 2003, 17, 693–712. [Google Scholar] [CrossRef]
  12. Rodd, A.B.; Dunstan, D.E.; Boger, D.V. Characterisation of xanthan gum solutions using dynamic light scattering and rheology. Carbohydr. Polym. 2000, 42, 159–174. [Google Scholar] [CrossRef]
  13. Renaud, M.; Belgacem, M.N.; Rinaudo, M. Rheological behaviour of polysaccharide aqueous solutions. Polymers 2005, 46, 12348–12358. [Google Scholar] [CrossRef]
  14. Bueno, S.M.; Garcia-Cruz, C.H. The influence of fermentation time and the presence of salts on the rheology of the fermentation broth of polysaccharide-producing bacteria free of soil. J. Food Eng. 2001, 50, 41–42. [Google Scholar] [CrossRef]
  15. Dekker, R.F.H.; Barbosa, A.M. The effects of aeration and veratryl alcohol on the production of two laccases by the ascomycete Botryosphaeria sp. Enzyme Microb. Technol. 2001, 28, 81–88. [Google Scholar] [CrossRef]
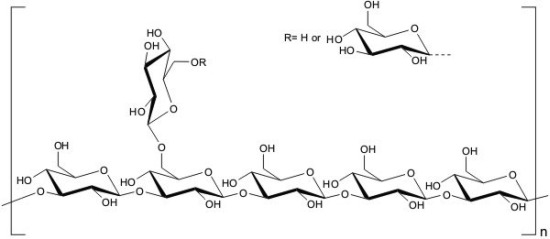
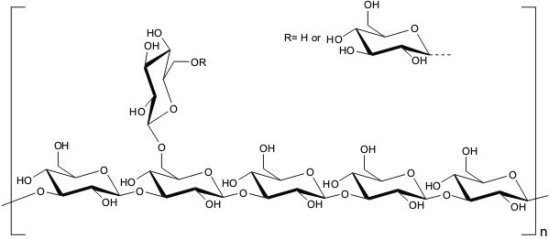
  16. Barbosa, A.M.; Steluti, R.M.; Dekker, R.F.H.; Cardoso, M.S.; Corradi da Silva, M.L. Structural characterization of Botryosphaeran: A (1→3,1→6)-β-D-glucan produced by the ascomyceteous fungus, Botryosphaeria sp. Carbohydr. Res. 2003, 338, 1691–1698. [Google Scholar] [CrossRef]
  17. Corradi da Silva, M.L.; Izeli, N.L.; Martinez, P.F.; Silva, I.R.; Constantino, C.J.L.; Cardoso, M.S.; Barbosa, A.M.; Dekker, R.F.H.; Silva, G.V.J. Purification and structural characterization of (1→3;1→6)-β-glucan (botryosphaerans) from Botryosphaeria rhodina grown on sucrose and fructose as carbon sources: a comparative study. Carbohydr. Polym. 2005, 61, 10–17. [Google Scholar] [CrossRef]
  18. Gomaa, K.; Kraus, J.; Rokopf, F.; Roper, M.; Franz, G. Antitumor and immunological activity of a β-1→3; 1→6 glucan from Glomerella cingulata. J. Cancer Res. Clin. Oncol. 1992, 118, 136–140. [Google Scholar] [CrossRef]
  19. Seviour, R.J.; Stasinopoulos, S.J.; Auer, D.P.F.; Gibbs, P.A. Production of pullulan and other exopolysaccharides by filamentous fungi. Crit. Ver. Biotechnol. 1992, 12, 279–298. [Google Scholar] [CrossRef]
  20. Morris, G.A.; Li, P.; Puaud, M.; Liu, Z.; Mitchell, J.R.; Harding, S.E. Hydrodynamic characterisation of the exopolysaccharide from the halophilic cyanobacterium Aphanothece halophytica GR02: A comparison with xanthan. Carbohydr. Polym. 2001, 44, 261–268. [Google Scholar] [CrossRef]
  21. Esgalhado, M.E.; Roseiro, J.C.; Collaço, M.T.A. Interactive effects of pH and temperature on cell growth and polymer production by Xanthomonas campestris. Process Biochem. 1995, 30, 667–671. [Google Scholar]
  22. Ding, Q.; Yang, B.Y.; Montgomery, R. Structure and hydrodynamic properties of the extracellular polysaccharide from a mutant strain (RA3W) of Erwinia chrysanthemi RA3. Carbohydr. Res. 2004, 339, 2049. [Google Scholar] [CrossRef]
  23. Yang, B.Y.; Ding, Q.; Montgomery, R. Extracellular polysaccharides of a bacterium associated with a fungal canker disease of Eucalyptus sp. Carbohydr. Res. 2002, 337, 731–742. [Google Scholar] [CrossRef]
  24. Lucas, E.F.; Soares, B.G.; Monteiro, E. Caracterização de Polímeros: Determinação de Peso Molecular e Análise Térmica (in Portuguese); E-papers: Rio de Janeiro, Brazil, 2001, 1st ed. pp. 125–149. Available online: http://www.e-papers.com.br/sumario.asp?codigo_produto=1339.
  25. Freifelder, D.M. Physical Biochemistry: Applications to Biochemistry and Molecular Biology, 2nd ed; W.H. Freeman: New York, NY, USA, 1982; pp. 470–491. [Google Scholar]
  26. Navarini, L.; Abatangelo, A.; Bertocchi, C.; Conti, E.; Bosco, M.; Picotti, F. Isolation and characterization of the exopolysaccharide produced by Streptococcus thermophilus SFi20. Int. J. Biol. Macromol. 2001, 28, 219–226. [Google Scholar] [CrossRef]
  27. Ren, Y.; Ellis, P.R.; Sutherland, I.W.; Ross-Murphy, S.B. Dilute and semi-dilute solution properties of an exopolysaccharide from Escherichia coli strain S61. Carbohydr. Polym. 2003, 52, 189–195. [Google Scholar] [CrossRef]
  28. Eteshola, E.; Gottlieb, M.; Arad, S.M. Dilute solution viscosity of red microalga exopolysaccharide. Chem. Eng. Sci. 1996, 51, 1487–1494. [Google Scholar] [CrossRef]
  29. Goh, K.K.T.; Hemar, Y.; Singh, H. Viscometric and static light scattering studies on an exopolysaccharide produced by Lactobacillus delbrueckii subspecies bulgaricus NCFB 2483. Biopolymers 2005, 77, 98–106. [Google Scholar] [CrossRef]
  30. Yang, L.; Zhang, L.M. Chemical structural and chain conformational characterization of some bioactive polysaccharides isolated from natural sources. Carbohydr. Polym. 2009, 76, 349–361. [Google Scholar] [CrossRef]

