Article

Transcriptional and Functional Analysis Shows Sodium Houttuyfonate-Mediated Inhibition of Autolysis in Staphylococcus aureus

1
Key Laboratory for Zoonosis Research, Ministry of Education, Institute of Zoonosis, College of Animal Science and Veterinary Medicine, Jilin University, Changchun 130062, China
2
Department of Food Quality and Safety, College of Quartermaster Technology, Jilin University, Changchun 130062, China
3
State Key Laboratory for Molecular Virology and Genetic Engineering, Chinese Center for Disease Control and Prevention, Beijing 100176, China
4
Key Lab for New Drug Research of TCM, Research Institute of Tsinghua University in Shenzhen, Shenzhen 518057, China
5
Department of Infectious Diseases, First Hospital of Jilin University, Changchun 130021, China
*
Authors to whom correspondence should be addressed.
These authors contributed equally to this work.
Molecules 2011, 16(10), 8848-8865; https://doi.org/10.3390/molecules16108848
Submission received: 13 October 2011 / Accepted: 17 October 2011 / Published: 21 October 2011

Abstract

:
Sodium houttuyfonate (SH), an addition compound of sodium bisulfite and houttuynin,showed in vitro antibacterial activity against 21 Staphylococcus aureus (S. aureus) strains grown in planktonic cultures. Microarray results showed decreased levels of autolysin atl, sle1, cidA and lytN transcripts in the SH-treated strain as compared to the control strain, consistent with the induction of the autolytic repressors lrgAB and sarA and with the downregulation of the positive regulators agrA and RNAIII. Triton X-100-induced autolysis was significantly decreased by SH in S. aureus ATCC 25923, and quantitative bacteriolytic assays and zymographic analysis demonstrated SH-mediated reduction of extracellular murein hydrolase activity in these cells. Anti-biofilm assay showed that SH is poorly active against S. aureus grown in biofilm cultures, whereas SH diminished the amounts of extracellular DNA (eDNA) of S. aureus in a dose-dependent manner, which suggested that SH may impede biofilm formation by reducing the expression of cidA to inhibit autolysis and eDNA release in the early phase. Some of the microarray results were confirmed by real-time RT-PCR.

1. Intrduction

Staphylococcus aureus (S. aureus) is an important pathogen in both hospitals and the community that can cause a wide range of infections including sepsis, wound infections, pneumonia, and catheter-related infections. More than 60% of nosocomial S. aureus isolates are now resistant to methicillin, and some strains have developed resistance to more than 20 different antimicrobial agents in some countries [1]. One important character of S. aureus is the ability to form biofilms on damaged tissues and implanted biomaterials [2]. The biofilm structures are inherently resistant to many different antimicrobial agents and are difficult to eradicate from the infected host [3]. Thus, potential antimicrobial agents with new mechanisms of action and potent activity are widely investigated.
Sodium houttuyfonate (SH, decanoyl acetaldehyde sodium sulfite) is the addition compound of sodium bisulfite and houttuynin, which is the easily polymerized major constituent of the volatile oil of the plant Houttuynia cordata Thunb, a wild perennial herb with creeping rootstocks and swollen nodes [4]. SH is easily dissolved in hot water, slightly soluble in water and ethanol and insoluble in chloroform and benzene; it is soluble in alkaline solutions such as sodium hydroxide and potassium hydroxide where it simultaneously decomposes [5]. SH has been clinically used in China as an antimicrobial medicine for many years, and has been reported to effectively inhibit the growth of G+-bacteria such as S. aureus, M. catarrhalis, B. influenzae, and S. pneumoniae [6]. SH is primarily used by oral administration in clinical practice [5]. Fluorescence experiments indicated that houttuyfonate homologues (HOU-Cn) directly bind to membrane proteins of G+-bacteria by hydrophobic interactions, and exert a stronger antibacterial activity in G+-bacteria than in G-bacteria [7]. However, few reports are available that characterize the response mechanisms of S. aureus to SH using molecular biology approaches.
Recent reports have shown that the overexpression of cidA, a murein hydrolase regulator, may promote autolysis and extracellular DNA (eDNA) release to facilitate biofilm formation in S. aureus in vitro and in vivo [8]. Our preliminary experiments showed that SH inhibited Triton X-100-induced autolysis in S. aureus. Previous reports showed that treatment of S. aureus with chloramphenicol [9] and tetracycline [10] or vancomycin [11] and teicoplanin [12] led to decreased autolysis. On the contrary, β-lactam antibiotics can increase autolysis in S. aureus, presumably due to altered proteolytic processing [13]. Staphylococcal murein hydrolases include N-acetyl muramidase, N-acetyl glucosaminidase, N-acetylmuramyl-L-alanine amidase, endopeptidase and transglycosylases. These hydrolases degrade peptidoglycan saccules, resulting in cell lysis. If uncontrolled, these hydrolases can destroy the cell wall, resulting in cell lysis. Thus, we wanted to investigate whether SH reduces S. aureus biofilms in vitro by inhibiting autolysis.
In this paper, we investigated the antimicrobial activity of SH against clinical and standard S. aureus strains grown in planktonic and biofilm cultures, and we explored the molecular basis of the markedly reduced autolytic phenotype triggered by SH using transcriptomic analysis and validated the transcription of autolysis-related genes by real-time RT-PCR, and we used quantitative bacteriolytic assays to evaluate autolysis inhibition and we used propidium iodide (PI) staining to measure the inhibition of eDNA by treatment.

2. Results

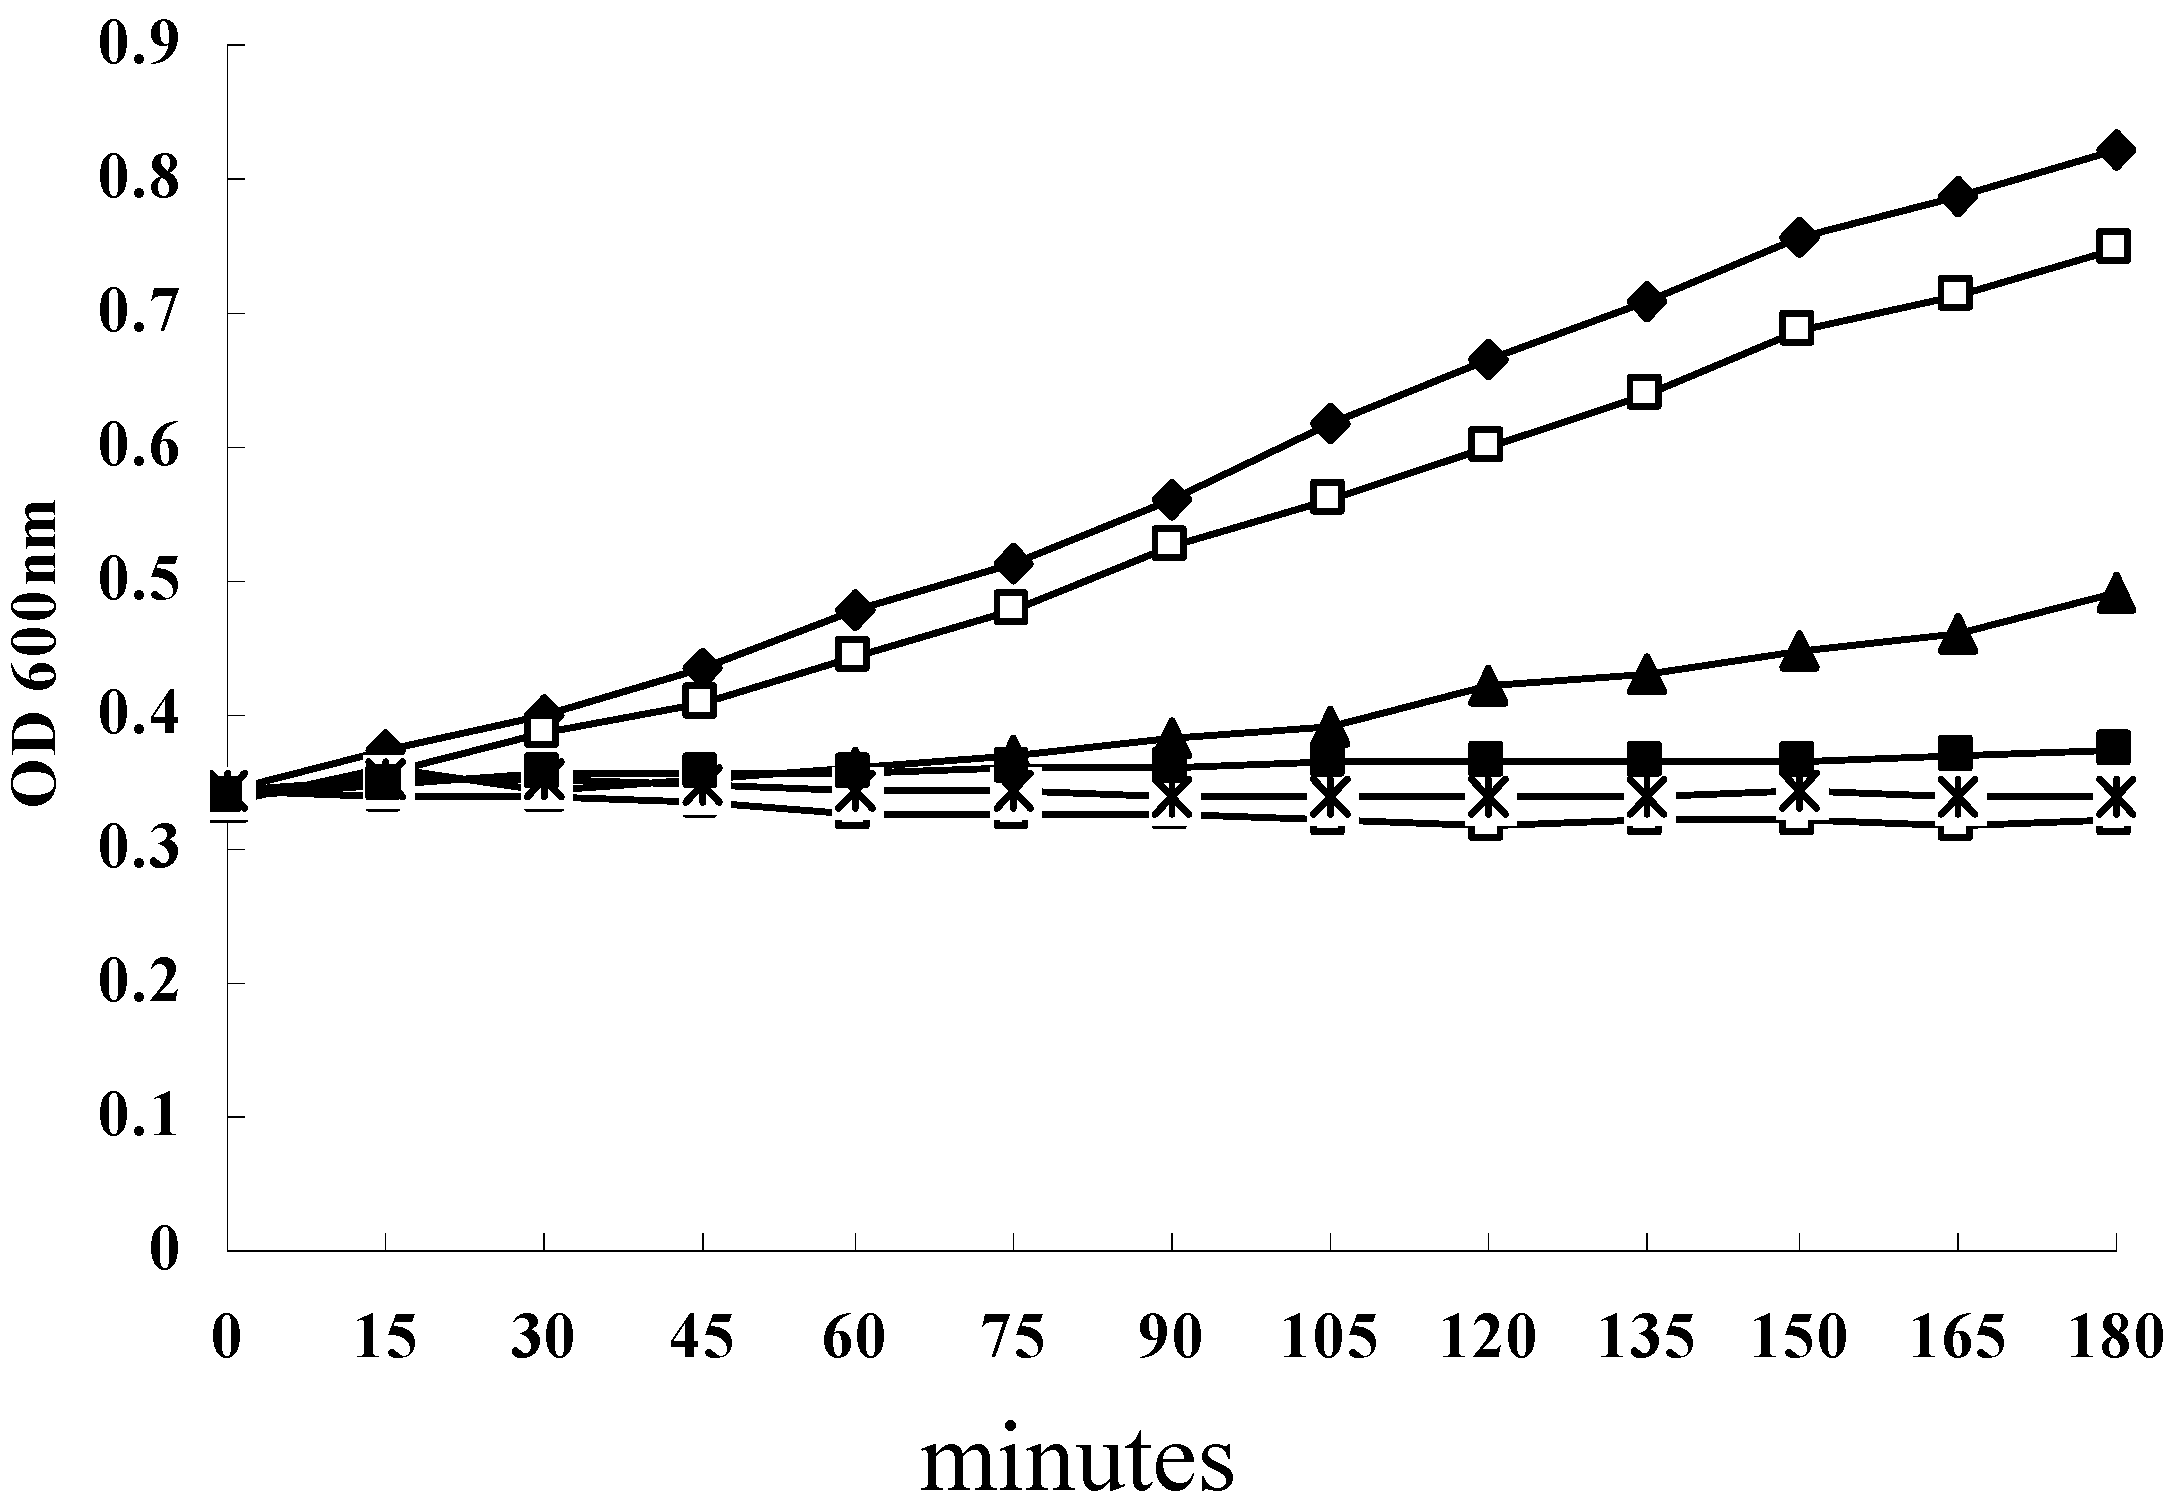
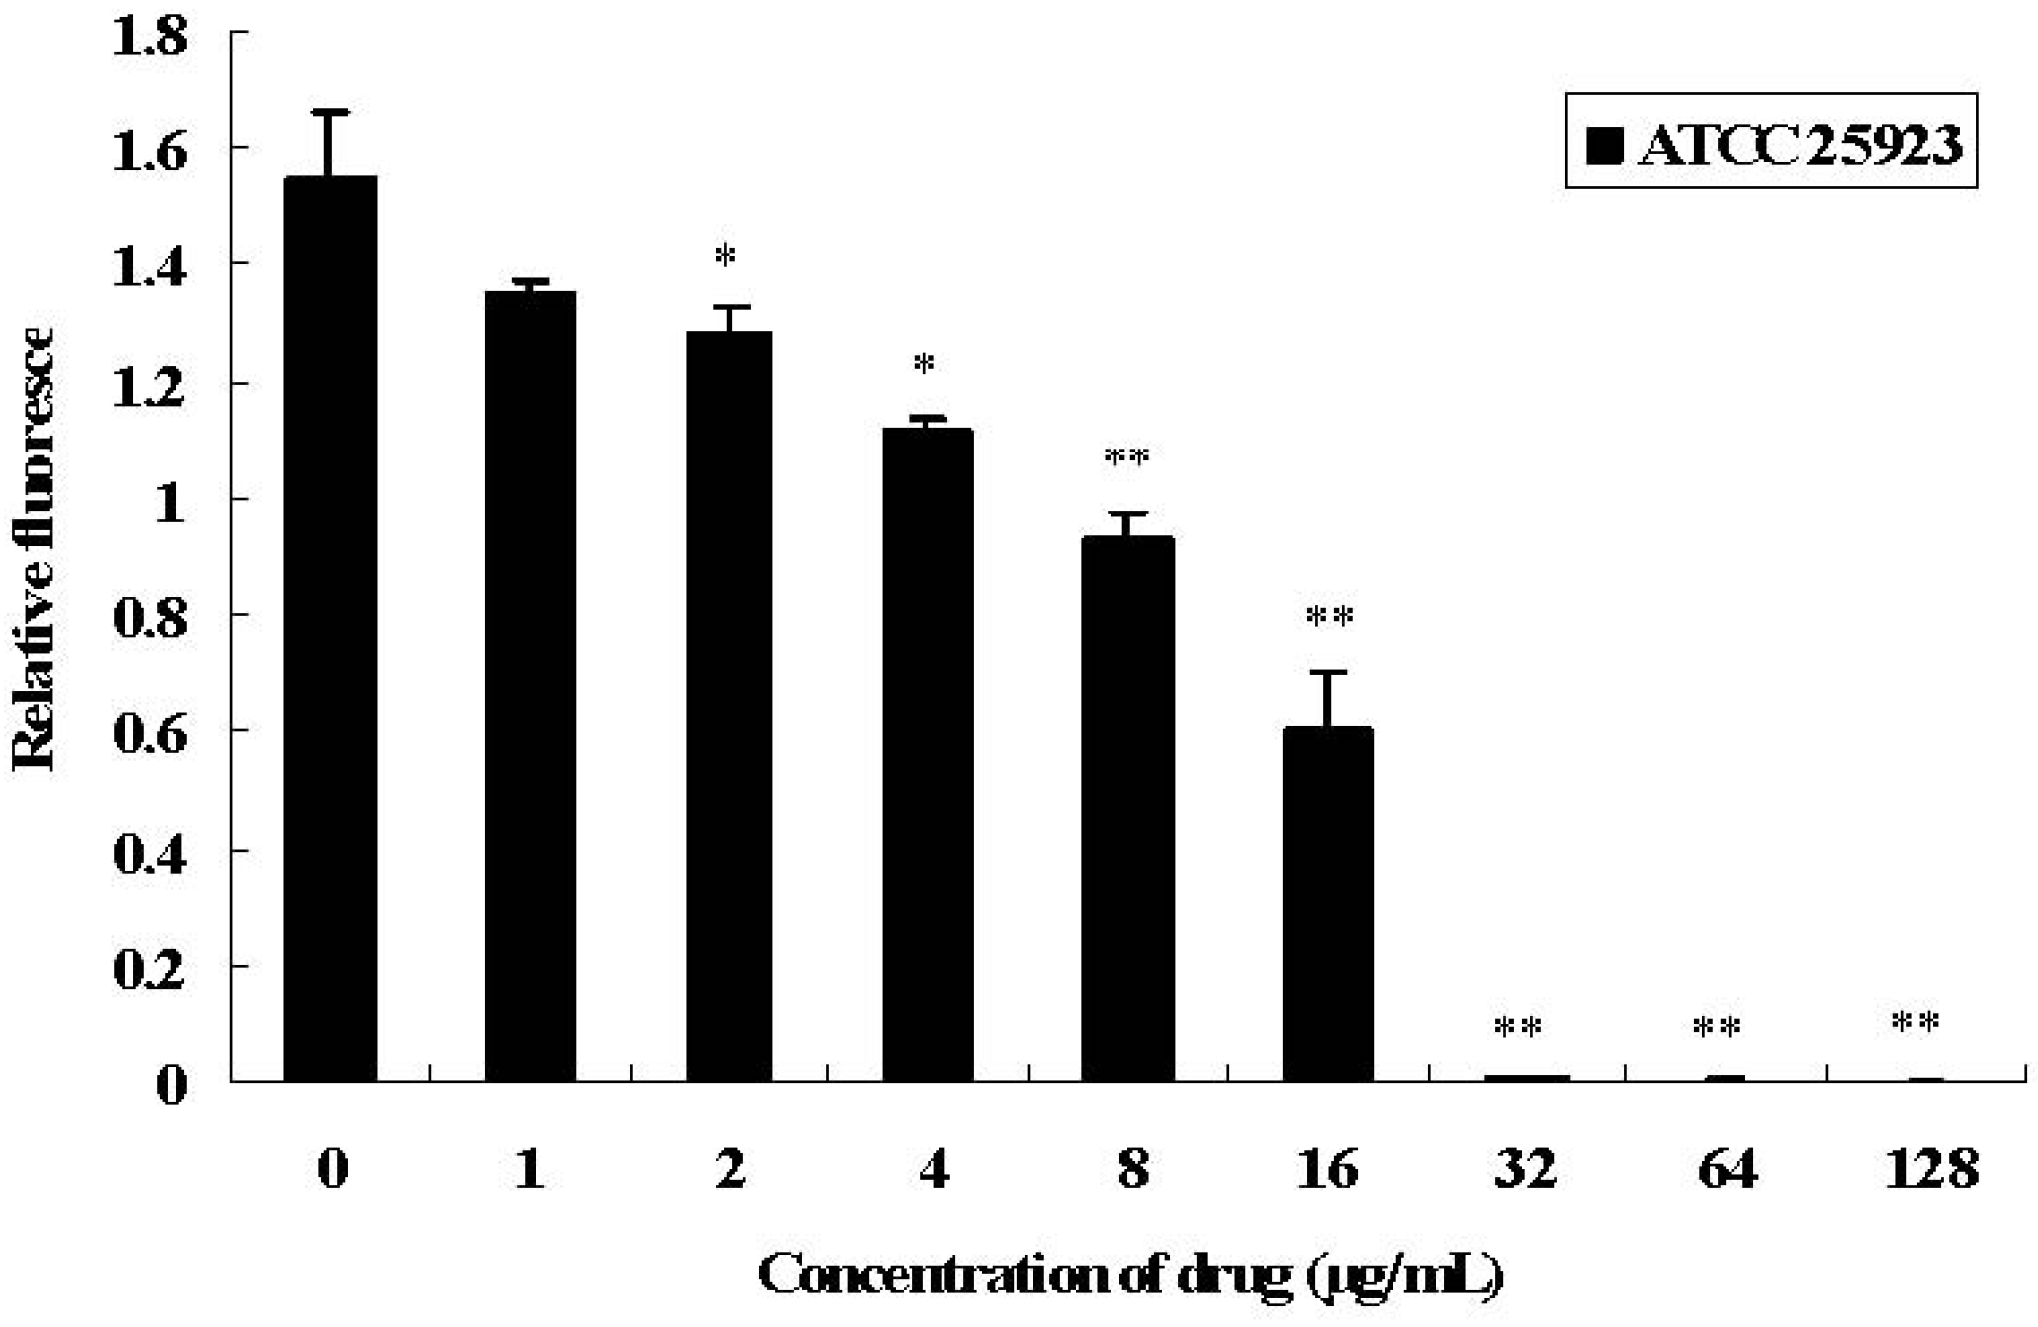
2.1. Antimicrobial Activities of SH and Growth Curve of S. aureus under SH Stress

In this study, the MICs of SH against 21 S. aureus strains (17 of which are multidrug resistant) grown in planktonic cultures ranged from 4 to 128 µg/mL, and the MIC90 was 32 µg/mL. The MIC value of SH against S. aureus strain ATCC 25923 was 16 µg/mL (Table 1). Especially, against 16 of 17 multidrug resistant S. aureus strains tested, the MIC values of SH were lower than that of two conventional antimicrobial agents ciprofloxacin and oxacillin (Table 1), this result shows that SH is an effective antimicrobial agent against S. aureus grown in planktonic cultures. The MBIC and MBBC values of SH for 21 strains grown in biofilm cultures were all >1024 μg/mL, this result shows that SH is poorly active against S. aureus grown in biofilm cultures. The growth curve of S. aureus ATCC 25923 showed that SH concentrations of 16, 32 and 64 mg/L strongly inhibited the growth of S. aureus ATCC 25923 grown in planktonic cultures (Figure 1).
Table 1. Antibiograms of 21 S. aureus strainsusedin this study.
StrainsSourceDate of isolation (mo/yr)Antibiotic resistancesVAN MIC (µg/mL)CIP MIC (µg/mL)OX MIC (µg/mL)SH MIC (µg/mL)SH MBIC (µg/mL)SH MBBC (µg/mL)
SA003Blood2/2003P10.120.124>1024>1024
SA006Skin2/2003M, P, CI, CM, E16412816>1024>1024
SA009Skin abscess3/2003M, CI, CM, E0.512825616>1024>1024
SA017Skin abscess5/2003P, T20.50.54>1024>1024
SA018Broncheal swab6/2003M, P, CI, CM, E, G212851232>1024>1024
SA025Sputum10/20030.250.250.124>1024>1024
SA039Broncheal swab2/2004M, P, CI, CM, E, G, RI, T, TMP/SXT1512512128>1024>1024
SA059Broncheal swab6/2004M, P, CI, T, TMX/SXT212851232>1024>1024
SA079Sputum9/2004M, P, CI, CL, CM, E, G, TMP/SXT412825664>1024>1024
SA092Abscess10/2004M, P, OX, E11612832>1024>1024
SA106Wound isolate1/2005M, P, CI, CM, E, G, T, TMP/SXT0.525651232>1024>1024
SA118Blood1/2005M, P, E, G1642568>1024>1024
SA121Wound isolate3/2005M, P, CM, E, G112825616>1024>1024
SA142Abscess5/2005P, T, E110.58>1024>1024
SA146Skin abscess5/2005M, P, CL, CM, E, T26412816>1024>1024
SA165Urine6/2006P, CI, CM, E, G, RI, T225651232>1024>1024
SA173Broncheal swab8/2005M, P, T0.25321288>1024>1024
SA179Blood9/2005M, CI, CM, E112851232>1024>1024
SA192Urine10/2005M, P, CI, CM, E, G16451232>1024>1024
SA203Wound isolate12/2005M, P, CL, CM, T26451216>1024>1024
ATCC25923CMCC 10.250.2516>1024>1024
Abbreviations: M, methicillin; P, penicillin; CI, clindamycin; CM, chloramphenicol; E, erythromycin; G, gentamicin; RI, rifampin; T, tetracycline; TMP/SXT, trimethoprimsulfamethoxazole; CT, cryptotanshinone; SH, sodium houttuyfonate; VAN, vancomycin; CIP, ciprofloxacin; OX, oxacillin.
Figure 1. Growth curve for S. aureus strain ATCC 25923 in the presence or absence of SH. ◆, untreated S. aureus; □, S. aureus plus 4 µg/mL SH; ▲, S. aureus plus 8 µg/mL SH; ■, S. aureus plus 16 µg/mL SH; and *, S. aureus plus 32 µg/mL SH; △, S. aureus plus 64 µg/mL SH.
Molecules 16 08848 g001

2.2. Overview of SH-Triggered Transcriptional Profiles of S. aureus ATCC 25923 Cells

GeneChip analysis revealed that 764 genes were differentially regulated in response to SH challenge; 318 showed significant upregulation and 446 showed significant downregulation. Microarray-related data were submitted to the Gene Expression Omnibus (GEO) under the accession number GSE 13233. A complete list of all genes differentially expressed by SH can be found in the supplementary material (Table S1).
In previous studies, global transcriptional profiles have been used to evaluate autolysis genes, and their regulators [14,15,16]. In the present study, we compared genes differentially regulated by SH with those identified in the studies mentioned above.

2.3. Expression Levels of Autolysis-Associated Genes Treated by SH

We analyzed the expression levels of 67 genes printed on a microarray that were involved in autolysis (Table 2) or known as related autolysis regulators (Table S2). Some of the microarray results were evaluated by real-time RT-PCR (Table 2 and Table 3).
Table 2. Microarray and real-time RT-PCR analysis of genes involved in autolysis affected by SH.
N315 SA no.GeneDescriptionMicroarray a,cRT-PCR b,c,d
Fold change ± SDq value (%)Fold change ± SD
SA0905atlBifunctional precursor autolysin (Atl)−2.2 ± 0.5 **0.11−2.4 ± 0.8 §
SA0423sle1N-Acetylmuramyl-L-alanine amidase−12.4 ± 3.0 **0.08−31.2 ± 9.6 §§
SA2329cidAHypothetical protein, similar to transcription regulator−2.0 ± 0.6 **0.38−3.7 ± 0.5 §
SA0265lytMPeptidoglycan hydrolase1.2 ± 0.629.611.0 ± 0.6
SA1090lytNLytN protein−1.4 ± 0.59.33−2.2 ± 0.9 §
SA0252lrgAMurein hydrolase regulator LrgA24.2 ± 5.2 **0.0080.4 ± 18.9 §§
SA0253lrgBAntiholin-like protein LrgB21.5 ± 6.4 **0.0076.5 ±14.7 §§
SA0573sarAStaphylococcal accessory regulator A1.8 ± 0.7 **2.692.6 ± 0.9 §
SA2328cidBConserved hypothetical protein1.5 ± 0.4 *4.532.5 ± 1.0 §§
SA2327cidCPyruvate oxidase2.4 ± 0.5 **0.132.3 ±0.7 §
SA1844agrAAccessory gene regulator A−2.2 ± 0.7 **0.19−3.5 ± 0.6 §§
SAS065RNAIIIDelta hemolysin−8.3 ± 1.4 **0.00−21.9 ± 5.3 §§
SA0251lytRTwo-component response regulator−3.9 ± 0.9 **0.00−9.1 ± 1.4 §§
SA0250lytSTwo-component sensor histidine kinase−1.9 ± 0.5 **0.25−2.4 ± 1.1 §
SA0641mgrATranscriptional regulator MgrA−2.3 ± 0.8 **0.11−3.2 ± 0.9 §§
SA1246arlSSensor histidine kinase ArlS−1.6 ± 0.4 **0.83−2.2 ± 0.7 §
SA1248arlRTruncated (putative response regulator ArlR−1.1 ± 0.529.61−1.2 ± 0.5
SA0650norAQuinolone resistance protein1.2 ± 0.3827.61ND
SA0904Hypothetical protein, probable ATL autolysin transcription regulator−1.5 ± 0.11 *3.70ND
SA1091eprHEndopeptidase resistance gene−1.3 ± 0.1013.98ND
a Microarray data were analyzed using SAM, ** significantly differentially regulated genes after filtering at 5% FDR and fold change greater than 2; * Significantly differentially regulated genes after filtering at 5% FDR and fold change greater than 1.5; b The data of Real-time RT-PCR analysis of gene expression shown are the mean value of 2−ΔΔCt ± standard deviation (SD), significant differences between three SH treatment samples and three control samples by t-test analysis are reported (§ P < 0.05; §§ P < 0.01); c − indicates reduction, and + indicates increase; d ND, not determined.
Table 3. Primers used in real-time RT-PCR with SYBR green probes
PrimerN315 ORF aSequence
16S rRNA forSArRNA01CGTGCTACAATGGACAATACAAA
16S rRNA revSArRNA01ATCTACGATTACTAGCGATTCCA
atl forN315-SA0905TACCGTAACGGCGTAGGTCGT
atl revN315-SA0905CATAGTCGTGTGTGTGTACGA
Sle1forN315-SA0423GTAGCCGTCCATCAACGAACT
Sle1 revN315-SA0423CTATTGCTCGCAGCGTTACT
cidA forN315-SA2329CTTAGCCGGCAGTATTGTTG
cidA revN315-SA2329TGAAGATAATGCAACGATAC
lytM forN315-SA0265ATGCCAATGGAAGCGGCCA
lytM revN315-SA0265TTCGCATGACCACTAGCTGT
lytN forN315-SA1090GGAGACACACTTAGTGCT
lytN revN315-SA1090CTAATGGTGTCATTGGCACT
lrgA forN315-SA0252CTGGTGCTGTTAAGTTAGGCG
lrgA revN315-SA0252GTGACATAGCCAGTACAAAT
lrgB forN315-SA0253CGGTACAGTTGTAGCGTTATTA
lrgB revN315-SA0253AGTGCTAATCCTCGGGCAATA
sarA forN315-SA0573CGCTGTATTGACATACATCAGCG
sarA revN315-SA0573CTCGACTCAATAATGATTCGA
cidB forN315-SA2328GACGTCATTGTAACGTTATTGC
cidB revN315-SA2328TGAACTAAATGCACCGGATTC
cidC forN315-SA2327GAGACTCAATCGACGCAGTTGT
cidC revN315-SA2327TCCAAGTGCTGTACTATTCG
agrA forN315-SA1844TGAAATTCGTAAGCATGACCC
agrA revN315-SA1844CATCGCTGCAACTTTGTAGAC
RNAIII forN315-SAS065ATGAGTTGTTTAATTTTAAGAAT
RNAIII revN315-SAS065CACTGTGTCGATAATCCA
lytS forN315-SA0250GCATATGCGGTTGACCTCATAT
lytS revN315-SA0250GCTTGTAATTGCTACGGCAGA
mgrA forN315-SA0641CAAGTTAATCGCTACTACTC
mgrA revN315-SA0641CTTCACGTTGATCGACTTCG
arlS forN315-SA1246GTATATCATTGCGCTGGCA
arlS revN315-SA1246GTGTTCGTAATTCATGTGACGC
a ORF, open reading frame.
Transcript levels of atl, sle1, and cidA were significantly decreased by 2.2, 12.4, and 2.0, respectively, whereas transcript levels of lytN were only slightly decreased by a factor of 1.4. The transcript levels of the positive regulators agrA and RNAIII were decreased by 2.2- and 8.3-fold, respectively. Expression of lrgAB, a negative regulator of autolysis, was significantly increased by 24.2- and 21.5-fold, and sarA was slightly increased 1.8-fold. Decreased atl, sle1, and cidA transcript levels were consistent with the induction of the autolytic repressors lrgAB and sarA and decreasedexpression of the positive regulators agrA and RNAIII in the SH-treated strain as compared to the control strain. This individually or collectively may contribute to the autolysis-inhibited phenotype. Real-time RT-PCR confirmed decreased atl, sle1, cidA, agrA and RNAIII mRNA levels and increased levels of lrgAB and sarA (Table 3).
SceD and IsaA share a conserved transglycosylase/muramidase domain, and SsaA (SA2093) and four structurally related proteins (SA0620, SA0710, SA2097, and SA2353) all share a common CHAP (cysteine, histidine-dependent amidohydrolase/peptidase) domain. All of these proteins have amino-terminal signal sequences, indicating that they are likely to be exported or targeted to the cell wall or membrane [17]. In present study, sceD (SA1898), ssaA (SA2093), isaA (SA2356), SA0620, SA2097, and SA2353 were downregulated by 3.0-, 7.8-, 11.5-, 5.9-, 13.3- and 5.8-fold, respectively, but we did not find any significant effects of SH on SA0710.
Expression of the protease genes sspA, sspB, sspC, scpA, scpB, and htrA was decreased by >2 fold. A S. aureus V8 protease, the major serine protease in S. aureus, is encoded by sspA. Loss of serine protease function has been shown to result in a pleiotropic effect on the profile of secreted proteins, including autolytic activity and proteolytic maturation of SspB (cysteine protease) [18]. Decreased levels of sspA, might result in altered processing of autolysins (e.g., Atl) that could affect autolytic activity [19]. The decreased transcription levels of protease-encoding genes suggest significant involvement in the autolytic changes triggered by SH.
We analyzed the expression of additional global regulators of autolysis exposed to SH. Transcript levels of fmtA were low in cells treated with SH and control strains. The tagO gene showed no significant changes in transcription levels, whereas sarV was upregulated by more than 3.2-fold. These genes were recently described as positive regulators of autolysis [20], although fmtB was only upregulated by 1.6-fold. There was a 1.5-fold decrease in the expression of murE (UDP-N-acetylmuramoylalanyl-D-glutamate-2,6-diaminopimelate ligase), and a 1.5-fold increase in that of murI (glutamate racemase) and murZ (functional homolog to murA). An enzyme that catalyzes further steps of peptidoglycan synthesis (mraY) was downregulated two-fold by SH treatment. We found that the expression of rsbU rsbV, rsbW, and sigB was significantly decreased by SH, that of their target genes asp23 and sarS was increased by 1.3-fold and decreased by 2.0-fold, respectively.

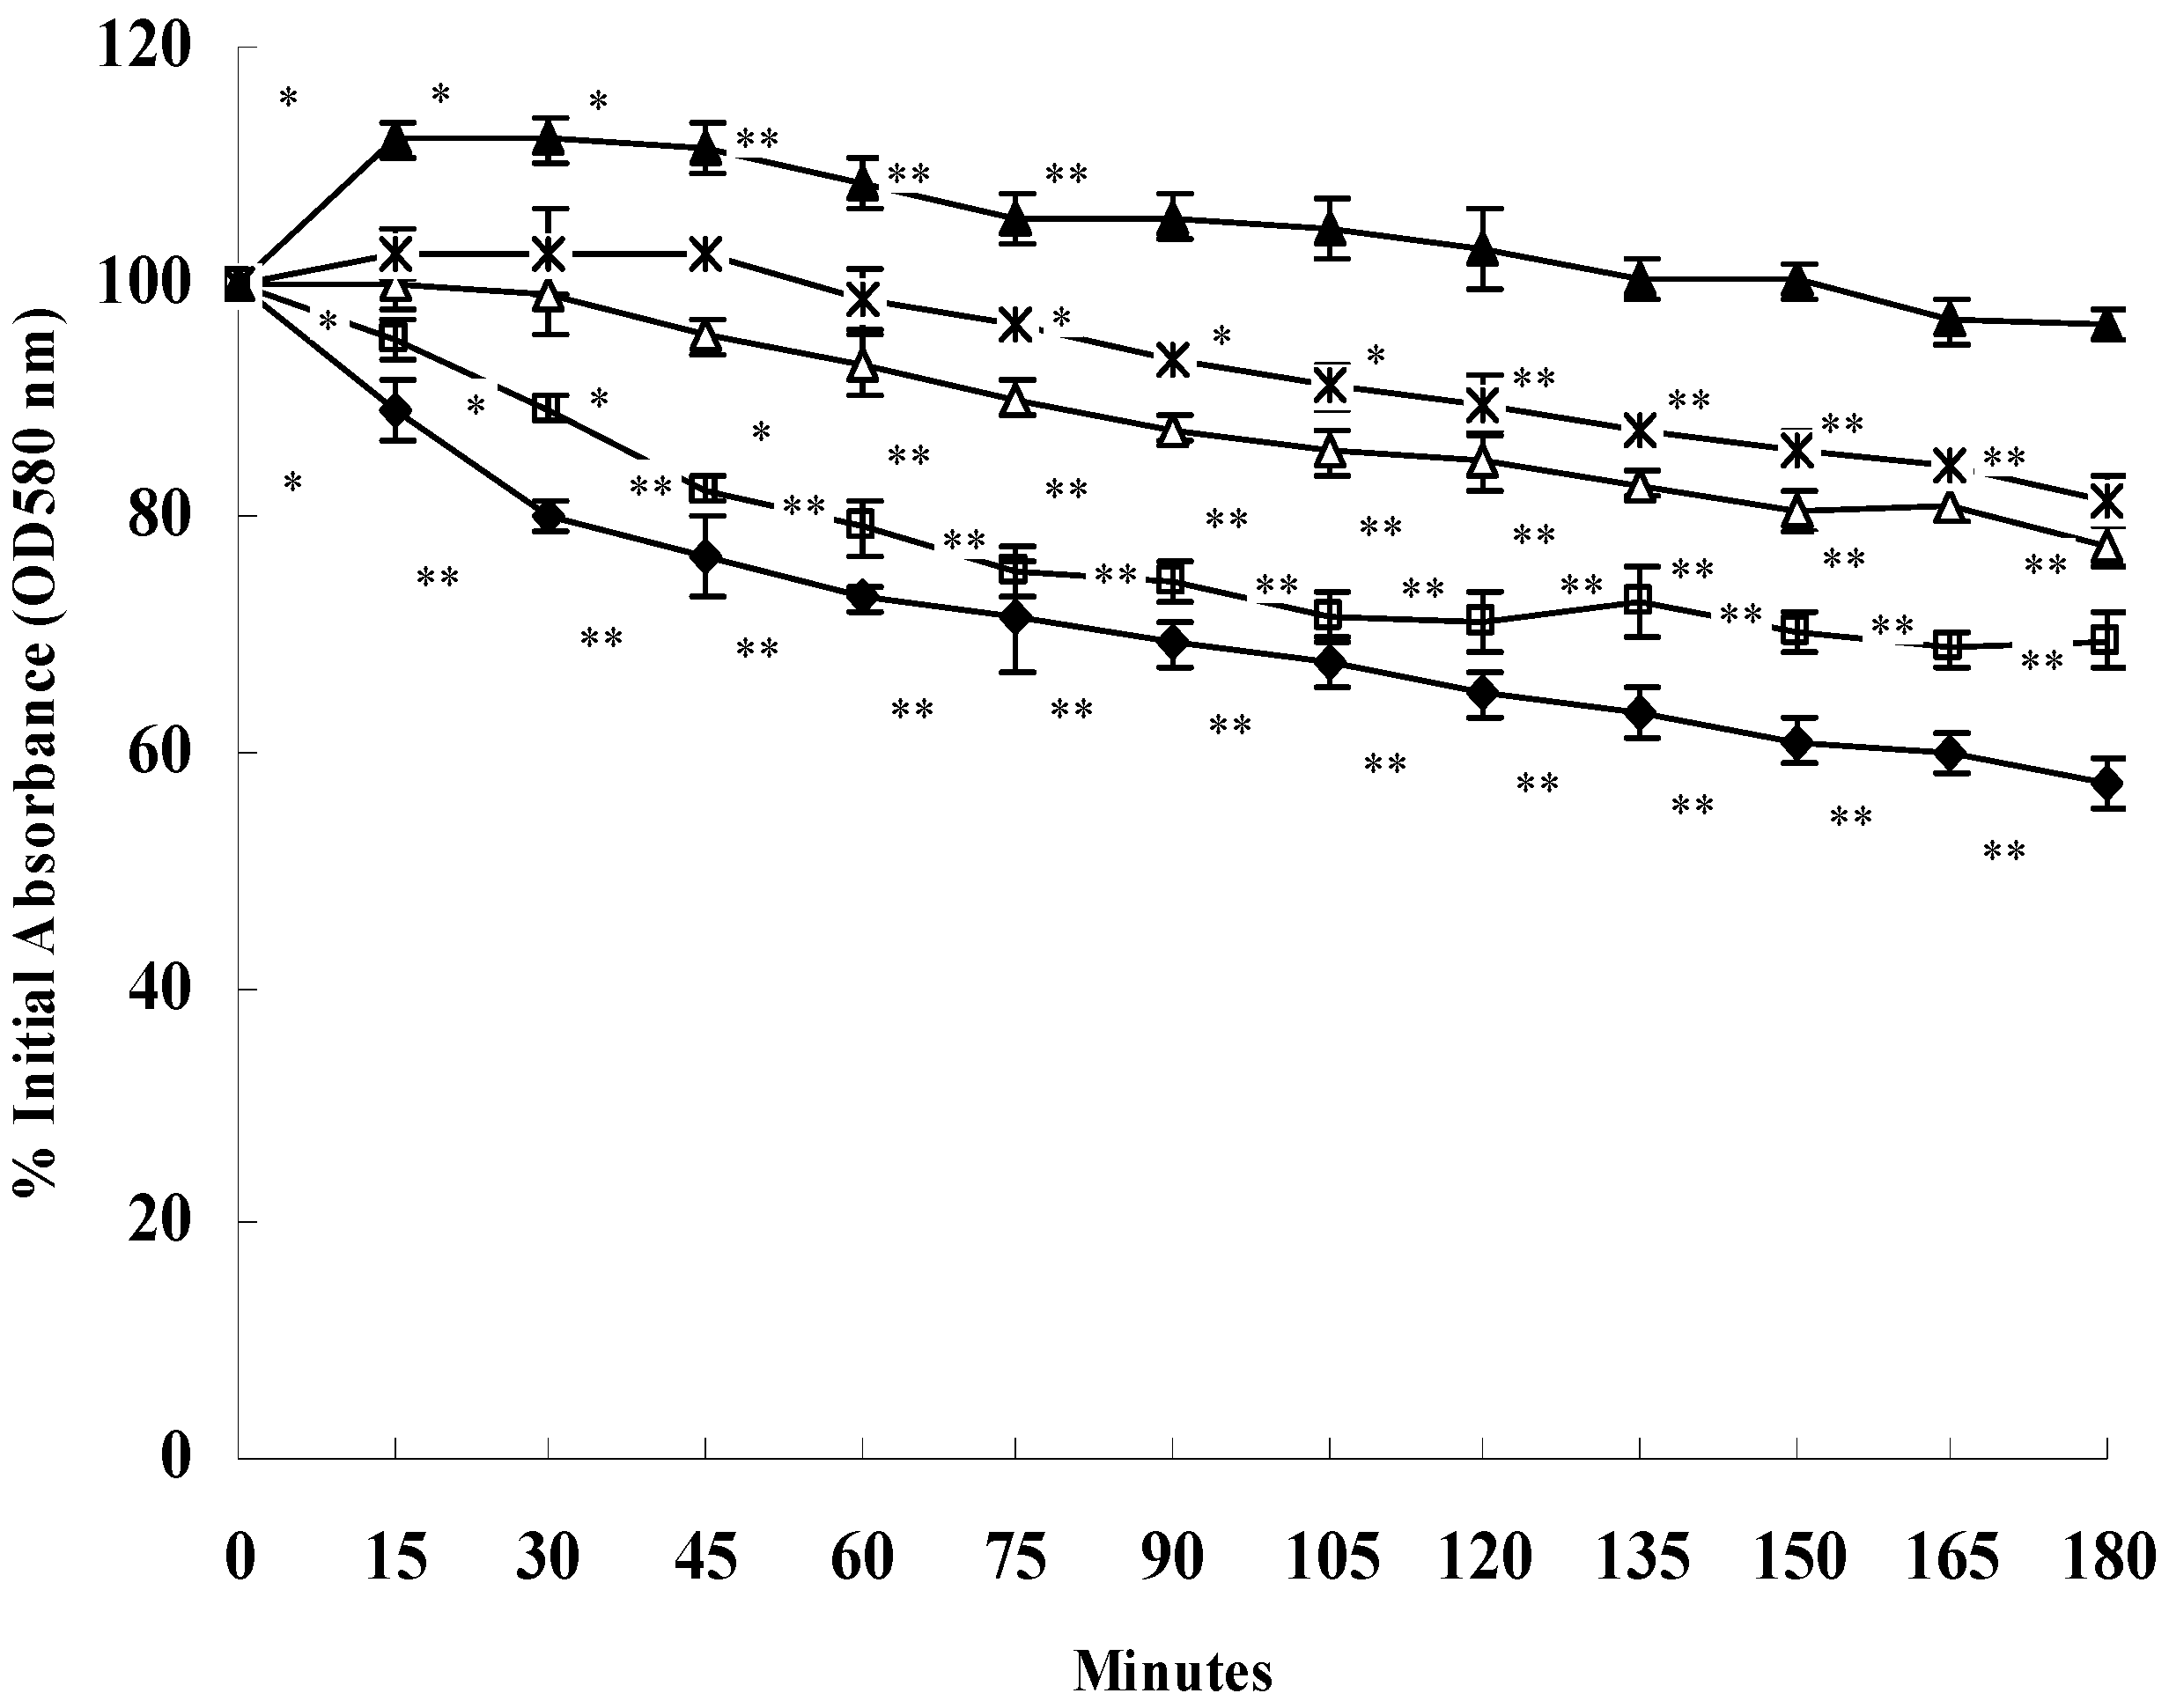
2.4. SH Decreases Triton X-100-Induced Autolysis

Since the results obtained from our microarray assay showed the expression levels of autolysis-associated genes were affected by SH treatment, we further determined the effect of SH on the autolytic activity of S. aureus ATCC 25923 in the presence of the non-ionic detergent Triton X-100. All cells from SH-exposed cultures showed a decreased rate of autolysis as compared to control cultures, and this inhibition was strengthened with increased concentrations of SH. After 3 h, a 30.4%, 22.2%, 18.6%, 3.5%, and 42.5% reduction of the original OD600 was observed for 1/4× MIC, 1/2× MIC, 1× MIC, 2× MIC, and no SH treatment, respectively. These findings indicate that Triton X-100-induced autolysis in S. aureus ATCC 25923 was inhibited by SH (Figure 2).
Furthermore, quantitative bacteriolytic assays of extracellular proteins of S. aureus ATCC 25923 against lyophilized S. aureus suspensions were performed (Figure 3). SH treatment (1/4× MIC, 1/2× MIC, 1× MIC, and 2× MIC SH) of the extracellular murein hydrolases of S. aureus resulted in no significant decrease in the turbidity of S. aureus cells after 8 h of incubation, compared to extracellular murein hydrolases in untreated cells. These results demonstrate that SH reduces the extracellular murein hydrolase activity of S. aureus.

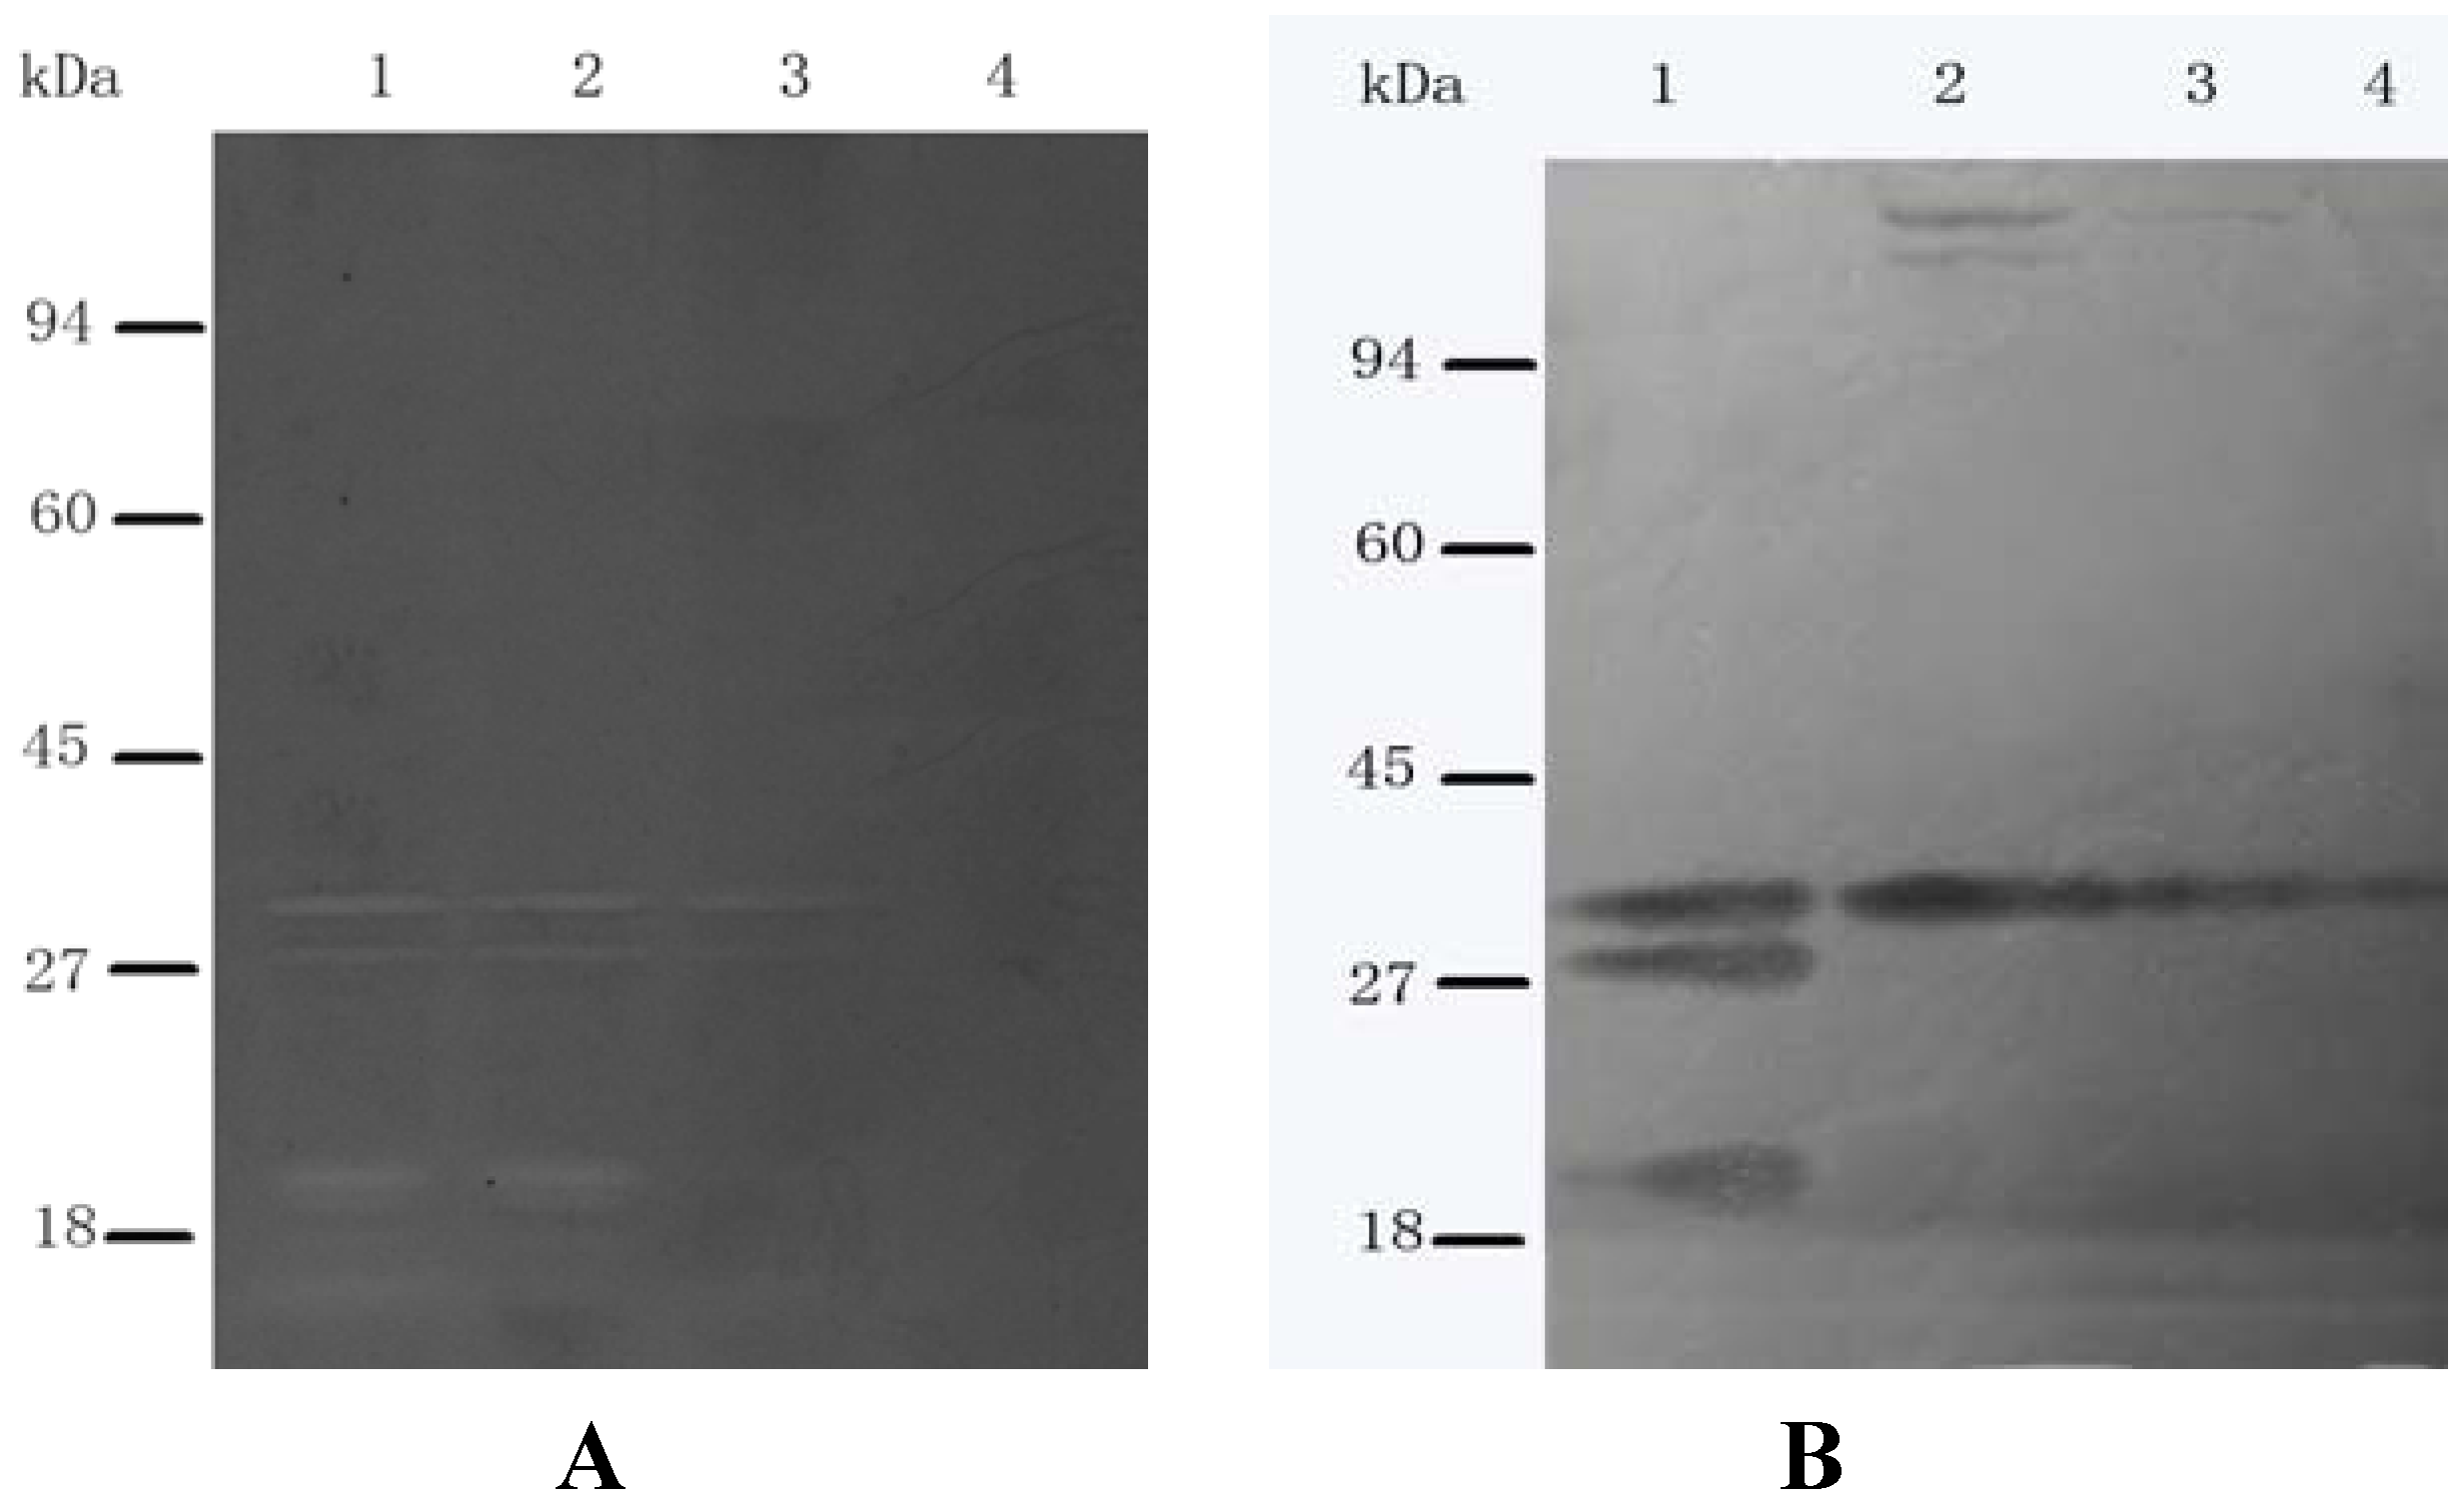
2.5. SH Alters the Cellular Peptidoglycan Hydrolase Profile

To investigate the mechanism of SH-inhibited autolysis, the peptidoglycan hydrolase profiles of SDS or LiCl autolysin extracts of S. aureus cell walls treated with 1/4× MIC, 1/2× MIC, or 1× MIC SH for 30 min were determined and compared with those of untreated ATCC 25923 cells. In LiCl autolysin extracts of S. aureus cell walls, 1/2× MIC SH treatment led to a significant decrease at 32 and two lower molecular weight bands. Additionally, MIC SH led to a complete loss of all 32 and two lower molecular weight bands Figure 4A. In the SDS group, 1/4× MIC SH treatment led to a slight induction at 143 kDa and 113 kDa; and a whole loss of two lower molecular weight bands; 1/2× MIC and MIC SH led to significant decrease in 143 kDa and 32 kDa, and a whole loss in estimated molecular sizes of 113 kDa and two lower molecular weight bands Figure 4B. These changes indicate altered proteolytic processing of Atl and other autolysins, and demonstrate that SH significantly inhibits autolysis, especially at concentrations >1/2× MIC SH.
Figure 2. Effect of SH on Triton X-100-induced autolysis. Triton X-100 was used to stimulate autolysis in S. aureus ATCC 25923 cells grown in the absence or presence of various concentration of SH. The four concentration investigated were: ▲, 2× MIC; *, MIC; △, 1/2 MIC; □, 1/4 MIC; ◆, untreated. Data points are the mean ± SD of the mean of three replicate samples. * represents P < 0.05 (t-test analysis); ** represents P < 0.01 (t-test analysis), different from 0-minutes time points.
Molecules 16 08848 g002
Figure 3. Quantitative analysis of extracellular bacteriolytic hydrolase activities in S. aureus ATCC 25923 cells treated with various concentration of SH. The four concentration investigated were □, 2× MIC; ▲, MIC; *, 1/2 MIC; △, 1/4 MIC; ◆, untreated.
Molecules 16 08848 g003
Figure 4. Zymographic analysis of bacteriolytic hydrolase activities of S. aureus ATCC 25923 cells treated with SH. LiCl (A) and SDS (B) autolysin extracts containing S. aureus ATCC 25923 cell walls treated with various concentrations of SH. Lane 1, no SH treatment; lane 2, 1/4× MIC SH; lane 3, 1/2× MIC SH; lane 4, 1× MIC SH. Molecular size markers are indicated on the left. The data shown are from a single representative experiment and were reproduced several times.
Molecules 16 08848 g004

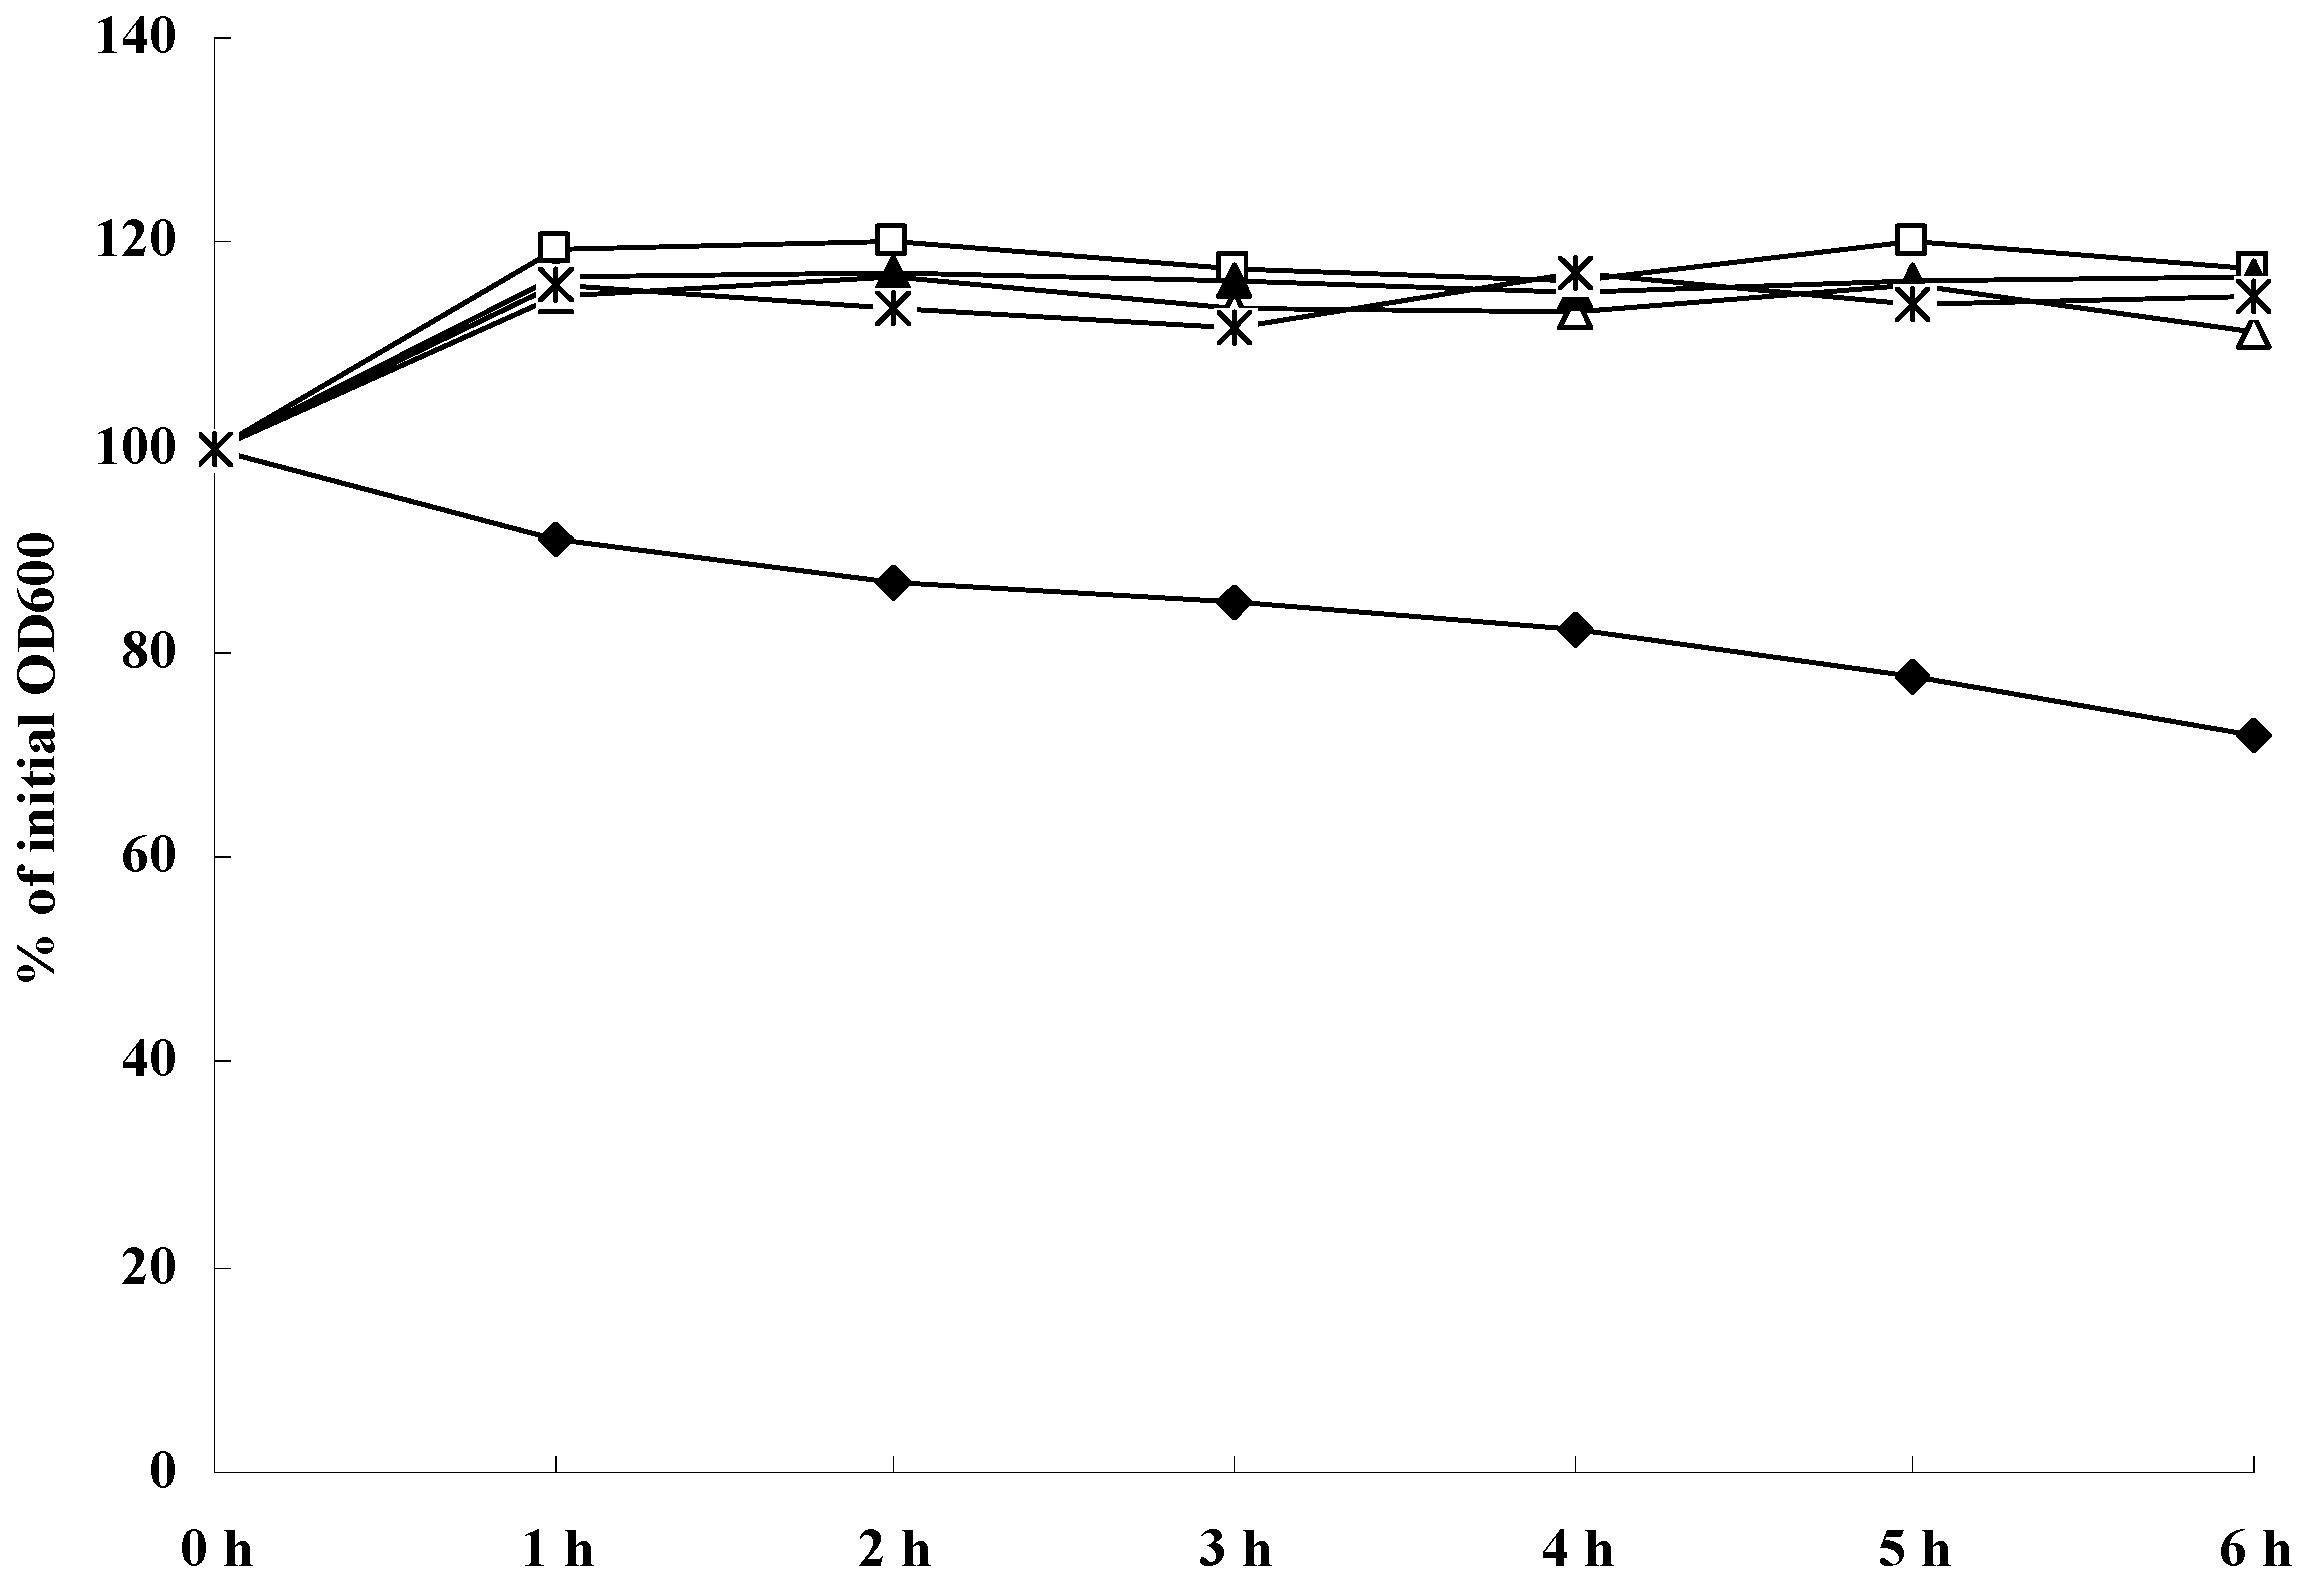
2.6. Role of SH on DNA Release by S. aureus

The amounts of eDNA in the cultures of SH-treated (SH was added before biofilm formation) or control strains were measured by PI staining in microtiter plates. As shown in Figure 5, treatment with SH resulted in a dose-dependent decrease in the amount of eDNA in S. aureus and ATCC 25923. Compared with the level in cultures of control strain (without SH treatment), cultures with more than 1/8× MIC of SH displayed a significant reduction in the amount of eDNA for strains ATCC 25923; in the cultures with more than 2× MIC of SH, little or no eDNA could be detected in strains ATCC 25923.
Figure 5. Role of SH on DNA release of S. aureus. The amount of eDNA stained by PI in S. aureus strain ATCC 25923 cultures treated with SH at concentration of 1/16× MIC, 1/8× MIC, 1/4× MIC, 1/2× MIC, 1× MIC and 2× MIC, 4× MIC, 8× MIC was measured. The drug-free culture was used as calibrator. Values represent the mean ± SD for three independent experiments. * represents p < 0.05 and ** represents p < 0.01.
Molecules 16 08848 g005

3. Discussion

Transcriptional profiling and functional analysis revealed that SH treatment inhibits autolysis in S. aureus. Previous reports showed that oxacillin increased autolysis and led to decreased atl transcription, but did not affect on cidA, whereas tetracycline led to decreased autolysis and increase atl and cidA transcription [13]. These results indicate that the inhibition of autolysis by SH is different from that by vancomycin or tetracycline. Tetracycline, chloramphenicol and SH can lead to cell deathand lysis, which are believed to be separate and distinguishable events [13]. Surprisingly, microarray results showed SH significantly decreased the transcription levels of autolysin cidA, however, transcription of the cidBC autolysin gene showed a significant increase. We agree with Rice et al. that the cidB and cidC genes are also co-expressed as a transcript separate from cidABC, and this cidBC transcript is regulated by signals (i.e., sigB) that are independent of cidABC regulation [21].
In S. aureus, the regulation of autolytic activity is generally complex and can occur at a number of different levels including autolysin enzymatic activity, posttranslational processing of autolysins, and autolysin gene transcription [22]. The expression of virulence factors is controlled by a network of regulatory genes that can be grouped into two major classes: two-component systems (TCSs) and small transcription regulators. Virulence factor regulation is modulated by at least seven TCSs (ArlRS, SaeRS, AgrAC, SrrAB, LytRS, YycFG, and VraRS), the DNA-binding protein SarA, the SarA family of homologues (SarS, SarR, SarU, SarT, SarV, MgrA, and TcaR [13], and an alternative sigma factor (B). In addition, the SarA homologue Rot has been identified as a repressor of toxins; Rot and agr have opposing effects on selected target genes [23]. The two-component system lytSR is involved in regulation of peptidoglycan hydrolases. In S. aureus, a lytS mutant showed increased autolysis, altered levels of hydrolase activity, and a rough cell surface [24]. lrgA and lrgB are positively regulated by lytSR, and their products show similarities to a bacteriophage murein hydrolase transporter family of proteins known as holins; these proteins negatively affect peptidoglycan hydrolases [24]. Recent reports indicate a strong impact of ClpP proteases on virulence, stress response, and physiology in S. aureus [23]. In the present study, clpP was significantly induced by 3.5-fold. Recent DNA microarray analysis revealed a down-regulation of lytSR and lrgAB by ArlRS [26]. Moreover, the transcriptional regulator mgrA (rat) has been described as a repressor of autolysis and belongs to the MarR and SarA protein families [18]. In this study, vraR, vraS, SarA, lrgA, lrgB, sarV, and clpP were upregulated by >1.5 fold, whereas agrA, RNAIII sarS, sigB, lytS, lytR arlS, agrC, and mgrA were downregulated by >1.5 fold. Additionally, saeR, saeS, yycF, yycG and tcaR were slightly upregulated and arlR, srrB, and srrA were slightly downregulated, but sarR, sarU, and sarT were expressed at low levels. This suggests that SH affects the expression of two-component signal transduction systems and transcriptional regulators, and also suggests that the target genes of these regulators are differentially regulated.
As mentioned above, SH was poorly active against S. aureus grown in biofilm cultures (SH was added after 48 h of cultivation (mature phase of biofilm formation)), although SHshowed in vitro antibacterial activity against S. aureus grown in planktonic cultures (SH was added before biofilm formation), whereas SH diminished the amounts of eDNA of S. aureus in a dose-dependent manner during biofilm formation. Indeed, eDNA is an essential matrix molecule that is produced during biofilm development by many bacterial species, including P. aeruginosa and S. aureus [27], and the overexpression of cidA may promote autolysis and eDNA release [28]. We concluded that SH may impede biofilm formation by reducing eDNA release in the early phase, and SH has no anti-biofilm effect in the mature phase of biofilm formation.
Taken together, the in vitro antibacterial activities and growth curve experiments showed that SH significantly inhibited the growth of S. aureus, simultaneously, SH diminished the amounts of eDNA of S. aureus in a dose-dependent manner during biofilm formation, our results suggests that SH may contribute to the antimicrobial effect by inhibition of autolysis of the S. aureus, and this may be part of the mode of action of SH.

4. Experimental

4.1. Bacterial Strains and Materials

S. aureus strains included 20 clinical S. aureus isolates from the First Hospital of Jilin University that had different antimicrobial susceptibility patterns (Table 1), as well as the standard strain ATCC25923, which was obtained from the China Medical Culture Collection Center (CMCC). Mueller-Hinton broth II (MHB II) was purchased from BD Biosciences, Inc. (Sparks, MD, USA). SH was purchased from CMCC, and stock solutions of varying concentrations were prepared in dimethyl sulfoxide (DMSO, Sigma-Aldrich, St. Louis, MO, USA).

4.2. Antibiotic Susceptibility Testing

The minimum inhibitory concentrations (MICs) of SH against the 21 S. aureus strains were determined in triplicate by broth microdilution or macrodilution, using two-fold serial dilutions in MHB II according to standard CLSI procedures [29]. MICs were defined as the lowest concentration at which no visible growth was observed. The minimum concentration of SH that inhibited 90% of the isolates tested was defined as the MIC90.

4.3. Growth Curves

Growth curves of different concentrations of SH against S. aureus strain ATCC 25923 were assayed according previous study [30].

4.4. Treatment with SH for Microarrays

S. aureus strain ATCC 25923 was grown overnight at 200 rpm in a rotary shaker at 37 °C in MHB II (10 mL). Two 250 mL Erlenmeyer flasks, each containing MHB II (100 mL), were cultured overnight to an initial OD600 of 0.05. Bacteria were grown at 37 °C and 200 rpm to an OD600 of 0.3. Subsequently, an aliquot (62.5 µL) of a 12,800 µg/mL SH stock solution prepared in dimethyl sulfoxide (DMSO) was added to one of the cultures (experimental culture), giving a final concentration of 1/2× MIC. Hence, the final concentration of solvent was 1% (vol/vol) DMSO; this amount of DMSO did not alter the pH of the medium. The other culture containing 1% (vol/vol) DMSO without SH was used as the control. All bacterial suspensions (both experimental and control) were further incubated for 30 min at 37 °C [31]. RNA isolation was then performed at this time. Three independent bacterial cultures for each SH treatment or control condition were prepared as biological replicates for RNA isolation on different days.

4.5. RNA Isolation and cDNA Labeling

Bacterial cells were treated with RNA Protect bacterial reagent (QIAGEN, Inc., Valencia, CA, USA) to minimize RNA degradation immediately before harvesting. Cells were collected by centrifugation and kept at −80 °C. RNA isolation and cDNA labeling were carried out as described previously [30]. Three independent RNA preparations and cDNA labelings were carried out on different days.
GeneChip S. aureus genome array (antisense) used here was provided by CapitalBio Corporation (http://www.capitalbio.com/en/index.asp, Beijing, China), a service provider authorized by Affymetrix Inc. (Santa Clara, CA, USA). This GeneChip includes N315, Mu50, NCTC 8325, and COL. The array contains probe sets to over 3,300 S. aureus ORFs and over 4,800 intergenic regions. GeneChip hybridization, washing, staining and scanning were performed according to previously described techniques [30].
Images were processed with Microarray Analysis Suite 5.0 (Affymetrix). The raw data from the array scans were normalized against median-centering genes for each array, and then log transformed. Differentially expressed genes were identified using Affymetrix GeneChip Operating Software (GCOS, Ver.1.0), which uses statistical criteria to generate a “present” or “absent” call for genes represented by each probe set in the array. Additionally, genes with ‘absent’ scores were filtered out and the remaining genes were analyzed. To identify genes differentially expressed in RH samples as compared to controls, Significance Analysis of Microarrays (SAM) software [32] was used. SAM one-class option with estimated false discovery rate (FDR) <5% and fold change cutoff of 2 was used to identify significantly differentially regulated genes between three SH treatment samples and three control samples; SAM two-class option with estimated FDR <5% and fold change cutoff of 1.5 was used to identify significantly differentially regulated genes involved in autolysis affected by SH between three SH treatment samples and three control samples [33].

4.6. Quantitative Real-Time RT-PCR

Quantitative real-time reverse transcription (RT)-PCR was used to verify the microarray results. Aliquots of the RNA preparations from SH untreated and control samples used in the microarray experiments were saved for quantitative real-time RT-PCR follow-up studies. Quantitative real time PCR was performed in triplicate using the 7000 Sequence Detection System (Applied Biosystems, Foster City, CA, USA) according to a previously described procedure [30]. The relative levels of expression of the genes of interest were calculated using the 2−ΔΔCt method described by Livak and Schmittgen [34], where Ct is the fractional threshold cycle. The Ct obtained for each gene of interest was normalized with that of 16S rRNA. The statistical significance of the fold differences in expression levels of the genes of interest was calculated using the two-tailed t-test analysis. A minimum 2-fold difference and a P value of <0.05 were considered significant between three SH treatment samples and three control samples, unless otherwise stated [35,36].

4.7. Triton X-100-Induced Autolysis

S. aureus strain ATCC 25923 was grown to an optical density of 0.3 at 600 nm (OD600), at which point SH was added to the cultures, typically at concentrations of 1/4× MIC, 1/2× MIC, MIC, or 2× MIC. Growth with shaking at 37 °C was allowed to continue to OD580 = 0.7 in control cultures, and antibiotic-exposed cultures were incubated for the same length of time as the control cultures. The cells were harvested by centrifugation and washed once by re-suspension in cold distilled water. The cell pellet was re-suspended to an OD600 of 1.0 in 0.05M Tris-HCl pH 7.0 containing 0.05% (v/v) Triton X-100. The cell suspension was incubated at 30 °C with shaking and the OD580 was determined at various intervals [37].

4.8. Quantitative Bacteriolytic Hydrolase Assays

Bacteriolysis of lyophilized S. aureus by extracellular hydrolases was quantified as previously described [38]. Equivalent amounts (100 µg) of concentrated supernatants of strain ATCC 25923 from various concentrations of drug treatment or control were added to a suspension of autoclaved and lyophilized S. aureus ATCC 25923 (1 mg/mL) in 100 mM Tris-HCl (pH 8.0) and incubated at 37 °C with shaking.Lytic activity was recorded by measuring the progressive decrease in absorbance (OD600).

4.9. Autolytic Enzyme Extracts

Cultures of S. aureus ATCC 25923 were grown to mid-exponential phase in TSB (250 mL) at 37 °C with aeration, at which time MOL was added to the cultures, typically at concentrations of 1/4× MIC, 1/2× MIC, 1× MIC or 2× MIC. The cultures were incubated with shaking at 37 °C for another 30 min, after which they were rapidly chilled, harvested by centrifugation, washed once in ice-cold 50 mM Tris-Cl, pH 7.5, and extracted with 4% sodium dodecyl sulfate (SDS, 250 μL) at room temperature or 3 M LiCl at 4 °C for 30 min with stirring. Protein concentrations were determined using the BCA protein assay kit (Pierce, Rockford, IL, USA) with bovine serum albumin as the standard [39].

4.10. Preparation of Crude Cell Walls

Cultures of S. aureus ATCC 25923 were grown in TSB to mid-logarithmic phase at 37 °C with aeration, after which they were rapidly chilled, harvested by centrifugation and resuspended in boiling 8% SDS. After boiling for 30 min, the samples were washed in distilled water to remove the SDS, mechanically disrupted, washed again and lyophilized.

4.11. Bacteriolytic Enzyme Profiles after SDS-Polyacrylamide Gel Electrophoresis

The separation of proteins was carried out using the technique of Laemmli [40]. Resolving gels (7.5% acrylamide–0.2% bisacrylamide) contained crude cell walls (1 mg dry weight per mL). Samples were separated by electrophoresis at a constant current of 20 mA at room temperature until the blue dye reached the bottom of the separating gel. The visualization of bacteriolytic enzymes was carried out as follows: the gels were initially washed in distilled water four times for 15 min each, washed in buffer composed of 50 mM Tris-Cl (pH 7.5), 0.1% Triton X-100, 10 mM CaCl2 and 10 mM MgCl2 and then incubated for 24 h at 37 °C with gentle agitation in the same buffer as described above [41].

4.12. Establishment of Microbial Biofilms

For each microorganism, the OD of the overnight suspension was determined at 600 nm and diluted in MHB as required to a final concentration of 1 × 10⁵ cfu/mL. Using previously established optimum conditions for biofilm development (data not shown) biofilms of each microorganism were grown in clear flat-bottomed, tissue culture-treated 6-well microtitre plates. To confirm slime production, microorganisms were cultured onto Congo Red agar [42]. Confluent biofilms were subsequently generated in wells of white-walled, clear bottom, tissue culture-treated 96-well microtitre plates, inoculated with a 1 × 10⁵ cfu/mL suspension of each microorganism (200 µL). Empty wells were reserved for use as negative controls. Microtitre plates were then incubated for 48 h at 37 °C.

4.13. Biofilm Antimicrobial Susceptibility Testing

Wells containing biofilm were gently washed with PBS (250 µL) to remove any unbound cells. Serial double dilutions of SH were prepared in either MHB (SH 0.25~1024 µg/mL). In triplicate wells, MHB (100 µL) was added to antimicrobial agent (100 µL) in decreasing concentrations across the rows. After 24 h of incubation at 37 °C, the antimicrobial agents were removed and the wells washed once with PBS. PBS (250 µL) was added to each well and the plate sonicated at 50 Hz in a water bath for 30 min at room temperature. Biofilms were recovered from the wells by a scrape and wash procedure [43] and the entire contents of the well (250 µL) mixed with MHA, cooled to 50 °C. Following incubation of the set plates at 37 °C for 24 h, The minimum biofilm inhibition concentration (MBIC) was determined as the lowest concentration to show growth below or equal to that of the control (biofilm in saline). The minimum biofilm bactericidal concentration (MBBC) was identified as the lowest concentration demonstrating no bacterial growth.

4.14. Measurement of eDNA in Microtiter Plate Cultures Treated with SH

Overnight cultures of S. aureus ATCC 25923 grown in TSB medium containing 0.25% glucose were diluted to an OD600 of 0.001 in AB medium supplemented with 0.5% glucose, 0.05 mM PI and 10% TSB, and SH (dissolved in DMSO) was added to eight of the cultures to obtain final concentrations of 1/16× MIC, 1/8× MIC, 1/4× MIC, 1/2× MIC, 1× MIC and 2× MIC, 4× MIC, 8× MIC, respectively. These cultures were transferred to the wells of polystyrene microtiter plates (150 mL per well) and incubated for 24 h at 37 °C, upon which the PI absorbance was measured at 480 nm [44].

5. Conclusion

In summary, SH inhibited autolysis in S. aureus, presumably due to altered proteolytic processing. To our knowledge, this is the first report regarding the effects of SH on autolysis in S. aureus; this lays the groundwork for further study of the action mechanism of SH.

Supplementary Materials

Supplementary materials can be accessed at: https://www.mdpi.com/1420-3049/16/10/8848/s1.

Supplementary Materials

Supplementary File 1

Acknowledgements

Financial supports for this work came from National Nature Science Foundation of China (No. 30871889), the State Key Laboratory for Molecular Virology and Genetic Engineering (Grant No. 2011KF05), the Specialized Research Fund for the Doctoral Program of Higher Education (SRFDP) (No. 200801831051), the Fund for Science and Technology Development of the Jilin Province, China (No. 200705233), and the Fundamental Research Funds for the Central Universities.

Conflict of interest

The authors declare that they have no conflict of interest.

Reference

  1. Paulsen, I.T.; Firth, M.; Skurray, R.A. Resistance to Antimicrobial Agents other than b-Lactams. In The Staphylococci in Human Disease; Crossley, K.B., Archer, G.L., Eds.; Churchill Livingstone: New York, NY, USA, 1997; pp. 175–212. [Google Scholar]
  2. Donlan, R.M. Biofilms: Microbial life on surfaces. Emerg. Infect. Dis. 2002, 8, 881–890. [Google Scholar] [CrossRef]
  3. Parsek, M.R.; Fuqua, C. Biofilms 2003: Emerging themes and challenges in studies of surface-associated microbial life. J. Bacteriol. 2004, 186, 4427–4440. [Google Scholar] [CrossRef]
  4. Wang, D.; Yu, Q.; Eikstadt, P.; Hammond, D.; Feng, Y.; Chen, N. Studies on adjuvanticity of sodium houttuyfonate and its mechanism. Int. Immunopharmacol. 2002, 2, 1411–1418. [Google Scholar] [CrossRef]
  5. The Pharmacopoeia Committee of China, The Chinese Pharmacopoeia, vol. I; The Pharmacopoeia Committee of China, The Chinese Pharmacopoeia, vol. I: Beijing, China, 2000.
  6. Li, S.; Yu, Q.H.; Chu, Z.Y. Studies on the anti-inflammatory effect and mechanism of houttuyninum. Chin. Pharmacol. Bull. 2007, 14, 442–444. [Google Scholar]
  7. Ye, X.L.; Li, X.G.; Yuan, L.J.; Ge, L.H.; Zhang, B.S.; Zhou, S.B. Interaction of houttuyfonate homologues with the cell membrane of gram-positive and gram-negative bacteria. Colloids Surf. A 2007, 301, 412–418. [Google Scholar] [CrossRef]
  8. Rice, K.C.; Mann, E.E.; Endres, J.L.; Weiss, E.C.; Cassat, J.E. The cidA murein hydrolase regulator contributes to DNA release and biofilm development in Staphylococcus aureus. Proc. Natl. Acad. Sci. USA 2007, 104, 8113–8118. [Google Scholar]
  9. Reinicke, B.; Blumel, P.; Giesbrecht, P. Reduced degradability by lysozyme of staphylococcal cell walls after chloramphenicol treatment. Arch. Microbiol. 1983, 135, 120–124. [Google Scholar] [CrossRef]
  10. Yamada, S.; Sugai, M.; Komatsuzawa, H.; Matsumoto, A. Suppressed localization of a major autolysin on Staphylococcus aureus treated with tetracycline. J. Electron. Microsc. 2001, 50, 359–364. [Google Scholar] [CrossRef]
  11. Sieradzki, K.; Tomasz, A. Inhibition of the autolytic system by vancomycin causes mimicry of vancomycin-intermediate Staphylococcus aureus-type resistance, cell concentration dependence of the MIC, and antibiotic tolerance in vancomycin-susceptible S. aureus. Antimicrob. Agents Chemother. 2006, 50, 527–533. [Google Scholar] [CrossRef]
  12. Yoshida, R.; Kuwahara-Arai, K.; Baba, T.; Cui, L.; Richardson, J.F.; Hiramatsu, K. Physiological and molecular analysis of a mecA-negative Staphylococcus aureus clinical strain that expresses heterogeneous methicillin resistance. J. Antimicrob. Chemother. 2003, 51, 247–255. [Google Scholar] [CrossRef]
  13. Ledala, N.; Wilkinson, B.J.; Jayaswal, R.K. Effects of oxacillin and tetracycline on autolysis, autolysin processing and atl transcription in Staphylococcus aureus. Int. J. Antimicrob. Agents 2006, 27, 518–524. [Google Scholar] [CrossRef]
  14. Michel, A.; Agerer, F.; Hauck, C.R.; Herrmann, M.; Ullrich, J.; Hacker, J.; Ohlsen, K. Global regulatory impact of ClpP protease of Staphylococcus aureus on regulons involved in virulence, oxidative stress response, autolysis, and DNA repar. J. Bacteriol. 2006, 188, 5783–5796. [Google Scholar] [CrossRef]
  15. Liang, X.; Zheng, L.; Landwehr, C.; Lunsford, D.; Holmes, D.; Ji, Y. Global regulation of gene expression by ArlRS, a two-component signal transduction regulatory system of Staphylococcus aureus. J. Bacteriol. 2005, 187, 5486–5492. [Google Scholar] [CrossRef]
  16. Rice, K.C.; Patton, T.; Yang, S.J.; Dumoulin, A.; Bischoff, M.; Bayles, K.W. Transcription of the Staphylococcus aureus cid and lrg murein hydrolase regulators is affected by sigma factor B. J. Bacteriol. 2004, 186, 3029–3037. [Google Scholar] [CrossRef]
  17. Dubrac, S.; Boneca, I.G.; Poupel, O.; Msadek, T. New insights into the WalK/WalR (YycG/YycF) essential signal transduction pathway reveal a major role in controlling cell wall metabolism and biofilm formation in Staphylococcus aureus. J. Bacteriol. 2007, 189, 8257–8269. [Google Scholar] [CrossRef]
  18. Rice, K.; Peralta, R.; Bast, D.; de Azavedo, J.; McGavin, M.J. Description of Staphylococcus serine protease (ssp) operon in Staphylococcus aureus and nonpolar inactivation of sspA-encoded serine protease. Infect. Immun. 2001, 69, 159–169. [Google Scholar] [CrossRef]
  19. Ingavale, S.S.; van Wamel, W.; Cheung, A.L. Characterization of RAT, an autolysis regulator in Staphylococcus aureus. Mol. Microbiol. 2003, 48, 1451–1466. [Google Scholar] [CrossRef]
  20. Manna, A.C.; Ingavale, S.S.; Maloney, M.; van Wamel, W.; Cheung, A.L. Identification of sarV (SA2062), a new transcriptional regulator, is repressed by SarA and MgrA (SA0641) and involved in the regulation of autolysis in Staphylococcus aureus. J. Bacteriol. 2004, 186, 5267–5280. [Google Scholar] [CrossRef]
  21. Rice, K.C.; Patton, T.; Yang, S.J.; Dumoulin, A.; Bischoff, M.; Bayles, K.W. Transcription of the Staphylococcus aureuscid and lrg murein hydrolase regulators is affected by sigma factor B. J. Bacteriol. 2004, 186, 3029–3037. [Google Scholar] [CrossRef]
  22. Wootton, M.; Bennett, P.M.; MacGowan, A.P.; Walsh, T.R. Reduced expression of the atl autolysin gene and susceptibility to autolysis in clinical heterogeneous glycopeptide-intermediate Staphylococcus aureus (hGISA) and GISA strains. J. Antimicrob. Chemother. 2005, 56, 944–947. [Google Scholar] [CrossRef]
  23. Saïd-Salim, B.; Dunman, P.M.; McAleese, F.M.; Macapagal, D.; Murphy, E.; McNamara, P.J.; Arvidson, S.; Foster, T.J.; Projan, S.J.; Kreiswirth, B.N. Global Regulation of Staphylococcus aureus Genes by Rot. J. Bacteriol. 2003, 185, 610–619. [Google Scholar] [CrossRef]
  24. Brunskill, E.W.; Bayles, K.W. Identification of LytSR-regulated genes from Staphylococcus aureus. J. Bacteriol. 1996, 178, 5810–5812. [Google Scholar]
  25. Gründling, A.; Schneewind, O. Genes required for glycolipid synthesis and lipoteichoic acid anchoring in Staphylococcus aureus. J. Bacteriol. 2007, 189, 2521–2530. [Google Scholar] [CrossRef]
  26. Brunskill, E.W.; Bayles, K.W. Identification and molecular characterization of a putative regulatory locus that affects autolysis in Staphylococcus aureus. J. Bacteriol. 1996, 178, 611–618. [Google Scholar]
  27. Whitchurch, C.B.; Tolker-Nielsen, T.; Ragas, P.C.; Mattick, J.S. Extracellular DNA required for bacterial biofilm formation. Science 2002, 295, 1487. [Google Scholar] [CrossRef]
  28. Rice, K.C.; Mann, E.E.; Endres, J.L.; Weiss, E.C.; Cassat, J.E. The cidA murein hydrolase regulator contributes to DNA release and biofilm development in Staphylococcus aureus. Proc. Natl. Acad. Sci. USA 2007, 104, 8113–8118. [Google Scholar] [CrossRef]
  29. Clinical and Laboratory Standards Institute Methods for Dilution Antimicrobial Susceptibility Tests for Bacteria that Grow Aerobically, 8th ed; Approved Standard M7-A8. CLSI: Wayne, PA, USA, 2009.
  30. Yu, L.; Xiang, H.; Fan, J.; Wang, D.; Yang, F.; Guo, N.; Jin, Q.; Deng, X. Global transcriptional response of Staphylococcus aureus to rhein, a natural plant product. J. Biotechnol. 2008, 135, 304–308. [Google Scholar] [CrossRef]
  31. McAleese, F.; Wu, S.W.; Sieradzki, K.; Dunman, P.; Murphy, E.; Projan, S.; Tomasz, A. Overexpression of genes of the cell wall stimulon in clinical isolates of Staphylococcus aureus exhibiting vancomycin-intermediate-S. aureus-type resistance to vancomycin. J. Bacteriol. 2006, 188, 1120–1133. [Google Scholar] [CrossRef]
  32. Tusher, V.G.; Tibshirani, R.; Chu, G. Significance analysis of microarrays applied to the ionizing radiation response. Proc. Natl. Acad. Sci. USA 2001, 98, 5116–5121. [Google Scholar] [CrossRef]
  33. Reddy, S.P.; Britto, R.; Vinnakota, K.; Aparna, H.; Sreepathi, H.K.; Thota, B.; Kumari, A.; Shilpa, B.M.; Vrinda, M.; Umesh, S.; et al. Novel glioblastoma markers with diagnostic and prognostic value identified through transcriptome analysis. Clin. Cancer Res. 2008, 14, 2978–2987. [Google Scholar]
  34. Livak, K.J.; Schmittgen, T.D. Analysis of relative gene expression data using real-time quantitative PCR and the 2−ΔΔCT method. Methods 2001, 25, 402–408. [Google Scholar] [CrossRef]
  35. Ray, S.; Chatterjee, E.; Chatterjee, A.; Paul, K.; Chowdhury, R. A fadD mutant of Vibrio cholerae is impaired in the production of virulence factors and membrane localization of the virulence regulatory protein TcpP. Infect. Immun. 2011, 79, 258–266. [Google Scholar] [CrossRef]
  36. Scaltriti, M.; Belloni, L.; Caporali, A.; Davalli, P.; Remondini, D.; Rizzi, F.; Astancolle, S.; Corti, A.; Bettuzzi, S. Molecular classification of green tea catechin-sensitive and green tea catechin-resistant prostate cancer in the TRAMP mice model by quantitative real-time PCR gene profiling. Carcinogenesis 2006, 27, 1047–1053. [Google Scholar]
  37. Mani, N.; Tobin, P.; Jayaswal, R.K. Isolation and characterization of autolysis-defective mutants of Staphylococcus aureus created by Tn917-lacZ mutagenesis. J. Bacteriol. 1993, 175, 1493–1499. [Google Scholar]
  38. Groicher, K.H.; Firek, B.A.; Fujimoto, D.F.; Bayles, K.W. The Staphylococcus aureus lrgAB operon modulates murein hydrolase activity and penicillin tolerance. J. Bacteriol. 2000, 182, 1794–1801. [Google Scholar] [CrossRef]
  39. Mani, N.; Tobin, P.; Jayaswal, R.K. Isolation and characterization of autolysis-defective mutants of Staphylococcus aureus created by Tn917-lacZ mutagenesis. J. Bacteriol. 1993, 175, 1493–1499. [Google Scholar]
  40. Laemmli, U.K. Cleavage of structural proteins during the assembly of the head of bacteriophage T4. Nature 1970, 277, 680–685. [Google Scholar] [CrossRef]
  41. Reinicke, B.; Blumel, P.; Giesbrecht, P. Reduced degradability by lysozyme of staphylococcal cell walls after chloramphenicol treatment. Arch. Microbiol. 1983, 135, 120–124. [Google Scholar] [CrossRef]
  42. Freeman, D.J.; Falkiner, F.R.; Keane, C.T. New method for detecting slime production by coagulase negative staphylococci. J. Clin. Pathol. 1989, 42, 872–874. [Google Scholar] [CrossRef]
  43. Adams, D.; Quayum, M.; Worthington, T.; Lambert, P.; Elliott, T. Evaluation of a 2% chlorhexidine gluconate in 70% isopropyl alcohol skin disinfectant. J. Hosp. Infect. 2005, 61, 278–290. [Google Scholar]
  44. Qin, Z.; Ou, Y.; Yang, L.; Zhu, Y.; Tolker-Nielsen, T.; Molin, S.; Qu, D. Role of autolysin-mediated DNA release in biofilm formation of Staphylococcus epidermidis. Microbiology 2007, 153, 2083–2092. [Google Scholar] [CrossRef]
  • Sample Availability: Sample of the compound Sodium Houttuyfonate is available from the authors.

