Spectroscopic Investigations of the Binding Interaction of a New Indanedione Derivative with Human and Bovine Serum Albumins

Abstract
:1. Introduction
2. Results and Discussion
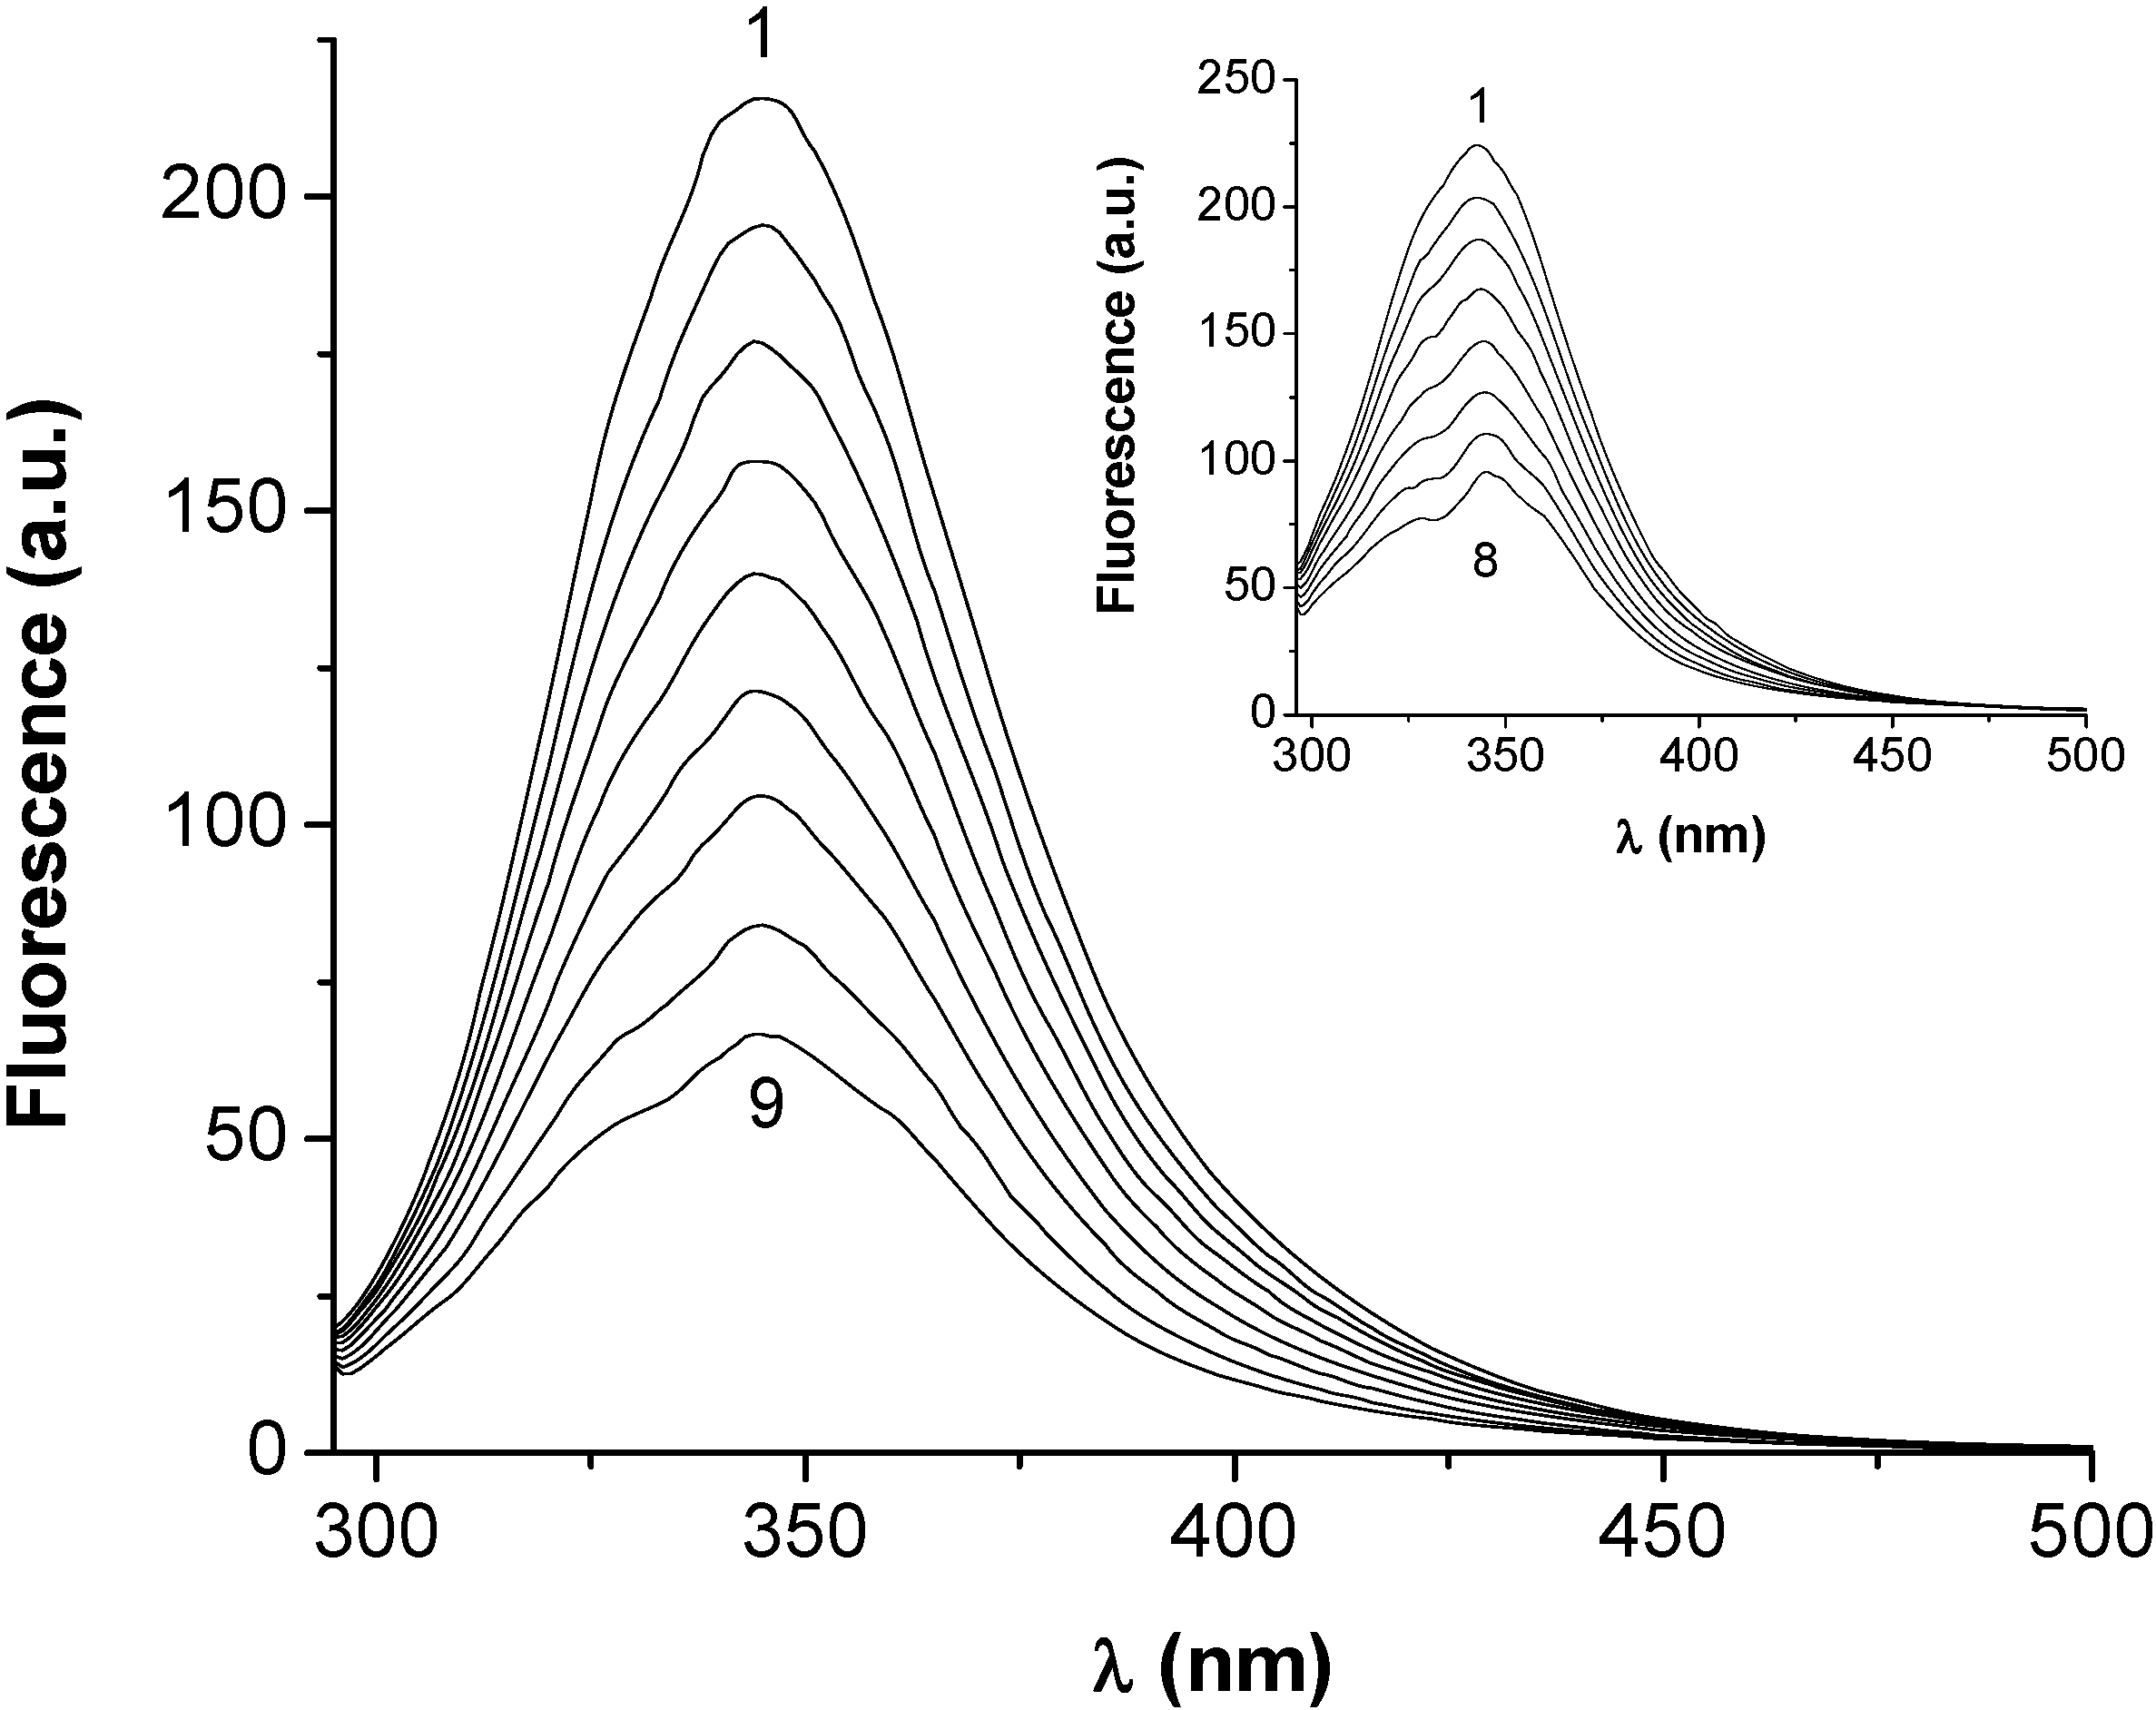
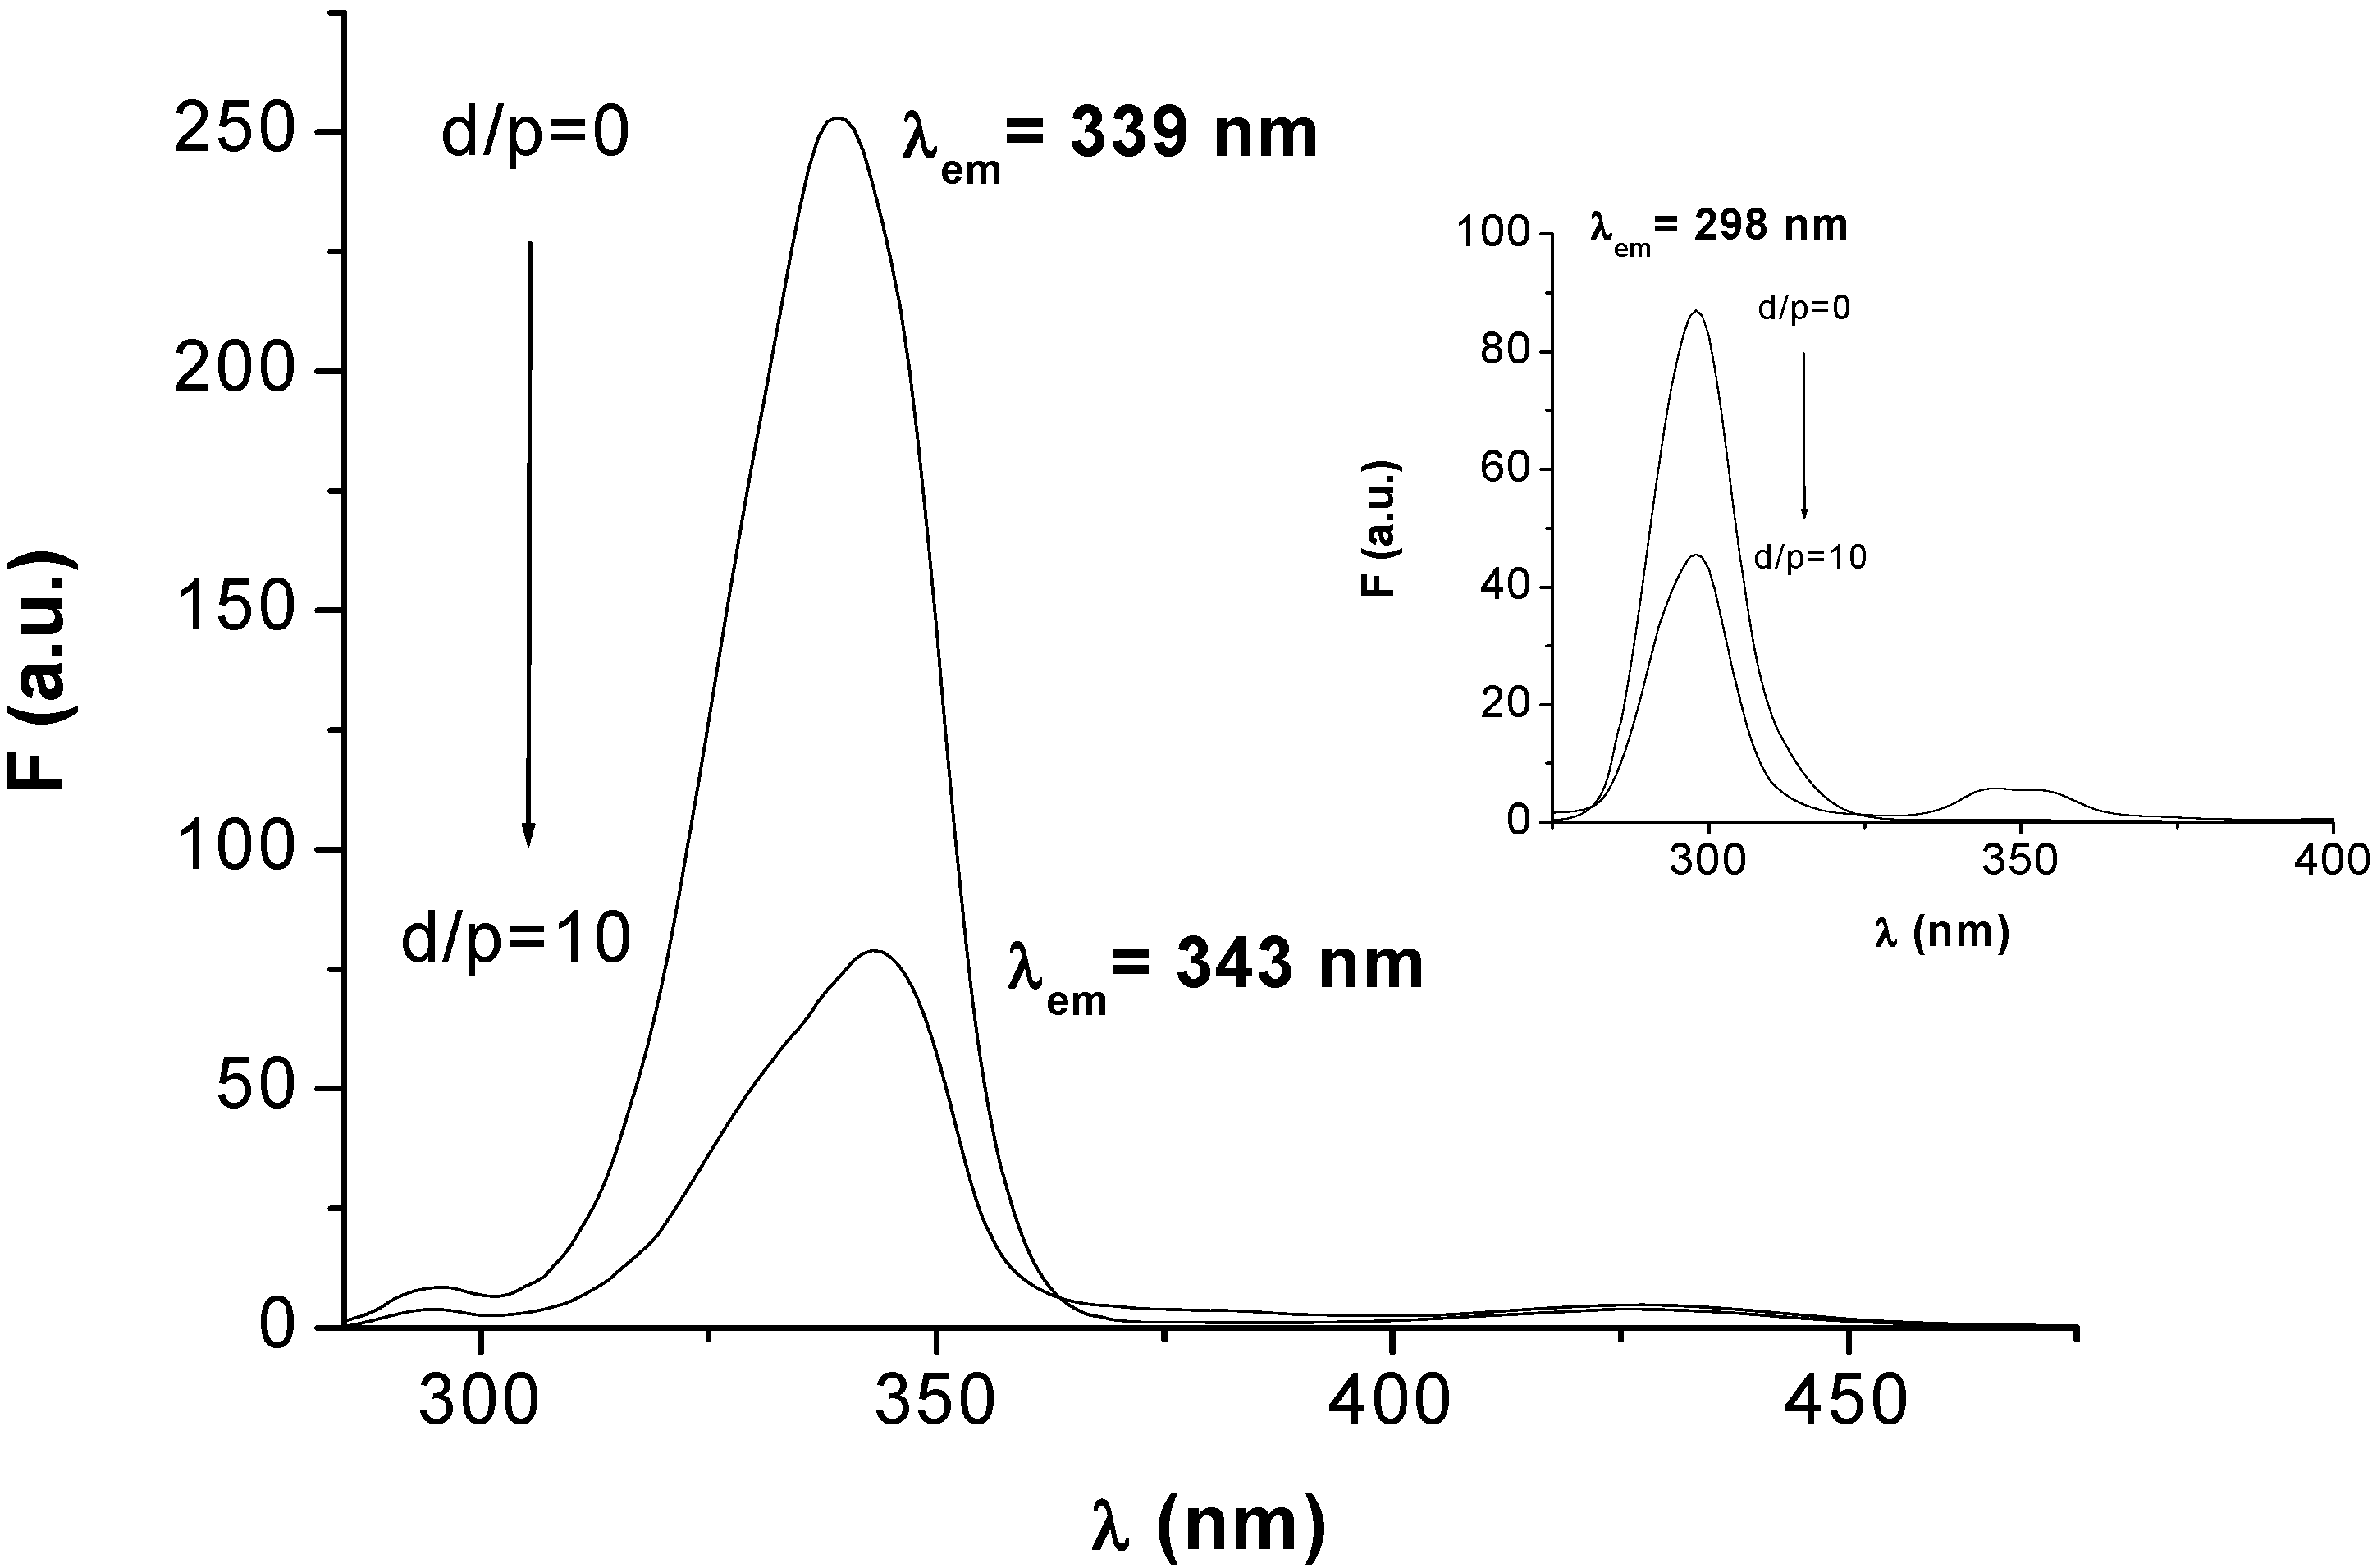
2.1. Fluorescence quenching of serum albumins in presence of HEBID


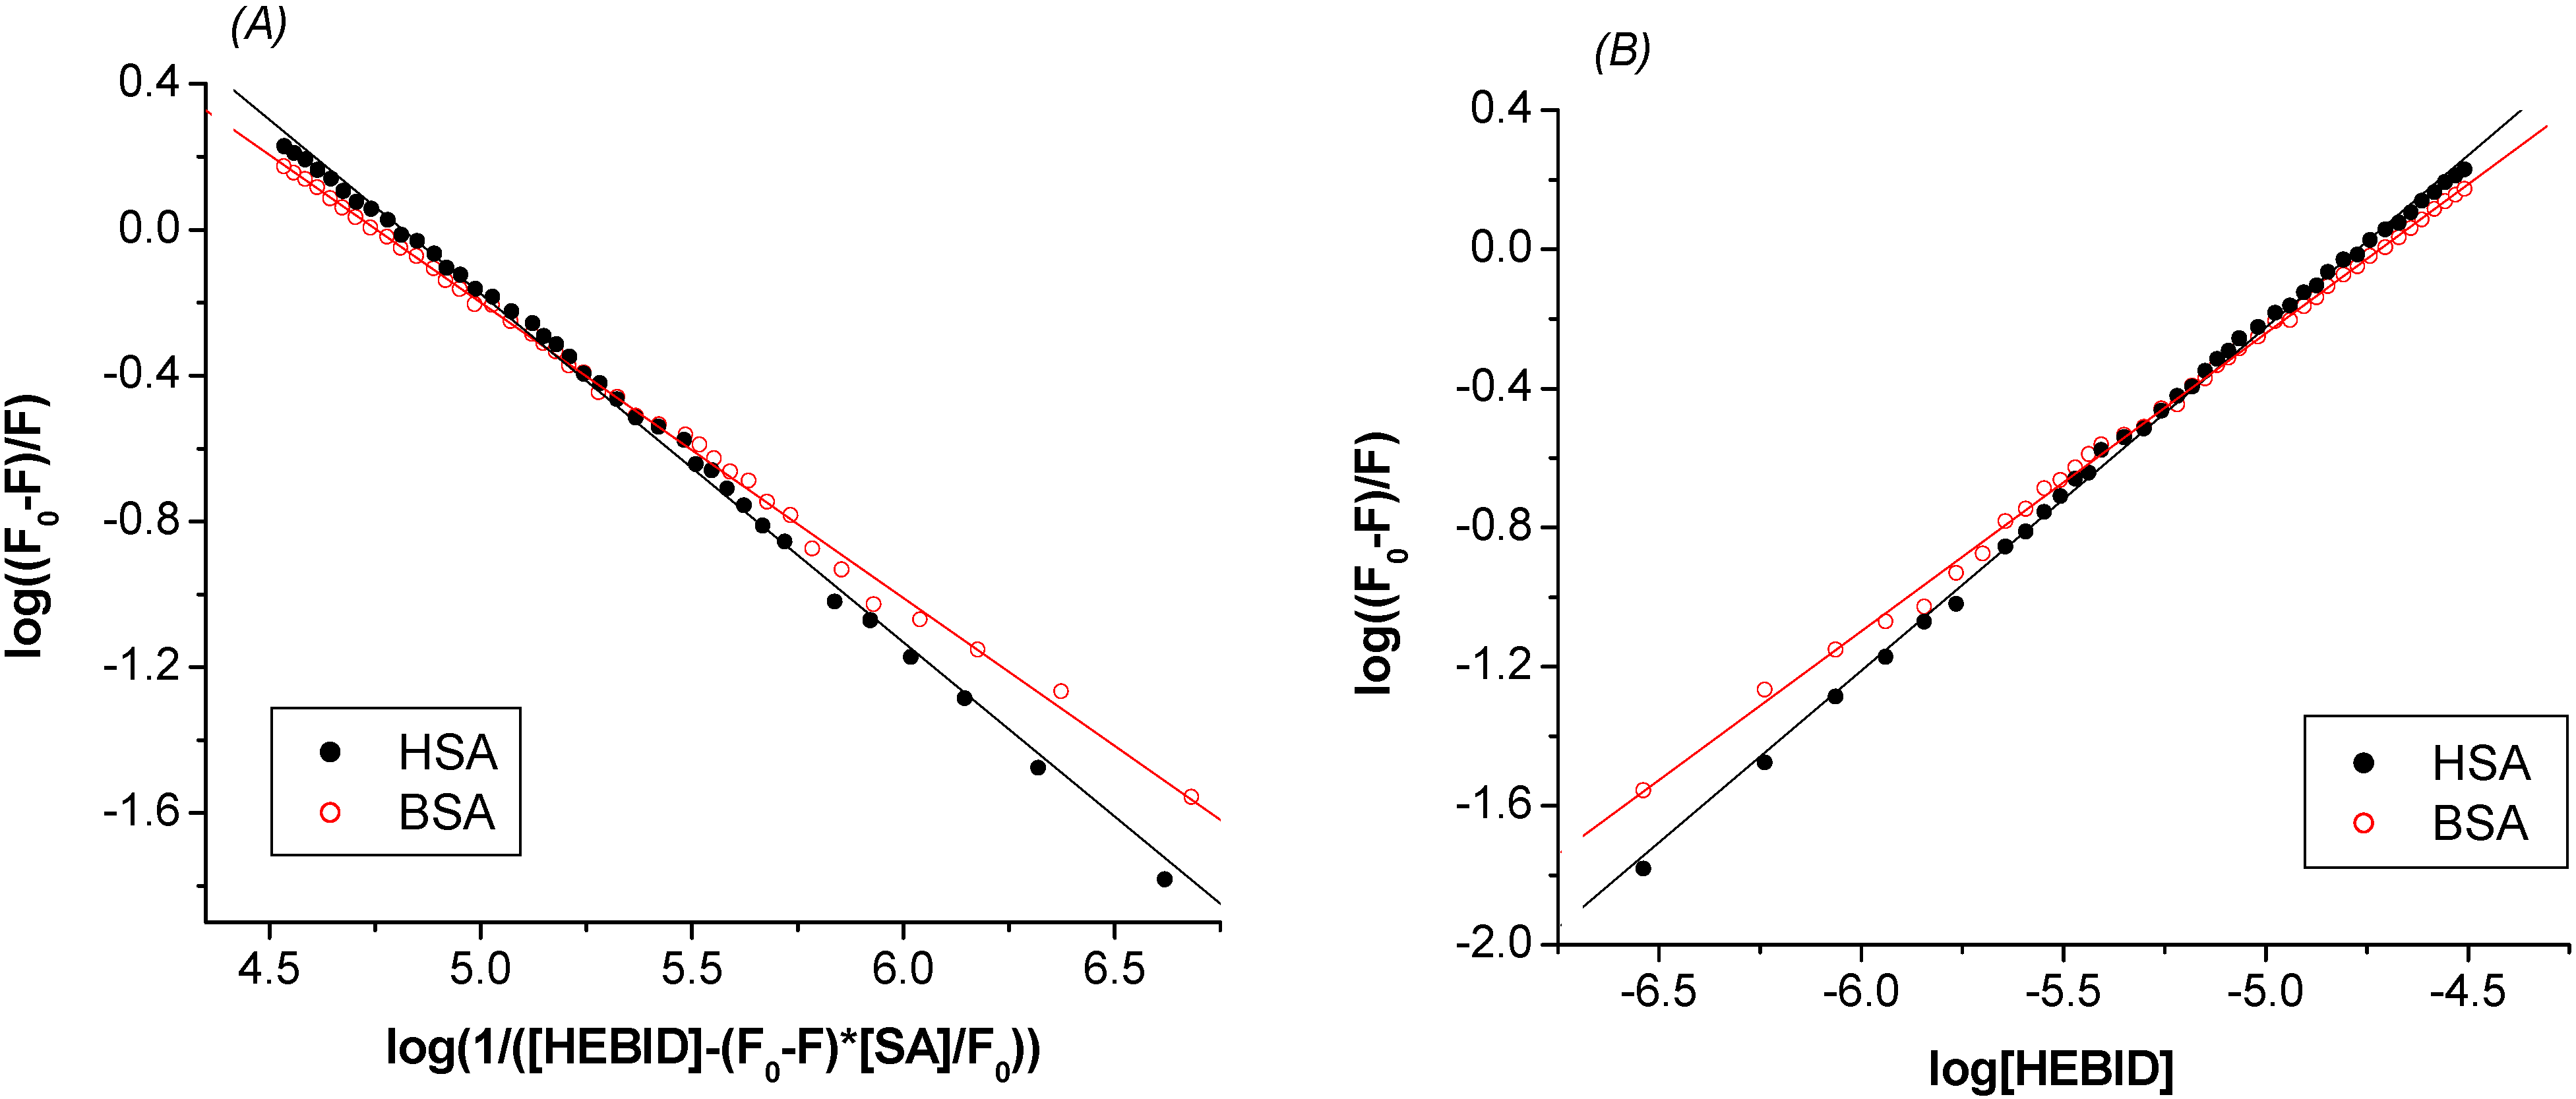
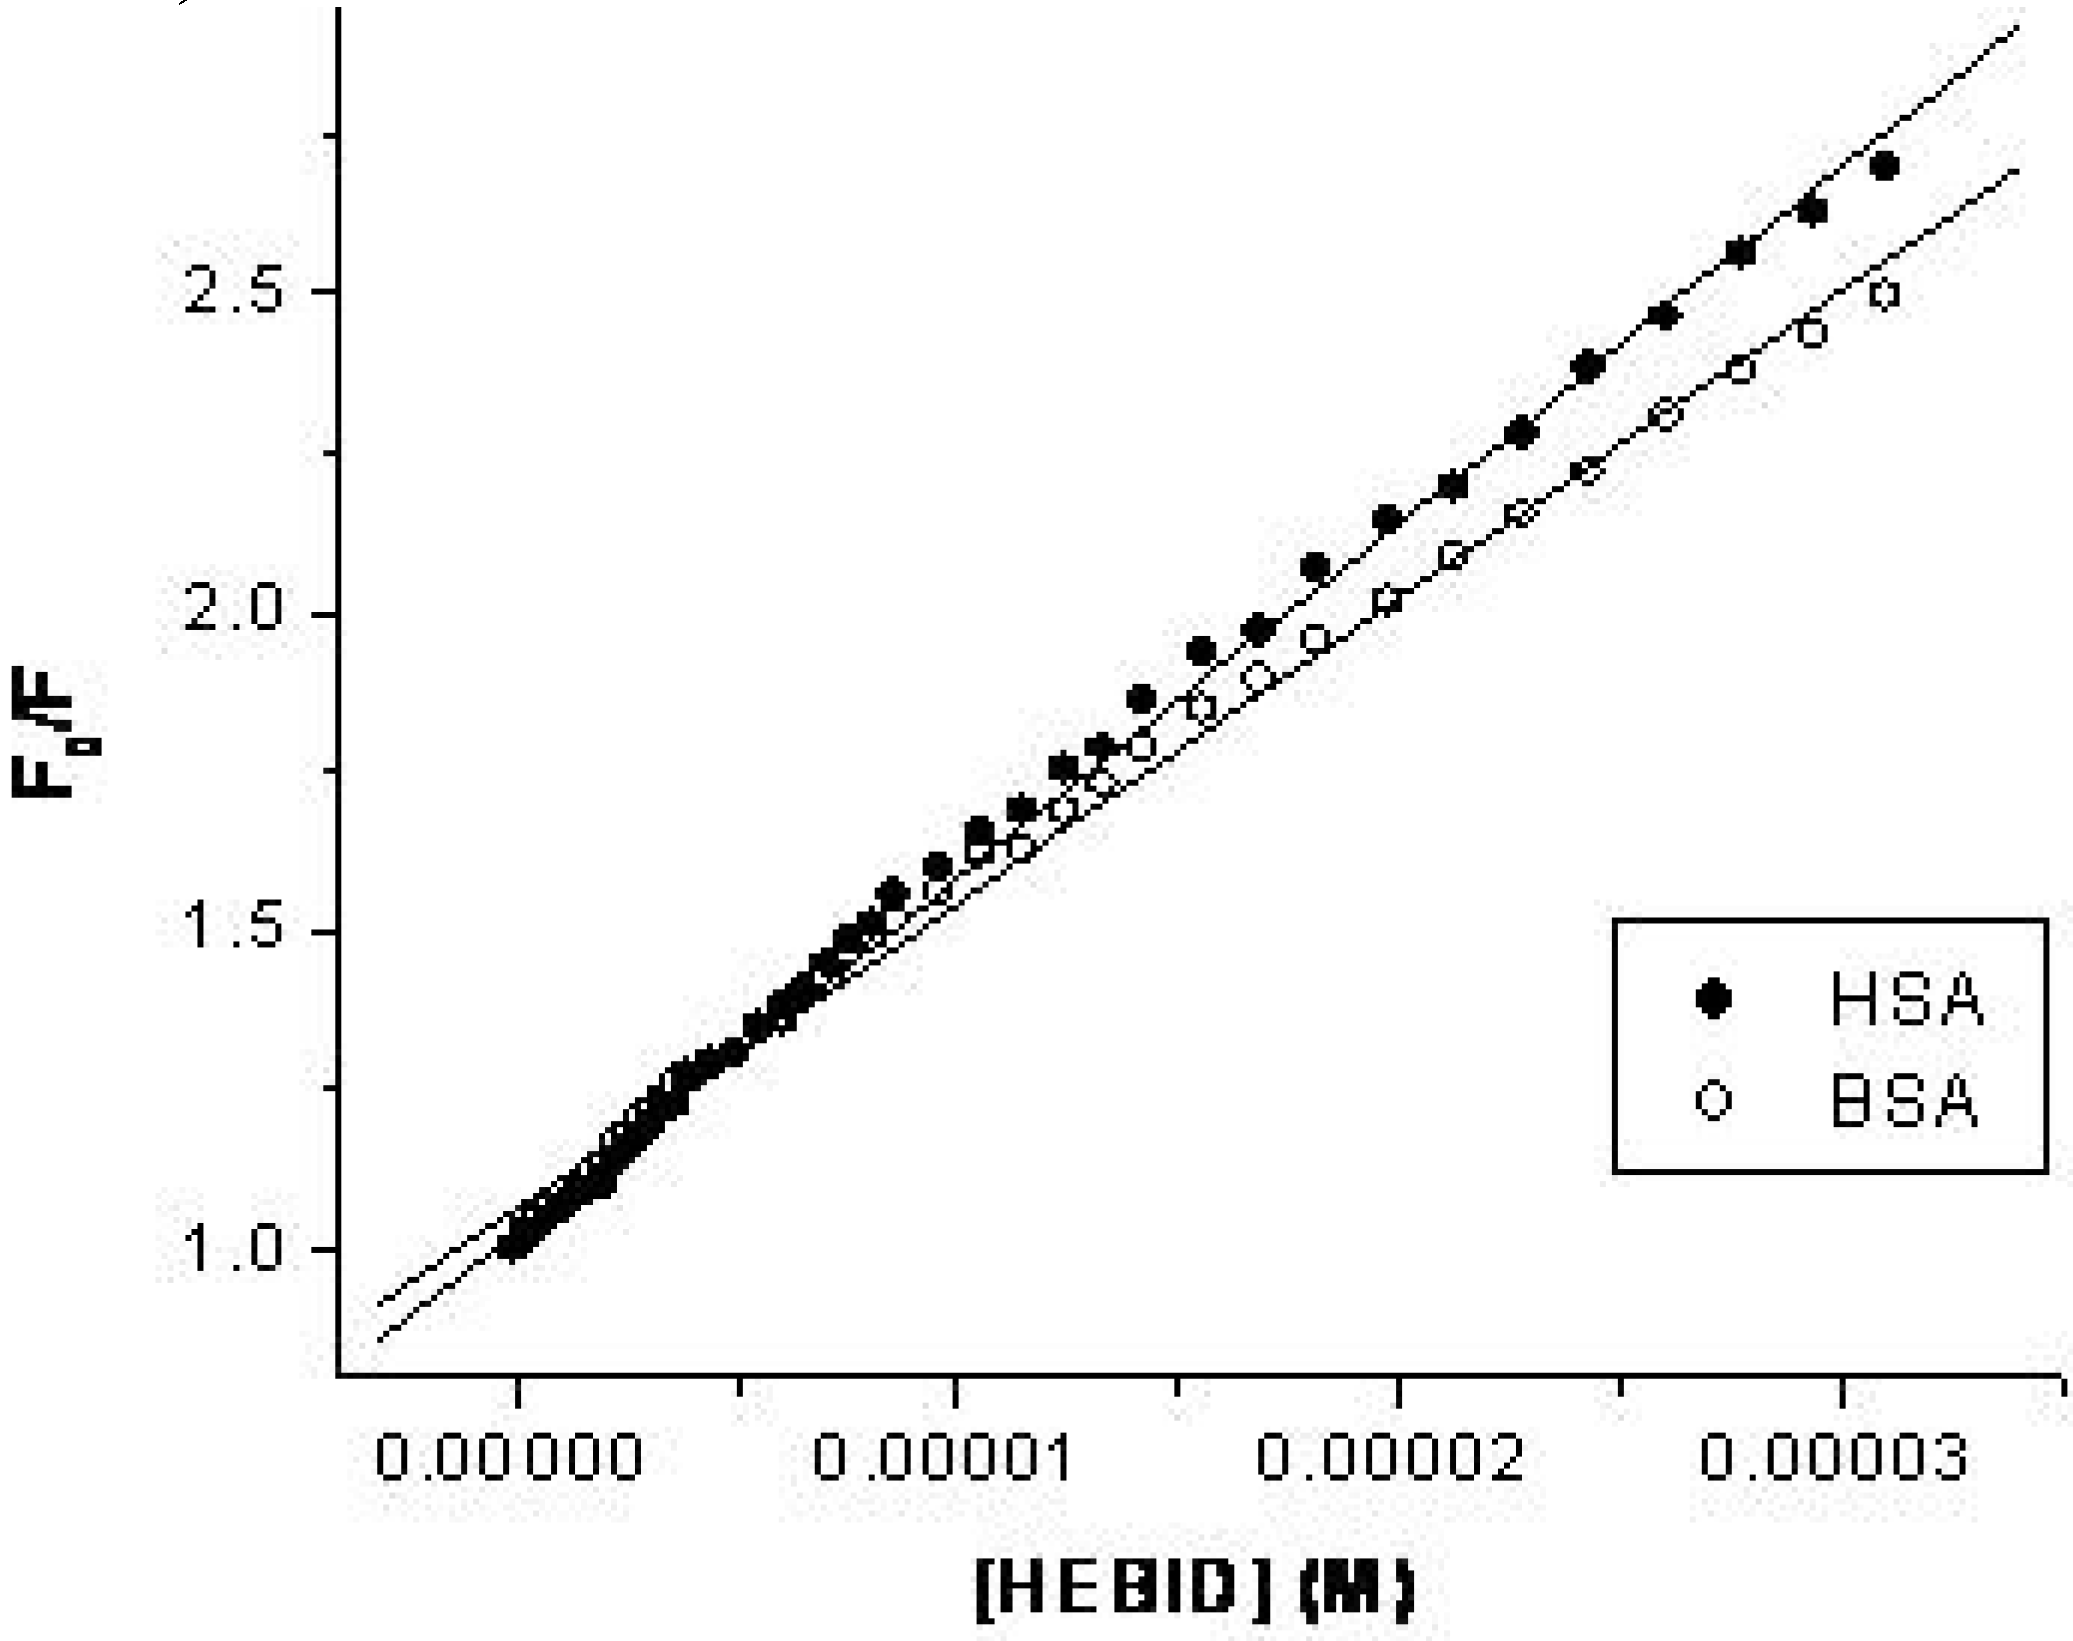
2.2. Estimation of the binding parameters


| K (M-1) ×10-4 | n | R | SD | ||
|---|---|---|---|---|---|
| Equation (2) | HSA | 6.54 | 0.96 | 0.9985 | 0.0279 |
| BSA | 5.65 | 0.81 | 0.9989 | 0.0209 | |
| Equation (3) | HSA | 5.47 | 0.99 | 0.9987 | 0.0262 |
| BSA | 1.11 | 0.86 | 0.9992 | 0.0180 |
2.3. Effect of HEBID on the conformations of HSA and BSA
2.3.1 Synchronous fluorescence measurements
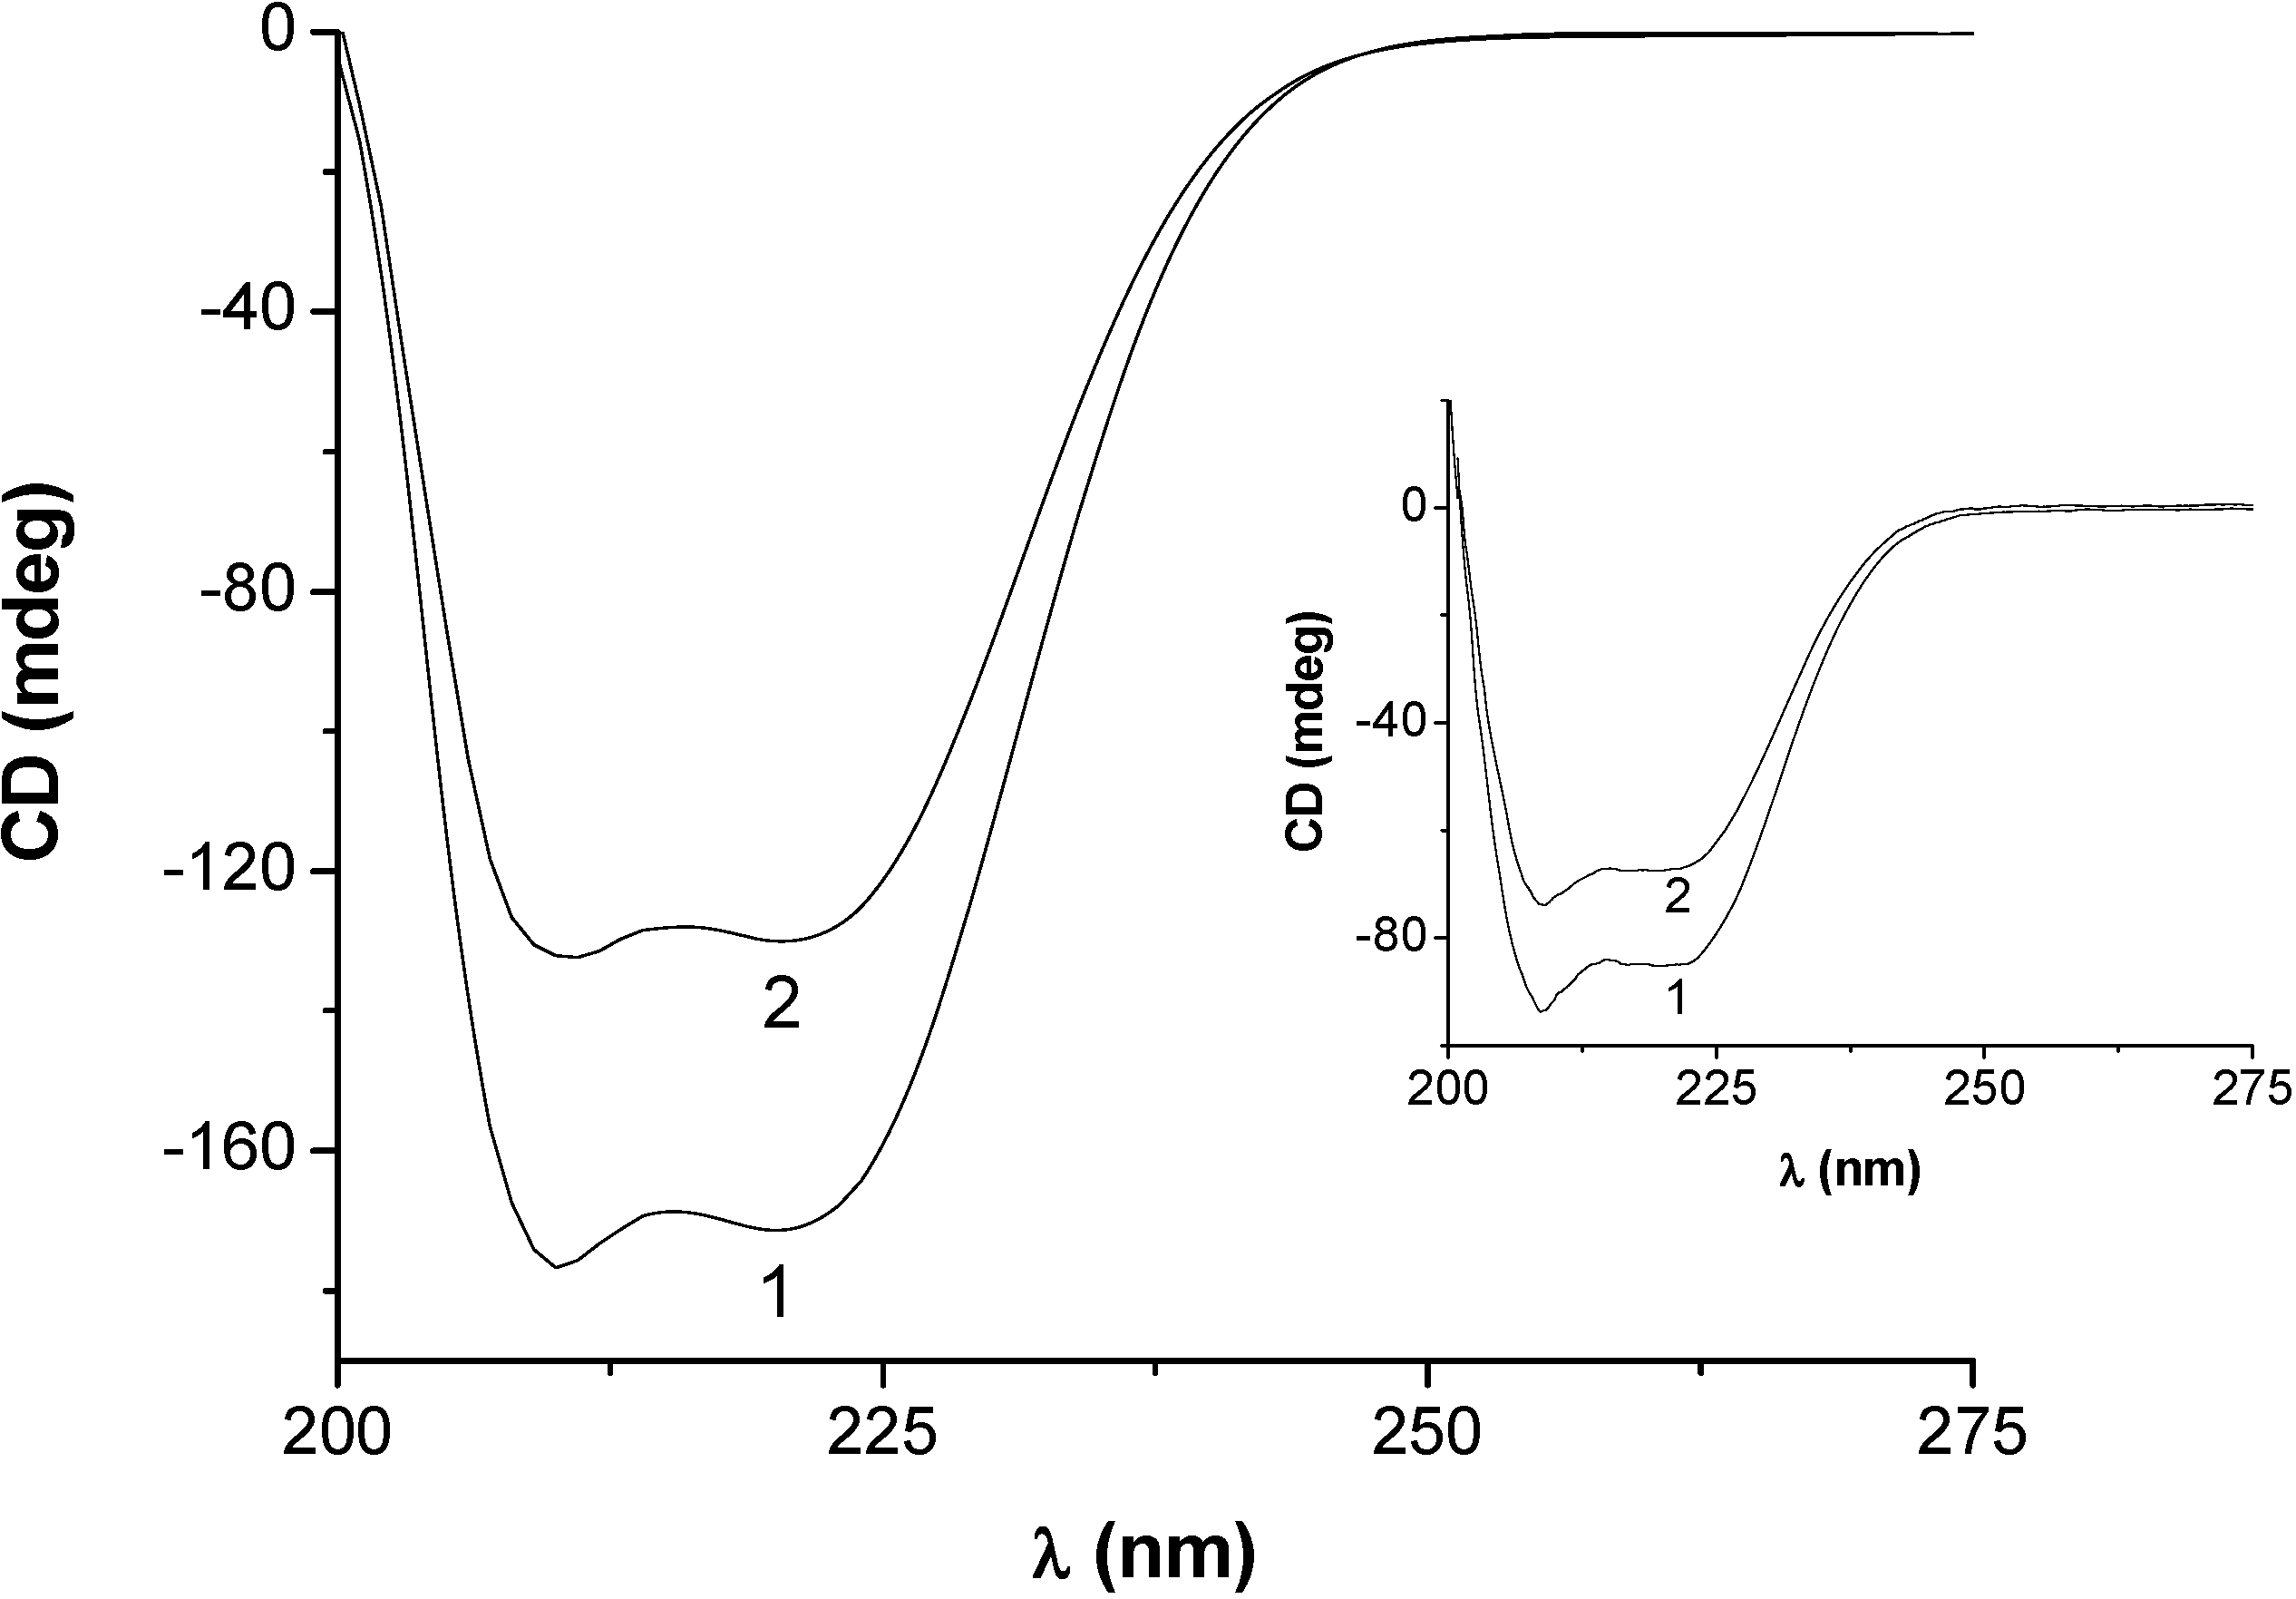
2.3.2. Circular dichroism results


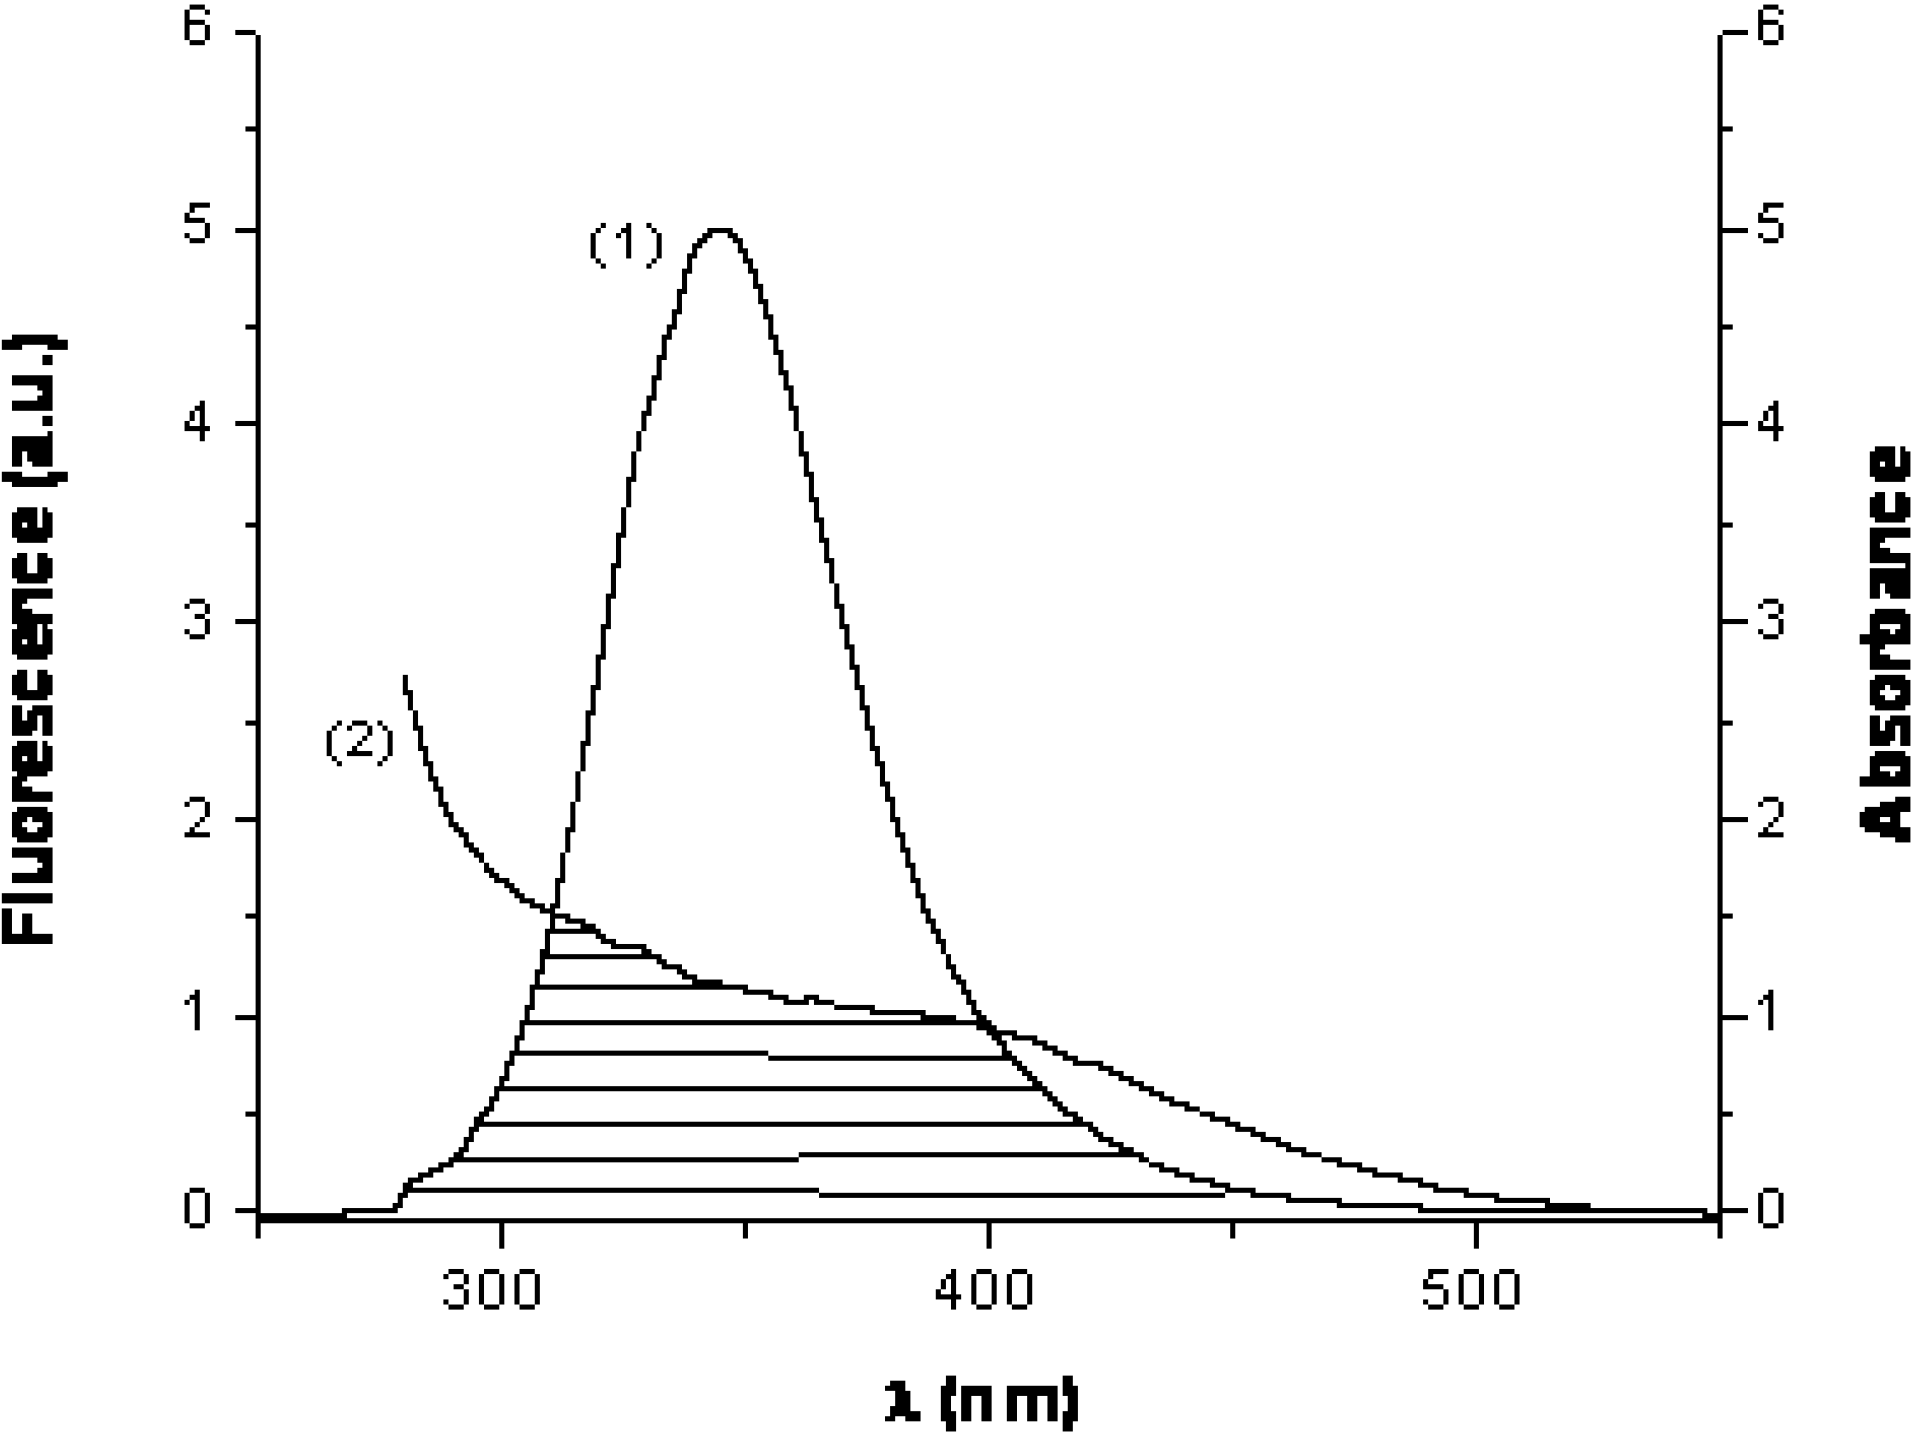
2.4. Energy transfer efficiency and binding distance


| E | J × 1015 (M-1cm3) | R0 (nm) | r (nm) | |
|---|---|---|---|---|
| HSA | 0.16 | 1.48 | 1.78 | 2.34 |
| BSA | 0.18 | 1.51 | 1.79 | 2.31 |
3. Experimental
3.1. General
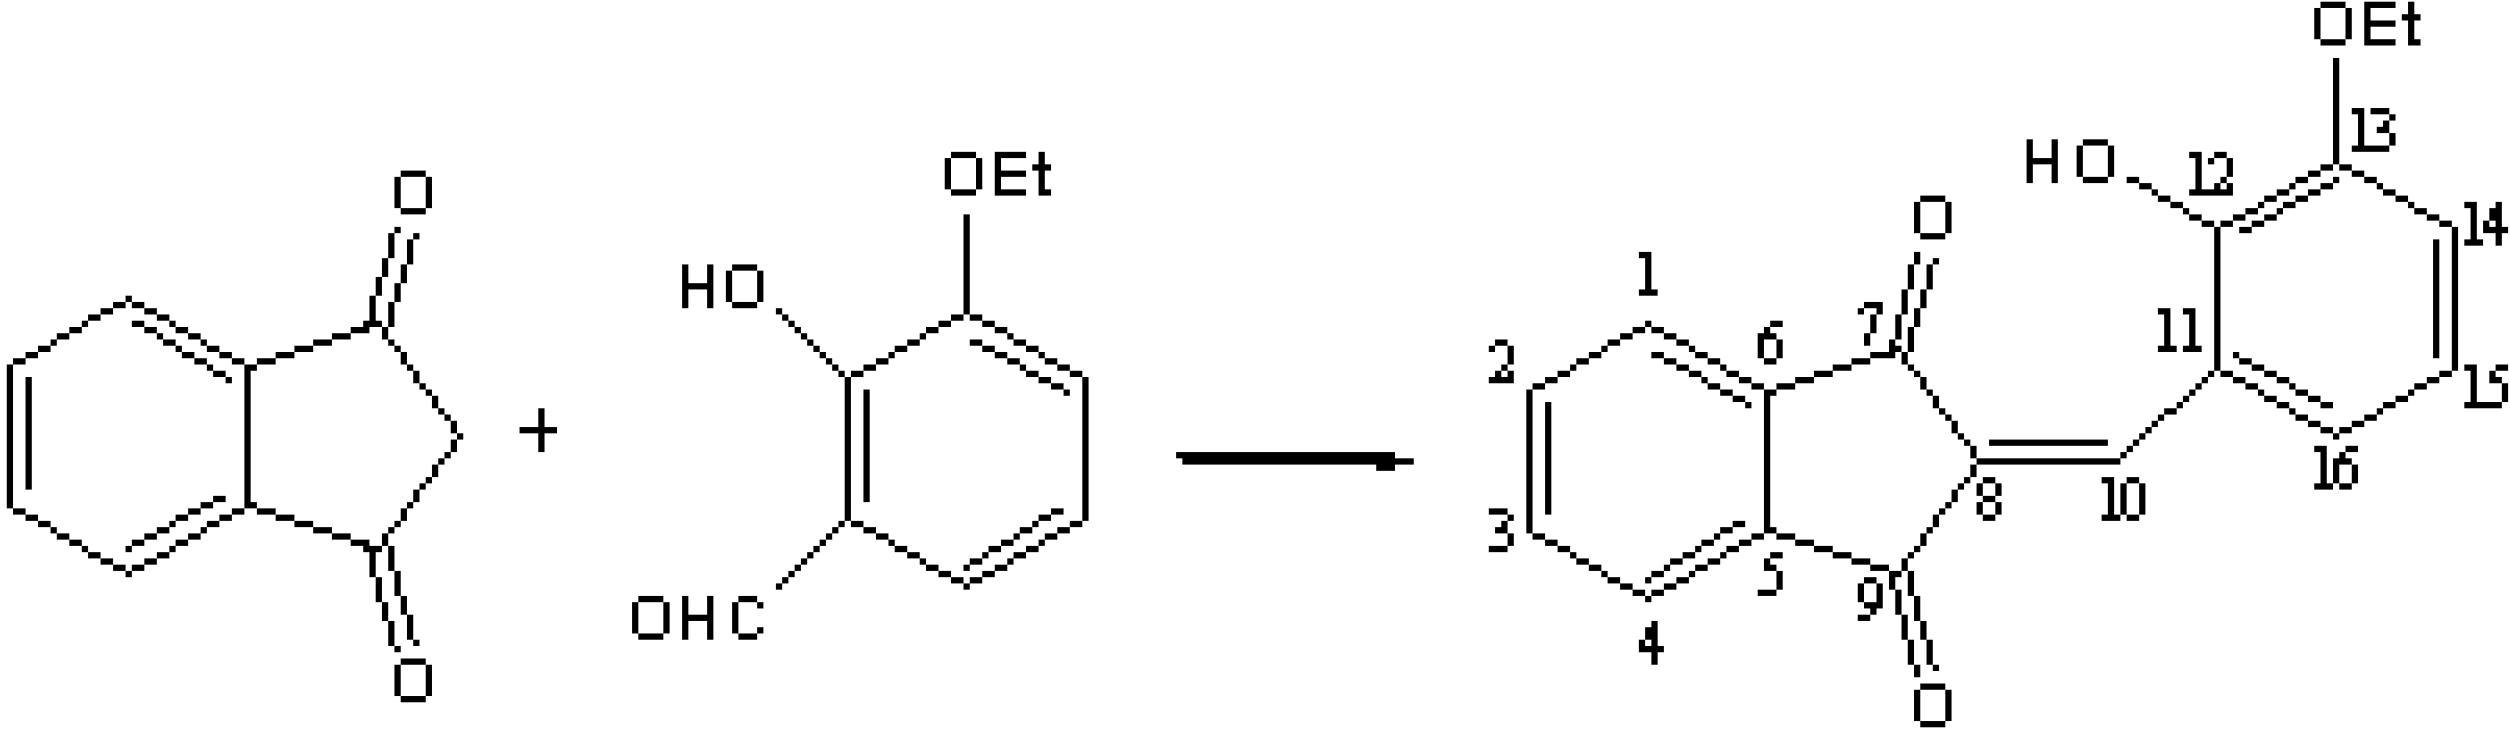
3.2. Synthesis

3.3. Procedures
4. Conclusions
References
- Petitpas, I.; Bhattacharya, A.; Twine, S.; East, M.; Curry, S. Crystal Structure Analysis of Warfarin Binding to Human Serum Albumin: Anatomy of drug site I. J. Biol. Chem. 2001, 276, 22804–22809. [Google Scholar]
- Peters, T. All about Albumin: Biochemistry, Genetics, and Medical Applications; Academic Press: San Diego, CA, USA, 1996. [Google Scholar]
- He, X.M.; Carter, D.C. Atomic Structure and Chemistry of Human Serum Albumin. Nature 1992, 358, 209–215. [Google Scholar] [CrossRef]
- Sudlow, G.; Birkett, D.J.; Wade, D.N. The Characterization of Two Specific Drug Binding Sites on Human Serum Albumin. Mol. Pharmacol. 1975, 11, 824–832. [Google Scholar]
- Kragh-Hansen, U.; Chuang, V.T.G.; Otagiri, M. Practical Aspects of the Ligand-Binding and Enzymatic Properties of Human Serum Albumin. Biol. Pharm. Bull. 2002, 25, 695–704. [Google Scholar] [CrossRef]
- Moriyama, Y.; Ohta, D.; Hachiya, K.; Mitsui, Y.; Takeda, K. Fluorescence Behavior of Tryptophan Residues of Bovine and Human Serum Albumins in Ionic Surfactant Solutions: A Comparative Study of the Two and One Tryptophan(s) of Bovine and Human Albumins. J. Protein Chem. 1996, 15, 265–271. [Google Scholar] [CrossRef]
- Hall, I.; Wong, O.; Chi, L.; Chen, S. Cytotoxicity and Mode of Action of Substituted Indan-1,3-diones in Murine and Human Tissue Cultured Cells. Anticancer Res. 1994, 14, 2053–2058. [Google Scholar]
- Le Baut, G.; Loire, S.; Sparfel, L.; Creuzet, M.; Feniou, C; Pontagnier, H.; Prat, G. N-substituted 2-aminomethylene-1,3-indanediones for treating arterial hypertension and spasmodic conditions. US Patent 4758561, 1984. [Chem. Abstr. 1986, 105.]. [Google Scholar]
- Salama, M.A.; Yousif, M.N.; Hammam, A.G. Syntesis and reactions of 4,5-diaryl-2- mercaptoimidazoles. Pol. J. Chem. 1988, 35, 83–88. [Google Scholar]
- De Winter, M.L.; Nauta, W.T. Pharmacochemistry of 2-diarylmethyl-1,3-indandiones. I. Synthesis. Eur. J. Med. Chem. 1977, 12, 125–130. [Google Scholar]
- Van Der Goot, H.; Eriks, J.C. Substituted benzamides as anti-inflammatory agents. Eur. J. Med. Chem. 1978, 13, 425–428. [Google Scholar]
- Kubovic, M.; Prazic, M.; Atanackovic, D. Analgetic Property of Vitamin K. Proc. Soc. Exp. Biol. Med. 1955, 90, 660–662. [Google Scholar] [CrossRef]
- Gori, E. Antibacterial activity of Coumarin and Indandione Compounds. In The first international conference on Thrombosis and Embolism, Basel, Switzerland, 1954; pp. 271–274.
- Blumberg, H.; Dayton, H.B.; Gordon, S.M. Bronchodilator Action of the Anticoagulant Warfarin Sodium. Science 1958, 127, 188. [Google Scholar]
- Zalukaev, L.P.; Kozyreva, O.V. Allosteric Effects in the Mechanism of Action of Derivatives of Indane-1,3-dione on Proteins. Pharm. Chem. J. 1979, 13, 1126–1128. [Google Scholar] [CrossRef]
- Esmann, M.; Sar, P.C.; Hideg, K.; Marsh, D. Maleimide, Iodoacetamide, Indanedione, and Chloromercuric Spin Label Reagents with Derivatized Nitroxide Rings as ESR Reporter Groups for Protein Conformation and Dynamic. Analyt. Biochem. 1993, 213, 336–348. [Google Scholar] [CrossRef]
- Drochioiu, G.; Murariu, M.; Mangalagiu, I.; Druta, I. Highly Selective Assay of Proteins in Dilute Solutions. Talanta 2002, 56, 425–433. [Google Scholar] [CrossRef]
- Zhao, H.; Su, W.; Luo, Y.H.; Ji, Y.H.; Li, Z.C.; Jiu, H.F.; Liang, H.; Chen, B.; Zhang, Q.J. Rectification of excitation with bathochromic shift induced by intense absorption of organic ligands during emission. Spectrochim. Acta A 2006, 65, 846–851. [Google Scholar] [CrossRef]
- Subbiah, D.; Ashok, K.M. Fluorescence Spectroscopic Study of Serum Albumin-Bromadiolone Interaction: Fluorimetric Determination of Bromadiolone. J. Pharm. Biomed. Anal. 2005, 38, 556–563. [Google Scholar] [CrossRef]
- Hirshfield, K.M.; Toptygin, D.; Grandhige, G.; Kim, H.; Packard, B.Z.; Brand, L. Steady-state and Time-resolved Fluorescence Measurements for Studying Molecular Interactions: Interaction of a Calcium-Binding Probe with Proteins. Biophys. Chem. 1996, 62, 25–38. [Google Scholar] [CrossRef]
- Richieri, G.V.; Anel, A.; Kleinfeld, A.M. Interaction of Long Chain Fatty Acids and Albumin: Determination of Free Fatty Acid Levels Using the Fluorescent Probe ADIFAB. Biochemistry 1993, 32, 7574–7580. [Google Scholar] [CrossRef]
- Olson, M.K.; Hollingworth, S.; Baylor, S.M. Myoplasmic Binding of Fura-2 Investigated by Steady-State Fluorescence and Absorbance Measurements. Biophys. J. 1988, 54, 1089–1104. [Google Scholar] [CrossRef]
- Rolinski, O.J.; Martin, A.; Birch, D.J.S. Human Serum Albumin and Quercetin Interactions Monitored by Time-Resolved Fluorescence: Evidence for Enhanced Discrete Rotamer Conformations. J. Biomed. Opt. 2007, 12, 0340131–0340137. [Google Scholar]
- Zhang, G.W.; Wang, A.P.; Jiang, T.; Guo, J.B. Interaction of the Irisflorentin with Bovine Serum Albumin: A Fluorescence Quenching Study. J. Mol. Struct. 2008, 891, 93–97. [Google Scholar] [CrossRef]
- Lakowicz, J.R. Fluorescence Quenching: Theory and Applications. In Principles of Fluorescence Spectroscopy; Kluwer Academic/Plenum Publishers: New York, NY, USA, 1999; pp. 53–127. [Google Scholar]
- Scatchard, G. The Attraction of Proteins for Small Molecules and Ions. Ann. N.Y. Acad. Sci. 1949, 51, 660–672. [Google Scholar] [CrossRef]
- Bi, S.Y.; Ding, L.; Tian, Y.; Song, D.Q.; Zhou, X.; Liu, X.; Zhang, H.Q. Investigation of the Interaction Between Flavonoids and Human Serum Albumin. J. Mol. Struct. 2004, 703, 37–45. [Google Scholar] [CrossRef]
- Wang, Y.Q.; Zhang, H.M.; Zhang, G.C.; Tao, W.H.; Tang, S.H. Interaction of the Flavonoid Hesperidin with Bovine Serum Albumin: A Fluorescence Quenching Study. J. Lumin. 2007, 126, 211–218. [Google Scholar] [CrossRef]
- Feng, X.Z.; Lin, Z.; Yang, L.J.; Wang, C.; Bai, C.L. Investigation of the Interaction Between Acridine Orange and Bovine Serum Albumin. Talanta 1998, 47, 1223–1229. [Google Scholar] [CrossRef]
- Kandagal, P.B.; Ashoka, S.; Seetharamappa, J.; Shaikh, S.M.T.; Jadegoud, Y.; Ijare, O.B. Study of the Interaction of an Anticancer Drug with Human and Bovine Serum Albumin: Spectroscopic Approach. J. Pharm. Biomed. Anal. 2006, 41, 393–399. [Google Scholar] [CrossRef]
- Li, Y.Q.; Huang, X.Z.; Xu, J.G. Synchronous Fluorescence Spectrometric Methodology in the Wavelength Domain. J. Fluoresc. 1999, 9, 173–179. [Google Scholar] [CrossRef]
- Xu, Y.Q.; Liu, Q.; Wen, Y. Spectroscopic Studies on the Interaction Between Nicotinamide and Bovine Serum Albumin. Spectrochim. Acta A 2008, 71, 984–988. [Google Scholar] [CrossRef]
- Khan, M.A.; Muzammil, S.; Musarrat, J. Differential Binding of Tetracyclines with Serum Albumin and Induced Structure Alterations in Drug-Bound Protein. Int. J. Biol. Macromol. 2002, 30, 243–249. [Google Scholar] [CrossRef]
- Gao, H.; Lei, L.D.; Liu, J.Q.; Kong, Q.; Chen, X.G.; Hu, Z.D. The Study on the Interaction Between Human Serum Albumin and a New Reagent with Antitumour Activity by Spectrophotometric Methods. J. Photochem. Photobiol. A: Chem. 2004, 167, 213–221. [Google Scholar] [CrossRef]
- Lu, Z.X.; Cui, T.; Shi, Q.L. Applications of Circular Dichroism (CD) and Optical Rotatory Dispersion (ORD). In Molecular Biology; Science Press: Beijing, China, 1987. [Google Scholar]
- Peter, T. Serum albumin. Adv. Protein Chem. 1995, 37, 161–245. [Google Scholar] [CrossRef]
- Förster, T.; Sinanoglu, O. Modern Quantum Chemistry.; Academic Press: New York, NY, USA, 1966; p. 93. [Google Scholar]
- Bi, S.Y.; Song, D.Q.; Tian, Y.; Zhou, X.; Liu, Z.; Zhang, H.Q. Molecular Spectroscopic Study on the Interaction of Tetracyclines with Serum Albumins. Spectrochim. Acta A. 2005, 61, 629–636. [Google Scholar] [CrossRef]
- Yang, M.M.; Yang, P.; Zhang, L.W. Study on interaction of caffeic acid series medicine and albumin by fluorescence method. Chin. Sci. Bull. 1994, 39, 31. [Google Scholar]
- Hu, Y.J.; Liu, Y.; Zhang, L.X. Study of Interaction Between Colchicines and Bovine Serum Albumin by Fluorescence Quenching Method. J. Mol. Struct. 2005, 750, 174–178. [Google Scholar] [CrossRef]
- He, W.Y.; Li, Y.; Xue, C.X.; Hu, Z.D.; Chen, X.G.; Sheng, F.L. Effect of Chinese Medicine Alpinetin on the Structure of Human Serum Albumin. Bioorg. Med. Chem. 2005, 13, 1837–1845. [Google Scholar] [CrossRef]
- Boudriga, S.; Askri, M.; Rammah, M.; Monnier-Job, K. 1,3-Dipolar cycloadditions of arylcarbonitrile oxides and diaryl nitrilimines with some 2-arylmethylene-1,3-indanediones; regiochemistry of the reactions. J. Chem. Res. 2003, 4, 204–207. [Google Scholar]
- Kanakis, C.D.; Tarantilis, P.A.; Polissiou, M.G.; Diamantoglou, S.; Tajmir-Riahi, H.A. Antioxidant Flavonoids Bind Human Serum Albumin. J. Mol. Struct. 2006, 798, 69–74. [Google Scholar] [CrossRef]
- Sample Availability: Samples of the compound are available from the authors.
© 2009 by the authors; licensee Molecular Diversity Preservation International, Basel, Switzerland. This article is an open-access article distributed under the terms and conditions of the Creative Commons Attribution license ( http://creativecommons.org/licenses/by/3.0/).
Share and Cite
Stan, D.; Matei, I.; Mihailescu, C.; Savin, M.; Matache, M.; Hillebrand, M.; Baciu, I. Spectroscopic Investigations of the Binding Interaction of a New Indanedione Derivative with Human and Bovine Serum Albumins. Molecules 2009, 14, 1614-1626. https://doi.org/10.3390/molecules14041614
Stan D, Matei I, Mihailescu C, Savin M, Matache M, Hillebrand M, Baciu I. Spectroscopic Investigations of the Binding Interaction of a New Indanedione Derivative with Human and Bovine Serum Albumins. Molecules. 2009; 14(4):1614-1626. https://doi.org/10.3390/molecules14041614
Chicago/Turabian StyleStan, Dana, Iulia Matei, Carmen Mihailescu, Mihaela Savin, Mihaela Matache, Mihaela Hillebrand, and Ion Baciu. 2009. "Spectroscopic Investigations of the Binding Interaction of a New Indanedione Derivative with Human and Bovine Serum Albumins" Molecules 14, no. 4: 1614-1626. https://doi.org/10.3390/molecules14041614