Determination of Proton Relaxivities of Mn(II), Cu(II) and Cr(III) added to Solutions of Serum Proteins

Abstract
:Introduction
Results and Discussion


| Ions | Albumin | α-globulin | γ-globulin | Lysozyme | Fibrinogen | Water |
|---|---|---|---|---|---|---|
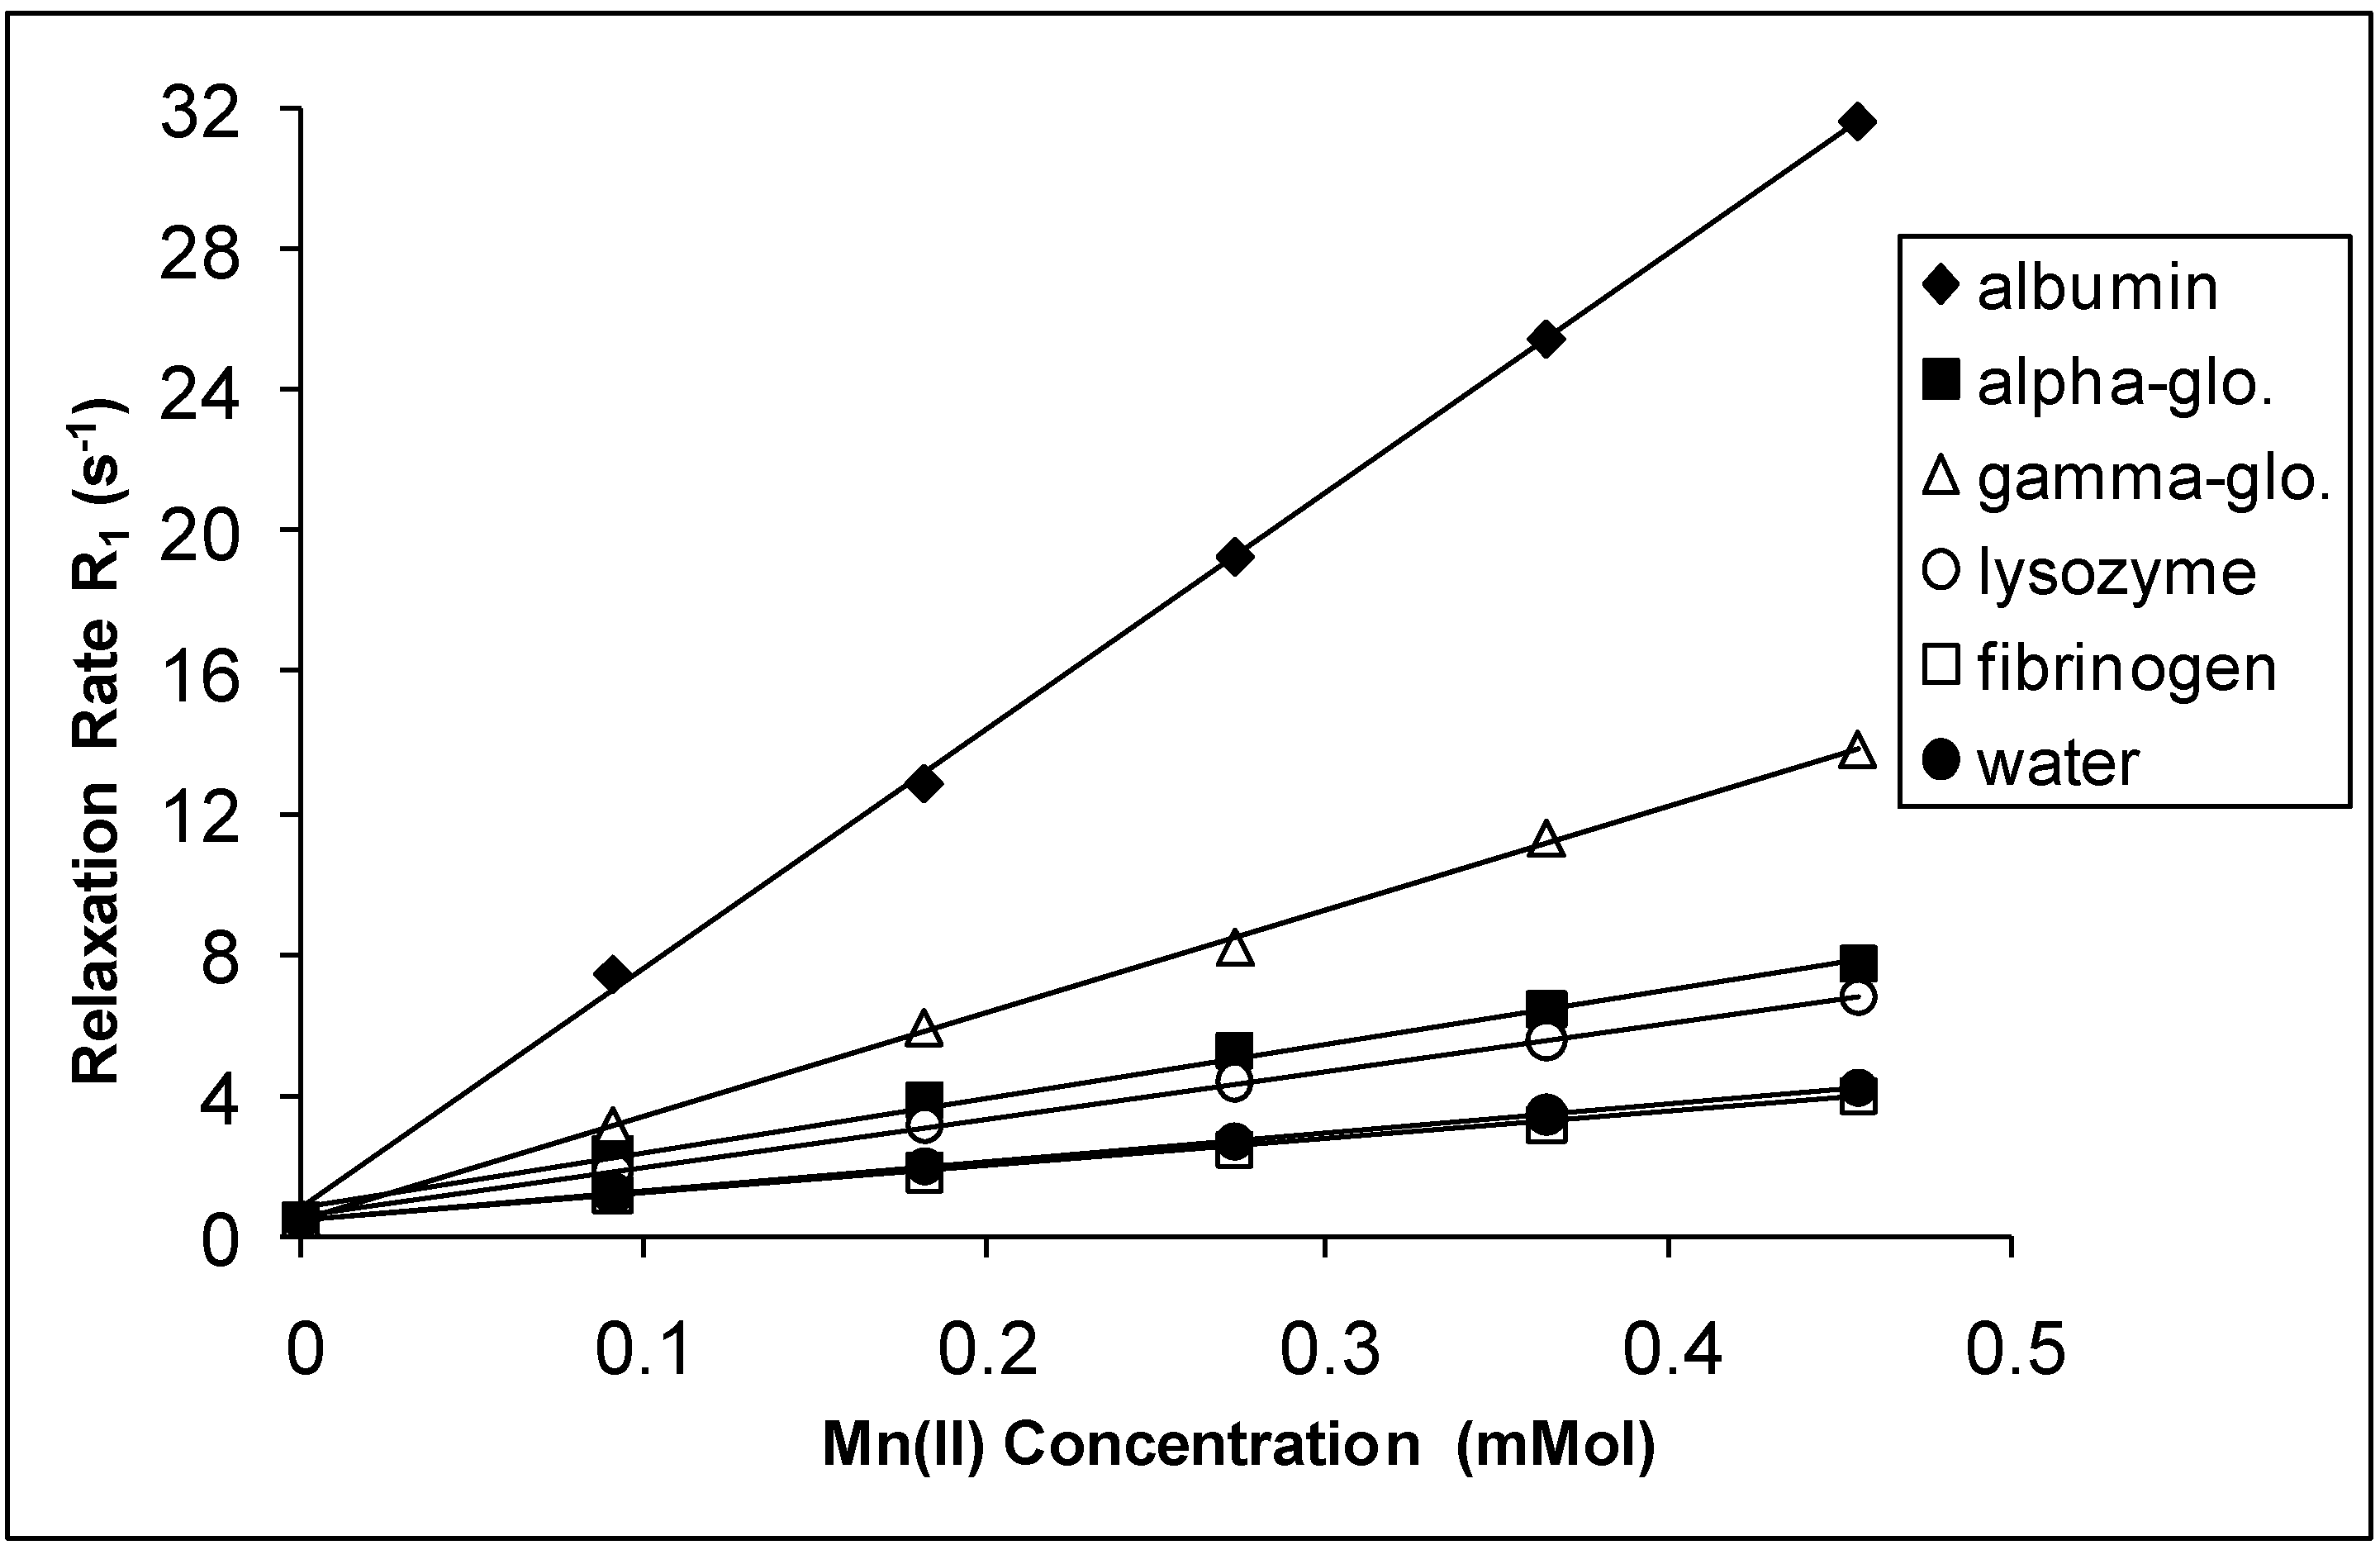
| Mn(II) | 67,91 | 29,40 | 15,61 | 13,73 | 7,66 | 8,14 |
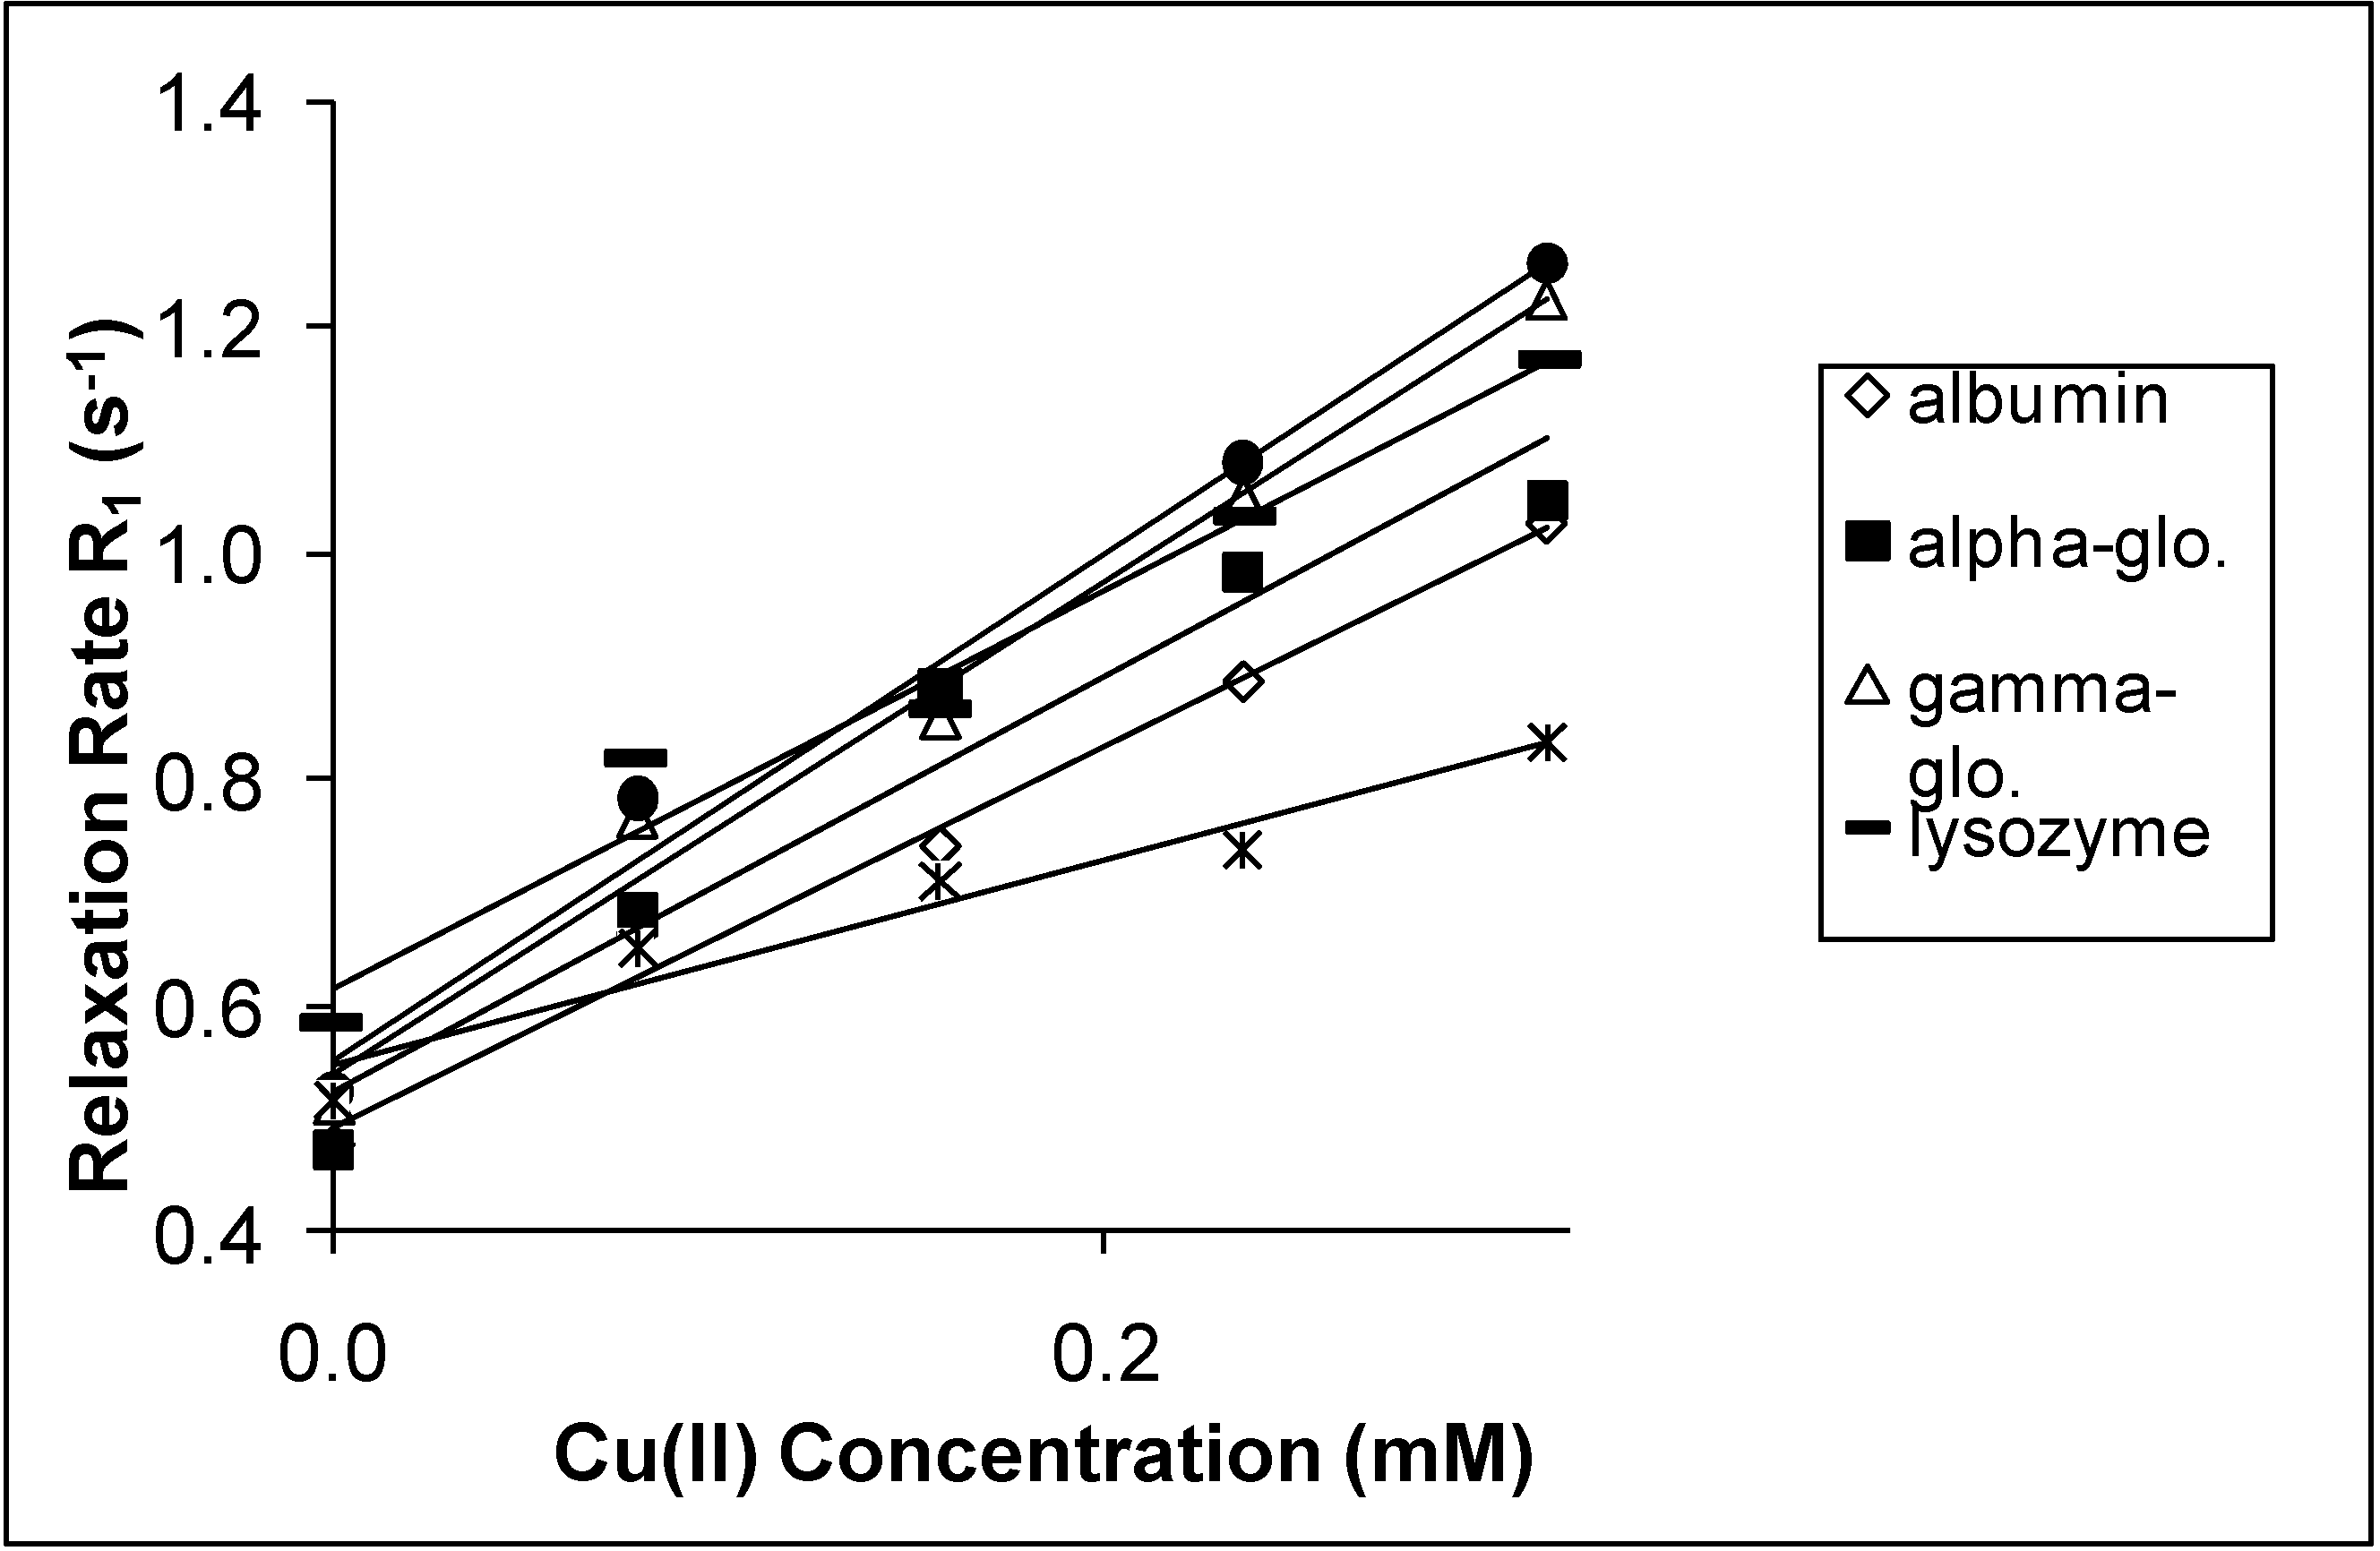
| Cu(II) | 1,68 | 1,84 | 2,18 | 1,76 | 2,24 | 0,90 |
| Cr(III) | 2,27 | 0,68 | 1,38 | 0,93 | 0,61 | 5.81 |
| Ions | Albumin | α-globulin | γ-globulin | Lysozyme | Fibrinogen | Water |
|---|---|---|---|---|---|---|
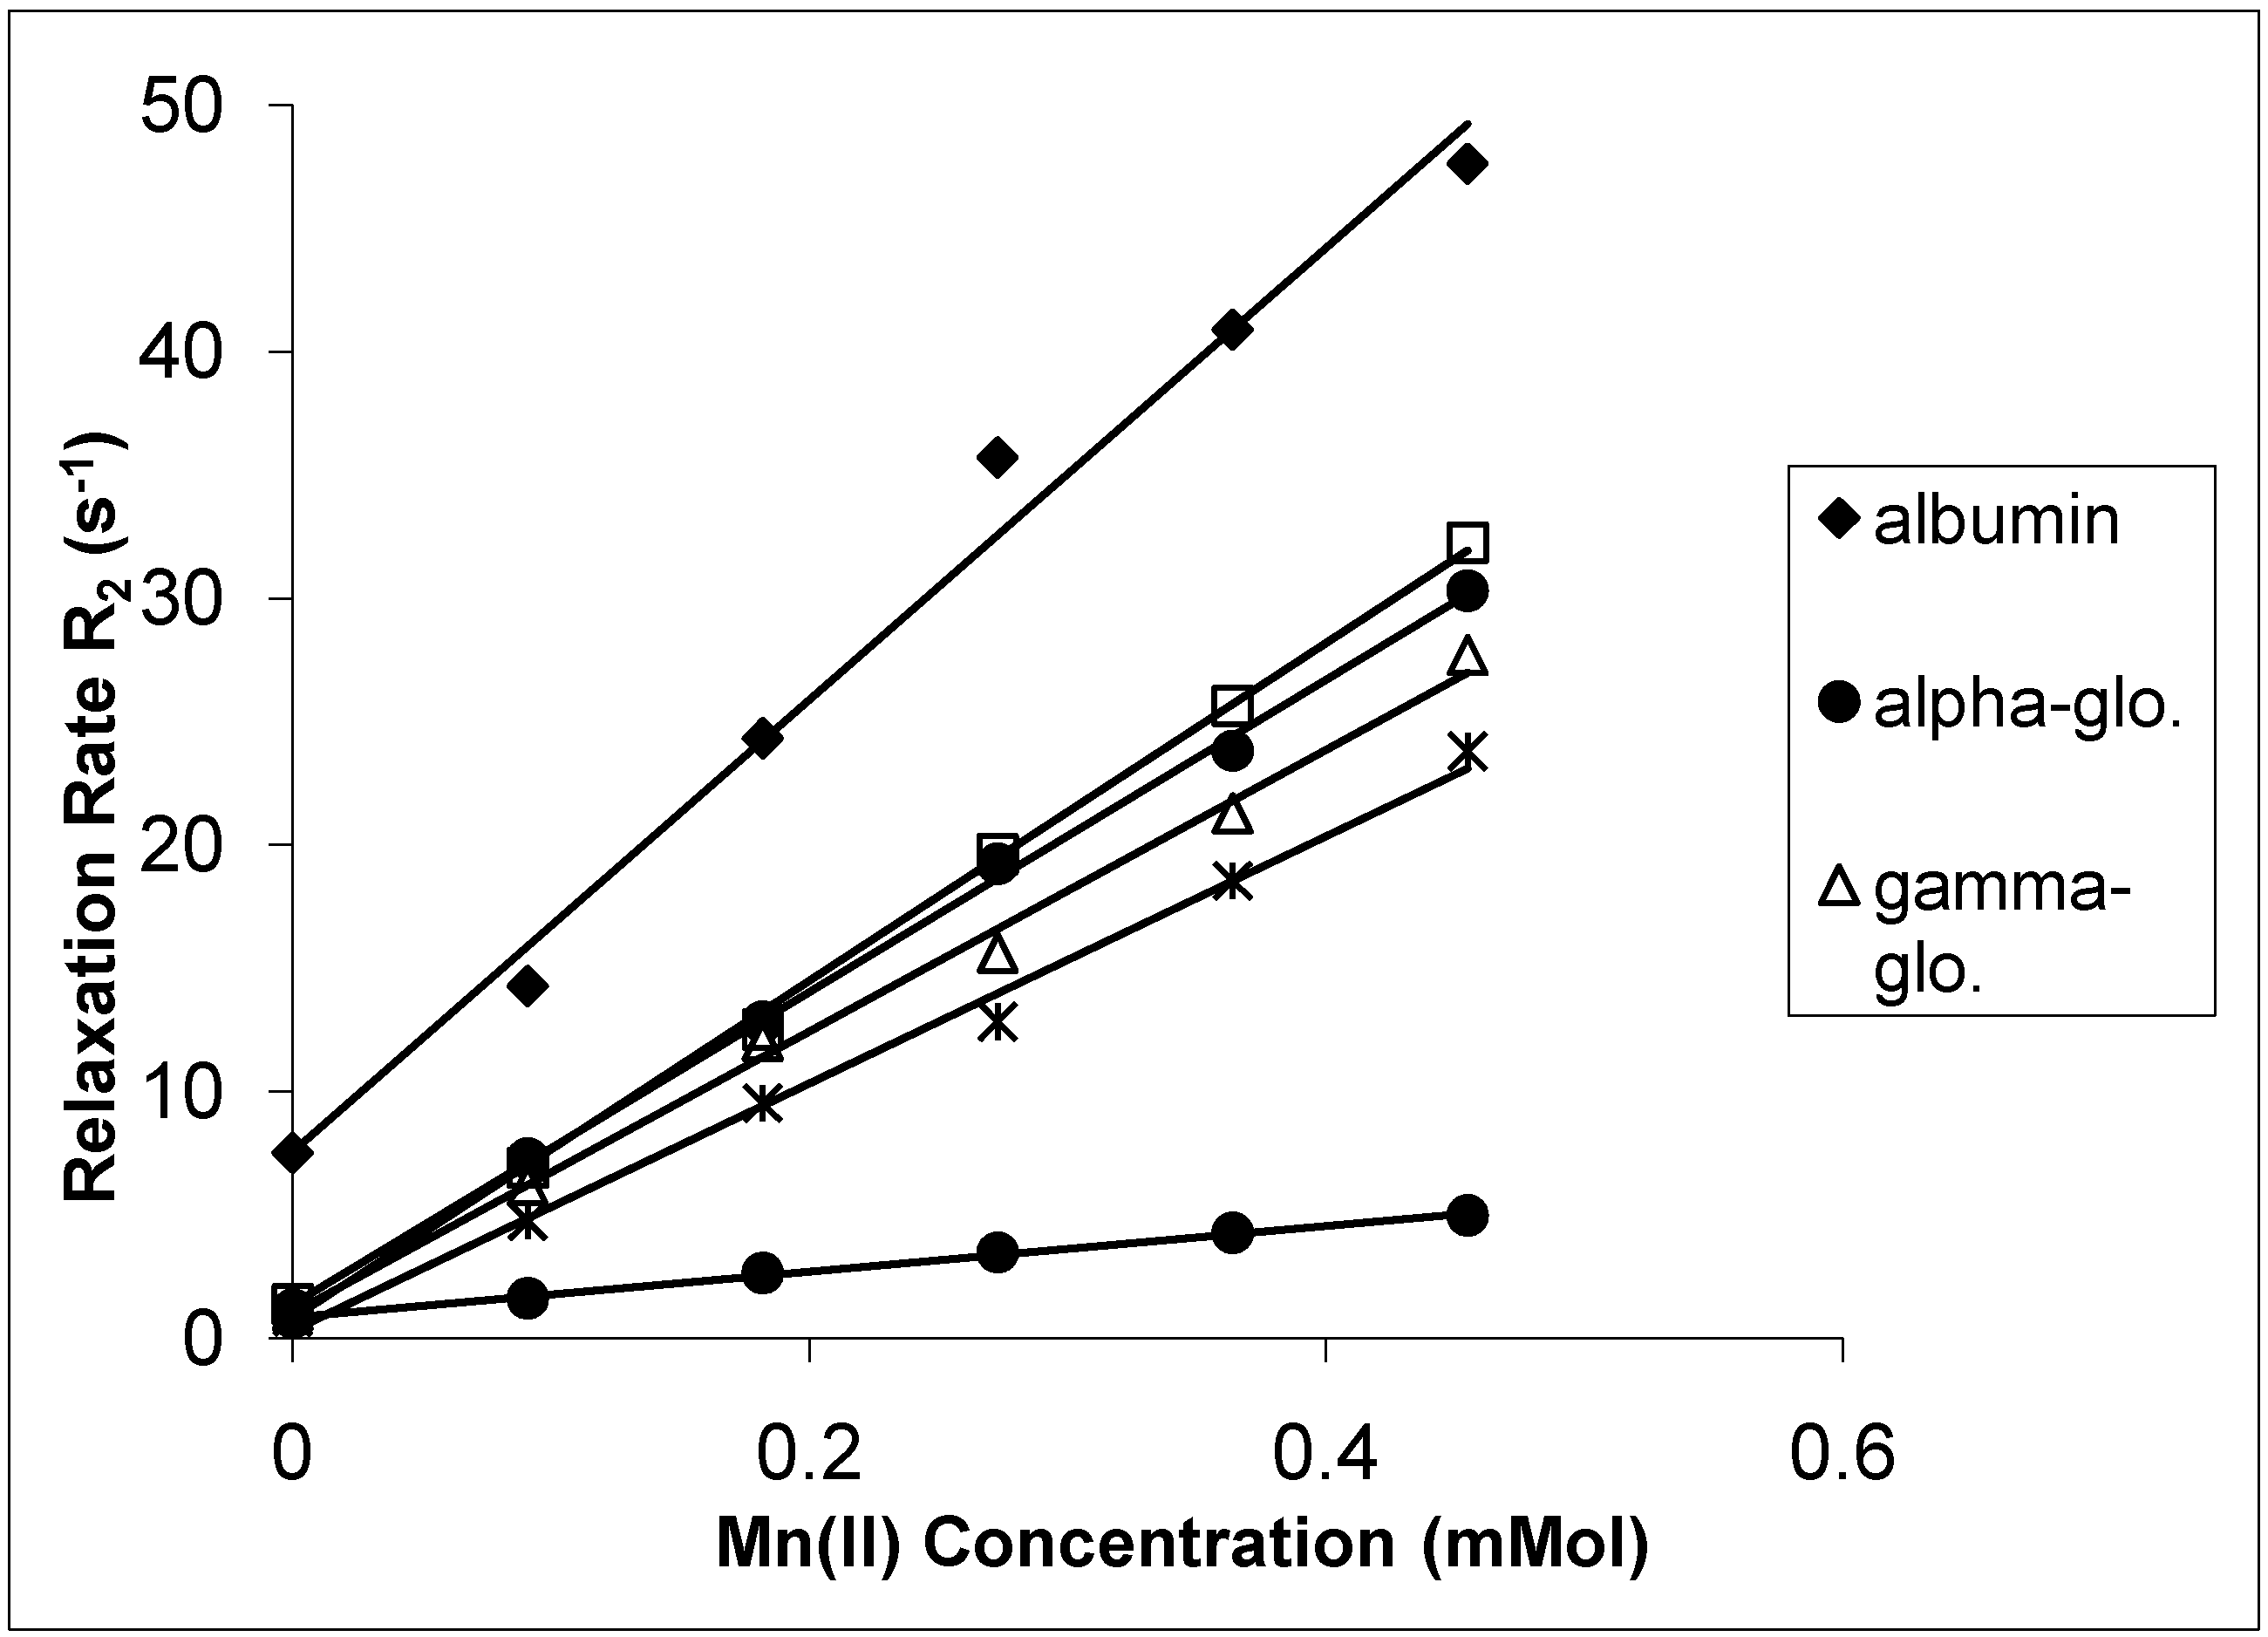
| Mn(II) | 91,56 | 57,05 | 63,31 | 68,40 | 50,07 | 9,28 |
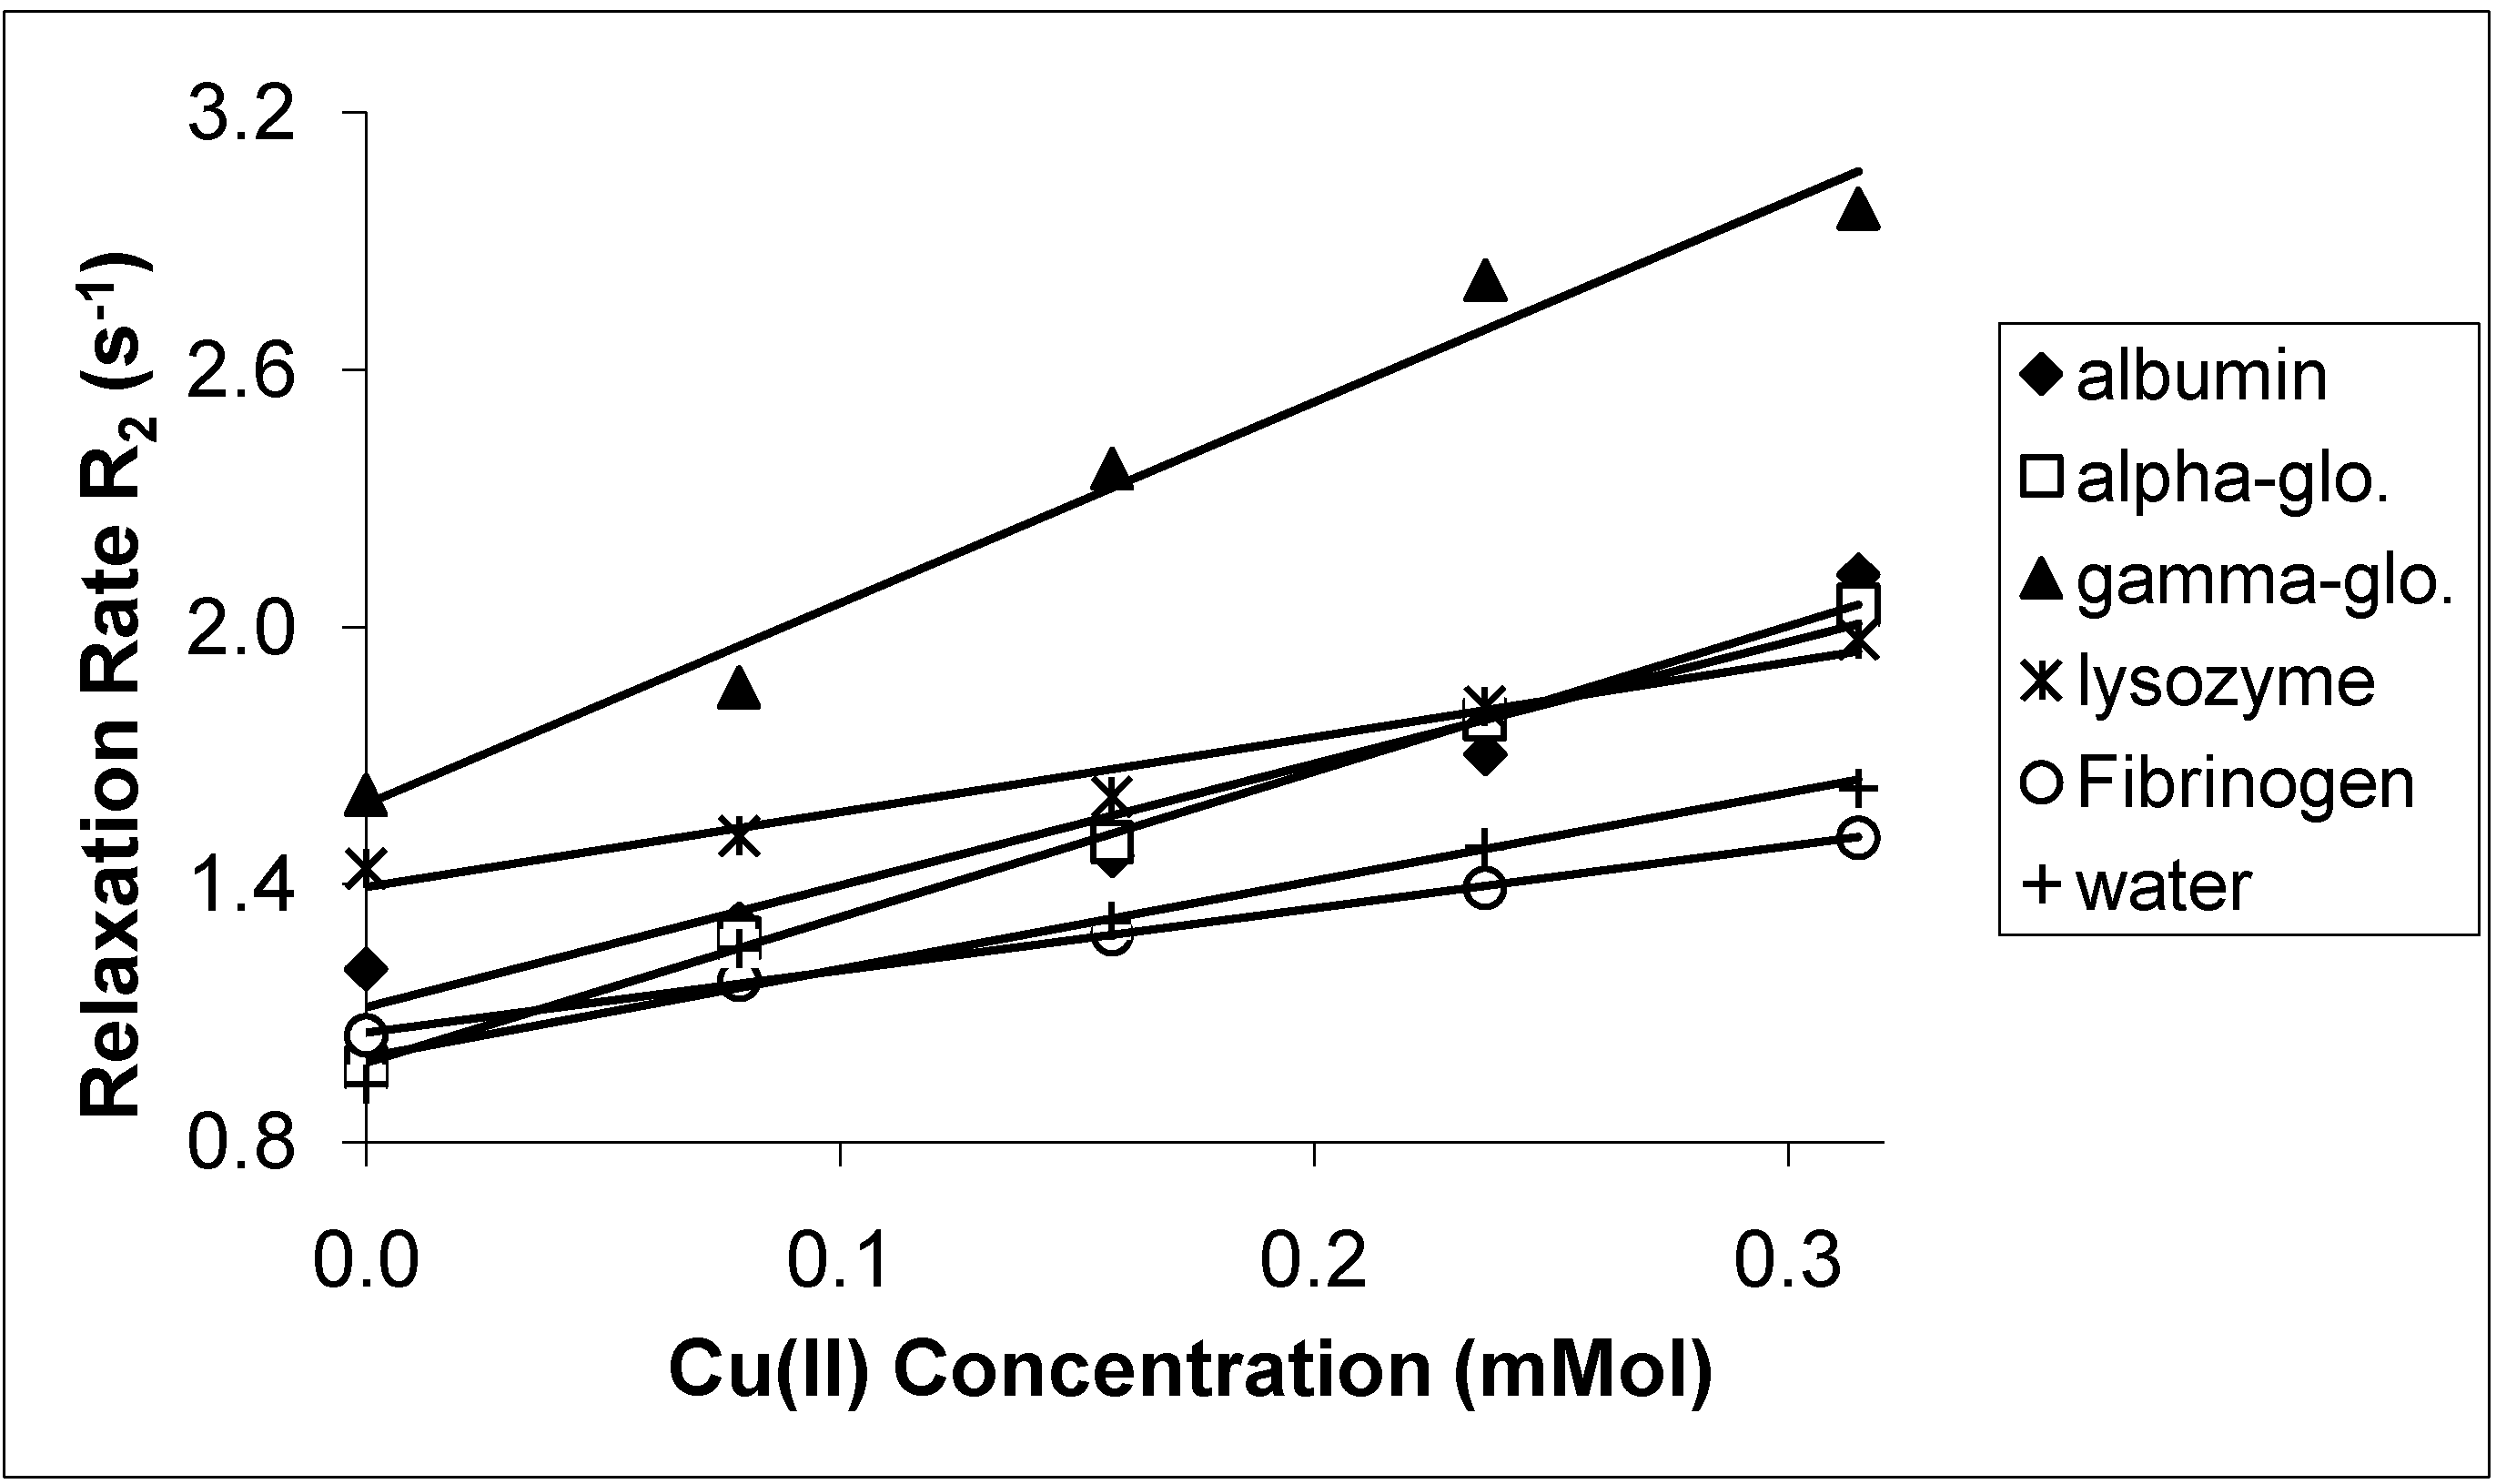
| Cu(II) | 2,84 | 4,68 | 3,39 | 1,75 | 1,45 | 2,05 |
| Cr(III) | 3,58 | 1,51 | 1,92 | 0,95 | 1,24 | 6,08 |


 and the second term in Eq. 2b or C represents the contact interaction. The term given in Eq. 2a and the first term in Eq. 2b arise from the dipole-dipole interaction between the electron spin S and the nuclear spin I, characterized by an effective correlation time τ, and the second term in Eq. 2b arises from modulation of the contact interaction characterized by a correlation time τe and a coupling constant A [23]. ωI and r are the nuclear Larmor precession frequency and the ion-proton interatomic distance, respectively. The constants γI, g, β and ħ follow the usual notation. Both dipolar and scalar interactions may be modulated by the rotation of aquo-complex (τr), life time of water molecule on the complex (τm), longitudinal electron spin relaxation (τs = T1E) and transverse electronic relaxation time T2E. The Eq. 2 is also valid for bound spheres. However, the correlation times are significantly changed upon binding of the ion to protein. This is the source of the increased relaxivity or enhanced relaxation in protein solutions containing added ion. Eq. 2 was particularly written for Manganese ions [23]. According to Eq. 2, T1 is caused by dipolar interactions, but T2 takes a contribution from contact interaction, too. The binding of an ion to protein can be evaluated from the following equation [24,25]:

| Mn(II) | Cu(II) | Cr(II) | |
|---|---|---|---|
| albumin | 8.6 | 1.6 | 0.4 |
| α-globulin | 3.6 | 2.0 | 0.1 |
| γ-globulin | 2.2 | 2.1 | 0.2 |
| lysozyme | 1.8 | 1.8 | 0.2 |
| fibrinogen | 0.9 | 2.2 | 0.1 |
Conclusions
Experimental
Samples
Measurements
Acknowledgments
References
- Morgan, L.O.; Nolle, A.W. Proton Spin Relaxation in Aqueous Solutions of Paramagnetic Ions. II. Cr+++, Mn++, Ni++, Cu++, Gd+++. J. Chem. Phys. 1959, 31, 365–368. [Google Scholar] [CrossRef]
- Lanir, A.; Gradstaein, S.; Navon, G. Temperature and Frequency Dependence of Solvent Proton Relaxation Rates in Solutions of Manganese(II) Carbonic Anhydrase. Biochemistry 1975, 14, 242–248. [Google Scholar] [CrossRef]
- Koenig, S.H.; Brown, R.D., III. Relaxation of Solvent Protons by Paramagnetic Ions and its Dependence on Magnetic Field and Chemical Environment: Implications for NMR Imaging. Magnet. Reson. Med. 1984, 1, 478–495. [Google Scholar] [CrossRef]
- Barnhart, J.I.; Berk, R.N. Influence of Paramagnetic Ions and and pH on Proton NMR Relaxation of Biologic Fluids. Invest Radiol. 1986, 21, 132–136. [Google Scholar] [CrossRef]
- Koenig, S.H.; Brown, R.D., III; Spiller, M. The Anomalous relaxivity of Mn3+ (TPPS4). Magnet. Reson. Med. 1987, 4, 252–260. [Google Scholar] [CrossRef]
- Schneiders, N.J. Solutions of two paramagnetic ions for use in nuclear magnetic resonance phantoms. Med. Phys. 1988, 15, 12–16. [Google Scholar] [CrossRef]
- Rimbert, J.N.; Dumas, F.; Lafargue, C.; et al. Spectroscopic Techniques (Mossbauer Spectrometry, NMR, ESR,…) as Tools to Resolve Doubtful NMR Images-Study of The Craniopharyngioma Tumor. Hyperfine Interact. 1990, 58, 2387–2392. [Google Scholar] [CrossRef]
- Pescia, J.; Misra, S.K.; Zaripov, M.; Servant, Y. Spin-lattice relaxation in the polymer resin poly-4-vinylpyridine doped with transition ions Cu2+, Cr3+, Mn2+, and Gd3+ possessing weak spin-orbit coupling. Phys. Rev. B. 1998, 59, 9442–9446. [Google Scholar]
- Aime, S.; Canton, S.; Crich, S.G.; Terreno, E. 1H and 17O relaxometric investigations of the binding of Mn(II) ion to human serum albumin. Magn. Reson. Chem. 2002, 40, 41–48. [Google Scholar] [CrossRef]
- Kruk, D.; Kowalewski, J. Field-dependent proton relaxation in aqueous solutions of some manganese (III) complexes: a new interpretation. J. Biol. Inorg. Chem. 2003, 8, 512–518. [Google Scholar]
- Bertini, I.; Luchinat, C.; Parigi, G.; Pierattelli, R. NMR Spectroscopy of Paramagnetic Metalloproteins. Chem. Bio. Chem. 2005, 6, 1536–1549. [Google Scholar] [CrossRef]
- Keating, K.; Knight, R. A Laboratory Study to Determine the Effect of Iron Oxides on Proton NMR Measurements. Geophysics. 2007, 72, E27–E32. [Google Scholar] [CrossRef]
- Reuben, J.; Cohn, M. Magnetic Resonance Studies of Manganese (II) Binding Sites of Pyruvate Kinase. J. Biol. Chem. 1970, 245, 6539–6546. [Google Scholar]
- Kang, Y.S.; Gore, J.C.; Armitage, I.M. Studies of Factors Affecting the Design of NMR Contrast Agents: Manganese in Blood as a Model System. Magnet. Reson. Med. 1983, 1, 396–409. [Google Scholar]
- Fornasiero, D.; Bellen, J.C.; Baker, R.J.; Chatterton, B.E. Paramagnetic Complexes of Manganese(II), Iron(III), and Gadolinium(III) as Contrast Agents for Magnetic Resonance Imaging. The Influence of Stability Constants on the Biodistribution of Radioactive Aminopolycarboxylate Complexes. Invest. Radiol. 1987, 22, 322–327. [Google Scholar] [CrossRef]
- Aime, S.; Botta, M.; Ermondi, G.; Fasano, M.; Terreno, E. Paramagnetic Water Proton Relaxation Enhancement: From Contrast Agents in MRI to Reagents for Quantitative “in Vitro” Assays. Magn. Reson. Imaging 1992, 10, 849–854. [Google Scholar] [CrossRef]
- Richardson, N.; Davies, J.A.; Raduchel, B. Iron(III)-based Contrast Agents for Magnetic Resonance Imaging. Polyhedron 1999, 18, 2457–2482. [Google Scholar] [CrossRef]
- Heeswijk, R.B.; Laus, S.; Morgenthaler, F.D.; Gruetter, R. Relaxivity of Gd-based Contrast Agents on X Nuclei with Long Intrinsic Relaxation Times in Aqueous Solutions. Magn. Reson. Imaging 2007, 25, 821–825. [Google Scholar] [CrossRef]
- Yilmaz, A.; Yurdakoç, M.; Işık, B. Influence of Transition Metal Ions on NMR Proton T1 Relaxation Times of Serum, Blood, and Red Cells. Biol. Trace. Elem. Res. 1998, 67, 187–193. [Google Scholar] [CrossRef]
- Yilmaz, U.N.; Guner, R. MR Proton Relaxivities of Some Ions, Albumins, and Cholesterol Added to Odontogenic Jaw Cysts. Biol. Trace. Elem. Res. 2008, 125, 193–202. [Google Scholar] [CrossRef]
- Sulkowska, A.; Bojko, B.; Rownicka, J.; Rezner, P.; Sulkowski, W.W. The Competition of Drugs to Serum Albumin in Combination Chemothrapy: NMR Study. J. Molecular Struc. 2005, 744–747, 781–787. [Google Scholar]
- Coroiu, I.; Cristea, V. Proton NMR Relaxivity of Blood Samples in The Presence of Iron, Gadolinium and Dysprosium Compounds. J. Magn. Magn. Mater. 2005, 293, 520–525. [Google Scholar] [CrossRef]
- Yilmaz, A.; Koylu, M.Z.; Uysal, E. Proton NMR Relaxation in Albumin Solutions Doped with Mn(II). Appl. Magn. Reson. 2008, 35 (4). [Google Scholar]
- Mildvan, A.S.; Cohn, M. Magnetic Resonance Studies of the Interaction of the Manganous Ion with Bovine Serum Albumin. Biochemistry 1963, 2, 910–918. [Google Scholar]
- Reuben, J. Gadolinium (III) as a Paramagnetic Probe for Proton Relaxation Studies of Biological Macromolecules. Binding to Bovine Serum Albumin. Biochemistry 1971, 10, 2834–2838. [Google Scholar] [CrossRef]
- Sample Availability: Samples of serum proteins are available from the authors.
© 2009 by the authors; licensee Molecular Diversity Preservation International, Basel, Switzerland. This article is an open-access article distributed under the terms and conditions of the Creative Commons Attribution license ( http://creativecommons.org/licenses/by/3.0/).
Share and Cite
Köylü, M.Z.; Asubay, S.; Yilmaz, A. Determination of Proton Relaxivities of Mn(II), Cu(II) and Cr(III) added to Solutions of Serum Proteins. Molecules 2009, 14, 1537-1545. https://doi.org/10.3390/molecules14041537
Köylü MZ, Asubay S, Yilmaz A. Determination of Proton Relaxivities of Mn(II), Cu(II) and Cr(III) added to Solutions of Serum Proteins. Molecules. 2009; 14(4):1537-1545. https://doi.org/10.3390/molecules14041537
Chicago/Turabian StyleKöylü, Mehmet Zafer, Sezai Asubay, and Ali Yilmaz. 2009. "Determination of Proton Relaxivities of Mn(II), Cu(II) and Cr(III) added to Solutions of Serum Proteins" Molecules 14, no. 4: 1537-1545. https://doi.org/10.3390/molecules14041537