Article

High-Performance Liquid Chromatographic Quantification of Flavonoids in Eriocaulaceae Species and Their Antimicrobial Activity

by
Marcelo Aparecido Da Silva
1,
Claudia Andréa Lima Cardoso
2,
Wagner Vilegas
1 and
Lourdes Campaner Dos Santos
2,*
1
UNESP-Univ Estadual Paulista, Instituto de Química, Departamento de Química Orgânica, CP 355, CEP 14800-900, Araraquara, São Paulo, Brazil
2
UEMS, Course of Chemistry, Mato Grosso do Sul State University, CP 351, CEP 79804-970, Dourados, Mato Grosso do Sul, Brazil
*
Author to whom correspondence should be addressed.
Molecules 2009, 14(11), 4644-4654; https://doi.org/10.3390/molecules14114644
Submission received: 9 October 2009 / Revised: 13 November 2009 / Accepted: 16 November 2009 / Published: 16 November 2009

Abstract

:
Quantification of prepared samples by analysis using high performance liquid chromatography with DAD detection was developed to analyze rutin, 6-methoxyapigenin, and 6-methoxyapigenin-7-O-β-D-glucopyranoside isolated from methanolic extracts of different genus: Syngonanthus, Leiothix and Eriocaulon (Eriocaulaceae). The linearity, accuracy, and the inter-day precision of the procedure were evaluated. The calibration curves were linear. The recoveries of the flavonoids in the samples analyzed were 96.3% to 98.5%. The percentage coefficient of variation for the quantitative analysis of the flavonoids in the analyses of the samples was under 5%. The antimicrobial activity of the five methanol extracts of these Eriocaulaceae species was assayed against the microorganisms Staphylococcus aureus, Pseudomonas aeruginosa, Escherichia coli, Salmonella setubal, Saccharomyces cerevisiae and Candida albicans. Measured MIC values ranged from 1.25 to 10.00 mg/mL. The flavonoid contents suggest that Eriocaulaceae species may be a promising source of compounds to produce natural phytomedicines.

Introduction

Eriocaulaceae is a pantropical and predominantly herbaceous monocotyledonous family, comprising around 1,100 species in 11 genera [1]. They are frequent components of the vegetation in pools of hilly areas or swamps, especially in sandy ground areas. This family is characterized as a monophyletic taxon with the following synapomorphies: very small unisexual white flowers in dense capitulae with only one ovule per locule and having spiraperturate pollen. However, the intrafamily relationships are still unsatisfactorily resolved [2].
Chemical constituents have previously proven to be an important taxonomic characteristic in Eriocaulaceae. Naphthopyranones and flavonols are the major compounds of many species from the genus Paepalanthus [3,4]. These classes of secondary metabolites are absent in species belonging to both the Syngonanthus and Leiothrix genera. Leiothrix produces mainly flavones and xanthones [5], while Syngonanthus afforded only flavones [1,6]. From the evolutionary point of view, it is considered that Leiothrix and Syngonanthus may have been originated from Paepalanthus, from a more advanced position than Eriocaulon [1], since the substitution of flavonols by flavones [7] is a well established condition [8].
Studies aiming to describe the diverse biological activities of the Eriocaulaceae species have shown promising results. Some studies have described the antioxidant [9], cytotoxic and mutagenic activities [10,11], and some extracts of the assayed plants presented antiulcerogenic activity [12].
We report here the quantification of taxonomically relevant flavonoids rutin, 6-methoxyapigenin-7-O-β-D-glucopyranoside and 6-methoxyapigenin. These flavonoids were firstly isolated from the Eriocaulon ligulatum (Eriocaulaceae) [7]. The sensitivity, specificity, linearity, accuracy and inter-day precisions of the assay method were evaluated. The efficiency of each analytical procedure was assessed by calculation the recovery values. Antimicrobial activities of five methanol extracts of the the Eriocaulaceae species were assayed on six different types of microorganisms (Staphylococcus aureus, Pseudomonas aeruginosa, Escherichia coli, Salmonella setubal, Saccharomyces cerevisiae and Candida albicans).

Results and Discussion
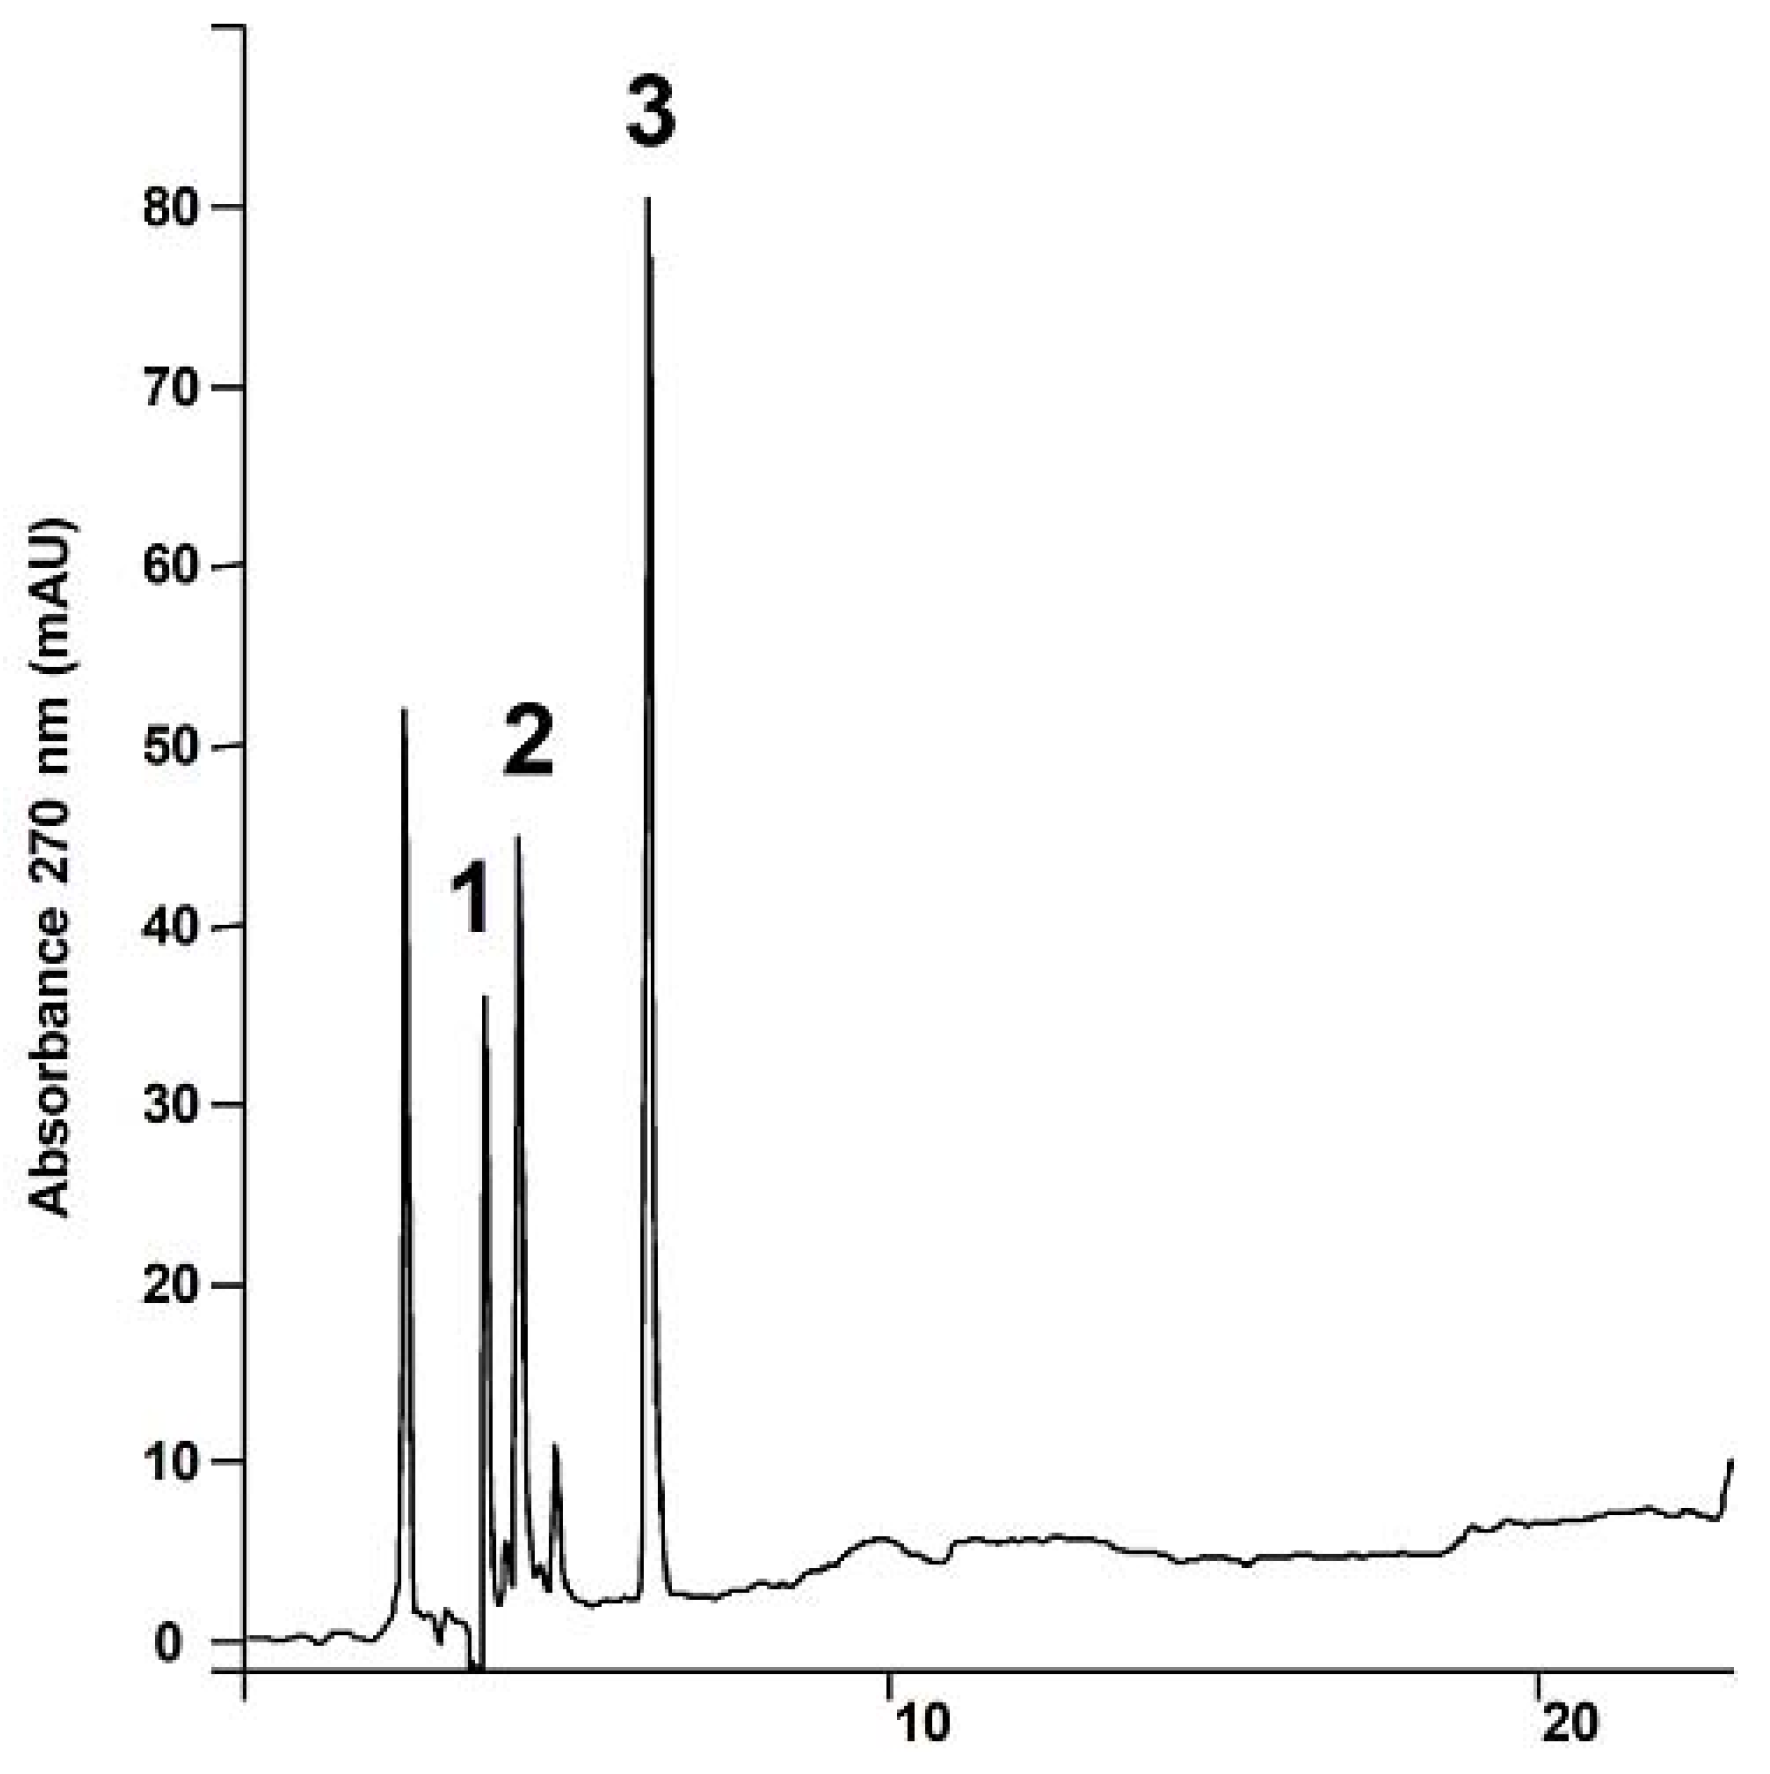
HPLC Analysis

In this study, three major flavonoids were detected in the methanolic extract of the different genera [Syngonanthus, Leiothix and Eriocaulon (Eriocaulaceae)]. A number of preliminary HPLC experiments employing samples were performed to establish optimal conditions for the analysis of rutin, 6-methoxyapigenin-7-O-β-D-glucopyranoside and 6-methoxyapigenin (Figure 1).
HPLC analysis showed a baseline separation for the compounds of interest, which could be analyzed in a satisfactory time interval of less than 7 min (rutin, Tr = 3.70 min, 6-methoxyapigenin-7-O-β-D-glucopyranoside, Tr = 4.23 min and 6-methoxyapigenin, Tr = 6.72 min) (Figure 2). The intervals where the compounds were eluted were free of interference in all samples tested and were employed in sample standardization.
The identification of rutin, 6-methoxyapigenin-7-O-β-D-glucopyranoside and 6-methoxyapigenin in the samples was performed by comparing their retention times with those of authentic standards and by the addition of standard solutions to the samples analyzed by HPLC and by the comparison of their UV-Vis spectrum.
There were no changes detected in the rutin, 6-methoxyapigenin-7-O-β-D-glucopyranoside, and 6-methoxyapigenin in the working solutions after 24 hours at 22 °C, two months at 4 °C and four months of storage at –20 °C. Thus, this validated method for the assay of flavonoids may be regarded as appropriate to indicate the stability of the solutions. The calibration curves were determined by linear regression via HPLC (Table 1). The average standard errors for the peak areas of the replicated injections (n = 5) were smaller than 1% showing good repeatability of the calibration curve.
The linearity of the method was determined by linear regression. The analysis of the samples spiked with known amounts of analyte demonstrated that the response was proportional to the concentrations of the samples with the determination coefficient being r2 = 0.9998 for the linear range of the analytical calibration curves for the samples.
The detection limits were 0.03 µg/mL for rutin and 0.07 µg/mL for 6-methoxyapigenin-7-O-β-D-glucopyranoside and 6-methoxyapigenin and the quantification limits were 0.10 µg/mL for rutin, and 0.23 µg/mL for 6-methoxyapigenin-7-O-β-D-glucopyranoside and 6-methoxyapigenin via HPLC.
The recovery results showed that the procedure used is good for the extraction of the substances of interest in the samples (Table 2).
The accuracy values were less than 5% (Table 3). Regarding the precision of the assay, the inter-day coefficients of variation were less than ±5%. In this work, the precision of the method was tested for the inter-day repeatability of the samples. The inter-day variability of the assayed method was determined at low, medium and high concentrations. The results are shown in Table 3. These data indicate that the method is reproducible within three different days.

Antimicrobial activity

The antimicrobial activity of the methanolic extracts of L. spiralis (A-capitulae, B-leaves), E. ligulatum (C-capitulae), S. suberosus (D-capitulae) and S. dealbatus (E-capitulae) were examined using a broth microdilution susceptibility assay against S. aureus, P. aeruginosa, C. albicans, S. setubal, S. cerevisiae and E. coli.
Table 4 shows the contents in μg/100 mg of extract of the flavonoids employed in the HPLC method. The results presented in Table 5 reveal that the methanolic extracts inhibited the growth of all the tested microorganisms and that C. albicans (MIC = 1.25 mg/mL), was the most sensitive for extracts B, D and E, while E. coli was the most resistant microorganisms (MIC = 10 mg/mL) for all extracts.
Alvarez et al. [13] have discussed how the important antibacterial activity of flavonoid combinations against E.coli forms the basis for their potential use as synergists of antibacterial agents. The authors observed that when combinations of the flavonoids kaempferol, morin, quercetin and rutin were employed, a stronger effect was found against E. coli than against S. aureus. Hidetoshi et al. [14] observed the antibacterial activities of flavonoids quercetin, quercetrin and morin by disk method to be enhanced by combining or mixing them. According to Harborne et al. [15], because of the widespread ability of flavonoids to inhibit spore germination of plant pathogens, they have been also been proposed for use against human fungal pathogens. This activity can be correlated with the one found for C. albicans.
In this work the flavonoids 1 and 2 are present in the methanolic extracts A-E and flavonoid 3 is present only in extracts effective against C. albicans at a MIC of 1.25 mg/mL suggesting that this compound is effective against this microorganism. The flavonoids combinations present antimicrobial activity against C. albicans. That suggests it could be an effective alternative in the treatment of infections produced by microorganisms.

Experimental

Plant material

Aerial parts of Eriocaulon ligulatum (Vell.) L.B. Smith. (voucher SANO n°2978), Syngonanthus suberosus Gil., (voucher SANO n°2976) Syngonanthus dealbatus Silv. (voucher SANO n°2975) and Leiothrix spiralis (Bong.) Ruhl. (voucher SANO n°4798) were collected in Diamantina, Minas Gerais State, Brazil and authenticated by Dr. Paulo Takeo Sano from the Institute of Biosciences of the University of Sao Paulo (IB-USP). A voucher specimen was deposited at the Herbarium of the IB-USP.

Extracts preparation

Capitulae of E. ligulatum, S. suberosus, S. dealbatus and leaves and capitulae of L. spiralis were dried in an oven at 45 °C for one week and powdered separately. The resulting material (Capitulae of E. ligulatum (100 g), S. suberosus (100 g), S. dealbatus (100 g) and leaves and capitulae of L. spiralis (100 g each) were separately macerated in methanol (1 L) at room temperature for one week. The extracts were obtained after filtration and evaporation of the solvents under reduced pressure and a reduced temperature (40 °C). The yields obtained were 3.55%, 2.43%, 2.05%, 4.395 and 3.36%.

Reagents and standard solutions

Spectroscopy grade acetonitrile and methanol were purchased from Merck (Darmstadt, Germany). Water was purified using a Milli-Q system (Millipore). Standard substances were obtained from a collection in our laboratory. Stock mixtures of these standards were made up from individual solutions, were dissolved in methanol and then used as external standards. Standard substances were available from a collection purified by chromatography in our laboratory. The HPLC analysis for rutin (Sigma Aldrich), 6-methoxyapigenin-7-O-β-D-glucopyranoside and 6-methoxyapigenin [7], revealed a purity of 98.8%, 98.5% and 98.9%, respectively, in the standard solutions. These stock mixtures were used as external standards.

HPLC analyses

The methanolic extracts obtained from the samples were analysed on an analytical HPLC (Varian 210) system with a ternary solvent delivery system and was equipped with an autosampler, a diode array detector (PAD) and Star WS (Workstation) software, which was used to measure the peak areas of the chromatogram. The HPLC column was an RP18 (25 cm × 4.6 mm × 5 μm) reversed-phase column with a small precolumn (2.5 cm × 3 mm) containing the same packing and it was used to protect the analytical column. Elution was carried out using the following program of solvent gradient: methanol:water:acetonitrile (10:80:10, v:v:v) taking 7 minutes to reach 25% methanol, 65% water and 10% acetonitrile and 5 minutes to reach 80% methanol, 10% water and 10% acetonitrile returning after that in 5 minutes to the initial conditions. The flow rate of 1.0 mL/min and an injected volume of 50 μL were used for each analysis. All chromatographic analyses were performed at 22 °C.

Sample preparation

The prepared sample was dissolved in 2 mL of methanol, filtered through a 0.45 µm Millex filter and the resulting solution was diluted in methanol in a volumetric flask (5 mL or 10 mL) for analysis via HPLC. The validation of the procedure was carried out according to the International Conference on Harmonization Guide Lines (Validation of analytical procedures; Text on validation of analytical procedures Q2A and Q2B) [16].

Determination of the detection and quantification limits

The detection limits were determined by injecting (n = 5) solutions of rutin, 6-methoxyapigenin-7-O-β-D-glucopyranoside and 6-methoxyapigenin of known concentration (10 µL each) and then decreasing the concentrations of the samples until a peak is detected having a signal/noise ratio of 3. The corresponding concentration was considered as being the minimal detectable concentration. The quantification limits were determined by performing the same methodology and thus, the quantification limit was considered to be the chromatographic peak having a signal/noise ratio of 10.

Extraction recovery

The extraction efficiency (recovery) was determined by analyzing aliquots of each sample spiked with the standards corresponding to low, medium and high concentrations. The spiked samples were submitted to the same procedure as described in “sample preparation”.

Analytical curves

The content estimation of the rutin, 6-methoxyapigenin-7-O-β-D-glucopyranoside and 6-methoxy-apigenin in the samples was performed by external calibration. The compounds in the study were dissolved separately in spectroscopy grade methanol in order to obtain stock solutions, which were appropriately diluted for each of the substances. Aliquots of 10 µL dilutions for each standard were analyzed via HPLC with each determination being carried out five times. For each standard, the corresponding chromatogram was obtained and a graphical plot was constructed of the mean of areas of the chromatogram against the concentration for each substance. A linear least-square regression of the peak areas as a function of the concentrations was performed to determine the correlation coefficients. The equation parameters (slope and intercept) of each standard curve were used to obtain the concentration values for the samples. Specimens with an analytic concentration exceeding the analytical curve were reassayed upon appropriate dilution of the samples.

Linearity

The analytical procedure was verified from the linearity of the assayed method in terms of the correlation coefficient obtained, which was evaluated by analyzing each sample (extracts A-E) spiked with known amount of the analyte at low, medium and high concentrations. The aliquots (10 µL) were analyzed via HPLC as described above. Each determination was carried out five times. For each spiked sample, the corresponding chromatograms were obtained and a plot of the average areas against their concentrations was constructed. Linear least-square regression was performed to determine the correlation coefficients.

Accuracy and precision

The accuracy of the assayed method was evaluated by performing replicate analyses against an analytical calibration curve and calculating the mean percentage differences between the theoretical values and the measured values. The accuracy values in the inter-day variation studies using HPLC at low, medium and high concentrations of rutin, 6-methoxyapigenin-7-O-β-D-glucopyranoside and 6-methoxyapigenin were evaluated in extracts A-E. The precision of a method is expressed as the percentage of the coefficient of variation (CV) of the replicate measurements. The precision of the method was tested for inter-day repeatability via HPLC. The inter-day variability of the method was determined from three different analysis (n = 5) for each sample with an addition of known amounts of analyte at low, medium and high concentrations.

Stability study

The stability of the working standard solutions was tested at 22 °C (working temperature), 4 °C and –20 °C (storage temperatures). The stability of rutin, 6-methoxyapigenin-7-O-β-D-glucopyranoside and 6-methoxyapigenin in the samples was evaluated during all the storage steps (i.e., at room temperature, at 4 °C and at –20 °C). Spiked samples were analyzed against the analytical calibration curves immediately after preparation (reference values) and after storage. Stability was defined as being less than 2% loss of the initial drug concentration in the stated time.

Specificity

To evaluate the specificity of the method, two different other flavonoids (quercetin and apigenin), usually present in the genus Syngonanthus and Leiothrix, were assayed using the same HPLC procedures and the retention times of the compounds were compared with those standards in the samples.

Antimicrobial activity

The antibacterial activity of the methanolic extract (A = capitulae from L. spiralis; B = leaves from L. spiralis; C = capitulae from E. ligulatum; D = capitulae from S. suberosus; E = capitulate from S. dealbatus) was assayed using the broth microdilution method. A collection of six microorganisms were used including a Gram-positive bacteria: Staphylococcus aureus (ATCC 6538p), three Gram-negative bacteria: Escherichia coli (ATCC 11103), Salmonella setubal (ATCC 19796) and Pseudomonas aeruginosa (ATCC 27853), two yeasts: Saccharomyces cerevisiae (ATCC 2601) and Candida albicans (ATCC 10231). Standard strains of these microorganisms were obtained from the American Type Culture Collection (ATCC), and standard antibiotics chloramphenicol and nistatine were used in order to control the sensitivity of the microbial test [17]. The minimal inhibitory concentration (MIC) was determined on 96-well culture plates using a microdilution method and a microorganism suspension at a density of 105 CFU/mL in Casein Soy Broth incubated for 24 hours at 37 °C for the bacteria, and Sabouraud Broth incubated for 72 hours at 25 °C for the yeasts. Proper blanks were assayed simultaneously and the samples were tested in triplicate. Technical data have been described previously [17]. The methodology of the antibacterial activity it was standard by the National Committee for Clinical Laboratory Standards – NCCLS 2000.

Conclusions

The HPLC analysis of the samples was developed for the simultaneous determination of rutin, 6-methoxyapigenin-7-O-β-D-glucopyranoside and 6-methoxyapigenin providing a method for their analysis. This method does not require tedious procedures to eliminate interfering materials. Validation experiments showed good precision and accuracy for the method with the coefficients of variation being around 1% and the relative errors being less than ± 5%. The antimicrobial activity results presented here demostrate that these methanolic extracts have phytotherapic potential against C. albicans.

Acknowledgements

The authors wish to thank the FAPESP Program of the Fundação de Amparo à Pesquisa do Estado de São Paulo (FAPESP) for financial support to L.C.S. We also thank the Conselho Nacional de Desenvolvimento Científico e Tecnológico (CNPq) for grants to W.V. and L.C.S. and Coordenadoria de Aperfeiçoamento de Pessoal de Nível Superior (CAPES) for a fellowship to M.A.S.

References and Notes

  1. Dokkedal, A.L.; Santos, L.C.; Sano, P.T.; Vilegas, W. Chemistry in Eriocaulaceae. Z. Naturforsch. C. 2008, 63, 169–175. [Google Scholar] [CrossRef] [PubMed]
  2. Giulietti, A.M.; Amaral, M.C.; Bittrich, V. Phylogenetic analysis of inter and infrageneric relationships of Leiothrix Ruhl. (Eriocaulaceae). Kew Bull. 1995, 50, 55–71. [Google Scholar] [CrossRef]
  3. Vilegas, W.; Dokkedal, A.L.; Rastrelli, L.; Piacente, S.; Pizza, C. New naphthopyranone glycosides from Paepalanthus vellozioides and Paepalanthus latipes. J. Nat. Prod. 1999, 62, 746–749. [Google Scholar] [CrossRef] [PubMed]
  4. Dokkedal, A.L.; Salatino, A. Chemistry in Paepalanthus and taxonomic implications. Biochem. Syst. Ecol. 1992, 20, 31–32. [Google Scholar] [CrossRef]
  5. Santos, L.C.; Piacente, S.; De Ricardis, F.; Eletto, A.M.; Pizza, C.; Vilegas, W. Xanthones and flavonoids from Leiothrix curvifolia and Leiothrix flavescens. Phytochemistry 2001, 56, 853–856. [Google Scholar] [CrossRef]
  6. Ricci, C.V.; Patricio, M.C.; Salatino, M.L.; Salatino, A.; Giulietti, A.M. Flavonoids of Syngonanthus (Eriocaulaceae): Taxonomic implications. Biochem. Syst. Ecol. 1996, 24, 577–583. [Google Scholar] [CrossRef]
  7. Santos, L.C.; Rodrigues, C.M.; Silva, M.A.; Coelho, R.G.; Sannomiya, M.; Vilegas, W. Chemical profile of Eriocaulon ligulatum (Vell.) L.B. Smith (Eriocaulaceae). Biochem. Syst. Ecol. 2005, 33, 1159–1166. [Google Scholar] [CrossRef]
  8. Harborne, J.B. The Flavonoids: Advances in Research; Chapman and Hall: New York, NY, USA, 1996. [Google Scholar]
  9. Santos, L.C.; Piacente, S.; Cosimo, P.; Montoro, P.; Vilegas, V. Antioxidante de xantonas isoladas de espécies de Leiothrix (Eriocaulaceae). Rev. Braz. Farmacog. 2003, 13, 67–74. [Google Scholar] [CrossRef]
  10. Varanda, E.A.; Raddi, M.S.G.; Dias, F.L.P.; Araujo, M.C.S.; Gibran, S.C.A.; Takahashi, C.S.; Vilegas, W. Mutagenic and cytotoxic activity of an isocoumarin (paepalantine) isolated from Paepalanthus vellozioides. Teratog. Carc. Mut. 1997, 17, 85–95. [Google Scholar] [CrossRef]
  11. Tavares, D.C.; Varanda, E.A.; Andrade, F.P.D.; Vilegas, W.; Takahashi, C.S. Evaluation of the genotoxic potential of the isocoumarin paepalantine in in vivo and in vitro mammalian systems. J. Ethnopharmacol. 1999, 68, 115–120. [Google Scholar] [CrossRef]
  12. Batista, L.M.; Almeida, A.B.; Pietro, L.M.; Toma, W.; Calvo, T.R.; Vilegas, W.; Souza, A.R.B. Gastric antiulcer activity of Syngonanthus arthrotrichus Silveira. Biol. Pharm. Bull. 2004, 27, 328–332. [Google Scholar] [CrossRef] [PubMed]
  13. Alvarez, M.A.; Debattista, N.B.; Pappano, N.B. Antimicrobial activity and synergism of some substituted flavonoids. Folia. Microbiol. 2008, 53, 23–28. [Google Scholar] [CrossRef] [PubMed]
  14. Hidetoshi, A.; Hitoshi, A.; Genichi, D. Rutin enhanced Antibacterial Activities of flavonoids against Bacillus cereus and Salmonella enteritidis. Biosci. Biotechnol. Biochem. 2002, 66, 1009–1014. [Google Scholar]
  15. Harborne, J.B.; Williams, C.A. Advances in flavonoid research since 1992. Phytochemistry 2000, 55, 481–504. [Google Scholar] [CrossRef]
  16. Vilegas, W.; Cardoso, C.A.L.; Pires, A.E. Química de produtos naturais, novos fármacos e a moderna farmacognosia; Univali: Itajai, SC, Brazil, 2009. [Google Scholar]
  17. Hammer, K.A.; Carson, C.F.; Riley, T.V. Antimicrobial activity of essential oils and other plant extracts. J. Appl. Microbiol. 1999, 86, 985–990. [Google Scholar] [CrossRef] [PubMed]
Sample Availability: Samples of the compounds are available from the authors.
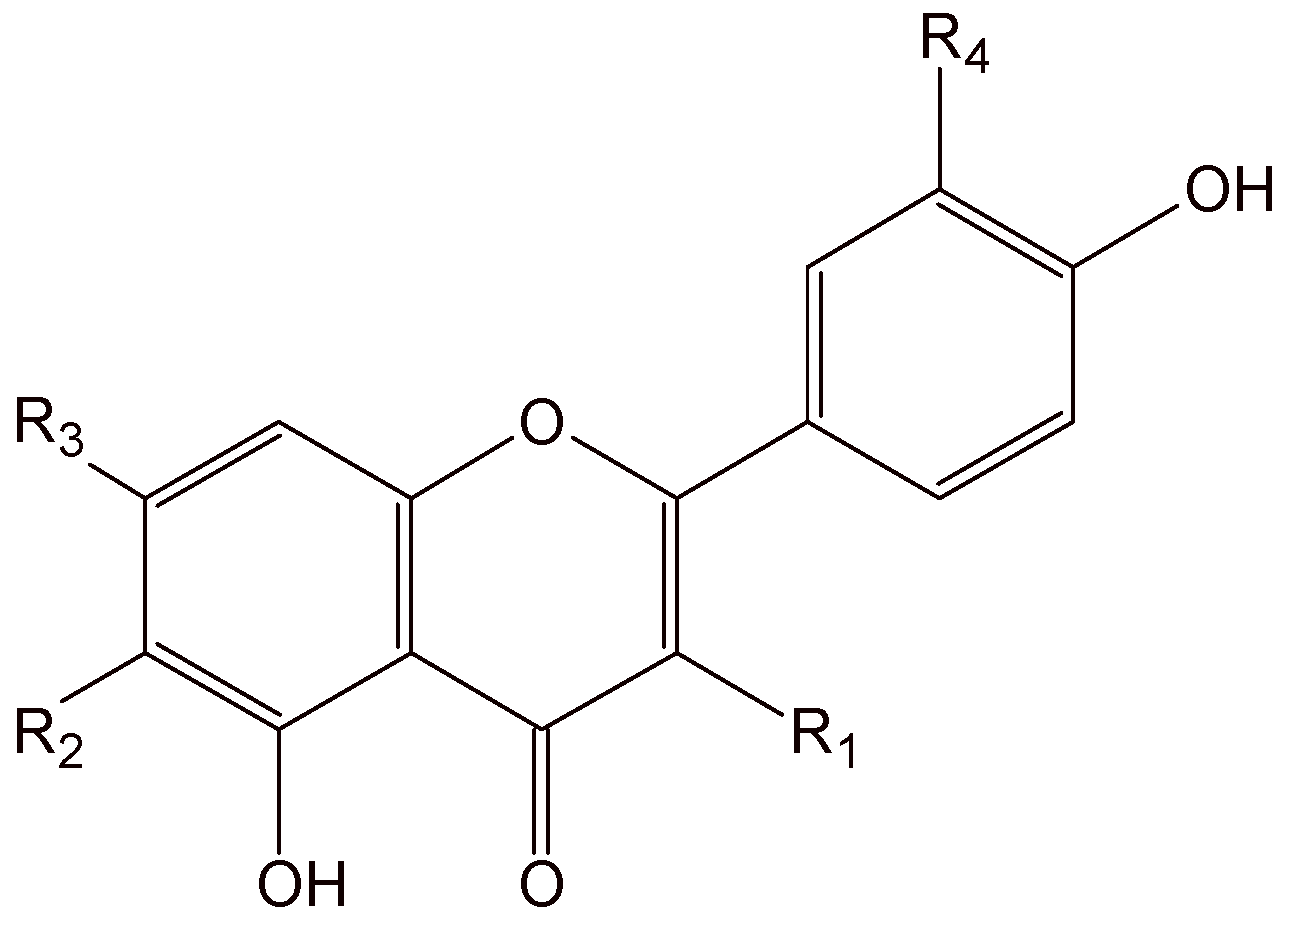
Figure 1. Chemical structure of the flavonoids.
Molecules 14 04644 g001

CompoundsR1R2R3R4
Rutin (1)O-glc-(6→1)-rhamHOHOH
6-methoxyapigenin 7-O-β-D-glucopyranoside (2)HOCH3O-glcH
6-methoxyapigenin (3)HOCH3OHH
Figure 2. Analytical HPLC chromatogram of the compounds recorded at 270 nm: 1. rutin, (Tr = 3.70 ± 0.04 min); 2. 6-methoxyapigenin 7-O-β-D-glucopyranoside (Tr = 4.23 ± 0.03 min); 3. 6-methoxyapigenin (Tr = 6.72 ± 0.03 min). For the chromatographic conditions, see the Experimental section.
Molecules 14 04644 g002
Table 1. Regression data of the analytical calibration curves for quantitative determination of the substances via HPLC.
ParametersValues
123
LR (μg/mL)0.10-50.000.23-50.000.23-50.00
a0.06450.01190.0576
b0.01330.01130.0124
Sa0.00350.00210.0029
Sb0.00130.00130.0010
r0.99980.99990.9997
n101010
L.R.: linear range, b: slope, a: intercept, Sb: standard deviation of the slope, Sa: standard deviation of the intercept, r: correlation coefficient, n: number of samples. Linear regression, formula: y = a + bx, where y = ratio of peak areas, x = concentration (μg/mL), a = intercept and b = slope. Rutin (1); 6-methoxyapigenin-7-O-β-D-glucopyranoside (2) and 6-methoxyapigenin (3).
Table 2. Recovery of the flavonoids in samples A-E* (n = 5).
Rutin (%) (mean ± S.D.)
Conc. added (μg/mL)ABCDE
197.33 ± 1.3697.99 ± 0.9497.34 ± 0.9997.45 ± 1.1697.89 ± 0.87
2098.79 ± 0.8599.14 ± 1.3798,98 ± 0.9698.96 ± 0.7899.44 ± 1.11
4099.03 ± 0.9799.05 ± 0.7799.47 ± 1.2799.29 ± 0.9199.27 ± 0.80
6-Methoxyapigenin-7-0-β-D-glucopyranoside (%) (mean ± S.D.)
Conc. added (μg/mL)ABCDE
199.45 ± 1.2899.88 ± 0.9999.67 ± 0.8799.74 ± 1.2599.68 ± 1.03
2098.99 ± 0.7399.35 ± 1.2799.01 ± 1.1398.76 ± 0.8999.50 ± 1.19
4098.14 ± 1.0298.13 ± 0.9798.00 ± 1.2298.36 ± 1.2798.55 ± 0.82
6-Methoxyapigenin (%) (mean ± S.D.)
Conc. added (μg/mL)ABCDE
199.97 ± 0.8199.97 ± 1.1299.09 ± 1.1999.89 ± 1.1099.67 ± 0.83
2099.43 ± 0.7199.46 ± 0.9199.26 ± 0.7399.02 ± 0.8699.29 ± 1.11
4098.01 ± 0.6798.39 ± 0.8098.11 ± 1.0398.44 ± 0.9398.33 ± 0.76
Conc: concentration; S.D: standard deviation. A = Methanolic extract of the capitulae from L. spiralis; B = Methanolic extract of the leaves from L. spiralis; C = Methanolic extract of the capitulae from E. ligulatum; D = Methanolic extract of the capitulae from S. suberosus; E = Methanolic extract of the capitulae from S. dealbatus
Table 3. Inter-day accuracy and precision of the HPLC method for the determination of the flavonoids (1-3) in samples A-E (n = 5 for each sample).
1 (μg/mL) *2 (μg/mL) *3 (μg/mL) *
Conc. addedConc. found *Ac
(%)
CV
(%)
Conc. found *Ac
(%)
CV
(%)
Conc. found *Ac
(%)
CV
(%)
11.03 ± 0.053.004.851.01 ± 0.041.003.961.03± 0.053.003.96
2019.51 ± 0.532.452.7220.02 ± 0.470.102.3520.08 ± 0.570.402.84
4039.32 ± 0.911.702.3139.51± 0.851.232.1539.43± 0,990.142.51
Conc: concentration (μg/mL); *(mean ± S.D.); CV: coefficient of variation; Ac: accuracy; S.D: standard deviations. Rutin (1); 6-methoxyapigenin-7-O-β-D-glucopyranoside (2) and 6-methoxyapigenin (3).
Table 4. Contents in μg/100 mg of extract A-E (mean ± S.D.) of the flavonoids (1-3) employing the HPLC method.
Extracts123
A140 ± 1.4125 ± 1.3--
B120 ± 2.2130 ± 1.7150 ± 0.3
C135 ± 2.4155 ± 3.3--
D125 ± 2.2155 ± 1.7121 ± 0.2
E130 ± 2.2156 ± 2.1118 ± 0.3
S.D: standard deviations; S.D: of five determinations. A = Methanolic extract of the capitulae from L.spiralis; B = Methanolic extract of the leaves from L. spiralis; C = Methanolic extract of the capitulae from E. ligulatum; D = Methanolic extract of the capitulae from S. suberosus; E = Methanolic extract of the capitulae from S. dealbatus; Rutin (1); 6-methoxyapigenin-7-O-β-D-glucopyranoside (2) and 6-methoxyapigenin (3).
Table 5. Antimicrobial activity of the methanolic extracts (A-E) of Eriocaulaceae genus.
MICa (mg/mL)
Extractb,dS. aureusP. aeruginosaC. albicansS. setubalS. cerevisiaeE. coli
A2.52.52.52.5510
B2.52.51.252.5510
C2.52.52.52.5510
D2.52.51.252.5510
E2.52.51.252.5510
Standard b,c3 x10-33 x10-33 x10-33 x10-310x10-310 x10-3
a Minimal inhibition concentration (MIC). bMean of 3 replicates in mg/mL. cStandard antimicrobial agents: chloramphenicol against bacteria and nistatine against yeasts. dA = Methanolic extract of the capitulae from L.spiralis; B = Methanolic extract of the leaves from L. spiralis; C = Methanolic extract of the capitulae from E. ligulatum; D = Methanolic extract of the capitulae from S. suberosus; E = Methanolic extract of the capitulae from S. dealbatus

