Entropy in Cell Biology: Information Thermodynamics of a Binary Code and Szilard Engine Chain Model of Signal Transduction

Department of Discovery Medicine, Pathology Division, Graduate School of Medicine, Kyoto University, Yoshida-Konoe-cho, Sakyo-ku, Kyoto 606-8315, Japan
Entropy 2018, 20(8), 617; https://doi.org/10.3390/e20080617
Submission received: 24 June 2018
/
Revised: 6 August 2018
/
Accepted: 13 August 2018
/
Published: 19 August 2018
(This article belongs to the Section Information Theory, Probability and Statistics)
Abstract
:A model of signal transduction from the perspective of informational thermodynamics has been reported in recent studies, and several important achievements have been obtained. The first achievement is that signal transduction can be modelled as a binary code system, in which two forms of signalling molecules are utilised in individual steps. The second is that the average entropy production rate is consistent during the signal transduction cascade when the signal event number is maximised in the model. The third is that a Szilard engine can be a single-step model in the signal transduction. This article reviews these achievements and further introduces a new chain of Szilard engines as a biological reaction cascade (BRC) model. In conclusion, the presented model provides a way of computing the channel capacity of a BRC.
1. Introduction
Information science provides a theoretical framework for understanding cell biology. Variable types of information entropy have been defined and applied for biological research. “Single cell entropy” was introduced for the estimation of the specified gene and kinase protein expression network [1,2]. Further, multicellular behaviour was analysed by a mathematical model in which individual cells interact with each other by secretion and sensing [3,4]. Immunological responses against variable antigens were quantified using entropy defined by the selective probability of amino acid residues [5]. The genetic entropy defined by DNA mutation rate is computable and useful in analysing molecular evolution [6], and the correlation analysis of the mutated gene frequency responsible for the cancer pattern development provides a useful predictive data for clinical prognosis. Further, the transfer entropy is generalised by the Kullback–Leibler divergence between two probabilistic transition statuses along a time course and a measurement of the transfer entropy enables the quantification of the information flow between stationary systems evolving in time [7,8]. Mutual entropy was defined on the basis of the correlation analysis between enzymes and metabolites such as ATP [9].
In addition to these recent develpments, significant achievements have been reported by the application of information thermodynamics to cell system that involves a feedback controller; hence, it can be an integrative system, in which information and thermodynamic entropy intersect [10,11,12,13,14,15]. Many reports on the study of information-driven works have recently been presented. For example, an information-driven artificial molecular motor device consisting of an enzyme has been reported [11].
The upper limit of the average work <w> that can be extracted from thermodynamic engine depends on the system temperature T, Boltzmann constant kB, free energy change ΔF and mutual entropy H informed by the feedback controller [12,13,14,15]:
Inequality (1) implies that free energy and mutual entropy are exchangeable parameters. For the isovolumic and isothermal biological system, Inequality (1) can be simplified to
As shown in below, the work extracted from an ideal Szilard engine is,
From the viewpoint of information thermodynamics, the signal transduction in Escherichia coli was reported [16]. Our earlier works considered a probability that the mutual entropy may be utilised for exchanging signalling molecules along the biological reaction cascade (BRC) [17,18,19,20]. This review later particularly introduces an ideal chain of Szilard engine constituting the BRC model [17].
2. A Common BRC Model
Let us consider modelling signal transduction by focusing on aspects that are common to several signal transductions. In BRC, the substrate protein in the reaction may become an enzyme or modulator in the next reaction. The most well-known example of a chain reaction is the chain of phosphorylation of proteins in the mitogen-activated protein kinase (MAPK) cascade [21,22,23,24,25,26] that is shown in (4):
In this BRC, the epidermal growth factor receptor (EGFR), Ras (a type of GTPase), a proto-oncogene c-Raf, MAP kinase-extracellular signal-regulated kinase (MEK) and kinase-extracellular signal-regulated kinase (ERK) follow the stimulation with the epidermal growth factor (EGF). Phosphatases were omitted in the above equation. This MAPK cascade is a ubiquitous signalling pathway in variable cell types, which allows growth and proliferation. The EGFR mutation promotes the enhancement of this cascade, which contributes to the tumourogenesis of the lung and other cancers [27].
To understand the essence of complicated cell signaling, the BRC model consisting of jth and reverse −jth steps can be constructed (1 ≤ j ≤ n):
Each step represents an activation of the signalling molecules Xj in the cytoplasm maintained by a chemical reservoir of mediator A, such as adenosine triphosphate (ATP), and an inactivation of the signalling molecules Xj* by enzymes Phj. ATP is hydrolysed into adenosine diphosphate (ADP; D in (5)) and inorganic phosphate (Pi), which modifies the amino acid residue of Xj. Xj and Xj* denote unmodified (inactive) and modified (active) signalling molecules, respectively. The first reaction represents the ligand (L), EGF in the MAPK cascade, an extracellular molecule and stimulates X1, which represents a receptor (R), EGFR in the MAPK cascade, on the cellular membrane. Afterward, X1 − L* complex promotes the modification of X2 in the cytoplasm into X2* activated by Pi that originated from A, and D is produced. Further, X2* promotes the modification of X3 into X3*. In this manner, the jth signalling molecule, Xj*, activates Xj+1 in the cytoplasm into Xj+1*. Following the (n − 1)th step, the signalling molecule Xn* binds to the promoter region of the DNA and induces the mRNA transcription in the nth step. In addition, during the reverse BRC steps, the inactivation of Xj* into Xj occurs through enzymes that catalyse inactivation or through self-inactivation by Xj*, in which Pi is released. Thus, jth and −jth step forms a cycle reaction consisting of activation and inactivation. Finally, a pre-stimulation steady state of the individual step is recovered. Such reaction chain schemes were previously described by Gaspard et al. and Tsuruyama [17,18,28,29,30].
3. Binary Code Model of BRCs
Recent studies showed that the BRC can be interpreted as a binary code system with two forms of signalling molecules, namely an active form (Xj*) and an inactive form (Xj) in individual step [18,19,20]. The total signal event number Ψ in a given BRC event, can be described using the concentration of inactive Xj and active molecules Xj* as follows:
X represents the total concentration of signalling molecules. The logarithm of Ψ is approximated according to Starling’s equation and gives Shannon’s entropy S using the selection probability of Xj or Xj*, pj = Xj/X and pj* = Xj*/X [19]:
Selecting the jth step component of S in (7) gives:
When the signal is transmitted to the jth step, concentrations of Xj or Xj* fluctuate, and sj is given using the probability fluctuation dpj and dpj*,
Because the signal has not yet reached the (j + 1)th step; hence, the entropy of the (j + 1)th step remains:
Therefore, the entropy difference Hj is generated between the jth and (j + 1)th step is presented as follows [17,18,19]:
with
and
In addition, the entropy difference per single active molecule, hj, is given by Equation (11):
Accordingly, the entropy current density cj per single active molecule is given as:
4. Mutual Entropy in BRCs
For the evaluation of mutual entropy in Equation (15) according to information theory, let us consider the channel capacity of the jth cycle (1 ≤ j ≤ n) (Figure 1). The natural logarithm was applied in place of the base-2 logarithm to simplify the description. The entropy hj0 is given using qj = pj/(pj + pj*) and qj* = pj*/(pj + pj*), as follows:
The conditional entropies hj (j + 1|j) from the (j + 1)th step for the given jth step can be described as a linear function of qj* using the probability of the noise occurrence probability ϕj and ξj = −ϕjlogϕj − (1 − ϕj)log (1 − ϕj) [13]:
hj0 and h(j + 1|j) are chosen in such a manner as to maximize mutual entropy, which is defined by hj0 − h(j + 1|j), subject to the constraint qj* + qj = 1. The channel capacity is defined as the maximum value of mutual entropy:
with
To obtain the maximized mutual entropy, the following function Uj using the undetermined parameter λ is maximized using Lagrange’s method for undetermined multipliers as follows [13]:
Then
Setting the right-hand side of Equations (23) and (24) to zero, and eliminating λ, we have:
From qj + qj* = 1 and (25), the following can be derived:
with
As a result, the channel capacity of the jth step, Cj, is given using (21), (26)–(28) as a maximum value of mutua entropy:
The mutual entropy of reverse signal transduction is also given by the entropy h−j0 = hj0 = −qjlogqj − qj*logqj* and mutual entropy as h−j0 − h(−j − 1|−j) (Figure 1). The following function, U−j for the reverse transduction using the undetermined parameter λ′, is maximised as follows:
In above, ξ−j = −ϕ−j logϕ−j − (1 − ϕ−j) log (1 − ϕ−j), and ϕ−j denotes the noise occurrence probability in the reverse cascade. Then:
Setting the right-hand side of Equations (31) and (32) to zero, and eliminating λ′, we have:
Accordingly, the channel capacity C−j is given by:
The channel capacity of the jth cycle step is defined and calculated as follows:
Thus, we can obtain the mutual entropy as entropy difference in Equation (15).
5. Szilard Engine Chain as a BRC Model
Subsequently, let us consider that phosphorylation and dephosphorylation reactions form a cycle reaction that simultaneously activates the next cycle reaction in a BRC. A cycle reaction of individual step can be modelled as a Szilard engine, which may serve as a model of the conversion system [17]. The Szilard engine was established by Leo Szilard considering Maxwell’s demon paradox [31,32]. In the engine model, Maxwell’s demon, which is a feedback controller, utilises the position information of a single gas particle in a box that contacts with a heat bath. As an initial state, the boundary is inserted to a room at the middle position such that the controller can determine whether a single gas particle is in the left space or in the right space of the room. The information gained by the controllers is equal to one bit (i.e., left or right). In the case of the particle in the left, let the boundary be quasi-statically moved in the right orientation for recovery of the full volume of the room. In both cases, the particle isothermally expands with the movement of the boundary back to its original full volume. The extracted work is equal to kBTln2. This process is equivalent to the system, in which the feedback controller transforms the gained information into the actual expansion work. The feedback controller system has been produced in the actual experimental study [33,34]. Thereby, let us consider the feedback controller is informed whether the signalling molecule is an active or inactive type in place of measuring the particle position.
As reported previously [17,19], the BRC for modelling can be divided into n number of hypothetical compartment fields corresponding to the individual jth steps (1 ≤ j ≤ n) that corresponds to a single Szilard engine. The diffusion rate of signaling molecule is sufficiently low because of its high molecular weight and they are hypothesised to be localized in the compartment fields. Each field contains all Xj+1* and Xj+1 species (1 ≤ j ≤ n − 1), with the concentrations identical to those of Xj+1*st and Xj+1st, respectively, at the steady state. The feedback controller has the potential to recognise the molecule concentration. Subsequently, the controller selects Xj+1* or Xj+1 for its transfer (Figure 2). The steps are summarised as follows when BRC proceeds:
- (i)
- When the signal transduction initiates, the controller measures the changes in the concentration of the active molecule Xj+1* and Xj+1 in the jth field.
- (ii)
- At the jth step in the signalling cascade, the feedback controller introduces ΔXj+1* of Xj+1* to the (j + 1)th field from the jth field by opening the forward gate on the boundary in the jth field to the (j + 1)th field. Simultaneously, the controller introduces ΔXj+1 of Xj+1 to the (j + 1)th field from the jth field by opening the back gate on the boundary.
- (iii)
- Subsequently, Xj+1* can flow back with the forward transfer of Xj+1 from the (j + 1)th field to the jth field because of the entropy difference (see Equation (13)). Xj+1 can also flow back with the backward transfer of Xj+1 from the (j + 1)th field to the jth field because of the concentration gradient.
- (iv)
- In (iii), ΔXj+1* and ΔXj+1 can quasi-statically rotate the exchange machinery on the hypothetical partition between the jth and (j + 1)th fields, which has the ability to extract chemical work equivalent to wj+1 = kBThj+1.
- (v)
- As the next step, wj+1 is linked to the modification of Xj+2 into Xj+2*, which further causes the concentration difference of Xj+2* introduced by the feedback controller from the (j + 1)th field to the (j + 2)th field. The next step proceeds as aforementioned in (ii) to (iii).
6. Conservation of the Average Entropy Production
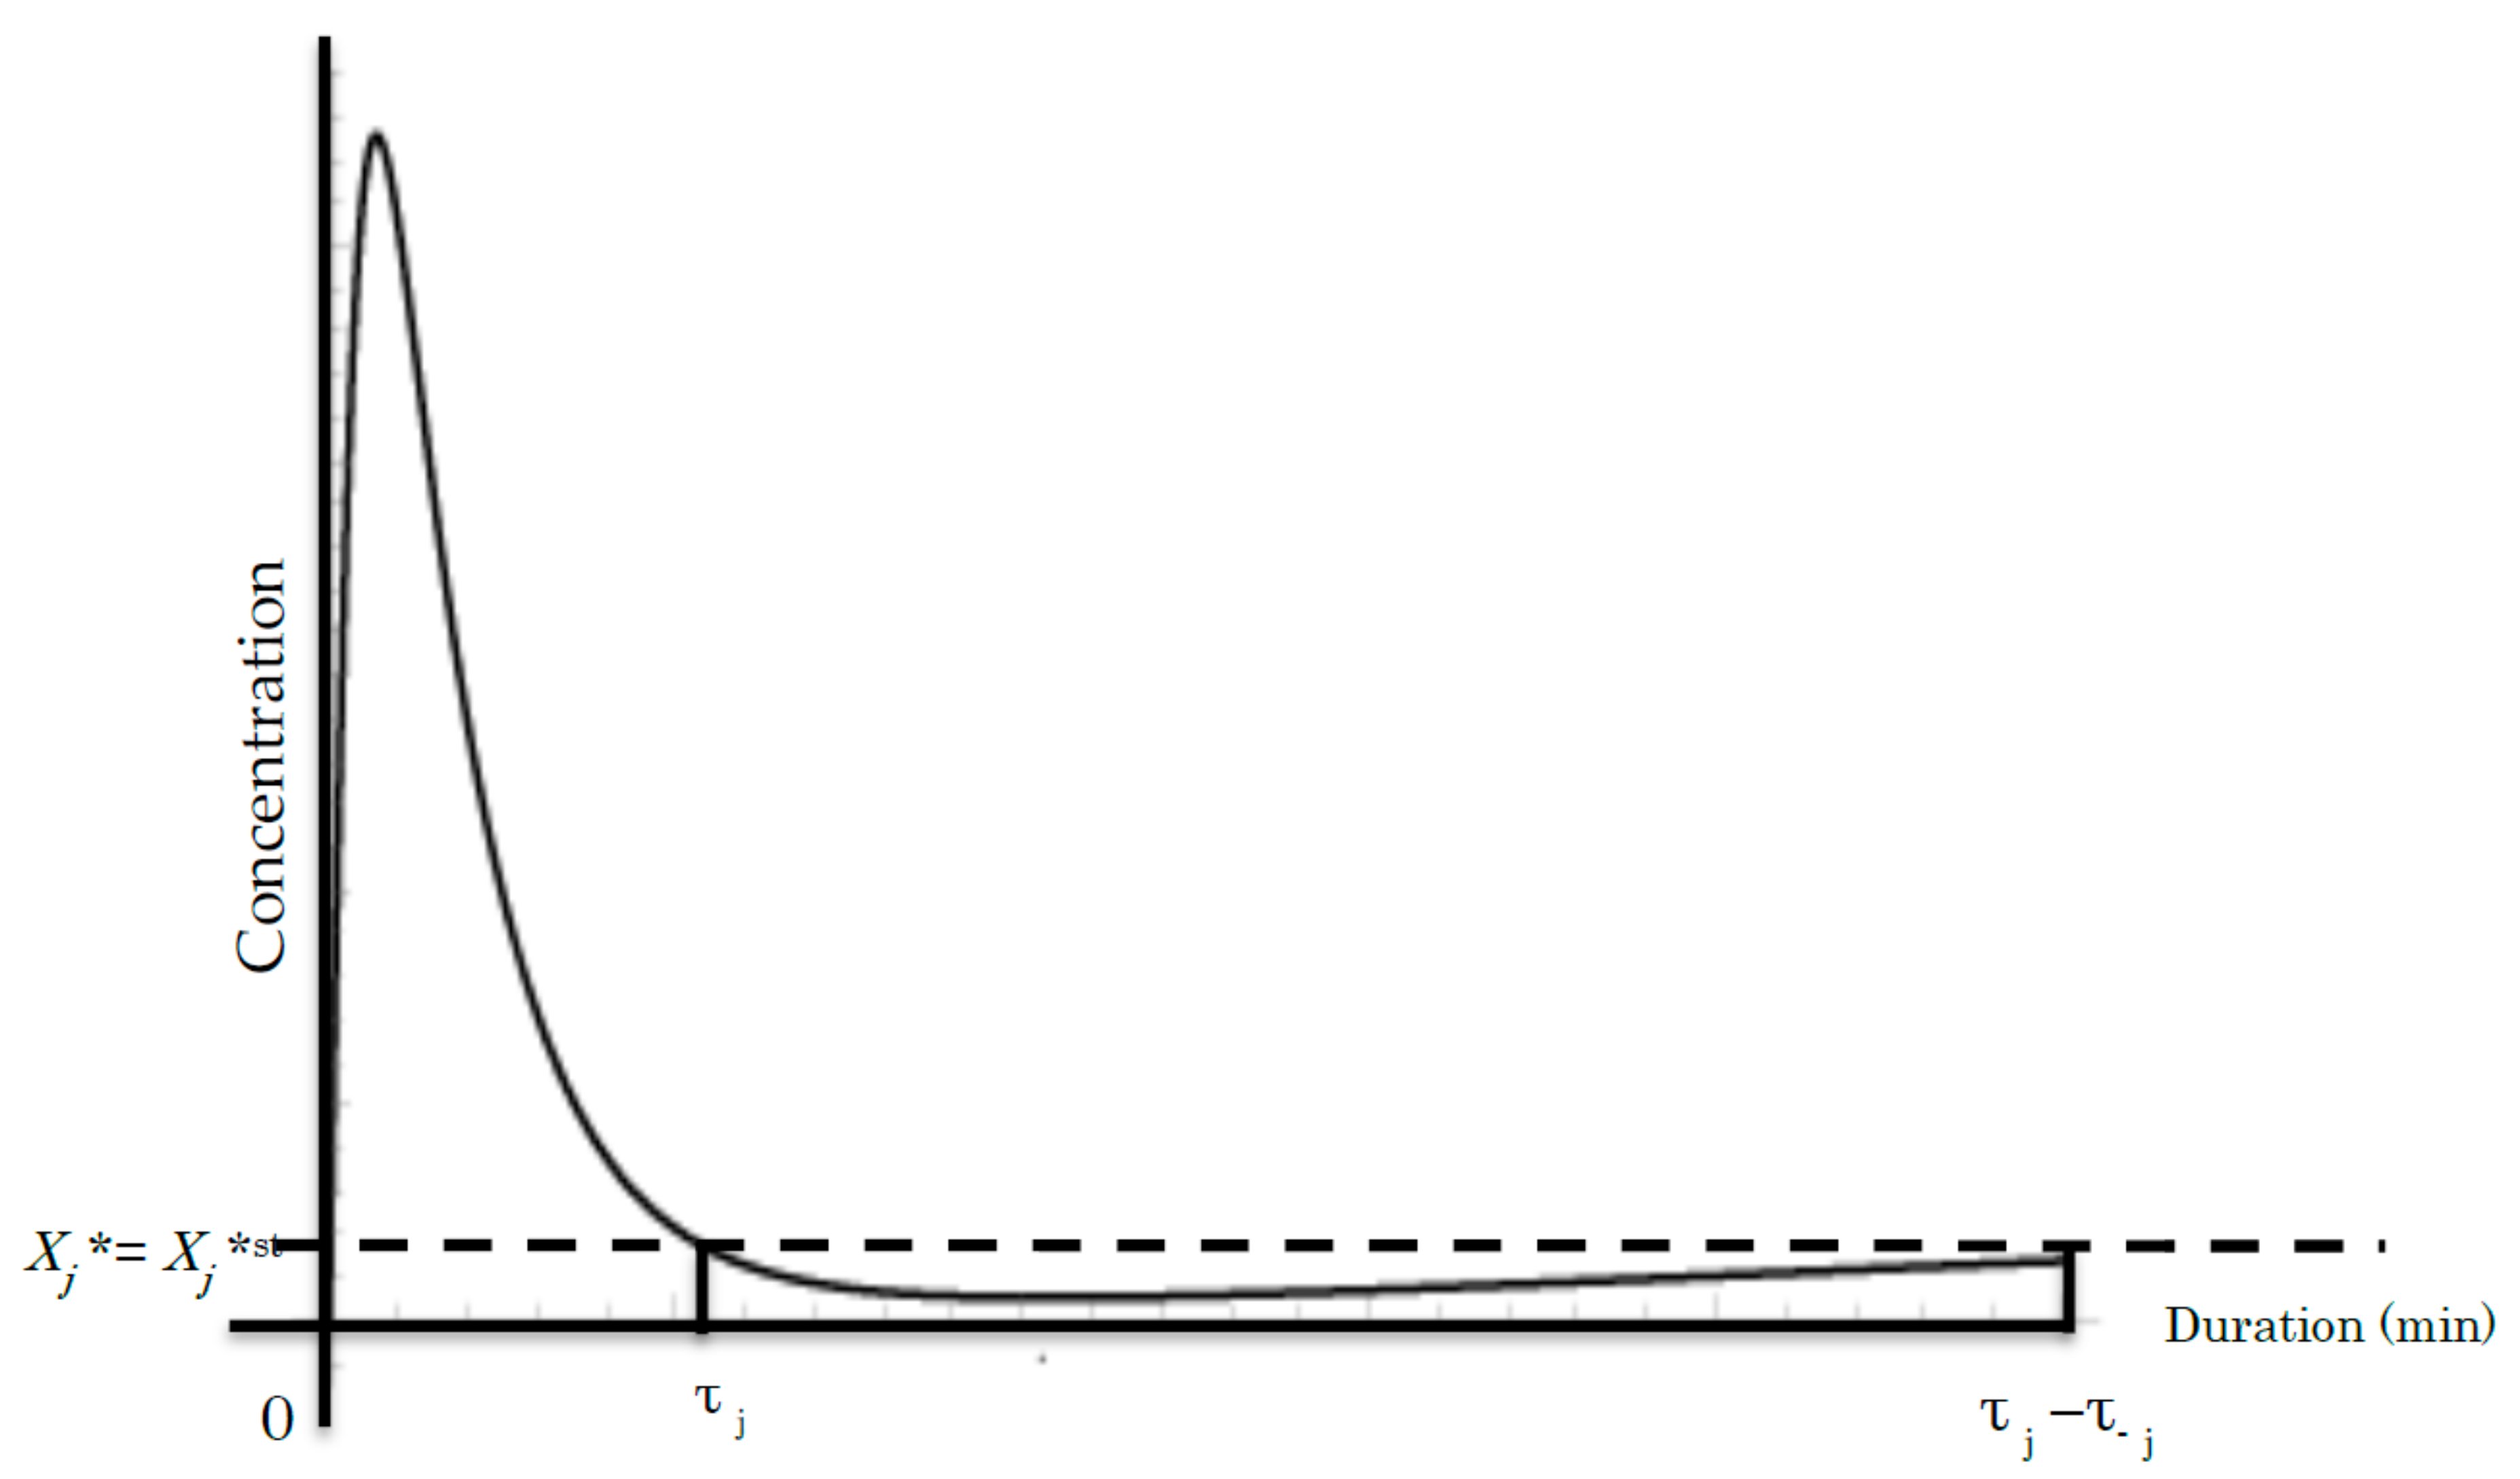
Next, let us review the optimized coding way for maximizing the signal event number for a given duration in this binary coding model of signal transduction in a nonequilibrium steady system. First, the duration of signal transduction is defined in consideration of the signal orientation (i.e., forward τj and backward τ−j). Positive and negative values are assigned to τj and τ−j for distinction of the signal direction. τj represents the duration of the tentative increase in the active molecule Xj*, whilst τ−j represents the duration to the recovery to the initial state. The step cycle duration is represented by τj − τ−j.
The average entropy production ζj and ζ−j during the signal transduction are defined during τj − τ−j and the average entropy production rate (AEPR) is defined using a bracket < > as:
where, sj is an arbitrary parameter representing the progression of a reaction event [35]. The transitional probability p (j + 1|j) is the probability of the (j + 1)th step given the jth step during τj, and p (j|j + 1) is the transitional probability of the jth step given the (j + 1)th step during τ−j. The AEPR <ζj > during the signal transduction from the jth to the (j + 1)th field is given according to fluctuation theorem (FT) at the steady state:
The AEPR <ζ−j> from the (j + 1)th to the jth field is given:
Substituting the right side of Equation (17) into the right side of (41), an important result is given [19]:
When the signal even number is maximised, the logarithm of the selection probability is described simply using the average entropy production rate β independent of the step number according to previous reports [17,18,19,20]:
This is one type of entropy coding. Substitution of the right sides of Equations (43) and (44) into (42) gives:
Likewise,
We used τj << τ−j as shown in Figure 3 in (45) and (46) and sufficient long duration of the whole signal transduction according to experimental data [23,36,37]. The dephosphorylation of signaling molecule Xj* takes a significantly longer time, τ−j. Subsequently, Equations (39), (40), (45) and (46) provide:
In summary, we obtained the following result from Equations (43)–(47):
Equations (48) and (49) implies the integration of information entropy, code length, and thermodynamic AEPR. In these equations, step numbers j and −j in ζj and ζ−j were omitted because ζj and ζ−j are independent of the step number. Thus, the theoretical basis of the consistency of the average entropy production rate can be obtained.
The chemical extracted average chemical work <wj> in Equation (36) from (i) to (iv) in Section 5 is calculated as follows using Equations (15), (36), (48) and (49) [18]:
The summation of the right side of (50) gives the total work:
with
and
Here, σj stands for the entropy production during τj − τ−j at the jth step.
7. Conclusions
Signal transduction is an important research topic in life science, but quantitatively evaluating data remains difficult. This review pointed out the possibility of quantitative signalling to life scientists. The current review can be summarised in the following points:
- (i)
- The BRC can be expressed by a kind of binary code system consisting of two types of signalling molecules: activated and inactivated.
- (ii)
- The individual reaction step of the BRC can be thought of as a cycle of a Szilard engine chain, in which the process of repeats of signalling molecule activation/inactivation.
- (iii)
- The average entropy production rate is consistent during BRC.
- (iv)
- The signal transduction amount can be calculated through the BRC.
The chain of Szilard engines is a useful model to show how signal transduction in one step induces signal transduction in the next step, in which a series of chains is formed. The most important point of this model is to directly give the signal transduction amount by the exchange work according to Equation (3). The currently introduced chain illustrates that the feedback controller transfers signal molecules based on the measurement of the increase and decrease of the signal molecule. Subsequently, the exchanger molecule on the boundary between the steps can extract work between because of the entropy gradient consisting of the two types of signalling molecules. In this way, the signal transduction amount can be clearly quantified by the combination of chemical work.
Herein, let us consider the calculation of the entropy production based on the kinetics of the activation of signalling molecules according to (5). The signalling system is contacted with a chemical bath outside the system that provides ATP. The transitional rate from the jth step to the (j + 1)th step, vj, obtained using the kinetic coefficient kj for the jth step as follows:
The transitional rate from the (j + 1)th step to the jth step, v−j, which is equal to the demodification (dephosphorylation) of the backward signal transduction, is given using the kinetic coefficient k−j for the −jth step:
where, kj and k−j represent the kinetic coefficients. The signal transduction system remains at a detailed balance around the steady state, the homeostatic point:
Combining Equations (47), (54)–(56), we obtain the following from FT:
Above result contains Equation (42). Therefore, for sufficient long duration τj − τ−j:
Using the concentration of the active signalling molecules at the steady state, Xj+1st*, we have:
Substitution of Equation (59) into Equation (58) produces:
Here, the entropy production σj in (53) is defined in the jth step:
In Equation (61), the fluctuation of Xj* is negligible during signal transduction relative to ΔXj+1 and ΔXj+1* according to experimental data (36). The sum of the concentrations of Xj+1 and Xj+1* is equal to the total concentration Xj+10 that is kept constant because the signal transduction rate is significantly greater than the production of signalling molecular proteins. Then:
Equations (54), (55) and (62) give the concentrations at steady state:
Phj+1 signifies the phosphatase concentration in the jth step. The fluctuation of the transmitted information is described as follows using an integral form of Equation (61):
We used the approximation log (1 + x) ~ x in the logarithmic term in (65). A simple calculation of Equations (63) and (64) gives:
Then, substitution of Equation (66) into Equation (65) gives:
with
Ajf and Aji signify the local concentration of the mediator ATP at the initial and final state, respectively, at the jth step. ΔAj signifies the concentration change of ATP at the jth step. Thus, the total entropy production σ is simply given as follows:
In above, we used the approximation log (1 + x) ~ x again and set A1i equal to the initial concentration of ATP, A. Thus, ATP is the mediator of signal transduction. In an actual experiment, rigorously measuring the concentration change of ATP at individual signal steps is difficult because ATP is consumed in a variety of reactions as a basic metabolite for cell activity. Alternatively, the ratio ΔXj+1/ΔXj+1st is negligible during signal transduction according to experimental data [36], we have from (61):
or
As aforementioned, the right side of Equation (71) indicates that AEPR <ζ> is consistent during the cascade. Accordingly, the measurement of AEPR will provide an evidence of its consistency during the signaling cascade. In this manner, the rigorous measurement of the concentration change of active signaling molecule may provide more direct evidence in the presented theory.To date, experimental data have demonstrated that the time course of increase in active signaling molecules shows a similar time course plot, as shown in Figure 3, suggesting the consistency of the AEPR [36,37].
Further study is required to prove which signal transduction strategy a biological system will select. For example, the cell system may select a strategy to maximise signal event number during a given duration by application of non-redundant signal system; in contrast, accuracy of the signal transduction may be prioritized by application of redundant signal system. The strategy chosen for signal cascade by the cell system will likely be determined experimentally. The cost-performance of metabolomics substance tradeoffs for cellular regulatory functions and information processing will been argued by evaluation of recent experimental data [23,24,25,26]. By measuring the consumption of metabolite, Luo et al. were successful in their estimation of biological information [38]. The relationship between the ATP concentration in cellular tissues and information transmission has been vigorously studied in the analysis of nerve excitement transmission [39], and this review may suggest implications for quantitative information transmission.
The discussion developed herein has some limitations; hence, we would like to mention it at the end. A detailed balancing between modification and demodification is assumed at each step for the application of FT. Therefore, the current discussion is also possible only when the distance from the detailed balance is not great [17,18,19,20]. This also depends on how we consider the range of FT application or Jarzynski equality. FT has been applied to study a non-equilibrium system [28,29,40,41], limit cycle [42], molecular machines [43], and biological phenomenon [44], including membrane transport [45], molecular motor activity [46], and RNA folding [47]. The adaptation and extension of the current discussion to the non-linear phenomenon [48,49] and far from steady state or active matters will be the next theoretical subjects. However, at the least, interpreting the signal cycle as a Szilard engine is considered as an effective idea for thought of experiments, and a chain of the engines will serve as an actual BRC.
In conclusion, the information thermodynamics approach described herein provides a framework for the analysis of signal transduction BRC. This theoretical approach appears suitable for the identification of novel active signalling cascades among response cascades in which AEPR is consistent through the given cascade. This review presents that the binary coding system and the Szilard engine chain model may be the theoretical basis of computation of the channel capacity of BRC.
Funding
This research was supported by a Grant-in-Aid from the Ministry of Education, Culture, Sports, Science, and Technology of Japan (Synergy of Fluctuation and Structure: Quest for Universal Laws in Non-Equilibrium Systems, P2013-201 Grant-in-Aid for Scientific Research on Innovative Areas, MEXT, Japan).
Acknowledgments
I thank Kenichi Yoshikawa of Doshisha University for his advice.
Conflicts of Interest
The author declares no conflict of interest.
References
- Guo, M.; Bao, E.L.; Wagner, M.; Whitsett, J.A.; Xu, Y. Slice: Determining cell differentiation and lineage based on single cell entropy. Nucleic Acids Res. 2017, 45, e54. [Google Scholar] [CrossRef] [PubMed]
- Cheng, F.; Liu, C.; Shen, B.; Zhao, Z. Investigating cellular network heterogeneity and modularity in cancer: A network entropy and unbalanced motif approach. BMC Syst. Biol. 2016, 10, 65. [Google Scholar] [CrossRef] [PubMed]
- Maire, T.; Youk, H. Molecular-level tuning of cellular autonomy controls the collective behaviors of cell populations. Cell Syst. 2015, 1, 349–360. [Google Scholar] [CrossRef] [PubMed]
- Olimpio, E.P.; Dang, Y.; Youk, H. Statistical dynamics of spatial-order formation by communicating cells. iScience 2018, 2, 27–40. [Google Scholar] [CrossRef]
- Mora, T.; Walczak, A.M.; Bialek, W.; Callan, C.G., Jr. Maximum entropy models for antibody diversity. Proc. Natl. Acad. Sci. USA 2010, 107, 5405–5410. [Google Scholar] [CrossRef] [PubMed] [Green Version]
- Tugrul, M.; Paixao, T.; Barton, N.H.; Tkacik, G. Dynamics of transcription factor binding site evolution. PLoS Genet. 2015, 11, e1005639. [Google Scholar] [CrossRef] [PubMed]
- Orlandi, J.G.; Stetter, O.; Soriano, J.; Geisel, T.; Battaglia, D. Transfer entropy reconstruction and labeling of neuronal connections from simulated calcium imaging. PLoS ONE 2014, 9, e98842. [Google Scholar] [CrossRef] [PubMed] [Green Version]
- Kullback, S.; Leibler, R.A. On information and sufficiency. Ann. Math. Stat. 1951, 22, 79–86. [Google Scholar] [CrossRef]
- McGrath, T.; Jones, N.S.; Ten Wolde, P.R.; Ouldridge, T.E. Biochemical machines for the interconversion of mutual information and work. Phys. Rev. Lett. 2017, 118, 028101. [Google Scholar] [CrossRef] [PubMed]
- Crofts, A.R. Life, information, entropy, and time: Vehicles for semantic inheritance. Complexity 2007, 13, 14–50. [Google Scholar] [CrossRef] [PubMed] [Green Version]
- Seifert, U. Stochastic thermodynamics of single enzymes and molecular motors. Eur. Phys. J. E Soft Matter 2011, 34, 1–11. [Google Scholar] [CrossRef] [PubMed]
- Ito, S.; Sagawa, T. Information thermodynamics on causal networks. Phys. Rev. Lett. 2013, 111, 18063. [Google Scholar] [CrossRef] [PubMed]
- Ito, S.; Sagawa, T. Maxwell’s demon in biochemical signal transduction with feedback loop. Nat. Commun. 2015, 6, 7498. [Google Scholar] [CrossRef] [PubMed] [Green Version]
- Sagawa, T.; Ueda, M. Minimal energy cost for thermodynamic information processing: Measurement and information erasure. Phys. Rev. Lett. 2009, 102, 250602. [Google Scholar] [CrossRef] [PubMed]
- Sagawa, T.; Ueda, M. Generalized jarzynski equality under nonequilibrium feedback control. Phys. Rev. Lett. 2010, 104, 090602. [Google Scholar] [CrossRef] [PubMed]
- Sagawa, T.; Kikuchi, Y.; Inoue, Y.; Takahashi, H.; Muraoka, T.; Kinbara, K.; Ishijima, A.; Fukuoka, H. Single-cell E. coli response to an instantaneously applied chemotactic signal. Biophys. J. 2014, 107, 730–739. [Google Scholar] [CrossRef] [PubMed]
- Tsuruyama, T. Information thermodynamics of the cell signal transduction as a szilard engine. Entropy 2018, 20, 224. [Google Scholar] [CrossRef]
- Tsuruyama, T. The conservation of average entropy production rate in a model of signal transduction: Information thermodynamics based on the fluctuation theorem. Entropy 2018, 20, 303. [Google Scholar] [CrossRef]
- Tsuruyama, T. Information thermodynamics derives the entropy current of cell signal transduction as a model of a binary coding system. Entropy 2018, 20, 145. [Google Scholar] [CrossRef]
- Tsuruyama, T. Analysis of Cell Signal Transduction Based on Kullback–Leibler Divergence: Channel Capacity and Conservation of Its Production Rate during Cascade. Entropy 2018, 20, 438. [Google Scholar] [CrossRef]
- Zumsande, M.; Gross, T. Bifurcations and chaos in the mapk signaling cascade. J. Theor. Biol. 2010, 265, 481–491. [Google Scholar] [CrossRef] [PubMed]
- Yoon, J.; Deisboeck, T.S. Investigating differential dynamics of the mapk signaling cascade using a multi-parametric global sensitivity analysis. PLoS ONE 2009, 4, e4560. [Google Scholar] [CrossRef] [PubMed]
- Wang, H.; Ubl, J.J.; Stricker, R.; Reiser, G. Thrombin (par-1)-induced proliferation in astrocytes via mapk involves multiple signaling pathways. Am. J. Physiol. Cell Physiol. 2002, 283, C1351–C1364. [Google Scholar] [CrossRef] [PubMed]
- Qiao, L.; Nachbar, R.B.; Kevrekidis, I.G.; Shvartsman, S.Y. Bistability and oscillations in the huang-ferrell model of mapk signaling. PLoS Comput. Biol. 2007, 3, 1819–1826. [Google Scholar] [CrossRef] [PubMed]
- Purutçuoğlu, V.; Wit, E. Estimating network kinetics of the mapk/erk pathway using biochemical data. Math. Probl. Eng. 2012, 2012, 1–34. [Google Scholar] [CrossRef] [Green Version]
- Blossey, R.; Bodart, J.F.; Devys, A.; Goudon, T.; Lafitte, P. Signal propagation of the mapk cascade in xenopus oocytes: Role of bistability and ultrasensitivity for a mixed problem. J. Math. Biol. 2012, 64, 1–39. [Google Scholar] [CrossRef] [PubMed]
- Wu, Y.L.; Cheng, Y.; Zhou, X.; Lee, K.H.; Nakagawa, K.; Niho, S.; Tsuji, F.; Linke, R.; Rosell, R.; Corral, J.; et al. Dacomitinib versus gefitinib as first-line treatment for patients with EGFR-mutation-positive non-small-cell lung cancer (ARCHER 1050): A randomised, open-label, phase 3 trial. Lancet Oncol. 2017, 18, 1454–1466. [Google Scholar] [CrossRef]
- Andrieux, D.; Gaspard, P. Fluctuation theorem and onsager reciprocity relations. J. Chem. Phys. 2004, 121, 6167–6174. [Google Scholar] [CrossRef] [PubMed]
- Andrieux, D.; Gaspard, P. Temporal disorder and fluctuation theorem in chemical reactions. Phys. Rev. E Stat. Nonlinear Soft Matter Phys. 2008, 77, 031137. [Google Scholar] [CrossRef] [PubMed]
- Gaspard, P. Fluctuation theorem for nonequilibrium reactions. J. Chem. Phys. 2004, 120, 8898–8905. [Google Scholar] [CrossRef] [PubMed]
- Szilárd, L. Über die entropieverminderung in einem thermodynamischen system bei eingriffen intelligenter wesen. Zeitschrift für Physik 1929, 53, 840–856. [Google Scholar] [CrossRef]
- Szilard, L. On the decrease of entropy in a thermodynamic system by the intervention of intelligent beings. Behav. Sci. 1964, 9, 301–310. [Google Scholar] [CrossRef] [PubMed]
- Schmick, M.; Liu, Q.; Ouyang, Q.; Markus, M. Fluctuation theorem for a single particle in a moving billiard: Experiments and simulations. Phys. Rev. E Stat. Nonlinear Soft Matter Phys. 2007, 76, 021115. [Google Scholar] [CrossRef] [PubMed]
- Schmick, M.; Markus, M. Fluctuation theorem for a deterministic one-particle system. Phys. Rev. E Stat. Nonlinear Soft Matter Phys. 2004, 70, 065101. [Google Scholar] [CrossRef] [PubMed]
- Chong, S.H.; Otsuki, M.; Hayakawa, H. Generalized green-kubo relation and integral fluctuation theorem for driven dissipative systems without microscopic time reversibility. Phys. Rev. E Stat. Nonlinear Soft Matter Phys. 2010, 81, 041130. [Google Scholar] [CrossRef] [PubMed]
- Mina, M.; Magi, S.; Jurman, G.; Itoh, M.; Kawaji, H.; Lassmann, T.; Arner, E.; Forrest, A.R.; Carninci, P.; Hayashizaki, Y.; et al. Promoter-level expression clustering identifies time development of transcriptional regulatory cascades initiated by erbb receptors in breast cancer cells. Sci. Rep. 2015, 5, 11999. [Google Scholar] [CrossRef] [PubMed]
- Xin, X.; Zhou, L.; Reyes, C.M.; Liu, F.; Dong, L.Q. Appl1 mediates adiponectin-stimulated p38 mapk activation by scaffolding the tak1-mkk3-p38 mapk pathway. Am. J. Physiol.-Endocrinol. Metab. 2011, 300, E103–E110. [Google Scholar] [CrossRef] [PubMed]
- Luo, L.F. Entropy production in a cell and reversal of entropy flow as an anticancer therapy. Front. Phys. China 2009, 8, 122–136. [Google Scholar] [CrossRef]
- Tsukada, M.; Ishii, N.; Sato, R. Stochastic automaton models for the temporal pattern discrimination of nerve impulse sequences. Biol. Cybern. 1976, 21, 121–130. [Google Scholar] [CrossRef] [PubMed]
- Ponmurugan, M. Generalized detailed fluctuation theorem under nonequilibrium feedback control. Phys. Rev. E Stat. Nonlinar Soft Matter Phys. 2010, 82, 031129. [Google Scholar] [CrossRef] [PubMed]
- Wang, G.M.; Reid, J.C.; Carberry, D.M.; Williams, D.R.; Sevick, E.M.; Evans, D.J. Experimental study of the fluctuation theorem in a nonequilibrium steady state. Phys. Rev. E Stat. Nonlinear Soft Matter Phys. 2005, 71, 046142. [Google Scholar] [CrossRef] [PubMed]
- Xiao, T.J.; Hou, Z.; Xin, H. Entropy production and fluctuation theorem along a stochastic limit cycle. J. Chem. Phys. 2008, 129, 114506. [Google Scholar] [CrossRef] [PubMed]
- Seifert, U. Stochastic thermodynamics, fluctuation theorems and molecular machines. Rep. Prog. Phys. 2012, 75, 126001. [Google Scholar] [CrossRef] [PubMed] [Green Version]
- Paramore, S.; Ayton, G.S.; Voth, G.A. Transient violations of the second law of thermodynamics in protein unfolding examined using synthetic atomic force microscopy and the fluctuation theorem. J. Chem. Phys. 2007, 127, 105105. [Google Scholar] [CrossRef] [PubMed]
- Berezhkovskii, A.M.; Bezrukov, S.M. Fluctuation theorem for channel-facilitated membrane transport of interacting and noninteracting solutes. J. Phys. Chem. B 2008, 112, 6228–6232. [Google Scholar] [CrossRef] [PubMed]
- Lacoste, D.; Lau, A.W.; Mallick, K. Fluctuation theorem and large deviation function for a solvable model of a molecular motor. Phys. Rev. E Stat. Nonlinear Soft Matter Phys. 2008, 78, 011915. [Google Scholar] [CrossRef] [PubMed]
- Porta, M. Fluctuation theorem, nonlinear response, and the regularity of time reversal symmetry. Chaos 2010, 20, 023111. [Google Scholar] [CrossRef] [PubMed] [Green Version]
- Collin, D.; Ritort, F.; Jarzynski, C.; Smith, S.B.; Tinoco, I., Jr.; Bustamante, C. Verification of the crooks fluctuation theorem and recovery of rna folding free energies. Nature 2005, 437, 231–234. [Google Scholar] [CrossRef] [PubMed]
- Sughiyama, Y.; Abe, S. Fluctuation theorem for the renormalized entropy change in the strongly nonlinear nonequilibrium regime. Phys. Rev. E Stat. Nonlinear Soft Matter Phys. 2008, 78, 021101. [Google Scholar] [CrossRef] [PubMed]
Figure 1.
Schematic of the relationship between the jth step to (j + 1)th step (left) and the −jth step to (−j − 1)th step (right) of a simple discrete channel. The left graph shows a signal transduction and its channel capacity is expressed by Cj. The right graph shows the reverse signal transduction and its channel capacity is expressed by C−j. In the reverse signal transduction, from the −jth step to (−j − 1)th step, qj transmits the signal to qj−1, but it may transmit the signal to qj−1* in error.
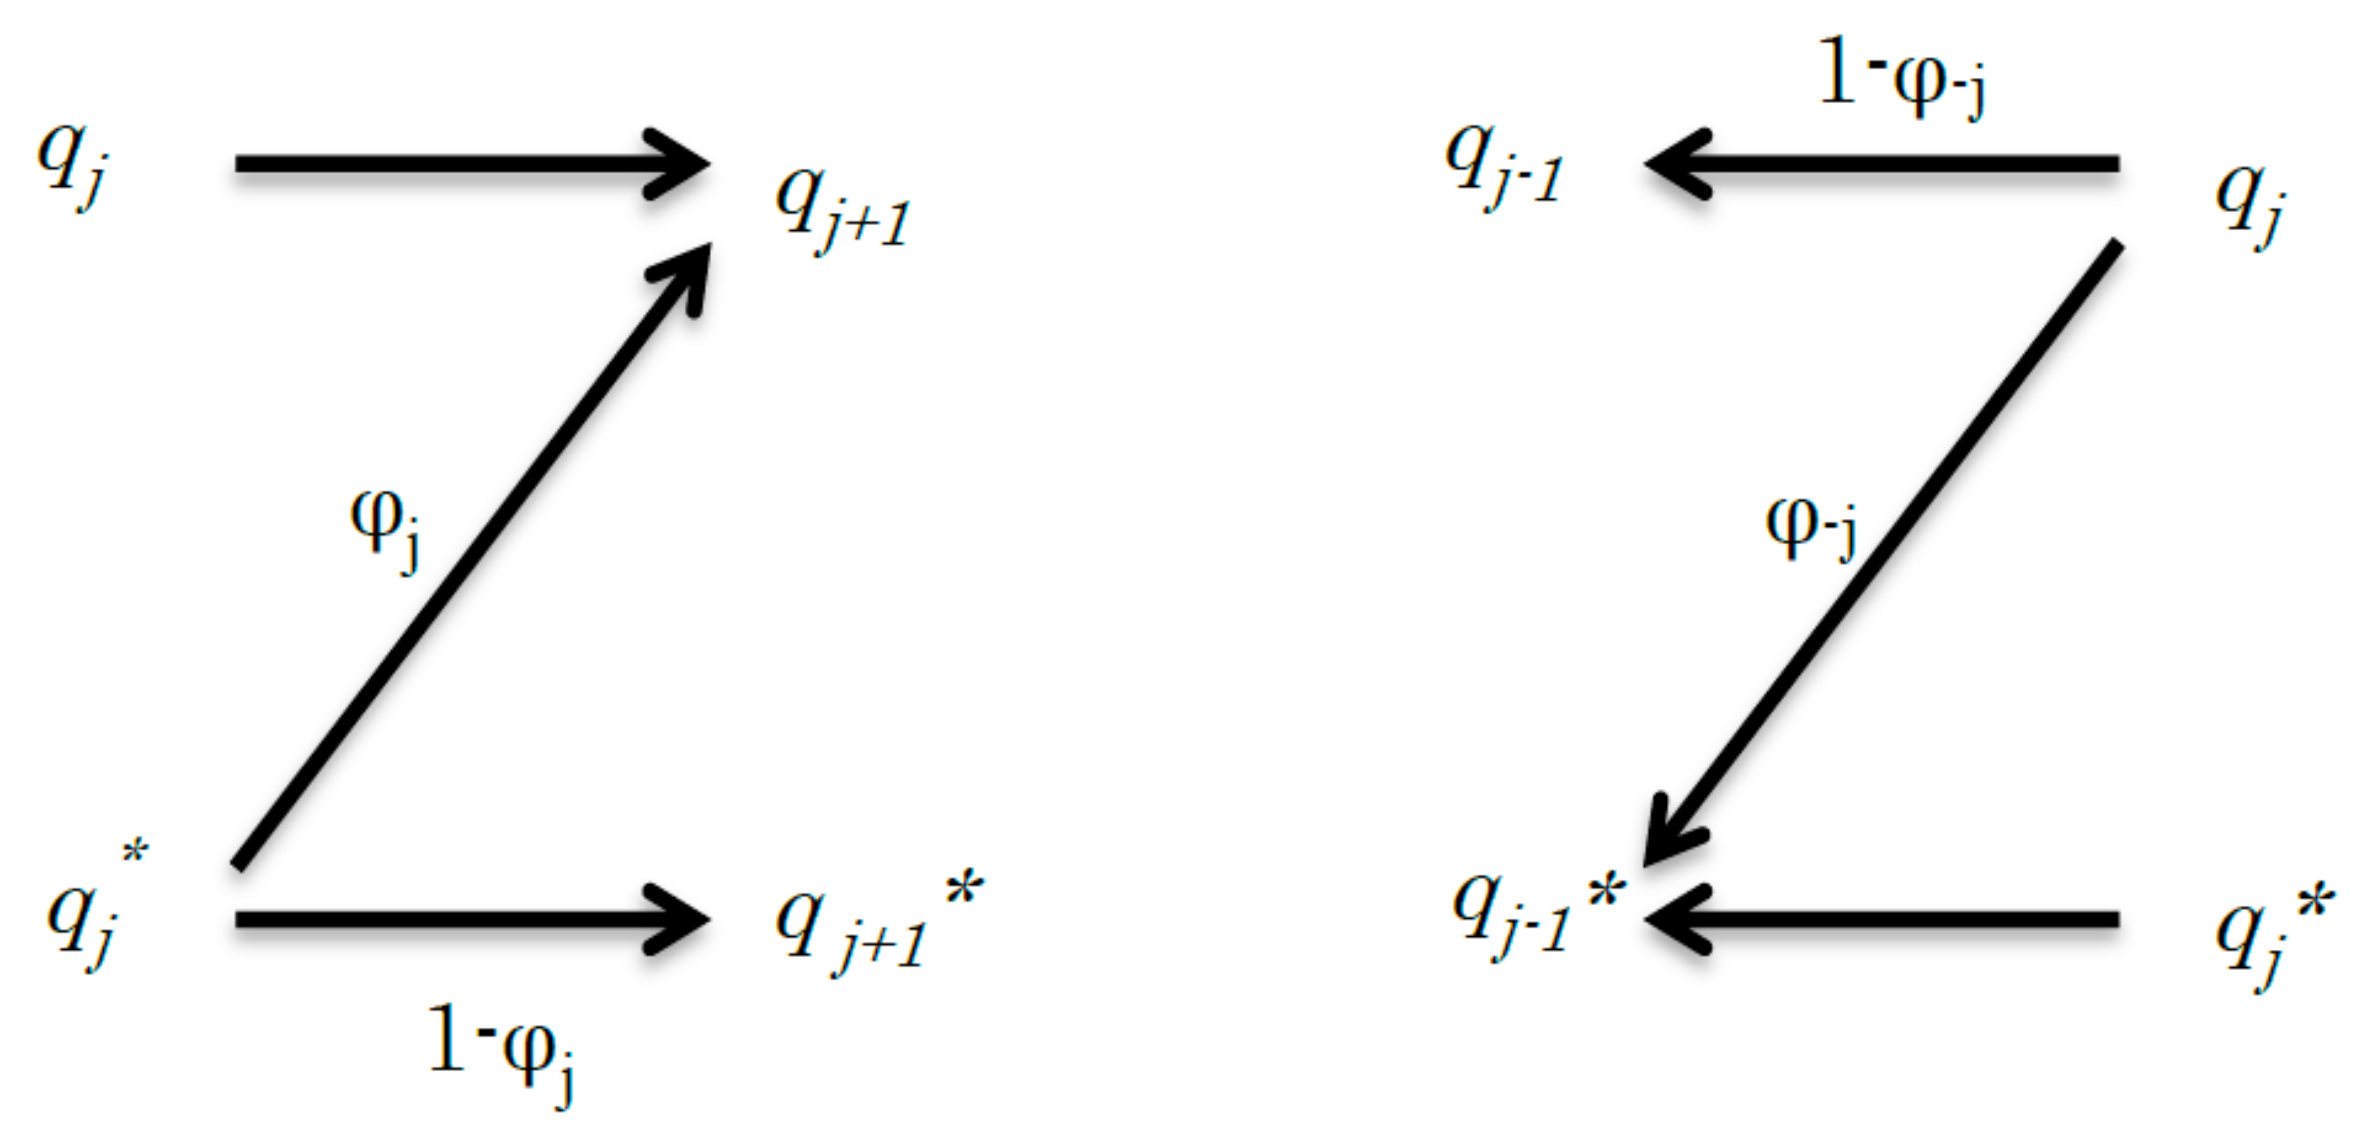
Figure 2.
Schematic showing a Szilard engine chain. The feedback controller measures the changes in concentration of signalling molecules. For the signal transduction, the controller opens the gate of the hypothetical boundary. The grey circles on the boundary represent the exchanger between ΔXj+1 and ΔXj+1*. The jth field recovers to the initial state.
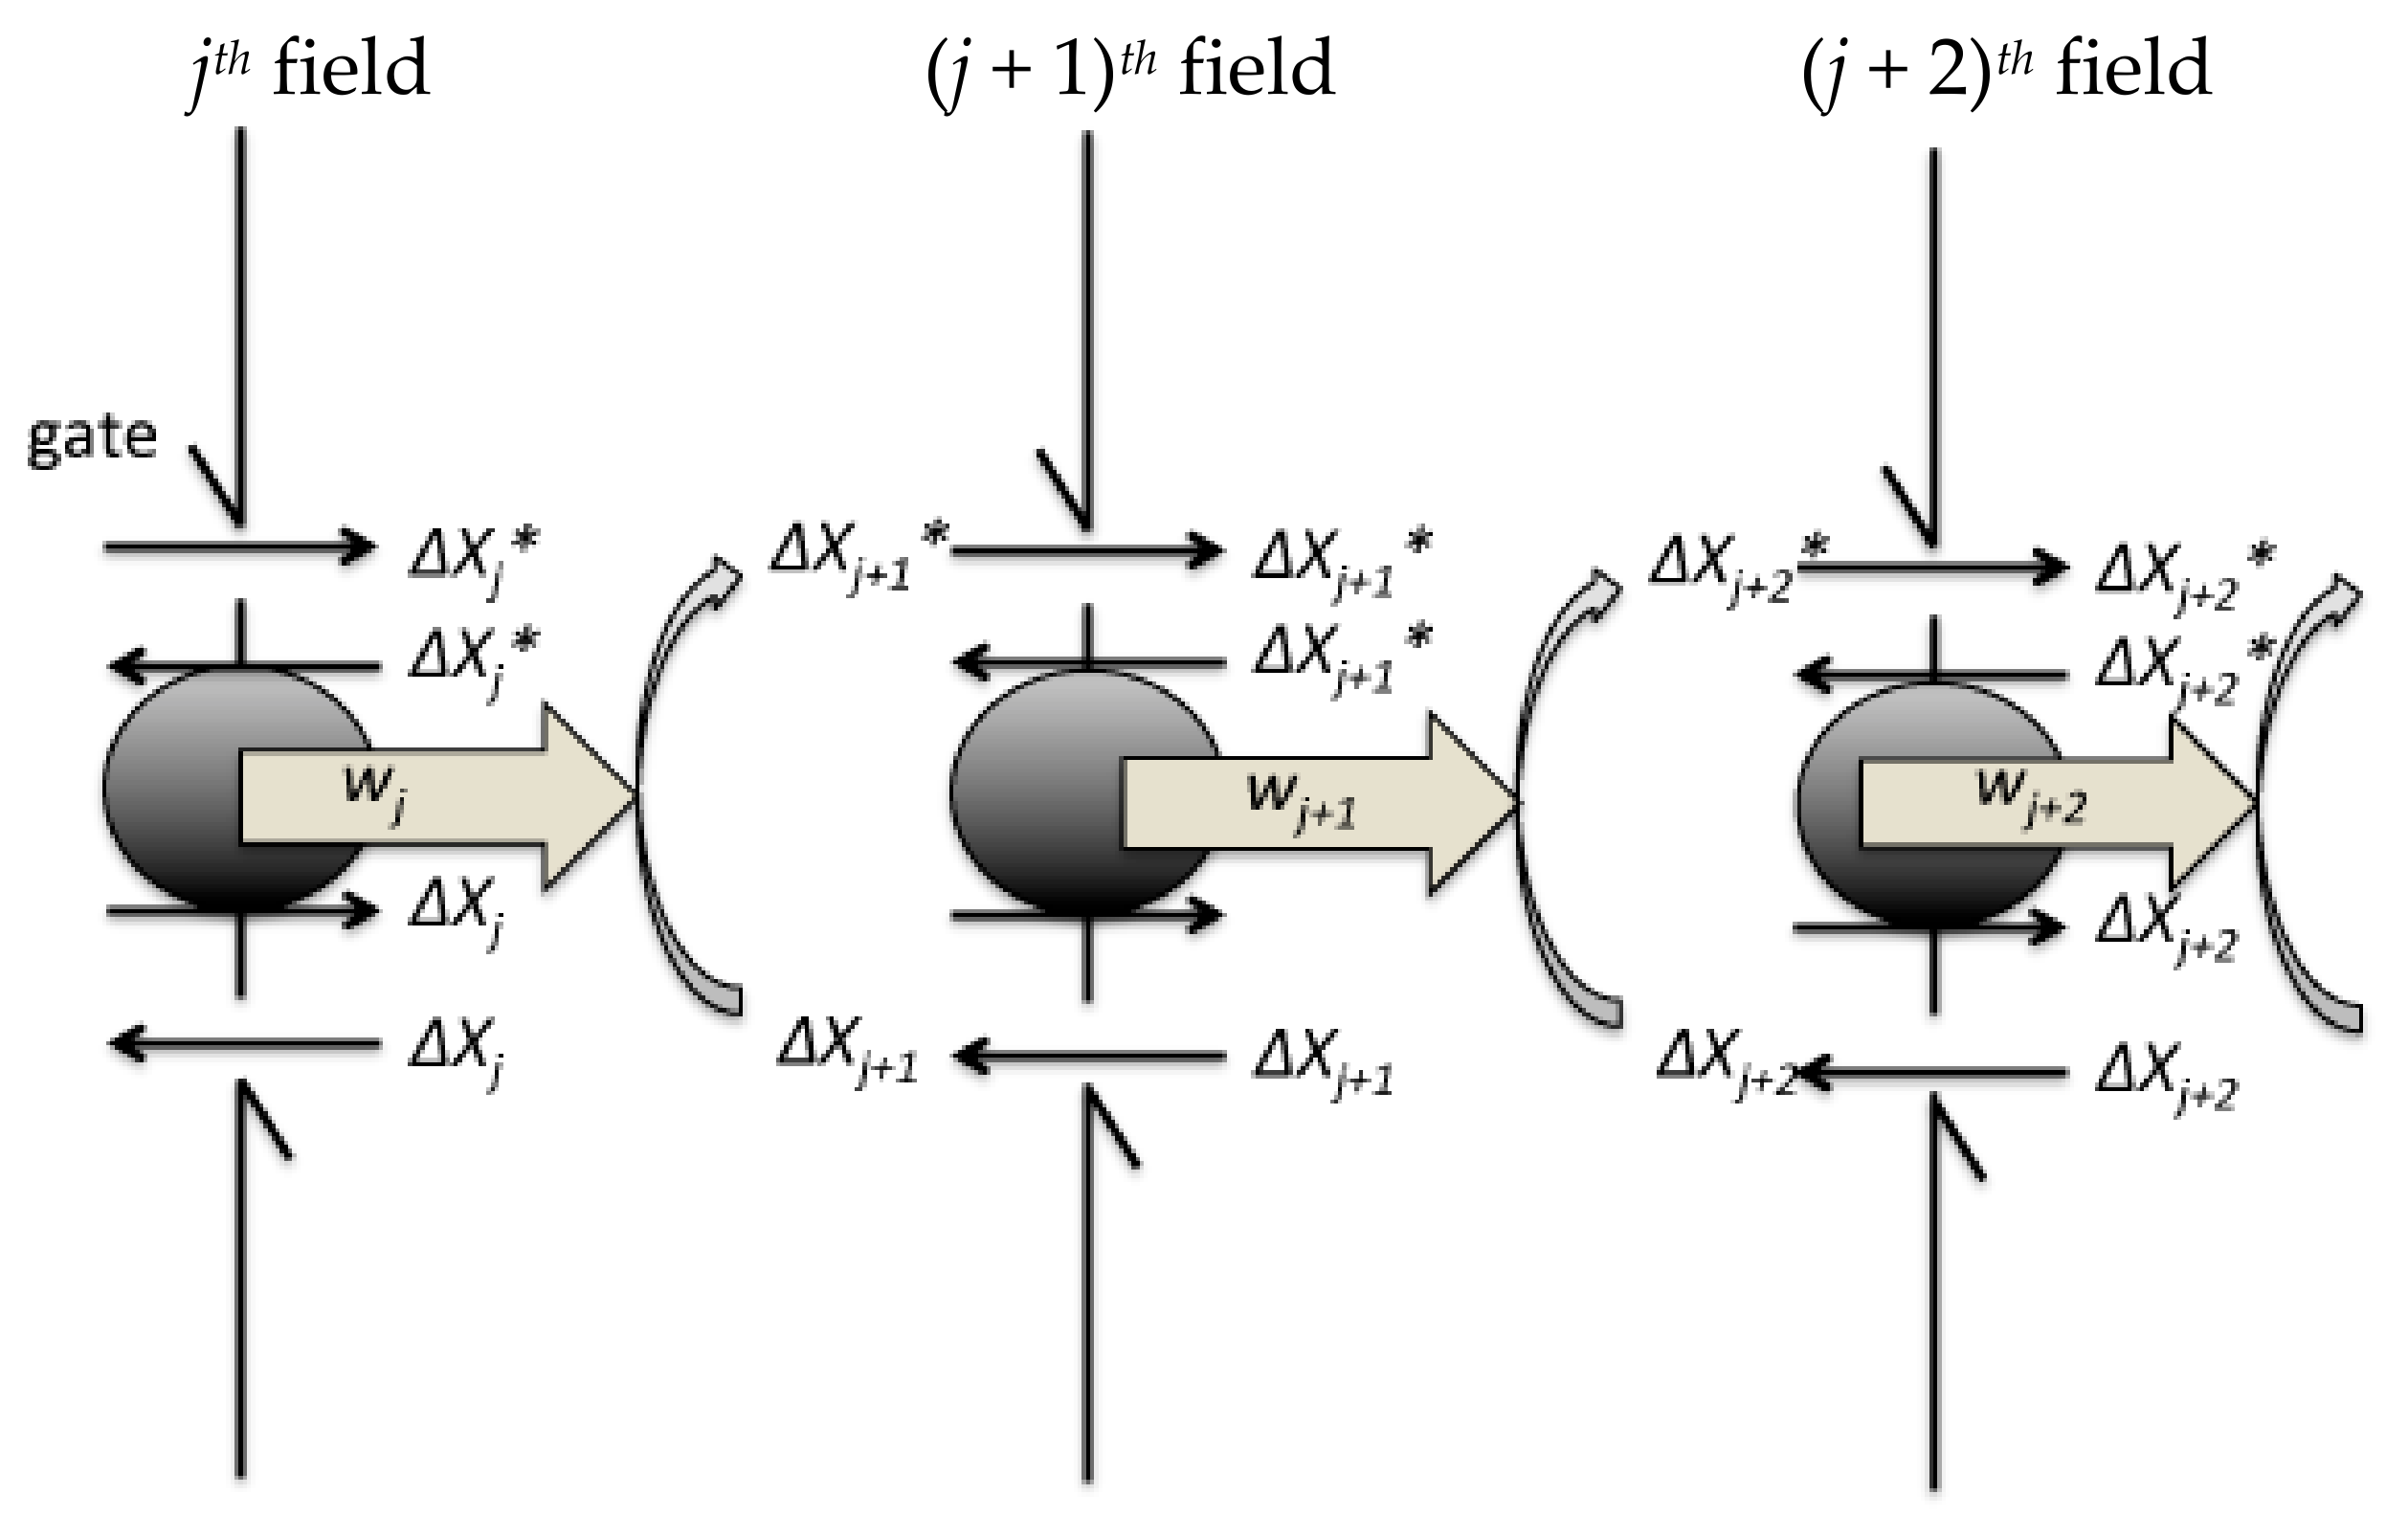
Figure 3.
A common time course of the jth cycle showing the concentration of Xj* during phosphorylation [36,37]. The vertical axis represents the concentration of Xj*. The horizontal axis denotes the duration (min or time unit). τj and τ−j denote the duration of the jth step and the reversible −jth step, respectively. Line Xj* = Xj*st denotes the Xj* concentration at the initial steady state before the beginning of the signal event.

© 2018 by the author. Licensee MDPI, Basel, Switzerland. This article is an open access article distributed under the terms and conditions of the Creative Commons Attribution (CC BY) license (http://creativecommons.org/licenses/by/4.0/).
Share and Cite
MDPI and ACS Style
Tsuruyama, T. Entropy in Cell Biology: Information Thermodynamics of a Binary Code and Szilard Engine Chain Model of Signal Transduction. Entropy 2018, 20, 617. https://doi.org/10.3390/e20080617
AMA Style
Tsuruyama T. Entropy in Cell Biology: Information Thermodynamics of a Binary Code and Szilard Engine Chain Model of Signal Transduction. Entropy. 2018; 20(8):617. https://doi.org/10.3390/e20080617
Chicago/Turabian StyleTsuruyama, Tatsuaki. 2018. "Entropy in Cell Biology: Information Thermodynamics of a Binary Code and Szilard Engine Chain Model of Signal Transduction" Entropy 20, no. 8: 617. https://doi.org/10.3390/e20080617
Note that from the first issue of 2016, this journal uses article numbers instead of page numbers. See further details here.