A Novel Geometric Dictionary Construction Approach for Sparse Representation Based Image Fusion


1
School of Information Engineering, Southwest University of Science and Technology, Mianyang 621010, China
2
Robot Technology Used for Special Environment Key Laboratory of Sichuan Province, Mianyang 621010, China
3
College of Automation, Chongqing University of Posts and Telecommunications, Chongqing 400065, China
4
School of Computing, Informatics, and Decision Systems Engineering, Arizona State University, Tempe, AZ 85287, USA
5
State Key Laboratory of Power Transmission Equipment and System Security and New Technology, Chongqing University, Chongqing 400044, China
*
Author to whom correspondence should be addressed.
Entropy 2017, 19(7), 306; https://doi.org/10.3390/e19070306
Submission received: 17 April 2017
/
Revised: 21 June 2017
/
Accepted: 26 June 2017
/
Published: 27 June 2017
(This article belongs to the Special Issue Information Theory in Machine Learning and Data Science)
Abstract
:Sparse-representation based approaches have been integrated into image fusion methods in the past few years and show great performance in image fusion. Training an informative and compact dictionary is a key step for a sparsity-based image fusion method. However, it is difficult to balance “informative” and “compact”. In order to obtain sufficient information for sparse representation in dictionary construction, this paper classifies image patches from source images into different groups based on morphological similarities. Stochastic coordinate coding (SCC) is used to extract corresponding image-patch information for dictionary construction. According to the constructed dictionary, image patches of source images are converted to sparse coefficients by the simultaneous orthogonal matching pursuit (SOMP) algorithm. At last, the sparse coefficients are fused by the Max-L1 fusion rule and inverted to a fused image. The comparison experimentations are simulated to evaluate the fused image in image features, information, structure similarity, and visual perception. The results confirm the feasibility and effectiveness of the proposed image fusion solution.
1. Introduction
High-quality images can help increase the accuracy and efficiency of image processing and related analysis. However, a single sensor cannot capture sufficient information in one scenario. For obtaining more information, image fusion techniques are used to combine multiple images from the same scenario. Now image fusion techniques are widely used in different areas, such as computer vision, medical diagnosis and treatment, and remote sensing. Various image fusion algorithms are proposed and used in diverse applications.
According to the spatial and transformative features of fusion domain, these methods could be categorized into two main categories: spatial-domain-based methods and transform-domain-based methods [1,2]. Spatial-domain-based methods directly choose clear pixels, blocks, or regions from source images to compose a fused image [3,4,5]. Some simple methods, such as averaging or max pixel schemes, are performed on single pixel to generate fused image. However, these methods may reduce the contrast and edge intensity of the fused result. In order to improve the quality of fused image, some advanced algorithms, such as block-based and region-based algorithms, were developed. Li et al. proposed a scheme by dividing images into blocks and chose the focused one by comparing spatial frequencies (SF) first; then, the fused results are produced by consistency verification [6,7]. Although block-based methods improve the contrast and sharpness of integrated image, they may cause a block effect in the integrated image [8,9].
Different from spatial-domain fusion methods, transform-domain methods transform source images into a few corresponding coefficients and transform bases first [10,11]. Then, the coefficients are fused and inverted to an integrated image. Multi-scale transform (MST) and wavelet based algorithms are conventional transform approaches applied to transform-domain-based image fusion [12,13,14], such as wavelet transform [15,16], shearlet [17,18], curvelet [19], dual tree complex wavelet transform [20,21], and nonsubsampled contourlet transform (NSCT) [22]. MST decomposition methods have attracted great attention in the image processing field, and are widely used in image fusion fields. However, MST-based methods need priori knowledge to select an optimal transform basis [23]. As each MST method has its own limitations, one MST method is difficult to fit all kinds of images [12].
Recently, sparse-representation based methods show great performance in image de-noising [24], image de-blurring [25], image target tracking [26,27], and image super-resolution [28,29]. Sparse-representation based methods decompose an image patch using a few number of bases or atoms of a fixed or trained dictionary.
In the image fusion field, a sparse-representation based method was first proposed by Yang and Li [30]. They applied the Discrete Cosine Transform(DCT) dictionary and orthogonal matching pursuit (OMP) method to sparse-representation based multi-focus image fusion. Liu et al. [31] presented a sparse-representation based method using an NSCT filter for image decomposition and the DCT dictionary for sparse coding of image patches. Yin et al. [32] used a dual-tree complex shearlet transform dictionary for image fusion, which enhanced the contrast of image details.
Previously mentioned methods used a fixed dictionary for spare representation. However, a fixed dictionary cannot adaptively change according to input images. As the dictionary is one of the most crucial parts in sparse representation, a trained dictionary according to input images has better performance in describing source images. Selecting a good over-complete dictionary is the main issue of a sparse representation-based image reconstruction and fusion techniques. Mostly, the DCT basis or wavelet basis are often used for an over-complete dictionary. Since such dictionaries formed with transform bases do not rely on input image data, they are fixed regardless of type of sensors, context of images, or applications. While a fixed dictionary can easily be implemented, their performance is somewhat limited depending on the type of data and application. To make a dictionary adaptive to input image data, a dictionary learning method has been developed by Aharon et al. [33]. Yin et al. [34] developed an image fusion method based on K-means generalized singular value decomposition (K-SVD) [33], which also explored the sparse parameter in image fusion. Wang et al. [35] proposed an approximate K-SVD-based sparse representation method for image fusion and exposure fusion to reduce computation costs in dictionary learning. To make the trained dictionary more informative, Kim et al. [36] proposed a compact dictionary learning method called joint clustering patches dictionary learning (JCPD). JCPD used image pixel clustering and principal component analysis (PCA) bases to train sub-dictionaries in dictionary construction. Fusion results showed that the detailed information from source images was perfectly reserved. Zhu et al. [9,37,38] presented an image patch clustering method and applied it to corresponding sub-dictionary training process. Their method improved the detailed features in medical image fusion. All of these sparse-representation based image fusion methods only used one dictionary for sparse coding of all image patches, which may cause redundancy in the constructed dictionary.
Geometric information, as one type of the most important image information, including edges, contours, and textures of image, can remarkably influence the quality of image perception [39,40]. This information can be used in patch classification as a supervised dictionary prior to improving the performance of the trained dictionary [41,42]. In this paper, a geometric classification based dictionary learning method is proposed for sparse-representation based image fusion. Instead of grouping the pixels of images, the proposed geometric classification method groups image blocks directly by the geometric similarity of each image block. Since a sparse-representation based fusion method uses image blocks for sparse coding and coefficient fusion, extracting underlying geometric information from image-block groups is an efficient way to construct a dictionary. Moreover, the geometric classification can group image blocks based on edge and sharp line information for dictionary learning, which can improve the accuracy of sparse representation. This paper has two main contributions.
- A geometric-information based classification method is proposed and applied to a sub-dictionary learning of image patches. The proposed classification method can accurately split source image patches into different groups for sub-dictionary learning based on the corresponding geometry features. Sub-dictionary bases extracted from each image-patch group contain the key geometry features of source images. These extracted sub-dictionary bases are trained to form informative and compact sub-dictionaries for image fusion.
- A dictionary combination method is developed to construct an informative and compact sub-dictionary. Each image patch of a fused image is composed of corresponding source image patches using a constructed-sub-dictionary (CSD). According to the classification of geometry features, each source image patch is trained and categorized into a group of sub-dictionaries. Corresponding image patches, that appear at the same place of the two source images, at most have two groups of sub-dictionary. Redundant geometric information of source image patches is eliminated.
2. Geometry-Based Image Fusion Framework
This section presents the proposed image fusion method. The proposed method consists of geometric similarity based sub-dictionary learning and sparse representation based image fusion processes. In the sub-dictionary learning step, images are split into image patches first. The image patches are clustered into a few groups based on the geometric similarity. The K-SVD method is used in sub-dictionary training. In the image fusion step, image patches of source images are sparse coded using an assembled dictionary. The assembled dictionary consists of sub-dictionaries, which are corresponding to the groups of input image patches. When image patches are sparse coded, the coded coefficients are fused by using the Max-L1 fusion rule [30].
2.1. Dictionary Learning
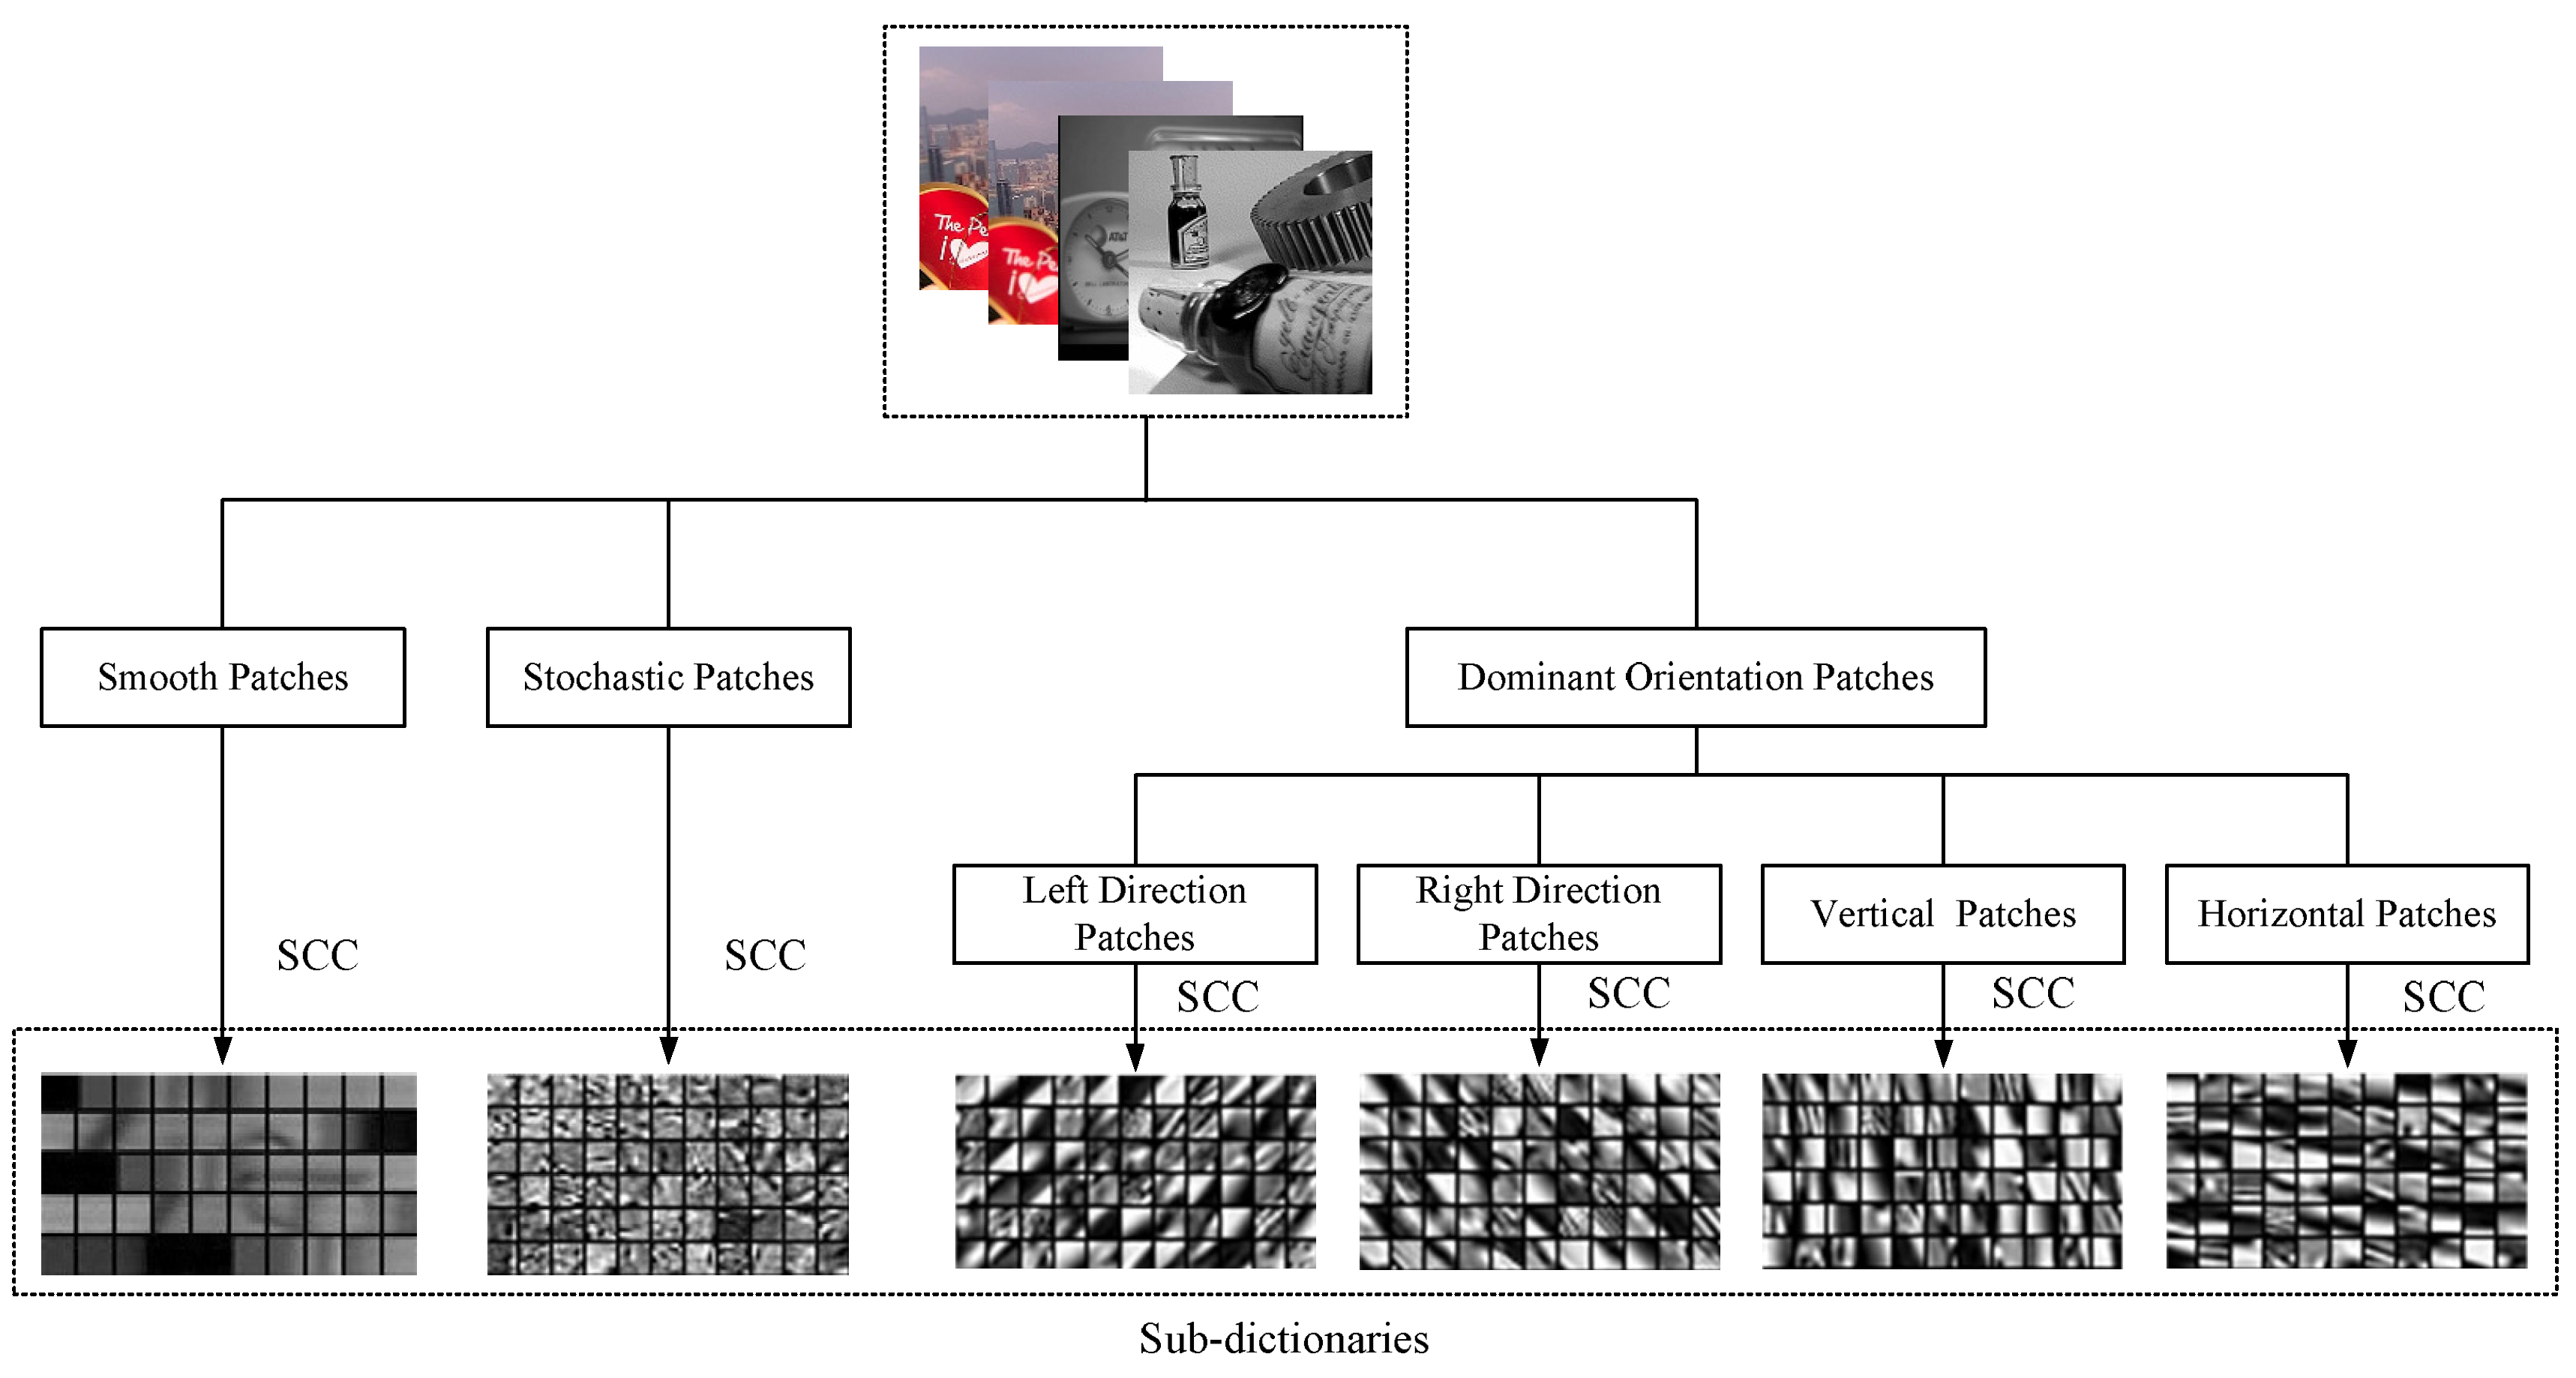
The proposed dictionary learning method is shown in Figure 1, in which source images are split into 8 × 8 image patches. In the proposed method, source images are split into 8 × 8 image patches by sliding windows. These image patches are transformed to vectors of 1 × 64 in a linewise direction and normalized between 0 and 1. Then, these image patches can be clustered into a few groups for sub-dictionary learning. These sub-dictionaries can preserve key information of each image patch group. There are six specific groups of sub-dictionaries in this paper.
The geometric image patches clustering method can classify all of the image patches into three main groups, such as smooth, dominant orientation, and stochastic patch group. In the proposed method, image patches are classified into smooth and non-smooth first. A variance based method is proposed for grouping smooth and non-smooth patches. For image patches , the corresponding variances are . If the variance of ith image patch meets , the ith image patch is considered as a smooth image patch.
In this way, image patches can be classified into smooth and non-smooth patches. Non-smooth patches can be further clustered into dominant orientation and stochastic patch group, by calculating the dominant orientations of patches. The dominant orientation estimation method is based on the singular value decomposition (SVD). The gradient of an image pixel can be calculated by Equation (1).
where is the gradient map.
The gradient map of an image patch , which consists of n pixels, is shown in Equation (2):
where is the gradient map of .
Performing an SVD on can obtain . Extracting the first column of V can obtain the dominant orientation of the gradient field . The second column in V is the subdominant orientation of the gradient field. If the corresponding singular values of and are remarkably different, the dominant measure [43] R can be calculated using Equation (3):
After SVD decomposition, and are row 1-column 1 and row 2-column 2 values of singular value matrix V, respectively. If R is smaller than a significance level threshold , the image patch is considered as a stochastic pattern.
In order to differentiate the geometric information of dominant orientation patches, the dominant orientation image patches can be further classified to different groups according to the directions of image patches. The direction d of dominant orientation image patches can be estimated using gradient field , which is shown in Equation (4):
In the proposed dictionary learning framework, dominant orientation image patches are classified into four groups, such as horizontal, right-direction, vertical, and left-direction patch group that correspond to 0, 45, 90, and 135 degree group, respectively. In Equation (4), when d is close to the horizontal, right-direction, vertical, or left-direction patch group, d is clustered into the corresponding group. For each group, a sub-dictionary can be trained by the stochastic coordinate coding (SCC) algorithm shown in Algorithm 1, which is extremely fast. H represents a Hessian matrix of the objective function. To obtain the learning rate, SCC uses the Hessian matrix of objective function. According to the second order stochastic gradient descent, it should inverse the Hessian matrix as the learning rate [44]. z is obtained by using the simultaneous orthogonal matching pursuit (SOMP) algorithm shown in Algorithm 2 to sparse code image patches based on dictionary D. The trained sub-dictionaries for different geometric groups are shown at the bottom of Figure 1.
In the SOMP algorithm, K is the sum of image patch x and sparse coefficient z, is k-th image patch, and is k-th sparse coefficient. In this paper, it assumes that the source images are all noise free. Thus, a small global error is set, i.e., .
| Algorithm 1 SCC Algorithm. |
| Input: Image patches of Wth cluster Output: Sub-dictionary , and for Initialize , , and for for to ∂ do for to n do Get image patch Update via one or a few steps of coordinate descent: Update the Hessian matrix and the learning rate: Update the support of the dictionary via SGD (Stochastic Gradient Descent): if then Set end if end for end for |
| Algorithm 2 SOMP Algorithm. |
| Input: Dictionary D, image patches , , threshold , an empty matrix Output: Sparse coefficients Initialize the residuals , for , set iteration counter . Select the index which indicates the next best coefficient atom to simultaneously provide good reconstruction for all signals by solving: . Update sets . Compute new coefficients (sparse representations), approximations, and residuals as: , for , , for , , for . Increase the iteration counter , if , go back to step 2. |
2.2. Image Sparse Coding and Fusion
When all image-patch groups are trained, source images can be fused by using the trained sub-dictionaries. The proposed image sparse-representation and fusion method are shown in Figure 2. In the proposed solution, the fused image patch can be obtained by corresponding sub-dictionaries. It is an efficient way to decrease the size of learned dictionaries. All image patches are clustered into six groups. Any two aligned image patches of source images at most belong to two groups. Even if two aligned image patches belong to the same group, two corresponding sub-dictionaries are different. Since one group only has a sub-dictionary, it only needs two sub-dictionaries to represent all information of two image blocks.
The proposed fusion method uses sliding windows and sets overlap as six, so the splitting overlap of source images has six image patches. Suppose two source images for fusion have already been split into image patches. According to the classification method mentioned in the previous section, all of these image patches are clustered into a few groups. The pair of image patches from the same location of source images are sparse coded by using a CSD. In accordance with the classified image patch groups, one CSD of two corresponding source image patches at most consists of two sub-dictionaries. The CSD construction algorithm shown in Algorithm 3 combines the corresponding sub-dictionaries of two source image patches to obtain dictionary D.
When all of the CSDs are constructed, any pair of source image patches can be sparse coded by using the corresponding CSD and SOMP algorithm. Assume that there are K registered source images, with size of . The Max-L1 fusion rule takes the following steps.
- Step 1: Use the sliding window technique to divide each source image , from left-top to right-bottom, into patches of size , i.e., the size of the atom in the dictionary. These image patches are vectorized to image pixel vectors in the linewise direction. The obtained image pixel vectors only have one dimension.
- Step 2: For the ith image patch of one source image , it can be sparse coded using the trained dictionary D.
- Step 3: When all of the image patches are sparse coded, the corresponding image patches of each image use Equation (5) to do fusion:where is a sparse coefficient corresponding to the i-th image patch in j-th image .
- Step 4: Fused coefficients are inversely transformed to fused image pixel vectors, using Equation (6), and transform these vectors back to the fused image patches. Then, it reconstructs the fused image by using fused image patches. The dictionary D in Equation (6) is the same as dictionary D in Algorithm 3:
| Algorithm 3 CSD Construction Algorithm. |
| Input: Sub-dictionaries , image patches for fusion and Output: CSD D Figure out sub-dictionaries , , that correspond to image patch groups of and . ifthen Set else Set end if |
3. Experiments and Analyses
To test the efficiency, the proposed image fusion approach is applied to multi-focus, medical, and visible-infrared images, respectively.
- Twenty pairs of size multi-focus images are obtained from the Lytro-multi-focus data-set http://mansournejati.ece.iut.ac.ir.
- Thirty pairs of medical images are from www.med.harvard.edu/aanlib/home.html. All of them are size.
- Ten pairs of visible-infrared images are obtained from from www.quxiaobo.org consisting of four and six image pairs.
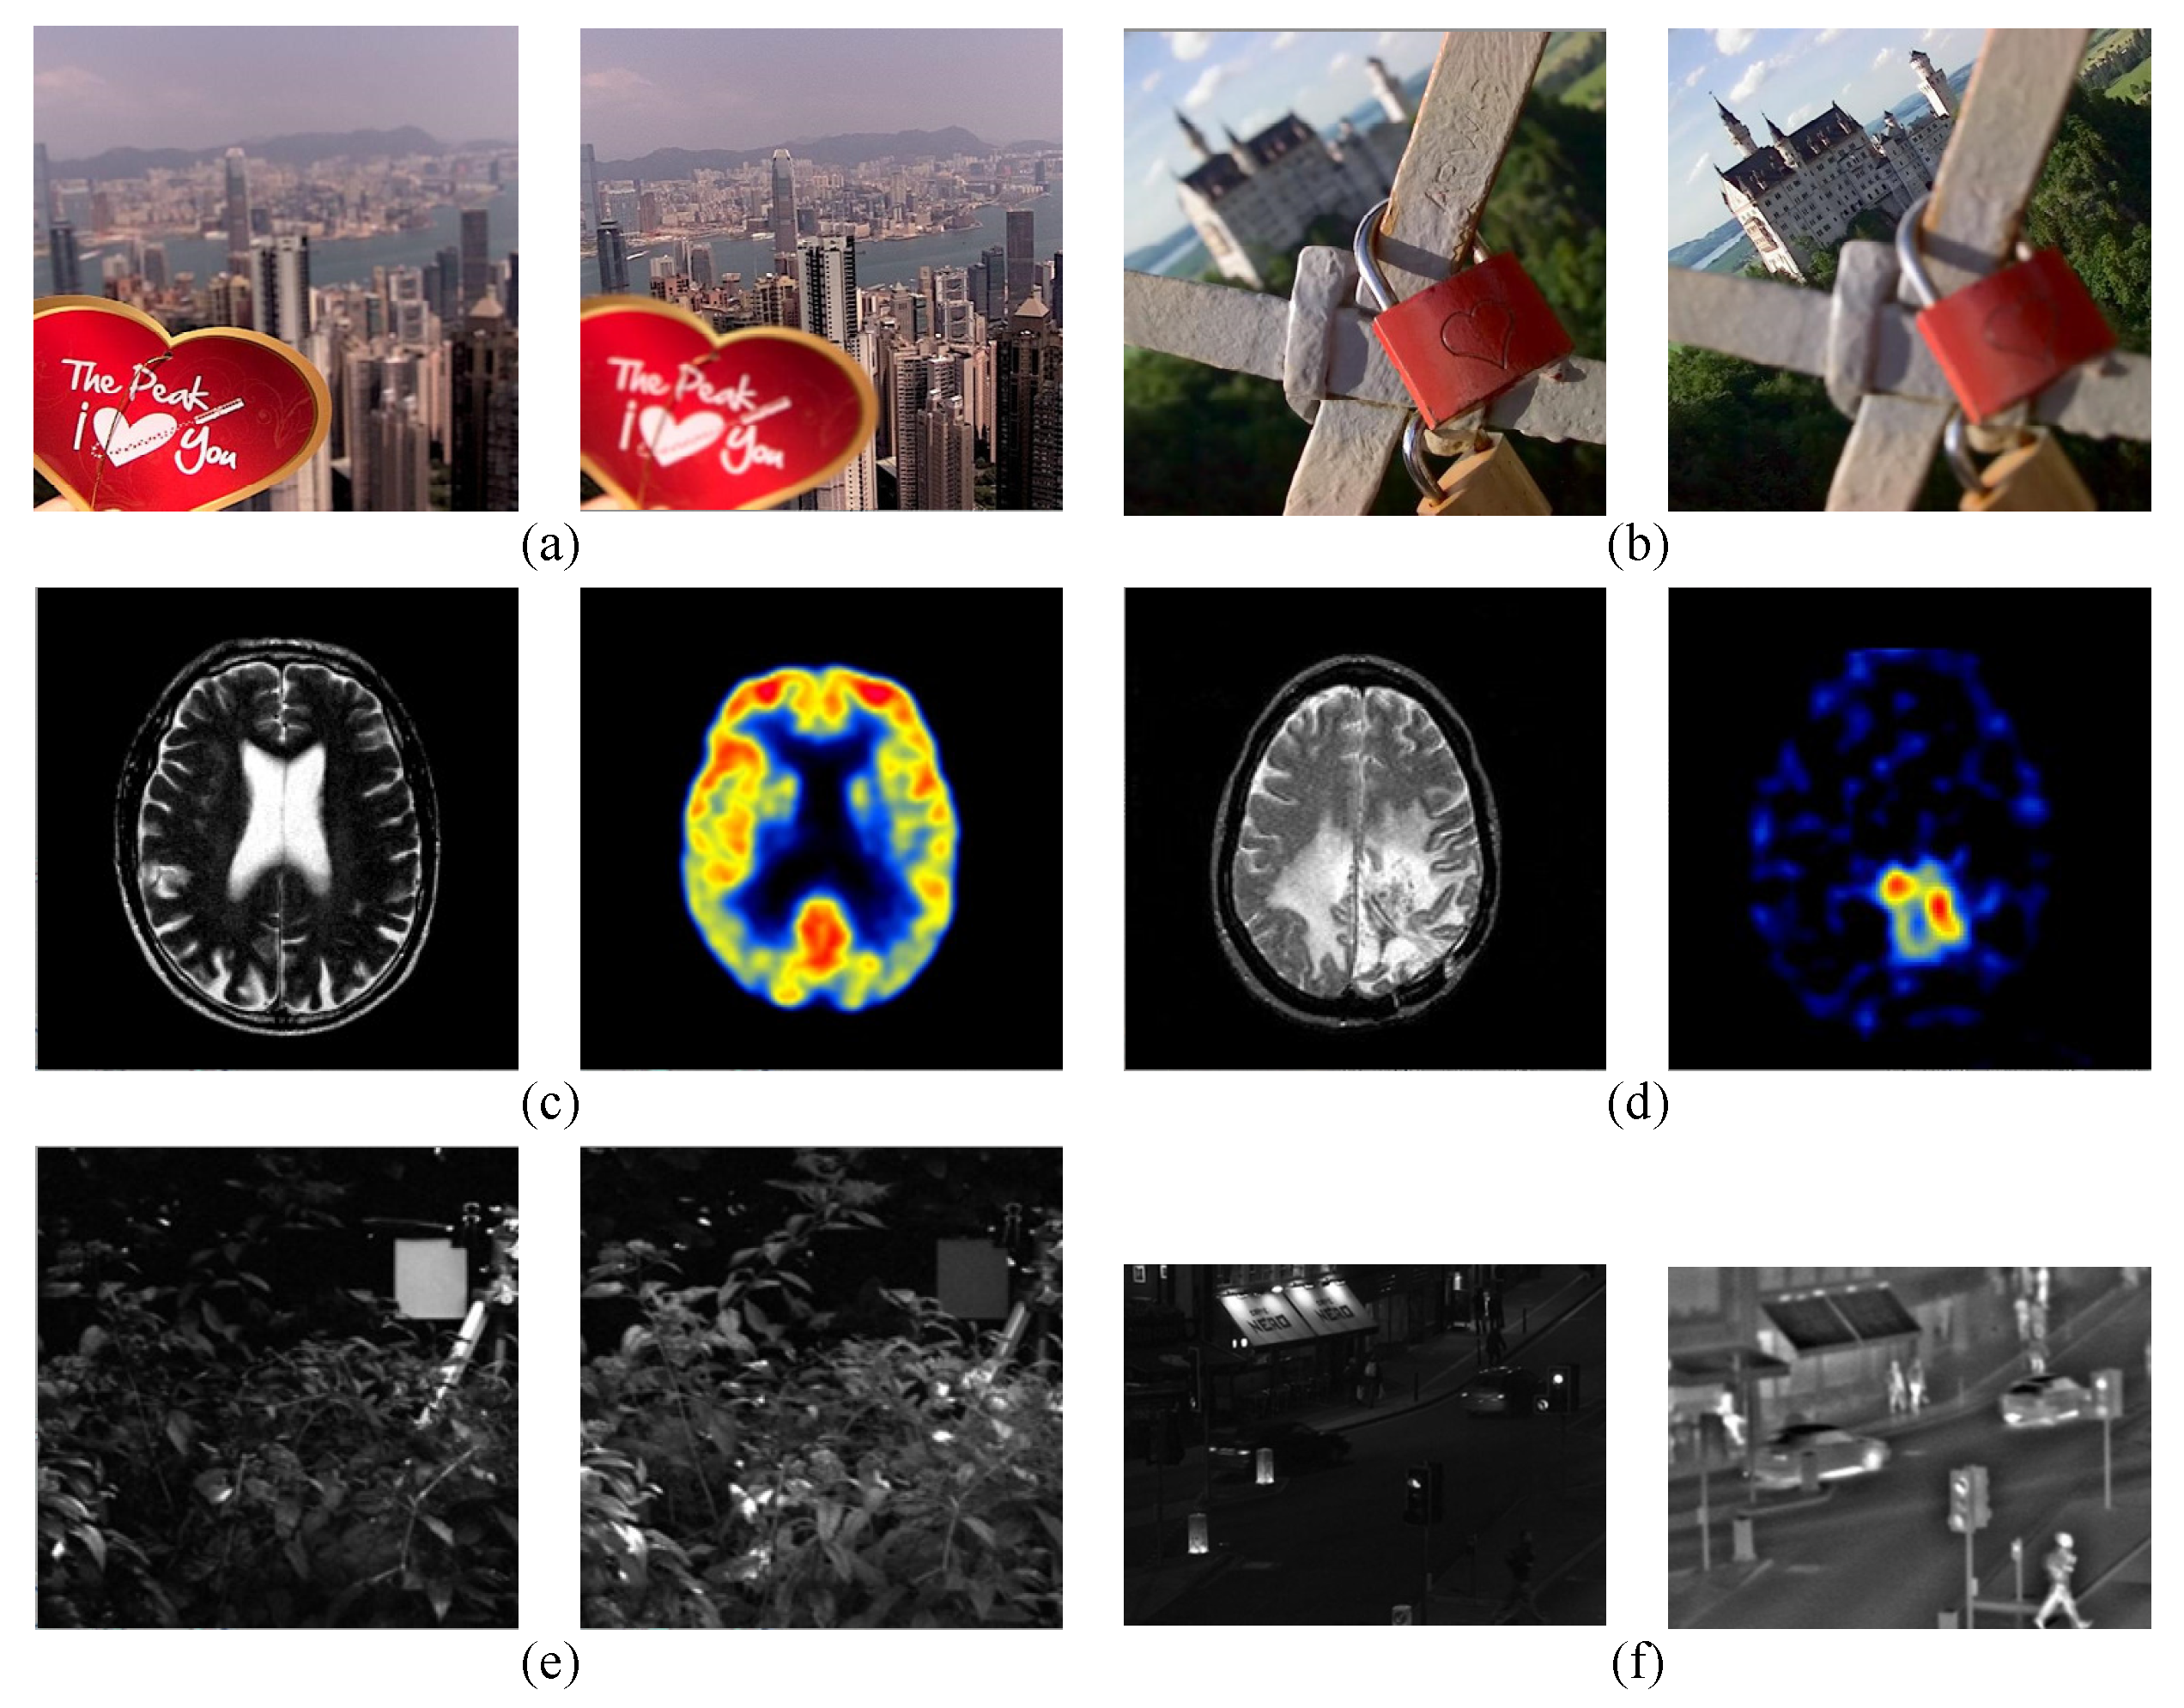
Figure 3a–f show the selected sample pairs of multi-focus, medical, and visible-infrared images, respectively.
This paper assumes that the input image pairs are precisely co-aligned. All image pairs are from the standard library. They have the same size. The proposed solution can also be applied to multiple images. In this section, one experiment of each image type is chosen and presented respectively in the following sections. To show the efficiency of the proposed method, the state-of-the-art dictionary learning based sparse-representation fusion approaches K-SVD and JCPD , which were proposed by Li et al. in 2012 [45] and Kim et al. in 2016 [36], respectively, are used for comparison. The experiments are evaluated by both subjective and objective assessments. Five popular image fusion quality metrics are used in this paper for the quantitative evaluation. The larger the metric value is, the better the performance is. The patch size of all sparse-representation-based methods including the proposed method are set to . To avoid blocking artifacts, all experiments use the sliding window scheme [36,45,46]. The overlapping region of the sliding window is set to six pixels in each vertical and horizontal direction of all experiments. All experiments are performed using a 2.60GHz single processor of an Intel(R) Core(TM) i7-4720HQ CPU Laptop with 12.00GB RAM. To compare fusion results fairly, all experiments in this paper are programmed by Matlab code in a Matlab 2014a environment.
3.1. Objective Evaluation Methods
Five mainstream objective evaluation metrics are implemented for the quantitative evaluation. These metrics include edge retention () [47], mutual information (MI) [48], visual information fidelity (VIF) [49],the Yang proposed fusion metric () [50,51], and the Chen–Blum metric () [51,52]. The above five solutions are classical approaches used in multi-focus, multi-modality medical, and infrared-visible image fusion. is the image feature-based metric. MI is the information theory-based metric. is the image structural similarity-based metric. and VIF are human perception inspired fusion metrics. According to objective assessment [51,53,54], these metrics can objectively evaluate the fused image in image feature, information, structure similarity, and visual perception. Thus, our paper chooses these metrics. For the fused image, the sizes of , MI, VIF, , and become bigger, and the corresponding fusion results are better.
3.1.1. Mutual Information
MI for images can be formalized as Equation (7):
where L is the number of gray-level, is the gray histogram of image A and F. and are edge histogram of image A and F. Edge histogram is used to present the edge information of image [48]. MI of the fused image can be calculated by Equation (8):
where represents the value of input image A and fused image F; represents the value of input image B and fused image F.
3.1.2.
metric is a gradient-based quality index to measure how well the edge information of source images is conducted to the fused image. It is calculated by:
where , and are the edge strength and orientation preservation values at location (i,j). can be computed similarly to . and are the weights of and , respectively.
3.1.3. Visual Information Fidelity
is the novel full reference image quality metric. quantifies the mutual information between the reference and test images based on the Natural Scene Statistics (NSS) theory and the Human Visual System (HVS) model. It can be expressed as the ratio between the distorted test image information and the reference image information, and the calculation equation of is shown in Equation (10):
where and represent the mutual information, which are extracted from a particular subband in the reference and the test images, respectively. Here, subband means the frequency of human eye sensory. Thus, this subband is used to evaluate the visual performance objectively [49,55]. denotes N elements from a random field, and and are visual signals at the output of HVS model from the reference and the test images, respectively.
To evaluate the VIF of fused image, an average of VIF values of each input image and the integrated image is proposed [49]. The evaluation function of VIF for image fusion is shown in Equation (11):
where is the value between input image A and fused image F; is the value between input image B and fused image F.
3.1.4.
3.1.5.
The Chen–Blum metric is a human perception inspired fusion metric. The Chen–Blum metric consists of five steps:
The first step is filtering image in the frequency domain. is transformed to the frequency domain and gets . Filtering by the contrast sensitive function (CSV) [52,56] filter , where . In this image fusion metric, is in polar form. can be obtained by .
In the second step, local contrast is computed. Considering the band-pass filters of a pyramid transform, which can be obtained as the difference of two neighboring low-pass filters. For the metric, Peli’s contrast C is used in this paper, and it can be defined as:
A common choice for would be a Gaussian kernel that is shown as follows:
where k and k + 1 stand for two neighboring low-pass filters .
In the third step, the masked contrast map for input image is calculated as:
Here, and Z are real scalar parameters that determine the shape of the nonlinearity of the masking function [52].
In the fourth step, the saliency map of can be calculated by Equation (16):
The information preservation value is computed as Equation (17):
In the fifth step, the Global quality map can be calculated:
Then, the value of can be obtained by averaging the global quality map:
3.2. Image Quality
To show the efficiency of proposed method, the comparison of fused images is provided. It compares the quality of the fused image based on visual effects, the accuracy of focused region detection, and the objective evaluations.
3.2.1. Multi-Focus Comparison
Figure 4a,b are the source multi-focus images. To show the details of the fused image, two image blocks are highlighted and magnified, which are marked by red and blue frames, respectively. The image block in the red frame is out of focus in Figure 4a, and the image block in the blue frame is out of focus in Figure 4b. The corresponding image blocks in blue and red frames are totally focused in Figure 4a,b, respectively. Figure 4c–e show the fused images of K-SVD, JCPD, and the proposed method, respectively.
The difference and performance of the algorithms to the fused images by three different methods are difficult to figure out visually. In order to evaluate of fusion performances objectively, , MI, VIF, , and are also used as image fusion quality measures. The fusion results of multi-focus images using three different methods are shown in Table 1.
The best results of each evaluation metric are highlighted by bold-face in Table 1. According to Table 1, the proposed method has the best performance in all five types of evaluation metrics. Particularly, for the objective evaluation metric , the proposed method obtains higher results than other two comparison image fusion methods. Since is a gradient-based quality metric to measure how well the edge information of source images is conducted to the fused image, it means that the proposed method can get a better fused image with edge information.
3.2.2. Medical Comparison
The “brain” images are a pair of PET (Positron Emission Tomography) and MRI (Magnetic Resonance Image) images shown in Figure 5a,b, respectively. PET images show the image of brain slices that produces a 3D image of functional processes in the human body. MRI images also show the image of brain slices that contain clear information of soft tissues. K-SVD, JCPD and the proposed method are employed to merge PET and MRI images into a clear image with soft tissues and functional processes information. The corresponding fusion results are shown in Figure 5c–e, respectively. Figure 5f–k show the enlarged details in red and green frames of the fused images in Figure 5c–e, respectively. Three fused images of different approaches have high quality in details, contrast, sharpness, and brightness. Table 2 shows the objective evaluations of fusion results. Compared with K-SVD and JCPD, the proposed method gets the largest values in all five objective evaluations.
3.2.3. Visible-Infrared Comparison
The proposed solution is used to fuse two sample images from the same scenario of the downtown street scene. One is a visible image and the other one is an infrared image shown in Figure 6a,b, respectively. In Figure 6a,b, the walking person is marked in the red frame and the letters in the shade marked in the blue frame are dark, respectively. The fused images of K-SVD, JCPD and proposed method shown in Figure 6c–e are compared. The enlarged details in the red and blue frames of the fused images in Figure 6c–e are shown in Figure 6f–k, respectively. The walking person and the letters in the shade are clear in all three fused images. The objective evaluations of each visible-infrared image fusion solution are demonstrated in Table 3. Similarly, the proposed solution has the best performances in all five objective evaluations.
4. Conclusions
This paper proposes a novel sparse-representation based image fusion framework, which integrates geometric dictionary construction. A geometric image patch classification approach is presented to cluster image patches from different source images based on the similarity of image geometric structure. A few compact and informative sub-dictionaries are extracted from each image patch cluster by SCC. The extracted sub-dictionaries are combined into a dictionary for sparse representation. Then, image patches are sparsely coded into coefficients by the trained dictionary. To obtain better edge and corner details of fusion results, the proposed solution also chooses image block size adaptively and selects optimal coefficients during the image fusion process. The sparsely coded coefficients are fused by the Max-L1 rule and inverted to the fused image. The proposed method is compared with existing mainstream sparse-representation based methods in three aspects, including multi-focus, medical, and visible-infrared comparison. The experimentation results prove that the proposed method has the best performance in all three image scenarios. It means that geometric information of the source image can not only reduce the size of the learned dictionary efficiently and effectively, but also obtain a high-quality fused image. In the future, it will explore more details in geometric information to enhance fusion performance. Denoising, inpainting, and other image processing techniques will be integrated into the current solution.
Acknowledgments
We would like to thank the supports by National Natural Science Foundation of China (61633005, 61501385). This work was also supported by the Science and Technology Planning Project of Sichuan Province (Grant Nos. 2016JY0242, 2016GZ0210), and the Foundation of the Southwest University of Science and Technology (Grant Nos 15kftk02, 15kffk01).
Author Contributions
In this paper, Kunpeng Wang designed the proposed algorithm and write this paper; Guanqiu Qi participated the algorithm designation and programmed the proposed method. Zhiqin Zhu participated the algorithm design, algorithm programming and paper writing processes; Yi Chai provided technical support and revised the paper. All authors have read and approved the final manuscript.
Conflicts of Interest
The authors declare no conflict of interest.
References
- Li, S.; Kang, X.; Hu, J.; Yang, B. Image matting for fusion of multi-focus images in dynamic scenes. Inf. Fusion 2013, 14, 147–162. [Google Scholar] [CrossRef]
- Zhu, Z.; Qi, G.; Chai, Y.; Li, P. A Geometric Dictionary Learning Based Approach for Fluorescence Spectroscopy Image Fusion. Appl. Sci. 2017, 7, 161. [Google Scholar] [CrossRef]
- Li, H.; Chai, Y.; Li, Z. A new fusion scheme for multifocus images based on focused pixels detection. Mach. Vis. Appl. 2013, 24, 1167–1181. [Google Scholar] [CrossRef]
- Nejati, M.; Samavi, S.; Shirani, S. Multi-focus image fusion using dictionary-based sparse representation. Inf. Fusion 2015, 25, 72–84. [Google Scholar] [CrossRef]
- Li, H.; Liu, X.; Yu, Z.; Zhang, Y. Performance improvement scheme of multifocus image fusion derived by difference images. Signal Process. 2016, 128, 474–493. [Google Scholar] [CrossRef]
- Li, S.; Yang, B. Multifocus image fusion using region segmentation and spatial frequency. Image Vis. Comput. 2008, 26, 971–979. [Google Scholar] [CrossRef]
- Keerqinhu; Qi, G.; Tsai, W.; Hong, Y.; Wang, W.; Hou, G.; Zhu, Z. Fault-Diagnosis for Reciprocating Compressors Using Big Data. In Proceedings of the Second IEEE International Conference on Big Data Computing Service and Applications, Big Data Service 2016, Oxford, UK, 29 March–1 April 2016; pp. 72–81. [Google Scholar]
- Li, H.; Yu, Z.; Mao, C. Fractional differential and variational method for image fusion and super-resolution. Neurocomputing 2016, 171, 138–148. [Google Scholar] [CrossRef]
- Wang, K.; Chai, Y.; Su, C. Sparsely corrupted stimulated scattering signals recovery by iterative reweighted continuous basis pursuit. Rev. Sci. Instrum. 2014, 84, 83–103. [Google Scholar] [CrossRef] [PubMed]
- Li, H.; Qiu, H.; Yu, Z.; Zhang, Y. Infrared and visible image fusion scheme based on NSCT and low-level visual features. Infrared Phys. Technol. 2016, 76, 174–184. [Google Scholar] [CrossRef]
- Tsai, W.; Qi, G.; Zhu, Z. Scalable SaaS Indexing Algorithms with Automated Redundancy and Recovery Management. Int. J. Softw. Inform. 2013, 7, 63–84. [Google Scholar]
- Li, S.; Yang, B.; Hu, J. Performance comparison of different multi-resolution transforms for image fusion. Inf. Fusion 2011, 12, 74–84. [Google Scholar] [CrossRef]
- Li, H.; Qiu, H.; Yu, Z.; Li, B. Multifocus image fusion via fixed window technique of multiscale images and non-local means filtering. Signal Process. 2017, 138, 71–85. [Google Scholar] [CrossRef]
- Vijayarajan, R.; Muttan, S. Discrete wavelet transform based principal component averaging fusion for medical images. AEU Int. J. Electron. Commun. 2015, 69, 896–902. [Google Scholar] [CrossRef]
- Pajares, G.; de la Cruz, J.M. A wavelet-based image fusion tutorial. Pattern Recognit. 2004, 37, 1855–1872. [Google Scholar] [CrossRef]
- Makbol, N.M.; Khoo, B.E. Robust blind image watermarking scheme based on Redundant Discrete Wavelet Transform and Singular Value Decomposition. AEU Int. J. Electron. Commun. 2013, 67, 102–112. [Google Scholar] [CrossRef]
- Luo, X.; Zhang, Z.; Wu, X. A novel algorithm of remote sensing image fusion based on shift-invariant Shearlet transform and regional selection. AEU Int. J. Electron. Commun. 2016, 70, 186–197. [Google Scholar] [CrossRef]
- Liu, X.; Zhou, Y.; Wang, J. Image fusion based on shearlet transform and regional features. AEU Int. J. Electron. Commun. 2014, 68, 471–477. [Google Scholar] [CrossRef]
- Sulochana, S.; Vidhya, R.; Manonmani, R. Optical image fusion using support value transform (SVT) and curvelets. Opt. Int. J. Light Electron Opt. 2015, 126, 1672–1675. [Google Scholar] [CrossRef]
- Yu, B.; Jia, B.; Ding, L.; Cai, Z.; Wu, Q.; Law, R.; Huang, J.; Song, L.; Fu, S. Hybrid dual-tree complex wavelet transform and support vector machine for digital multi-focus image fusion. Neurocomputing 2016, 182, 1–9. [Google Scholar] [CrossRef]
- Seal, A.; Bhattacharjee, D.; Nasipuri, M. Human face recognition using random forest based fusion of à-trous wavelet transform coefficients from thermal and visible images. AEU Int. J. Electron. Commun. 2016, 70, 1041–1049. [Google Scholar] [CrossRef]
- Qu, X.B.; Yan, J.W.; Xiao, H.Z.; Zhu, Z.Q. Image Fusion Algorithm Based on Spatial Frequency-Motivated Pulse Coupled Neural Networks in Nonsubsampled Contourlet Transform Domain. Acta Autom. Sin. 2008, 34, 1508–1514. [Google Scholar] [CrossRef]
- Elad, M.; Aharon, M. Image Denoising Via Learned Dictionaries and Sparse representation. In Proceedings of the 2006 IEEE Computer Society Conference on Computer Vision and Pattern Recognition (CVPR 2006), New York, NY, USA, 17–22 June 2006; pp. 895–900. [Google Scholar]
- Dar, Y.; Bruckstein, A.M.; Elad, M.; Giryes, R. Postprocessing of Compressed Images via Sequential Denoising. IEEE Trans. Image Process. 2016, 25, 3044–3058. [Google Scholar] [CrossRef] [PubMed]
- Zhang, Y.; Hirakawa, K. Blind Deblurring and Denoising of Images Corrupted by Unidirectional Object Motion Blur and Sensor Noise. IEEE Trans. Image Process. 2016, 25, 4129–4144. [Google Scholar] [CrossRef] [PubMed]
- Liu, H.; Yu, Y.; Sun, F.; Gu, J. Visual-Tactile Fusion for Object Recognition. IEEE Trans. Autom. Sci. Eng. 2016, 14, 1–13. [Google Scholar] [CrossRef]
- Tsai, W.T.; Qi, G.; Hu, K. Autonomous Decentralized Combinatorial Testing. In Proceedings of the 2015 IEEE Twelfth International Symposium on Autonomous Decentralized Systems, Taichung, Taiwan, 25–27 March 2015; pp. 40–47. [Google Scholar]
- Zhang, Y.; Liu, J.; Yang, W.; Guo, Z. Image Super-Resolution Based on Structure-Modulated Sparse Representation. IEEE Trans. Image Process. 2015, 24, 2797–2810. [Google Scholar] [CrossRef] [PubMed]
- Tsai, W.T.; Qi, G. Integrated Adaptive Reasoning Testing Framework with Automated Fault Detection. In Proceedings of the 2015 IEEE Symposium on Service-Oriented System Engineering, San Francisco Bay, CA, USA, 30 March–3 April 2015; pp. 169–178. [Google Scholar]
- Yang, B.; Li, S. Multifocus Image Fusion and Restoration With Sparse Representation. IEEE Trans. Instrum. Meas. 2010, 59, 884–892. [Google Scholar] [CrossRef]
- Liu, Y.; Liu, S.; Wang, Z. A general framework for image fusion based on multi-scale transform and sparse representation. Inf. Fusion 2015, 24, 147–164. [Google Scholar] [CrossRef]
- Yin, M.; Duan, P.; Liu, W.; Liang, X. A novel infrared and visible image fusion algorithm based on shift-invariant dual-tree complex shearlet transform and sparse representation. Neurocomputing 2017, 226, 182–191. [Google Scholar] [CrossRef]
- Aharon, M.; Elad, M.; Bruckstein, A. K-SVD: An Algorithm for Designing Overcomplete Dictionaries for Sparse Representation. IEEE Trans. Signal Process. 2006, 54, 4311–4322. [Google Scholar] [CrossRef]
- Yin, H.; Li, Y.; Chai, Y.; Liu, Z.; Zhu, Z. A novel sparse-representation-based multi-focus image fusion approach. Neurocomputing 2016, 216, 216–229. [Google Scholar] [CrossRef]
- Wang, J.; Liu, H.; He, N. Exposure fusion based on sparse representation using approximate K-SVD. Neurocomputing 2014, 135, 145–154. [Google Scholar] [CrossRef]
- Kim, M.; Han, D.K.; Ko, H. Joint patch clustering-based dictionary learning for multimodal image fusion. Inf. Fusion 2016, 27, 198–214. [Google Scholar] [CrossRef]
- Zhu, Z.; Chai, Y.; Yin, H.; Li, Y.; Liu, Z. A novel dictionary learning approach for multi-modality medical image fusion. Neurocomputing 2016, 214, 471–482. [Google Scholar] [CrossRef]
- Zhu, Z.; Qi, G.; Chai, Y.; Chen, Y. A Novel Multi-Focus Image Fusion Method Based on Stochastic Coordinate Coding and Local Density Peaks Clustering. Future Int. 2016, 8, 53. [Google Scholar] [CrossRef]
- Yang, S.; Wang, M.; Chen, Y.; Sun, Y. Single-Image Super-Resolution Reconstruction via Learned Geometric Dictionaries and Clustered Sparse Coding. IEEE Trans. Image Process. 2012, 21, 4016–4028. [Google Scholar] [CrossRef] [PubMed]
- Zhu, Z.; Qi, G.; Chai, Y.; Yin, H.; Sun, J. A Novel Visible-infrared Image Fusion Framework for Smart City. Int. J. Simul. Process Model. 2016, in press. [Google Scholar]
- Yang, M.; Zhang, L.; Feng, X.; Zhang, D. Sparse Representation Based Fisher Discrimination Dictionary Learning for Image Classification. Int. J. Comput. Vis. 2014, 109, 209–232. [Google Scholar] [CrossRef]
- Tsai, W.T.; Qi, G. Integrated fault detection and test algebra for combinatorial testing in TaaS (Testing-as-a-Service). Simul. Model. Pract. Theory 2016, 68, 108–124. [Google Scholar] [CrossRef]
- Edelman, A. Eigenvalues and Condition Numbers of Random Matrices. SIAM J. Matrix Anal. Appl. 1988, 9, 543–560. [Google Scholar] [CrossRef]
- Lin, B.; Li, Q.; Sun, Q.; Lai, M.J.; Davidson, I.; Fan, W.; Ye, J. Stochastic Coordinate Coding and Its Application for Drosophila Gene Expression Pattern Annotation. arXiv, 2014; arXiv:1407.8147. [Google Scholar]
- Yang, B.; Li, S. Pixel-level image fusion with simultaneous orthogonal matching pursuit. Inf. Fusion 2012, 13, 10–19. [Google Scholar] [CrossRef]
- Wu, W.; Tsai, W.T.; Jin, C.; Qi, G.; Luo, J. Test-Algebra Execution in a Cloud Environment. In Proceedings of the 2014 IEEE 8th International Symposium on Service Oriented System Engineering, Oxford, UK, 7–11 April 2014; pp. 59–69. [Google Scholar]
- Petrovic, V.S. Subjective tests for image fusion evaluation and objective metric validation. Inf. Fusion 2007, 8, 208–216. [Google Scholar] [CrossRef]
- Wang, Q.; Shen, Y.; Zhang, Y.; Zhang, J.Q. Fast quantitative correlation analysis and information deviation analysis for evaluating the performances of image fusion techniques. IEEE Trans. Instrum. Meas. 2004, 53, 1441–1447. [Google Scholar] [CrossRef]
- Sheikh, H.R.; Bovik, A.C. Image information and visual quality. IEEE Trans. Image Process. 2006, 15, 430–444. [Google Scholar] [CrossRef] [PubMed]
- Yang, C.; Zhang, J.Q.; Wang, X.R.; Liu, X. A novel similarity based quality metric for image fusion. Inf. Fusion 2008, 9, 156–160. [Google Scholar] [CrossRef]
- Liu, Z.; Blasch, E.; Xue, Z.; Zhao, J.; Laganiere, R.; Wu, W. Objective Assessment of Multiresolution Image Fusion Algorithms for Context Enhancement in Night Vision: A Comparative Study. IEEE Trans. Pattern Anal. Mach. Intell. 2011, 34, 94–109. [Google Scholar] [CrossRef] [PubMed]
- Chen, Y.; Blum, R.S. A new automated quality assessment algorithm for image fusion. Image Vis. Comput. 2009, 27, 1421–1432. [Google Scholar] [CrossRef]
- Tsai, W.T.; Luo, J.; Qi, G.; Wu, W. Concurrent Test Algebra Execution with Combinatorial Testing. In Proceedings of the 2014 IEEE 8th International Symposium on Service Oriented System Engineering, Oxford, UK, 7–11 April 2014; pp. 35–46. [Google Scholar]
- Vivone, G.; Alparone, L.; Chanussot, J.; Mura, M.D.; Garzelli, A.; Licciardi, G.A.; Restaino, R.; Wald, L. A Critical Comparison Among Pansharpening Algorithms. IEEE Trans. Geosci. Remote Sens. 2015, 53, 2565–2586. [Google Scholar] [CrossRef]
- Tsai, W.T.; Qi, G.; Chen, Y. A Cost-Effective Intelligent Configuration Model in Cloud Computing. In Proceedings of the 2012 32nd International Conference on Distributed Computing Systems Workshops, Macau, China, 18–21 June 2012; pp. 400–408. [Google Scholar]
- Tsai, W.T.; Qi, G. DICB: Dynamic Intelligent Customizable Benign Pricing Strategy for Cloud Computing. In Proceedings of the 2012 IEEE Fifth International Conference on Cloud Computing, Honolulu, HI, USA, 24–29 June 2012; pp. 654–661. [Google Scholar]
Figure 1.
Sub-dictionaries training for different groups of image patches.

Figure 2.
Fusion process.
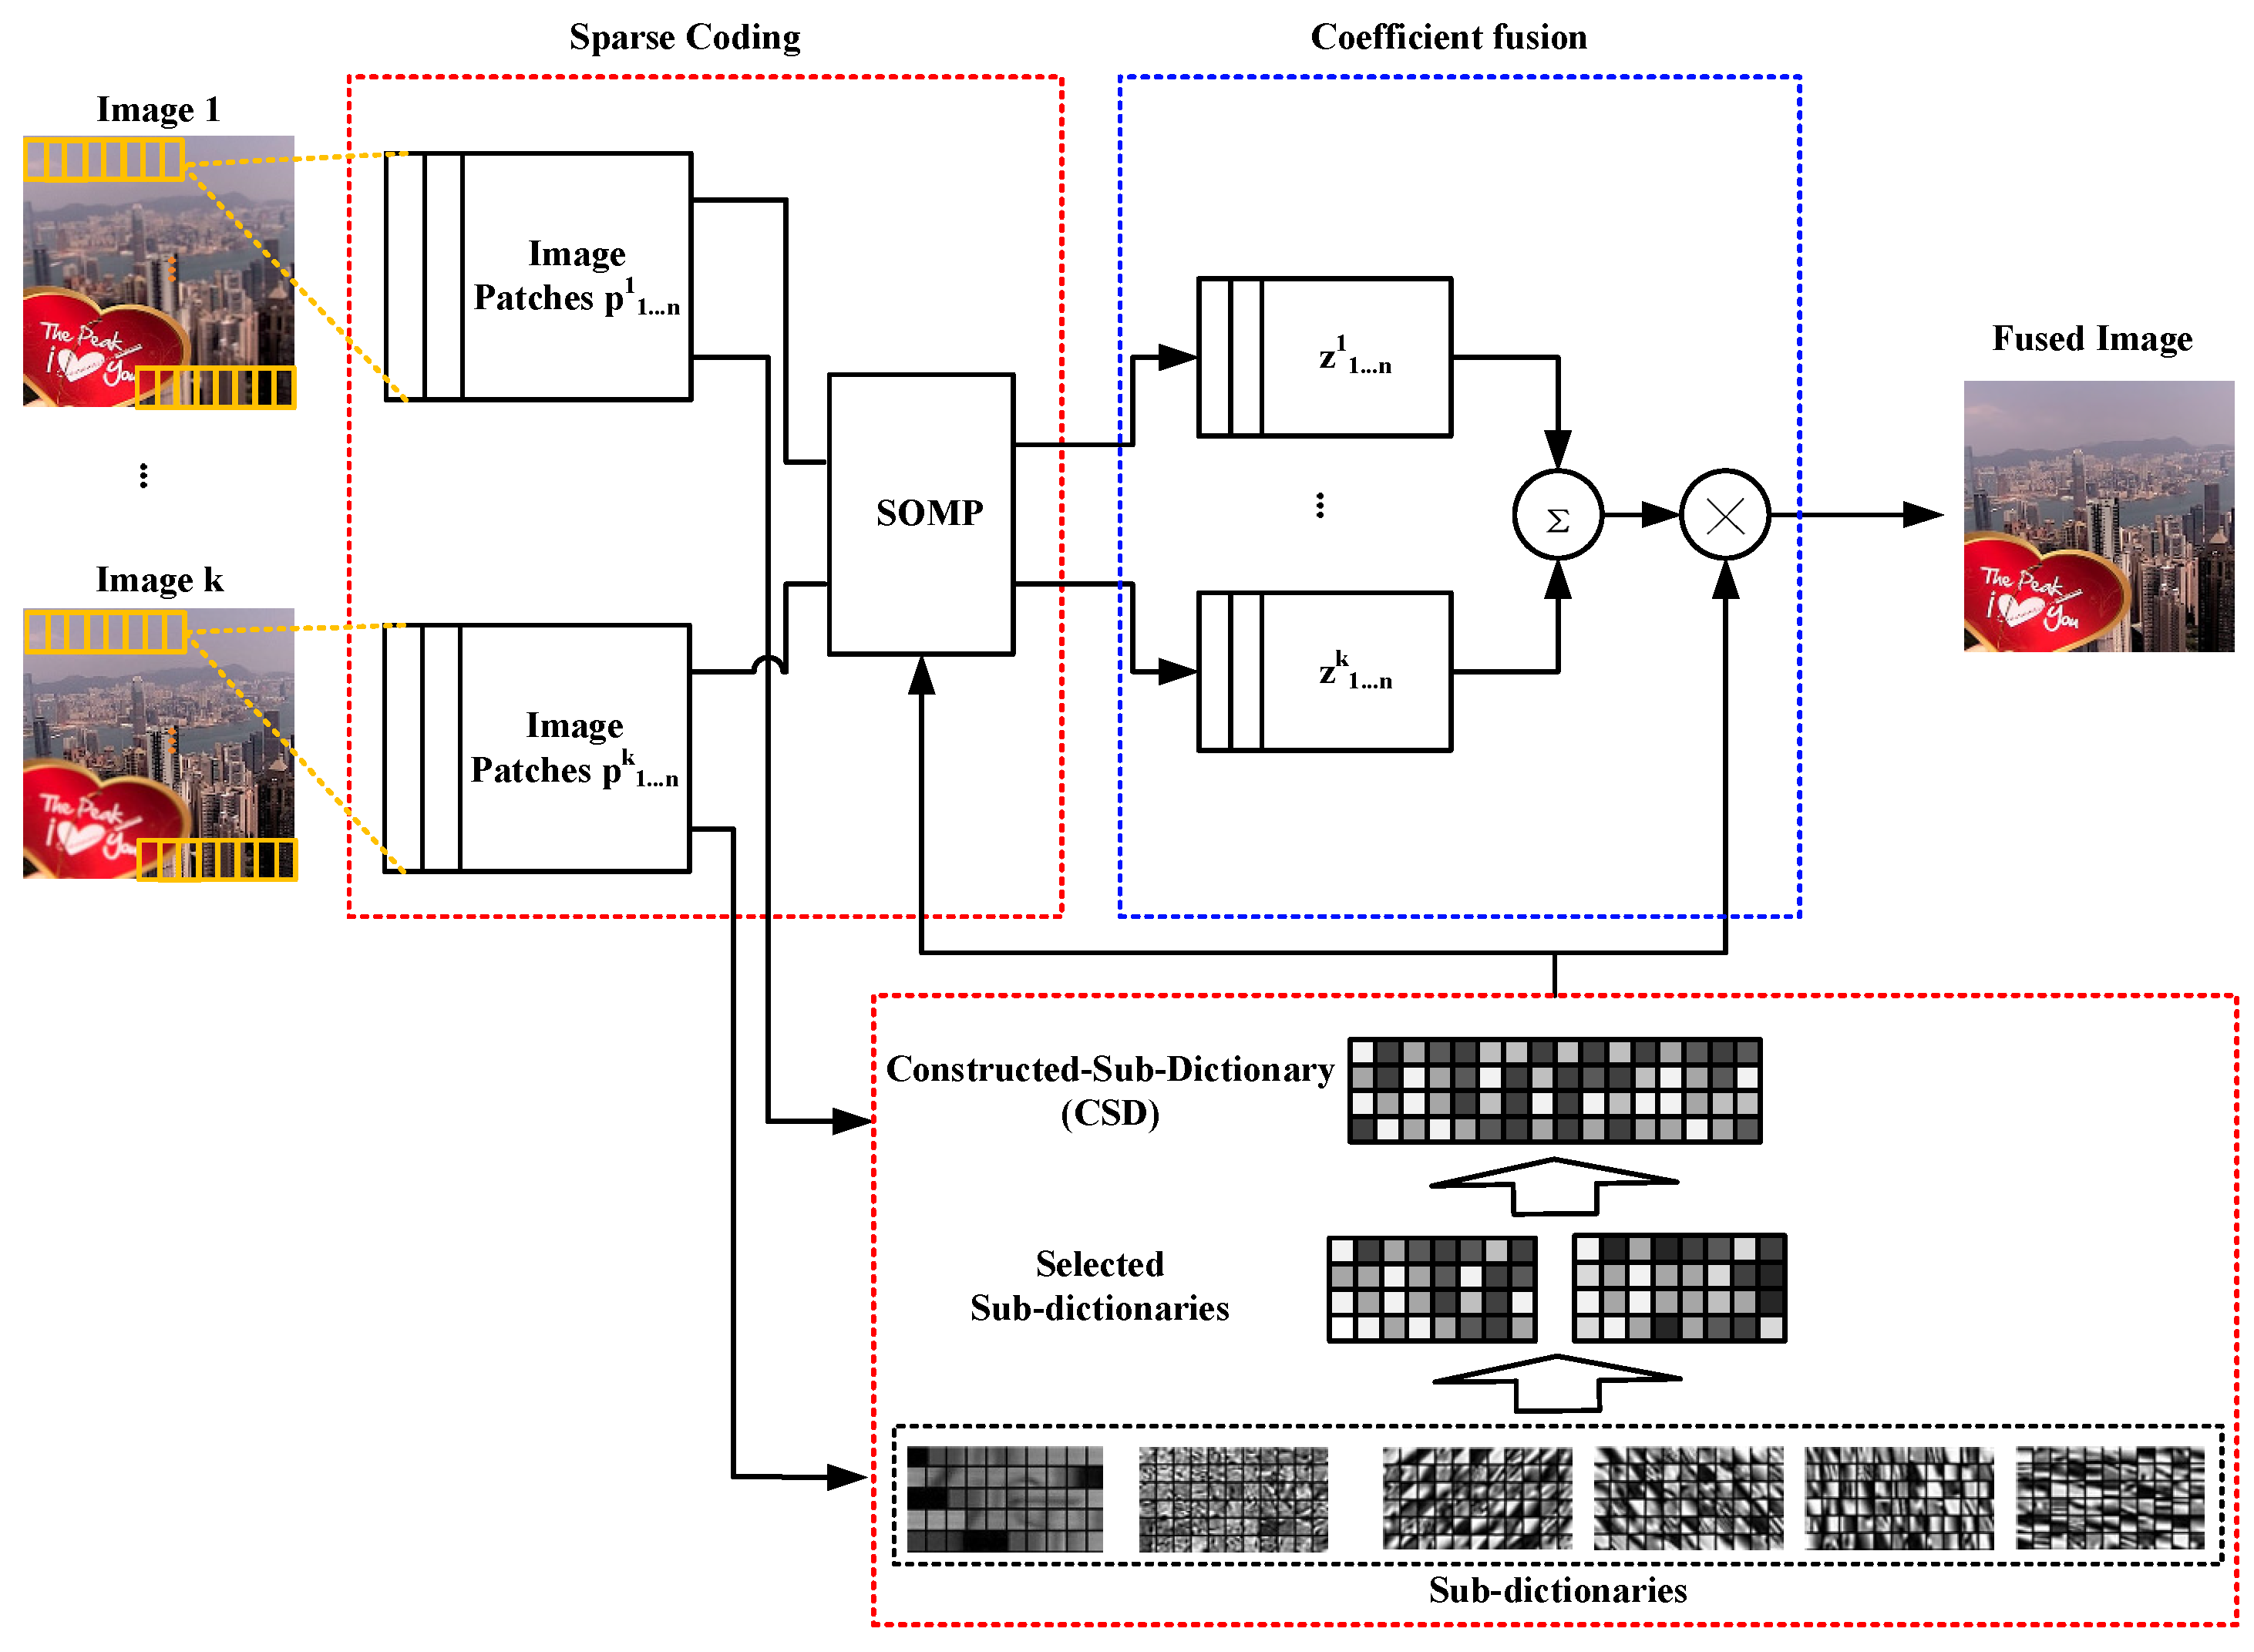
Figure 3.
Selected sample pairs of multi-focus, medical, and visible-infrared images; (a,b) are sample multi-focus image pairs; (c,d) are sample medical image pairs; (e,f) are sample visible-infrared images.
Figure 3.
Selected sample pairs of multi-focus, medical, and visible-infrared images; (a,b) are sample multi-focus image pairs; (c,d) are sample medical image pairs; (e,f) are sample visible-infrared images.
Figure 4.
Fusion results of multi-focus image of ’Love Card and Hong-Kong’; (a,b) are source images, (c–e) are fused image of K-means generalized singular value decomposition, joint clustering patches dictionary and the proposed method, (f–h) are difference images between (a) and fused image (c–e), (i–k) are difference images between (b) and fused image (c–e).
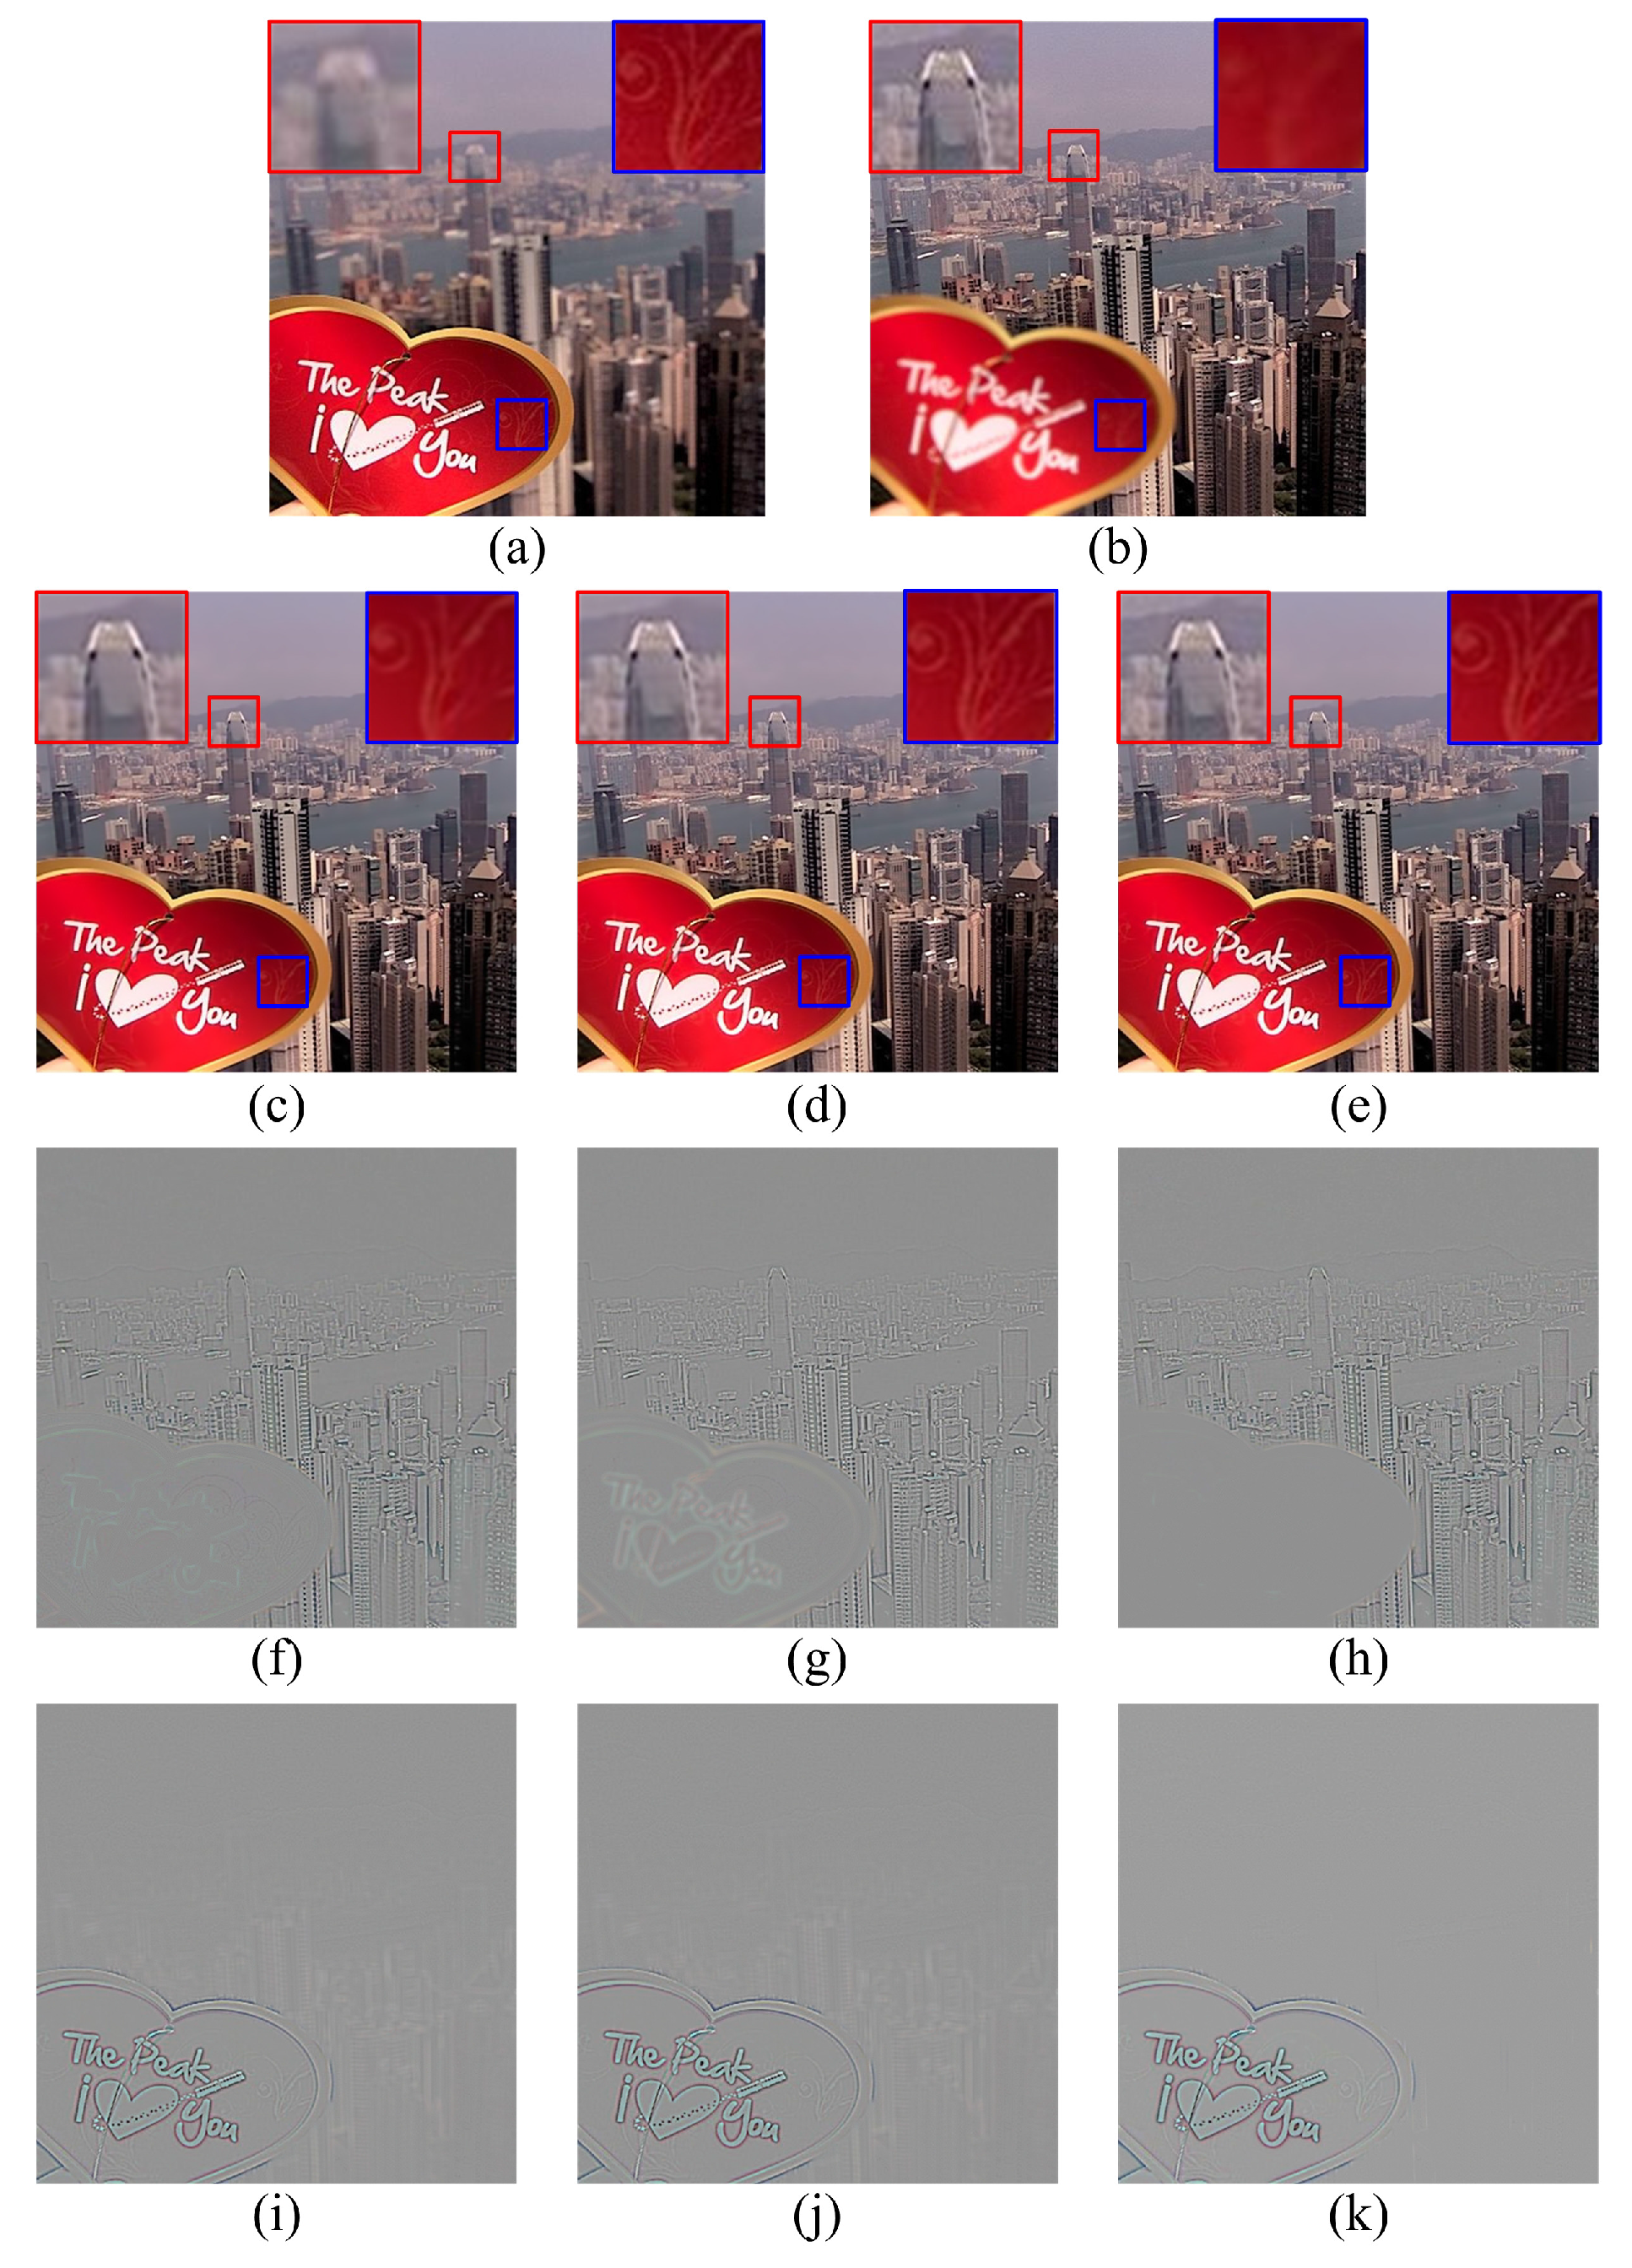
Figure 5.
Fusion results of the medical image of the “Brain”; (a,b) are source images, (c–e) are fused image of K-SVD, JCPD and proposed method, (f–k) are enlarged details in red and green frame of fused image (c–e).
Figure 5.
Fusion results of the medical image of the “Brain”; (a,b) are source images, (c–e) are fused image of K-SVD, JCPD and proposed method, (f–k) are enlarged details in red and green frame of fused image (c–e).
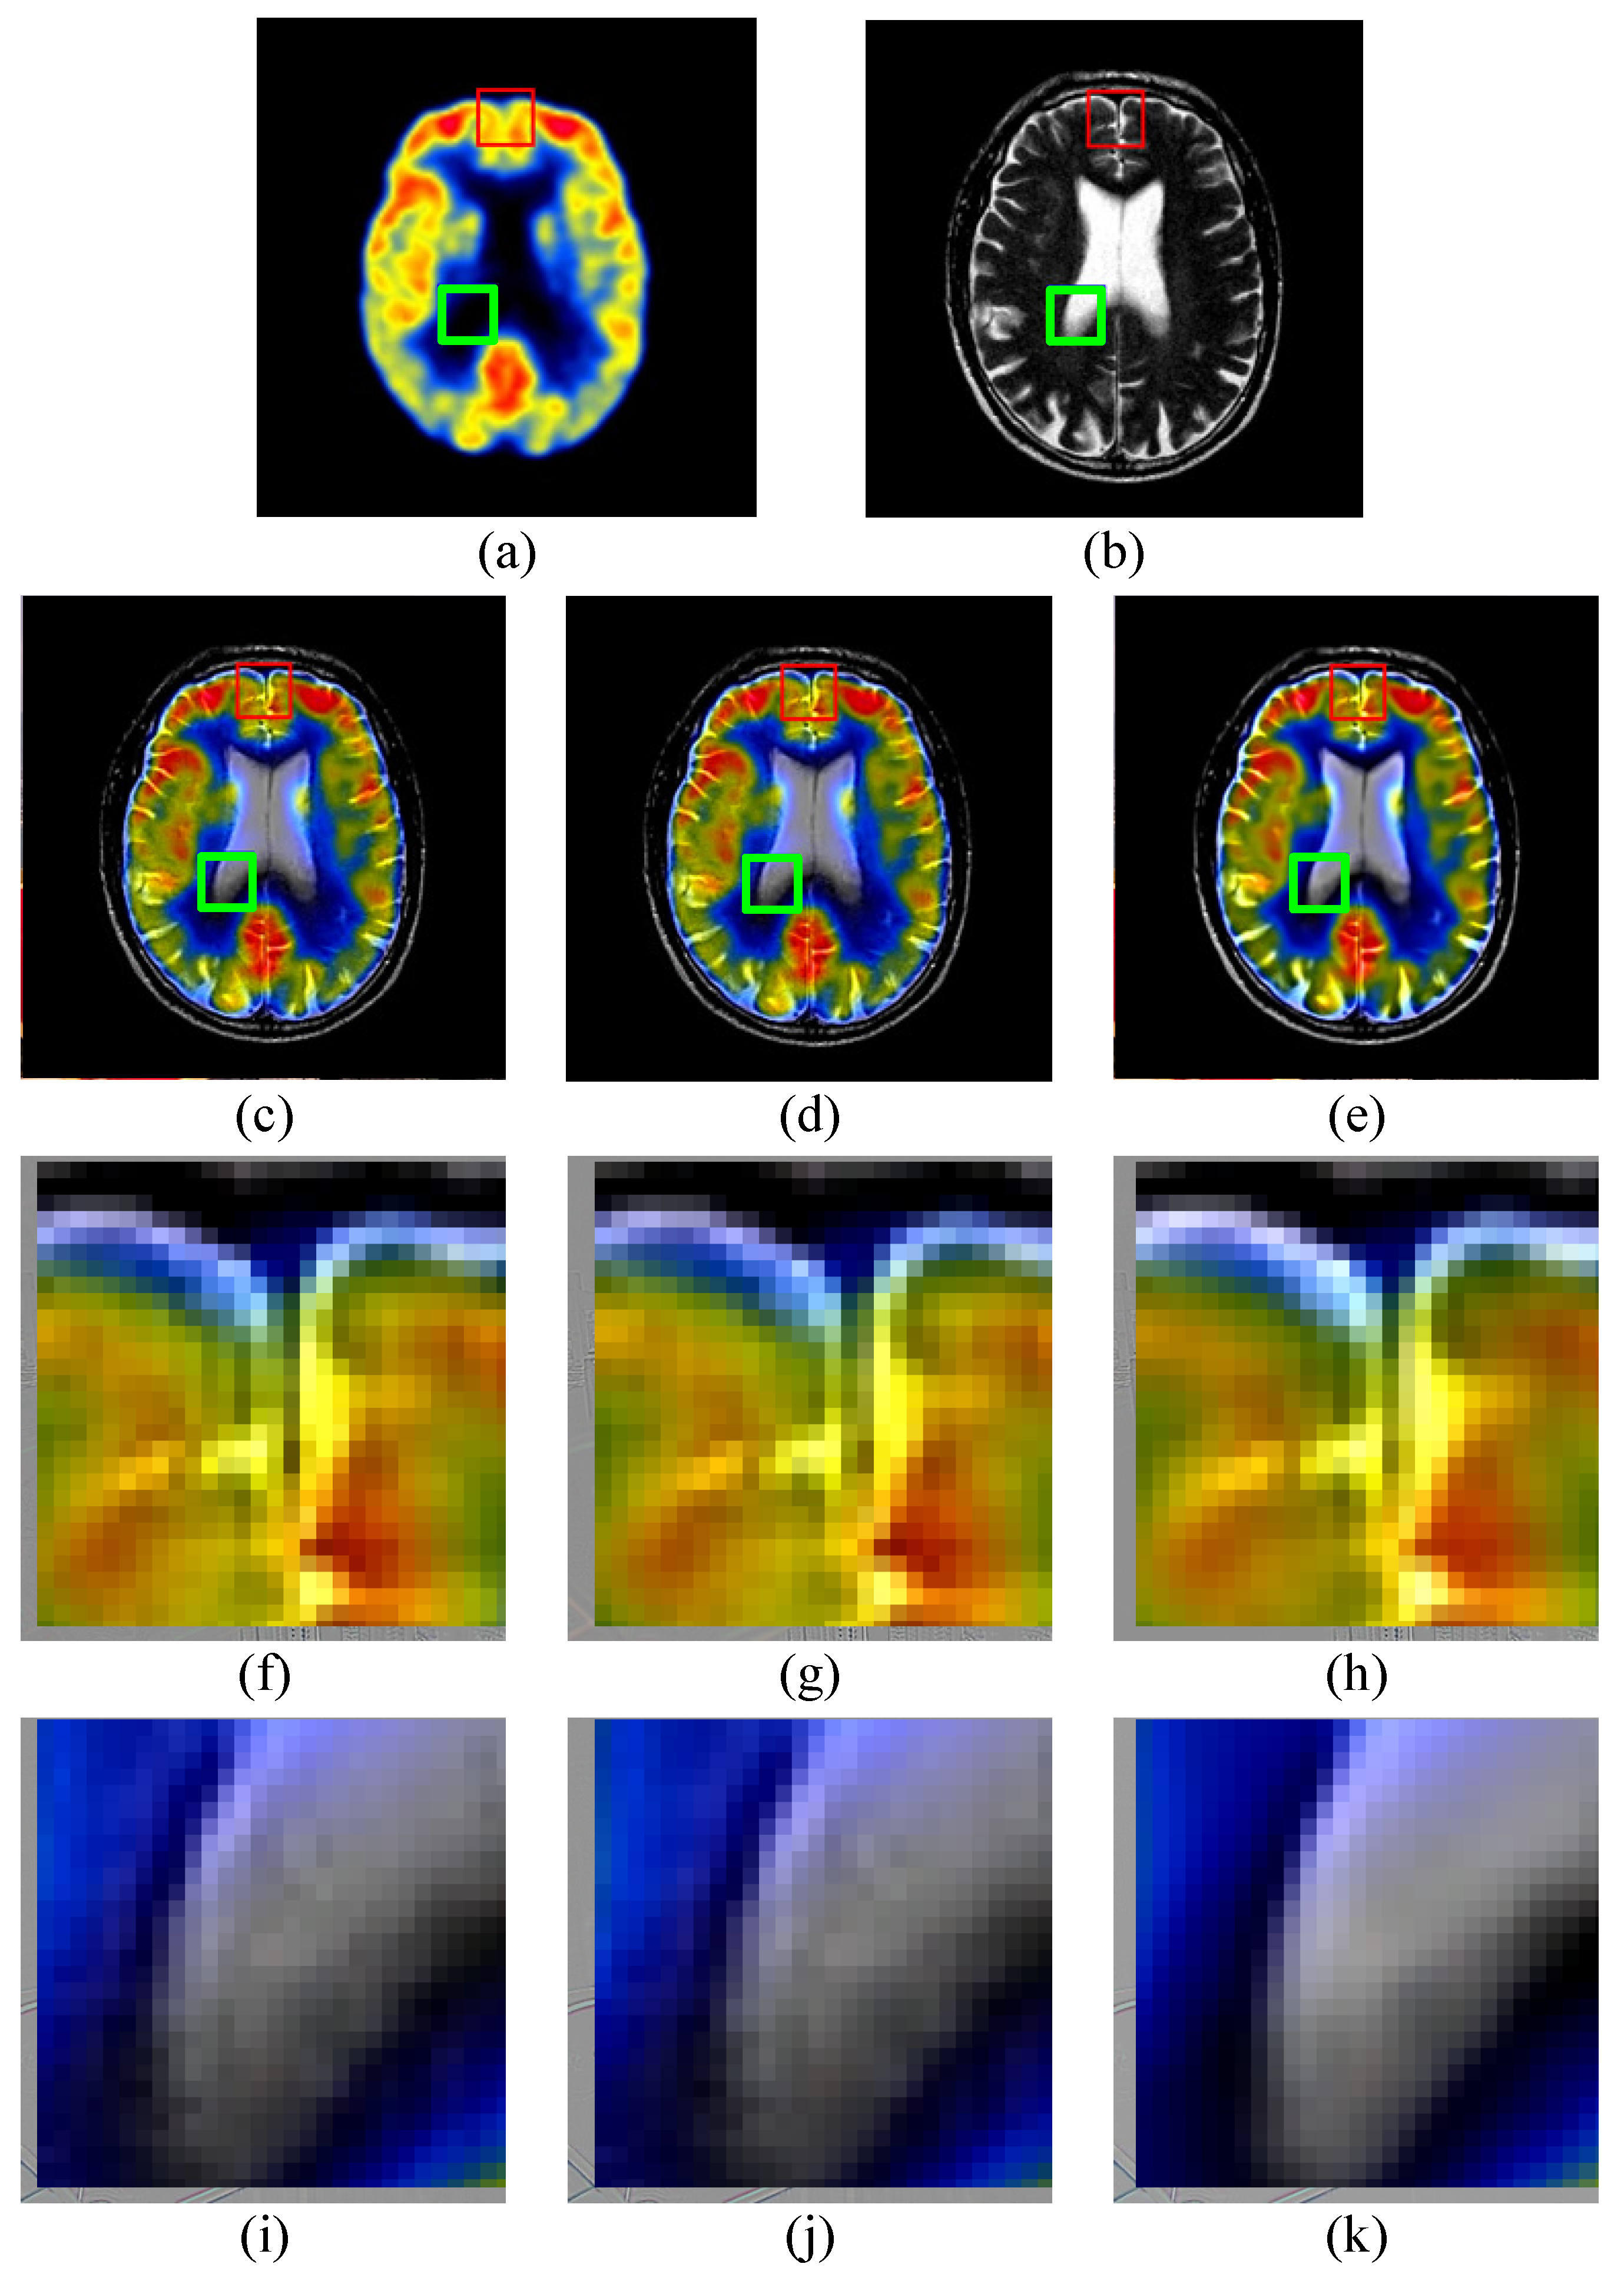
Figure 6.
Fusion results of visible-infrared images of “Downtown Street Scenes”; (a,b) are source images, (c–e) are fused images of K-SVD, JCPD and the proposed method, (f–k) are enlarged details in red and blue frames of fused images (c–e).
Figure 6.
Fusion results of visible-infrared images of “Downtown Street Scenes”; (a,b) are source images, (c–e) are fused images of K-SVD, JCPD and the proposed method, (f–k) are enlarged details in red and blue frames of fused images (c–e).


Table 1.
Fusion performance comparison of multi-focus image pairs.
| K-SVD | 0.4753 | 4.5992 | 0.7705 | 0.6897 | 0.6408 |
| JCPD | 0.5331 | 4.5586 | 0.7571 | 0.7403 | 0.6317 |
| Proposed | 0.5374 | 4.9561 | 0.7778 | 0.7420 | 0.6613 |
Table 2.
Fusion performance comparison of medical image pairs.
| K-SVD | 0.2886 | 1.8554 | 0.2831 | 0.3294 | 0.6700 |
| JCPD | 0.2880 | 1.8575 | 0.2829 | 0.3290 | 0.6680 |
| Proposed | 0.3088 | 1.8869 | 0.2878 | 0.3591 | 0.6854 |
Table 3.
Fusion performance comparison of visible-infrared image pairs.
| K-SVD | 0.4784 | 1.7713 | 0.3585 | 0.5670 | 0.5370 |
| JCPD | 0.5648 | 1.4563 | 0.3173 | 0.6562 | 0.4653 |
| Proposed | 0.6449 | 1.8398 | 0.3597 | 0.7647 | 0.5437 |
© 2017 by the authors. Licensee MDPI, Basel, Switzerland. This article is an open access article distributed under the terms and conditions of the Creative Commons Attribution (CC BY) license (http://creativecommons.org/licenses/by/4.0/).
Share and Cite
MDPI and ACS Style
Wang, K.; Qi, G.; Zhu, Z.; Chai, Y. A Novel Geometric Dictionary Construction Approach for Sparse Representation Based Image Fusion. Entropy 2017, 19, 306. https://doi.org/10.3390/e19070306
AMA Style
Wang K, Qi G, Zhu Z, Chai Y. A Novel Geometric Dictionary Construction Approach for Sparse Representation Based Image Fusion. Entropy. 2017; 19(7):306. https://doi.org/10.3390/e19070306
Chicago/Turabian StyleWang, Kunpeng, Guanqiu Qi, Zhiqin Zhu, and Yi Chai. 2017. "A Novel Geometric Dictionary Construction Approach for Sparse Representation Based Image Fusion" Entropy 19, no. 7: 306. https://doi.org/10.3390/e19070306
Note that from the first issue of 2016, this journal uses article numbers instead of page numbers. See further details here.