
The Exergy Loss Distribution and the Heat Transfer Capability in Subcritical Organic Rankine Cycle

Key Laboratory of New Materials and Facilities for Rural Renewable Energy, Ministry of Agriculture, Collaborative Innovation Center of Biomass Energy, College of Mechanical & Electrical Engineering, Henan Agricultural University, Zhengzhou 450002, China
*
Authors to whom correspondence should be addressed.
Entropy 2017, 19(6), 256; https://doi.org/10.3390/e19060256
Submission received: 28 March 2017
/
Revised: 18 May 2017
/
Accepted: 31 May 2017
/
Published: 3 June 2017
(This article belongs to the Special Issue Work Availability and Exergy Analysis)
Abstract
:Taking net power output as the optimization objective, the exergy loss distribution of the subcritical Organic Rankine Cycle (ORC) system by using R245fa as the working fluid was calculated under the optimal conditions. The influences of heat source temperature, the evaporator pinch point temperature difference, the expander isentropic efficiency and the cooling water temperature rise on the exergy loss distribution of subcritical ORC system are comprehensively discussed. It is found that there exists a critical value of expander isentropic efficiency and cooling water temperature rise, respectively, under certain conditions. The magnitude of critical value will affect the relative distribution of exergy loss in the expander, the evaporator and the condenser. The research results will help to better understand the characteristics of the exergy loss distribution in an ORC system.
1. Introduction
With the fast growth of fossil fuel consumption, the use of low grade waste heat has attracted public attention in recent years. Using low-grade waste heat can not only reduce fossil fuel consumption, but also can relieve environmental problems. Organic Rankine Cycle (ORC) is one of the attractive methods to recover low-grade waste heat. It has many advantages as compared with a traditional vapor Rankine cycle [1,2,3,4]. For example, the ORC technology exhibits advantages in abating CO2 emissions and pollutants compared to the steam Rankine cycle and the air bottoming cycle [5]. Additionally, the thermal efficiencies of combined ORC cycle design-point and part-load are 0.2%-points and 5.1%-points higher than the steam Rankine cycle and air bottoming cycle systems [5]. The working fluids, which are mostly organic fluids, have a higher molecular mass and lower critical temperature than water, making small or medium scale power plants technologically and economically feasible [6]. However, for the organic fluid, the fluid decomposition is more likely to occur because of the overheating in the heat exchanger, which will decrease the net power output. And so Benato et al. [6] carried on the investigation of critical dynamic events causing thermochemical decomposition of ORC working fluid.
Also, many investigations on ORC are mainly focused on the choices of the working fluid [7,8,9,10,11,12] and its performance [13,14,15,16,17,18,19,20,21]. Hung et al. [13] discussed the irreversible loss of the key parts in ORC and found that the maximum irreversible loss happens in the evaporator. Analogously, Wei et al. [14] showed that the greatest irreversible loss occurs in the evaporator when waste heat temperature varies from 610 K to 650 K. Usually, the greatest exergy loss is in the evaporator under the given conditions [15,16,17,18] and the smallest exergy loss is in the pump in ORC. But the magnitude of exergy loss in the expander and the condenser will change with different conditions such as expander isentropic efficiency and pinch point temperature difference.
The above research indicated that the exergy loss in the evaporator is the biggest, followed by the expander or condenser in subcritical ORC. Generally, these conclusions are obtained under given conditions which cannot stand for real working conditions. The operation parameters in the real ORC are variable due to the change of the load and this will result in renewable irreversibility distribution in ORC. Some experimental research about the expander shows that the expander isentropic efficiency can vary from 30% to 85% [22,23,24,25,26,27,28,29]. Little of the literature focuses on the variation of operating parameters for ORC based on the second law efficiency [30,31,32,33,34]. To gain a better practical understanding about the irreversibility distribution in a subcritical ORC with a low temperature heat source, it is necessary to study the irreversibility distribution and the heat transfer capability of the ORC system under some different conditions, such as the variation of heat source temperature, the evaporator pinch point temperature difference, the expander isentropic efficiency, the cooling water temperature rise and so on.
When the expander isentropic efficiency is fixed at a high value, the exergy loss in the expander is very low. However, when the expander isentropic efficiency is fixed at a low value, the exergy loss in the expander will become very high and it will exceed the exergy loss in the evaporator or the condenser. So, it can be predicted that there exists a critical value of the expander isentropic efficiency, making the exergy loss in the evaporator or the condenser equal to that in the expander. The same phenomenon can be predicted for the influence of the evaporator pinch point temperature difference. The exergy loss redistribution in the ORC will also have an effect on the heat transfer capability of the ORC. This research will exhibit the predicted results in detail.
2. System Description and Assumptions
Generally, the ORC system consists of a pump, an evaporator, an expander and a condenser, as shown in Figure 1a. The working fluid is pumped from low pressure to high pressure, and then heated in the evaporator by waste heat to become a vapor with high pressure. The vapor enters into the expander to generate power. After the work is done in the expander, the high pressure vapor becomes a low pressure vapor and then it goes into the condenser where the low pressure vapor is condensed at a constant pressure to become a saturated liquid. Once the condensed saturated liquid returns to the inlet of pump, another cycle of working fluid starts again. The corresponding ORC thermodynamic process on the T–s diagram is shown in Figure 1b. The 3–4 s and 1–2 s in this figure are isentropic processes in the pump and the expander under ideal conditions, respectively.
Three types of working fluid can be used: wet, isentropic or dry fluid. According to the slope of the saturation vapor curve on the T–s diagram, the types of working fluid can be determined. After defining ξ = ds/dT, the types of working fluids can be predicted. That is, ξ < 0: a wet fluid, ξ~0: an isentropic fluid, and ξ > 0: a dry fluid. Isentropic fluid R245fa was selected as the working fluid based on its good cycle performance [9,10] and eco-friendly characteristics [35], and it has been widely used in ORCs up to now and is researched quite well [36]. However, the global warming potential (GWP) of working fluid is not considered in this research.
The simulation conditions are given in Table 1, and the following assumptions are made: the system reaches a steady state; pressure drop in the evaporator, condenser and pipes, and heat losses between the whole system and the environment are negligible; the working fluid is at saturated liquid state at the outlet of the condenser. The heat source is the exhaust gas while the heat sink is the cooling water.
3. Mathematical Model
Based on the first and second laws of thermodynamics, the following equations could be obtained:
Process 4 to 1: This is an isobaric heating process in the evaporator. The liquid working fluid absorbs heat from the low-grade waste heat source and becomes a saturated vapor. The total amount of heat transferred between the low-grade waste heat source and working fluid in the evaporator could be evaluated by the following equation:
The exergy loss in the evaporator [14]:
where, , , and are the specific enthalpies of waste heat source and working fluid respectively; and are the working fluid specific entropies at the inlet and outlet of the evaporator; and are the mass flow rate of heat source and working fluid; , , , refer to the average temperature of waste heat source, the inlet and outlet temperature of waste heat source, the environment temperature, respectively.
Process 1 to 2: The high pressure vapor working fluid from the evaporator enters the expander, where the heat energy is converted into mechanical energy. The power is generated by the expander. For the ideal case, the process of 1–2 s is an isentropic process. However, due to the irreversibility in the expander, the isentropic efficiency of the expander is less than 100%. The power generated by the expander could be defined as:
The exergy loss in the expander is as follows [14]:
where and refer to the specific enthalpies of working fluid in real and isentropic case at the outlet of expander, respectively; is the expander isentropic efficiency.
Process 2 to 3: This is an isobaric heat rejection process in the condenser. The exhaust vapor at the outlet of the expander enters the condenser and releases the latent heat into the cooling water. The total heat released by the working fluid in the condenser could be expressed as:
The exergy loss in the condenser could be evaluated [14]:
where and are the specific entropies of the working fluid at the inlet and outlet of condenser, respectively; and are the specific enthalpies of working fluid at the inlet and outlet of the condenser; , , refer to the average temperature of cooling water, the cooling water temperature at the inlet and outlet of the condenser, respectively.
Process 3 to 4: In the real situation, this is a non-isentropic compression process in the pump. The power input by the pump could be expressed as:
The exergy loss in the pump could be evaluated [14]:
where, is the isentropic efficiency of pump. refers to the specific enthalpy of working fluid in isentropic case at the outlet of pump. is the specific entropy of working fluid at the outlet of pump.
The net power output for the ORC could be given by:
The first law efficiency of ORC system could be expressed as:
The second law efficiency or exergy efficiency of ORC system could be expressed as [14]:
where, is the exergy of the waste heat source at the inlet of the evaporator. It could be evaluated as follows:
where, and are the specific enthalpies of the waste heat source at the temperature of and , respectively; is the environment temperature; and are the specific entropies of the waste heat source at temperature of and , respectively.
The total exergy loss of the system could be expressed as follows:
The proportion of exergy loss in the evaporator:
The proportion of exergy loss in the expander:
The proportion of exergy loss in the condenser:
The proportion of exergy loss in the pump:
When studying the ORC system, not only thermodynamic performance but also economic performance should be considered. In the investment of the ORC system, the evaporator and the condenser occupy a large proportion. It has been determined that (UA)i, the heat transfer capacity of evaporator or condenser in the ORC system, is a reflection of economic performance and it was calculated in this paper [37]. Under the condition of ensuring the thermodynamic performance of the system, the total heat transfer capacity should be reduced to minimize the investment. Total heat transfer capacity is the sum of the evaporator and the condenser and it can be expressed as follows:
The heat transfer process in the evaporator and condenser can be divided into single-phase zone and two-phase zone. The heat transfer capability of every region is given by the following formula:
where is the logarithmic mean temperature difference, which can be obtained by the following formula:
The proportion of UAevp or UAc is expressed by:
The software called Engineering Equation Solver (EES) is used to simulate the system performance. The quadratic approximations method is adopted to optimize the objective function. In the simulation process, the net output power is maximized by adjusting the evaporation temperature, and the exergy loss of the ORC system is calculated when the net output power reaches the maximum value.
To verify the model, the simulation of subcritical ORC is carried out based on the assumptions provided by Reference [38]. The optimized simulation results are shown in Table 2. From this table, it is evident that the results in this paper have good agreement with those in the Reference [38]. The differences between the present paper and the reference are relatively small and these deviations could be explained by the different optimization method adopted in the simulations. The quadratic approximation method whose convergence error is 10−6 is adopted in this paper; however, a genetic algorithm whose convergence error is 10−4 is used in the Reference [38].
4. Results and Analysis
4.1. The Influence of Heat Source Temperature and Evaporator Pinch Point Temperature Difference
4.1.1. The Exergy Loss Distribution of ORC System
The relationships between the total exergy loss in ORC and heat source input temperature and the evaporator pinch point temperature differences are shown in Figure 2. Obviously the higher the heat source input temperature, the greater the total exergy loss of system. The influence of evaporator pinch point temperature difference on the total exergy loss is very small.
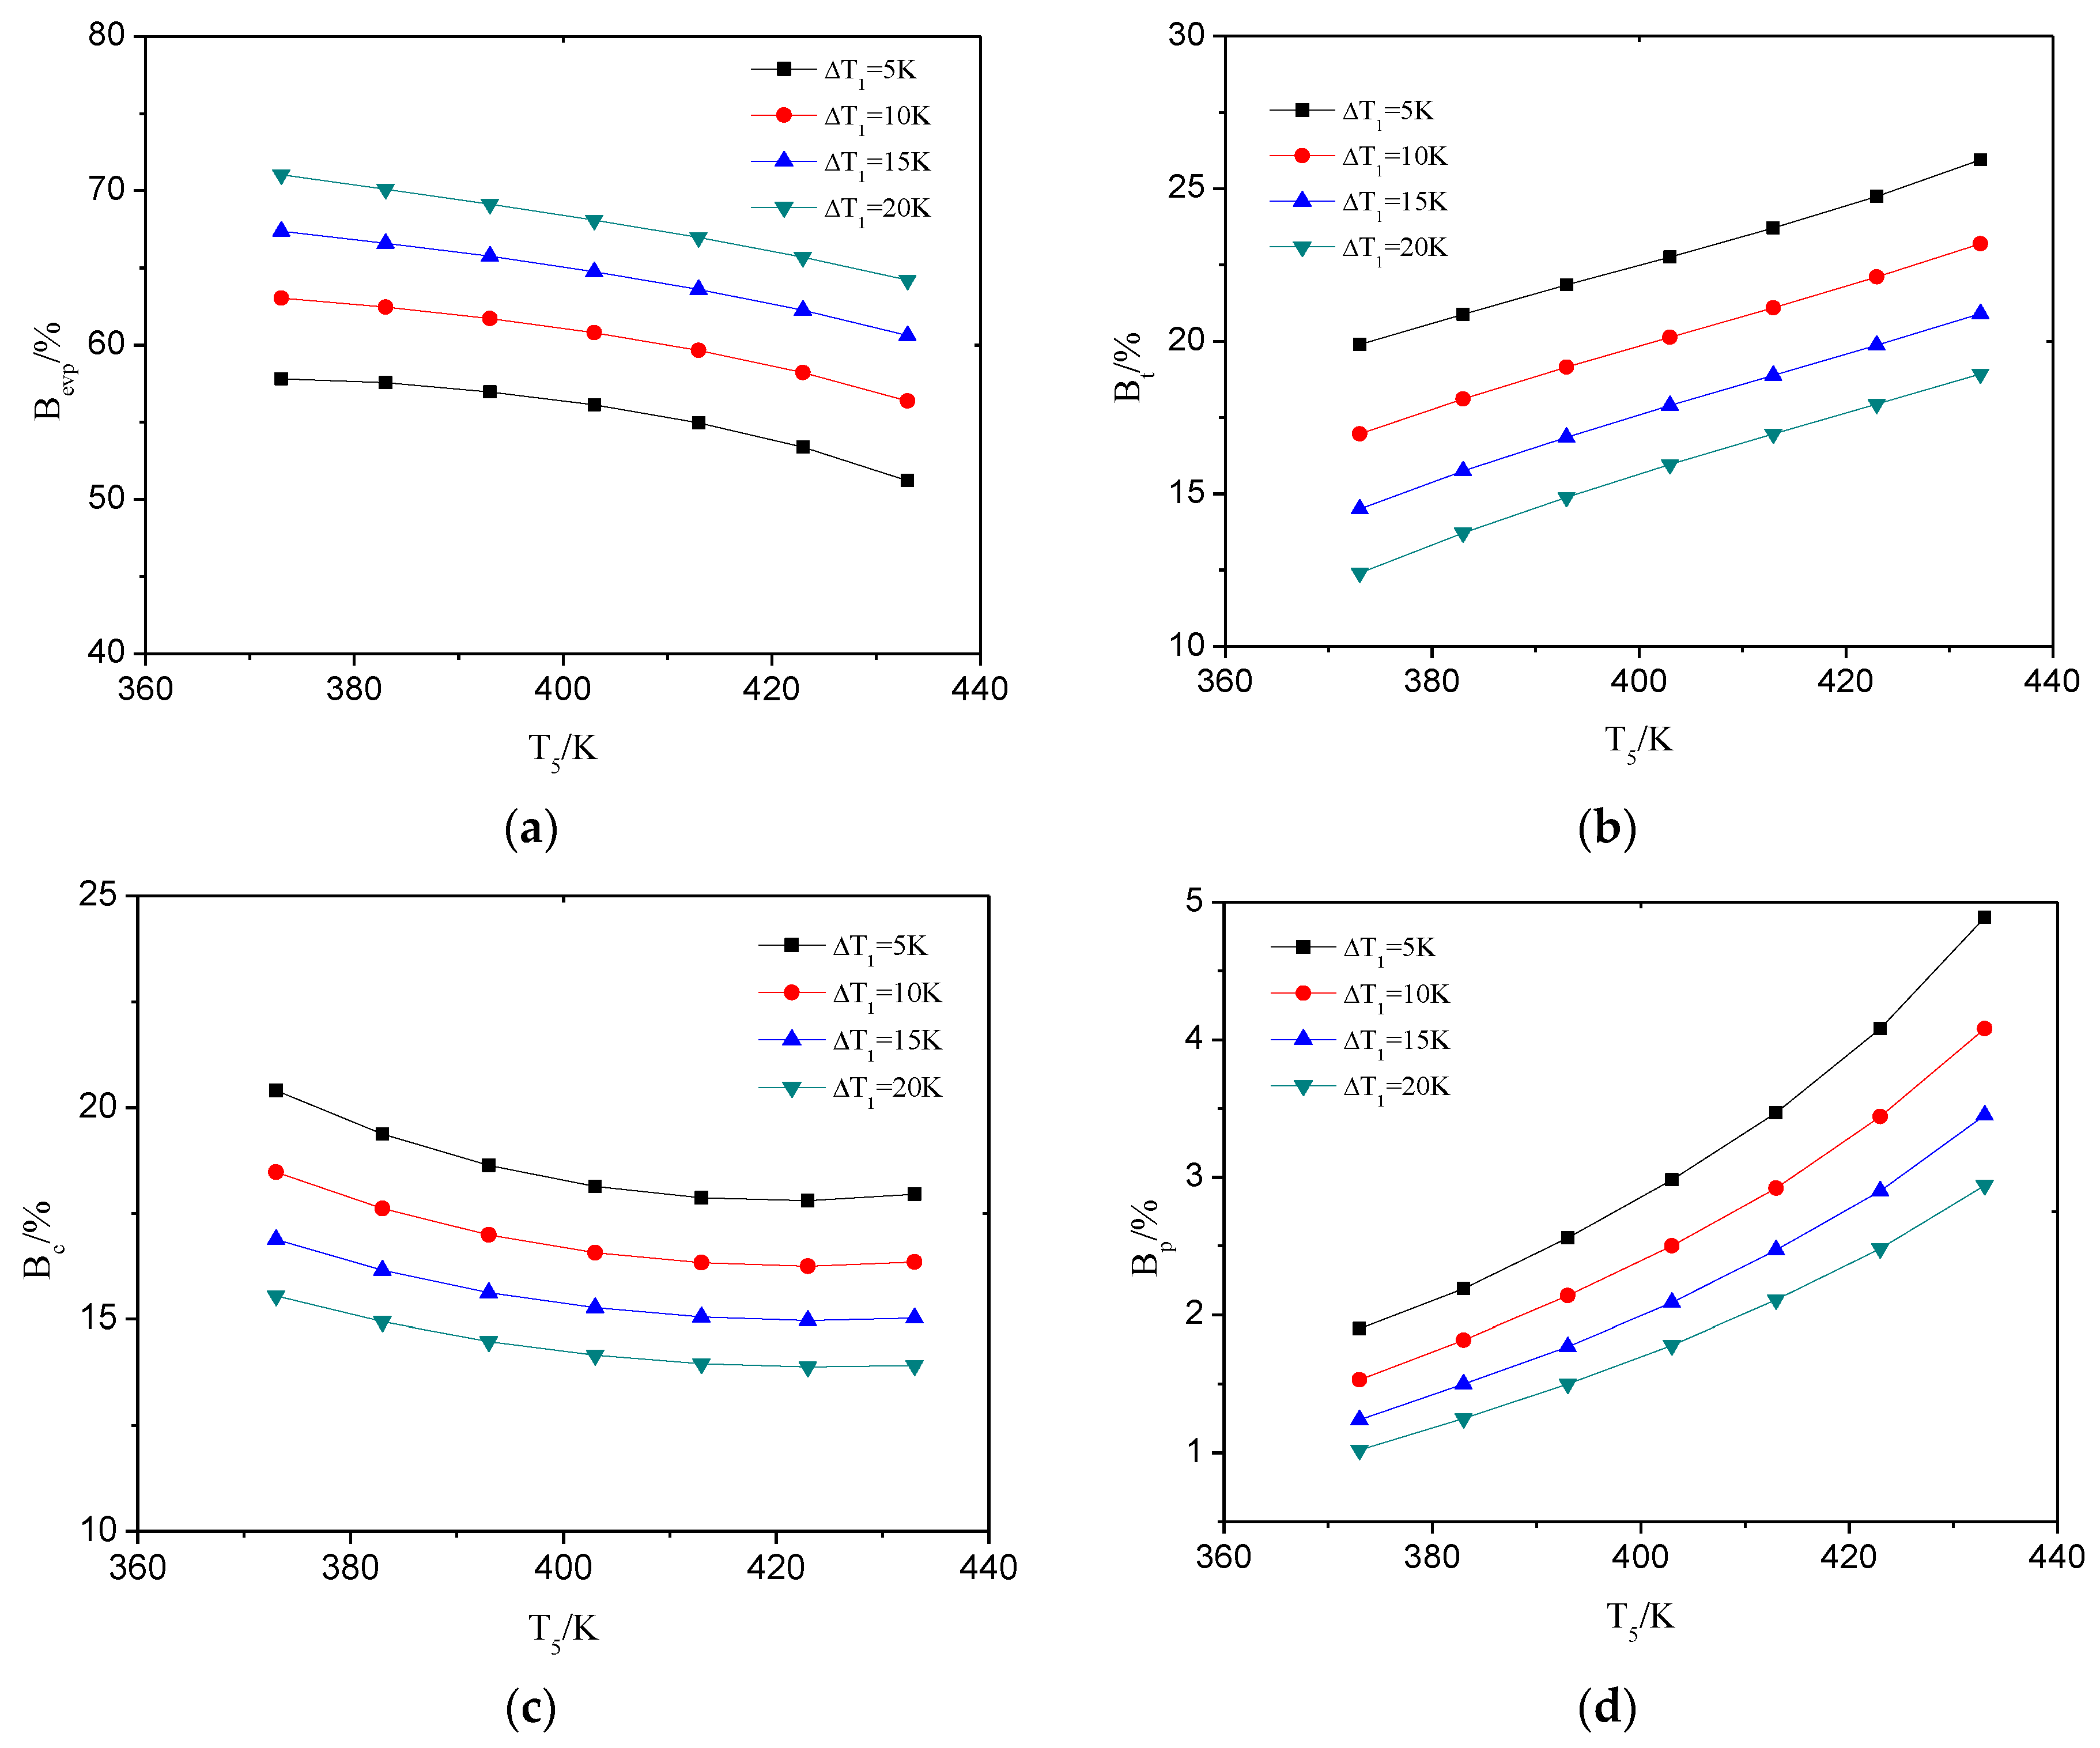
When the isentropic efficiency of the expander is 80% and the cooling water temperature rise is 5 K, the proportion of exergy loss in the evaporator, expander, condenser and pump of the ORC system are shown in Figure 3 with the different heat source input temperatures and evaporator pinch point temperature differences.
In Figure 3, at the same evaporator pinch point temperature difference, the proportion of exergy loss in the evaporator and condenser will reduce and those in the expander and pump will increase with the rise of heat source input temperature. However, at the same heat source input temperature, the proportion of exergy loss in the evaporator will increase and those in the expander, condenser and pump will reduce with the increase of evaporator pinch point temperature difference. From Figure 3, at the given conditions, the exergy loss in the pump is rather negligible compared to the other components.
In order to conveniently compare the relationships between the proportion of exergy loss in the expander and condenser, Figure 3b,c could be combined in one figure, i.e., Figure 4. From this figure, it is clearly shown that a, b, c and d points are the four intersections of plotted curves when the evaporator pinch point temperature differences are 5 K, 10 K, 15 K and 20 K, respectively. On the left side of each point, the exergy loss in the condenser is greater than that in the expander, but on the right side of each point, the situation is opposite. With the increase of evaporator pinch point temperature difference, the temperature of the intersection point is closer to the high heat source input temperature.
4.1.2. The Heat Transfer Capability of ORC System
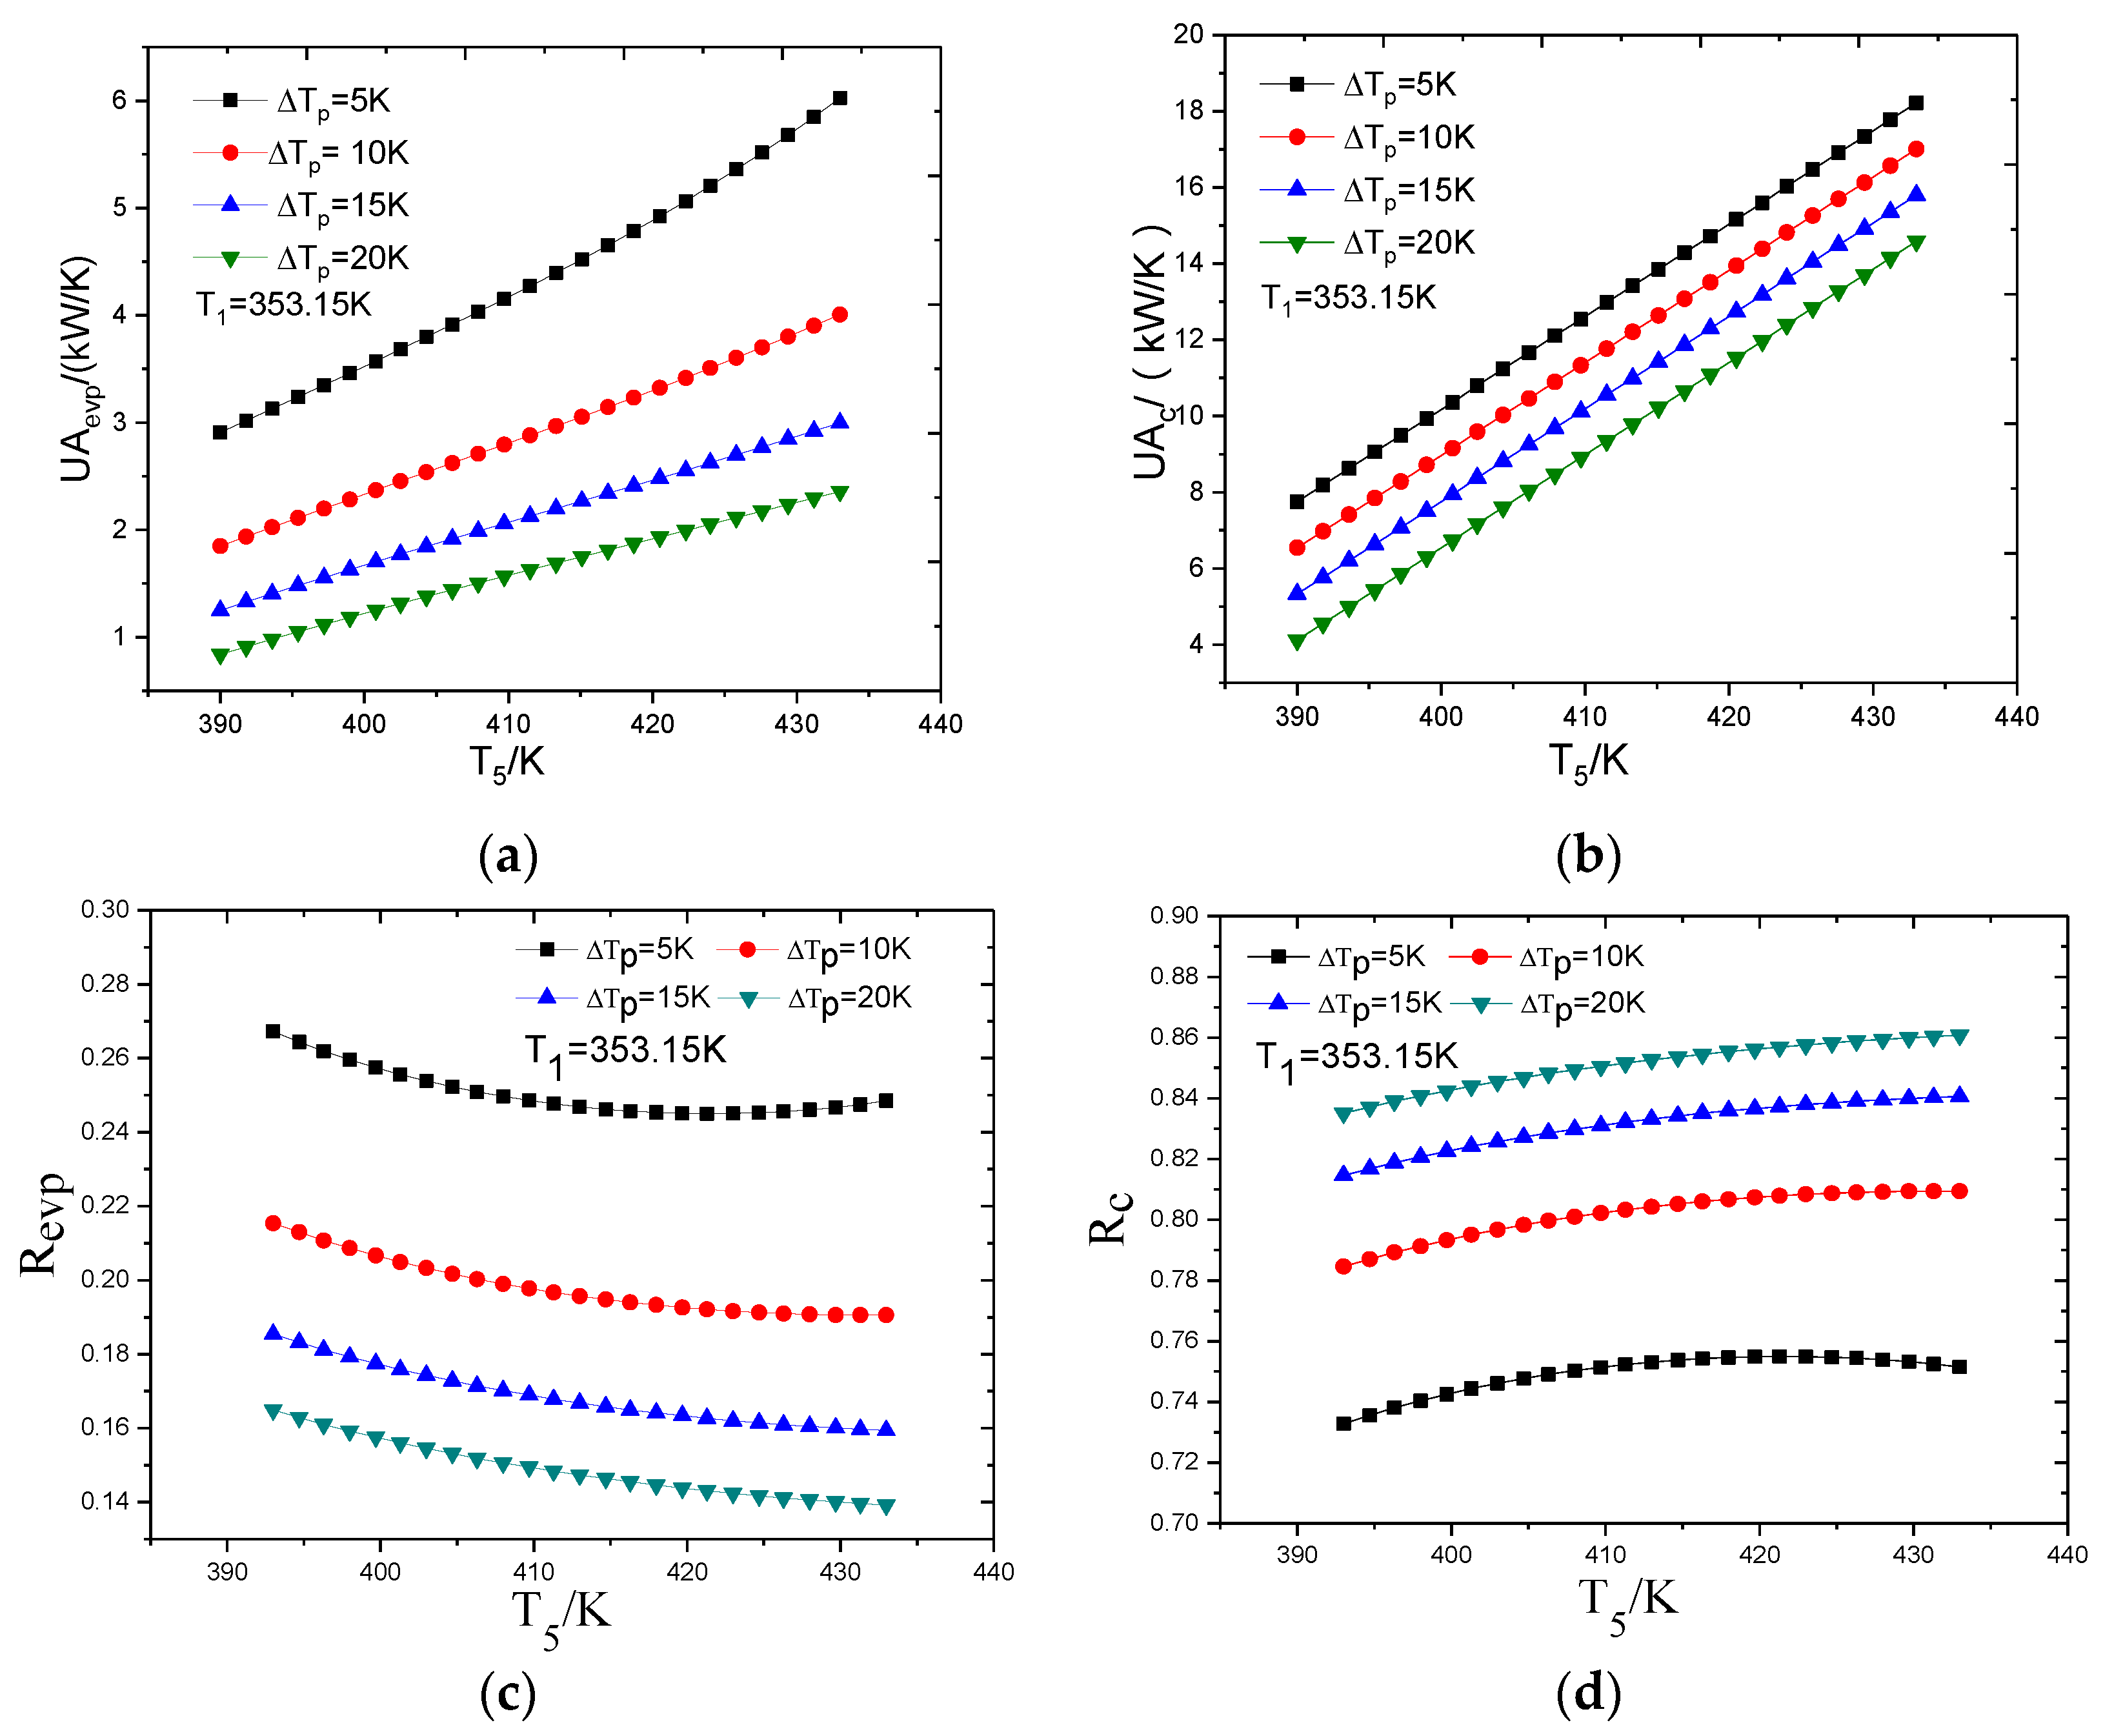
The total heat transfer capabilities comprises UAevp and UAc. The variation of heat transfer capabilities and their proportions with heat source inlet temperature and pinch point temperature difference is depicted in Figure 5. When the isentropic efficiency of the expander is 80%, the cooling water temperature rise is 5 K and working fluid evaporates at the temperature of 353.15 K. It can be seen from Figure 5a,b that, at the same evaporator pinch point temperature difference, as the heat source inlet temperature increases from 393–433 K, UAevp and UAc both increase, and the magnitude of the condenser is much larger than that of evaporator; at the same heat source inlet temperature, UAevp and UAc both decrease as the evaporator pinch point temperature difference increases from 5 K to 20 K.
It can be seen from Figure 5c,d that, at the same evaporator pinch point temperature difference, the proportion of UAevp increases as the heat source inlet temperature increased from 393–433 K while at the same heat source inlet temperature it decreases as the evaporator pinch point temperature difference increases from 5 K to 20 K. The variation trend of the proportion of UAc is opposite.
The computed result is analyzed as follows: For the evaporator, at the same pinch point temperature difference, the heat exchange in the evaporator increases as the heat source inlet temperature goes up, which leads to the increase of the mass flow rate of working fluid. The logarithmic mean temperature difference decreases in the preheating zone while it increases in the evaporating zone, but the increase of total heat exchange plays a leading role, so UAevp increases; at the same heat source inlet temperature, when the pinch point temperature difference increases, the heat exchange in evaporator decreases, which leads to the decrease of mass flow rate of working fluid and the increase of logarithmic mean temperature difference in both preheating zone and evaporating zone, so UAevp decreases. For the condenser, as the logarithmic mean temperature difference in the condenser is unchanged, the influence factor of UAc is only the mass flow rate of working fluid, so UAc increases as the heat source inlet temperature increase and UAc decreases as pinch point temperature difference of the evaporator increases.
4.2. The Influence of Expander Isentropic Efficiency
4.2.1. The Exergy Loss Distribution of ORC System
The total exergy loss in ORC at different expander isentropic efficiency is shown in Figure 6. Obviously, the higher the expander isentropic efficiency, the smaller the total exergy loss of system.
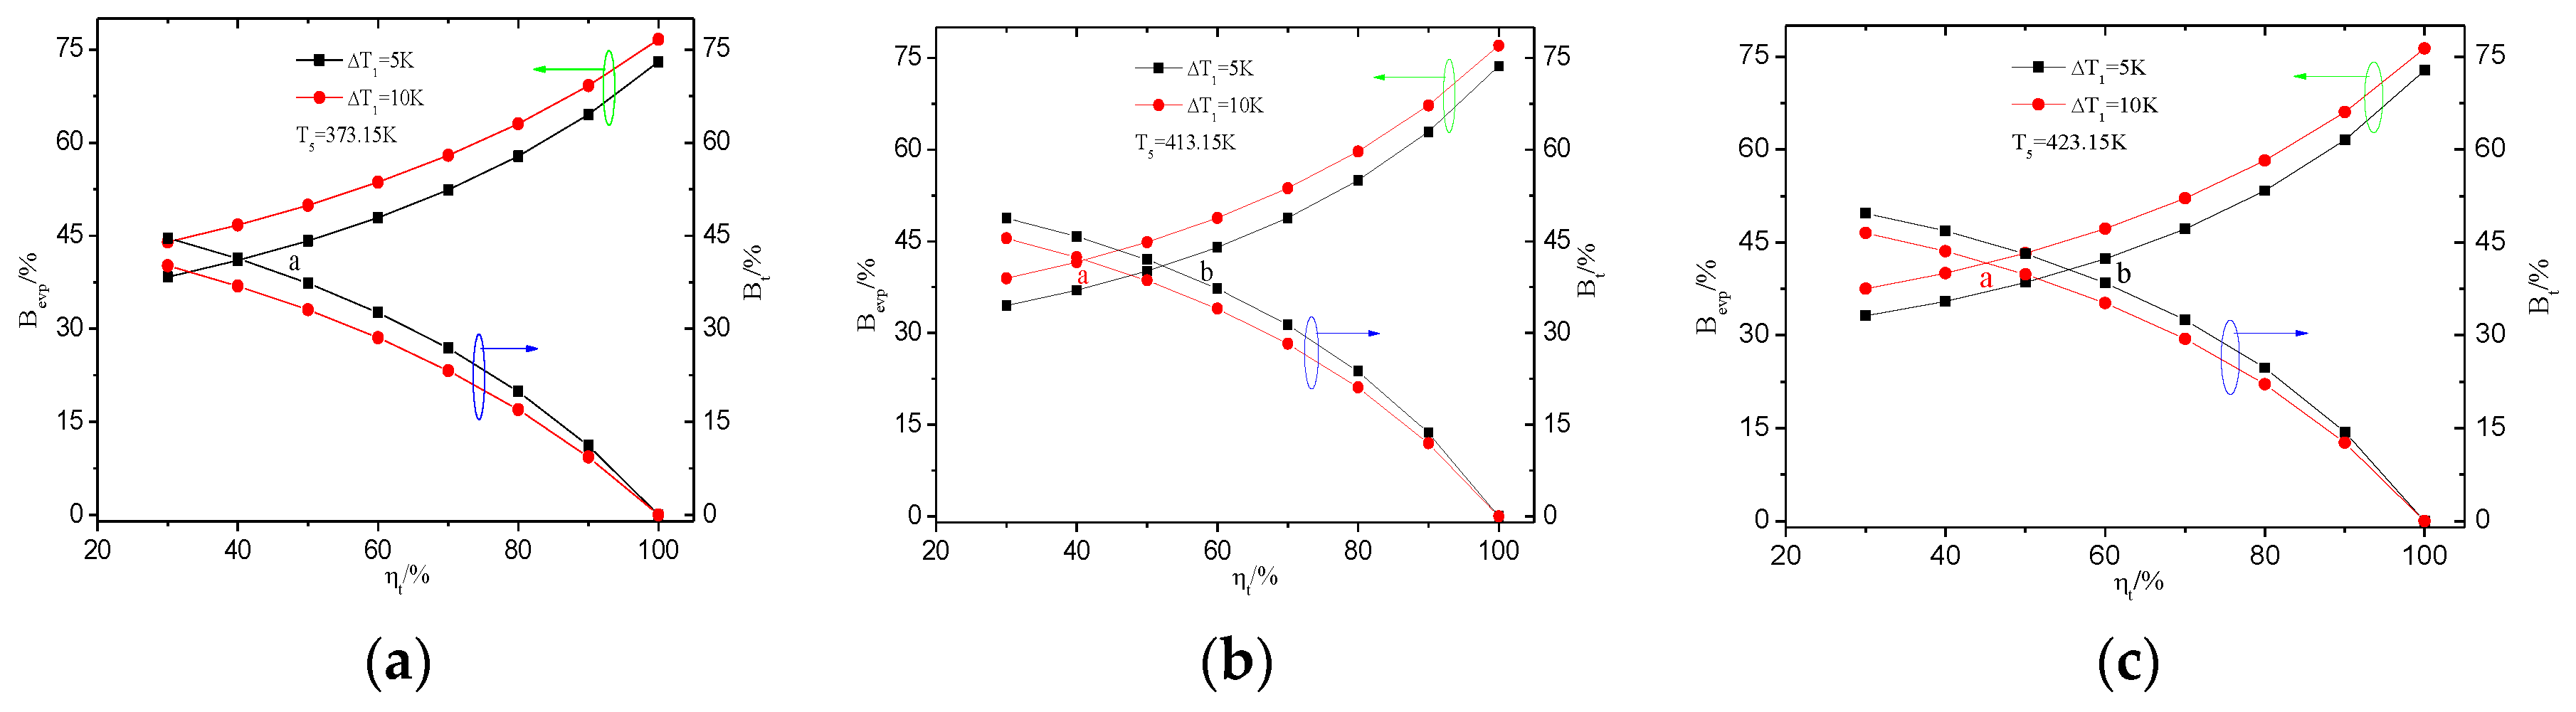
Figure 7 shows the relationship between the proportion of exergy loss in the evaporator and expander at different expander isentropic efficiency under the given conditions.
Exergy losses in the evaporator and expander correspond to each other and the expander isentropic efficiency is about 40% for intersection point a in Figure 7a. On the left side of point a, the exergy loss in the expander is greater than that in the evaporator, but on the right side of point a, the situation is opposite. When the evaporator pinch point temperature difference rises to 10 K, the expander isentropic efficiency varies from 30% to 100% and there’s no intersection in the curves. This shows that the proportion of exergy loss in the evaporator is always greater than that in the expander.
When the heat source temperature is 413.15 K, there are two intersection points a,b in the proportion of exergy loss curves for the evaporator and expander in Figure 7b,c. The corresponding expander isentropic efficiency of point a is 41% and 52%, respectively; and that of point b is 45% and 55%, respectively. With the increase of heat source temperature, the corresponding expander isentropic efficiency will increase when the exergy losses in the evaporator and expander are the same. In addition, comparing points a and b, lower evaporator pinch point temperature difference corresponds to higher expander isentropic efficiency when the exergy losses in the evaporator and expander are the same.
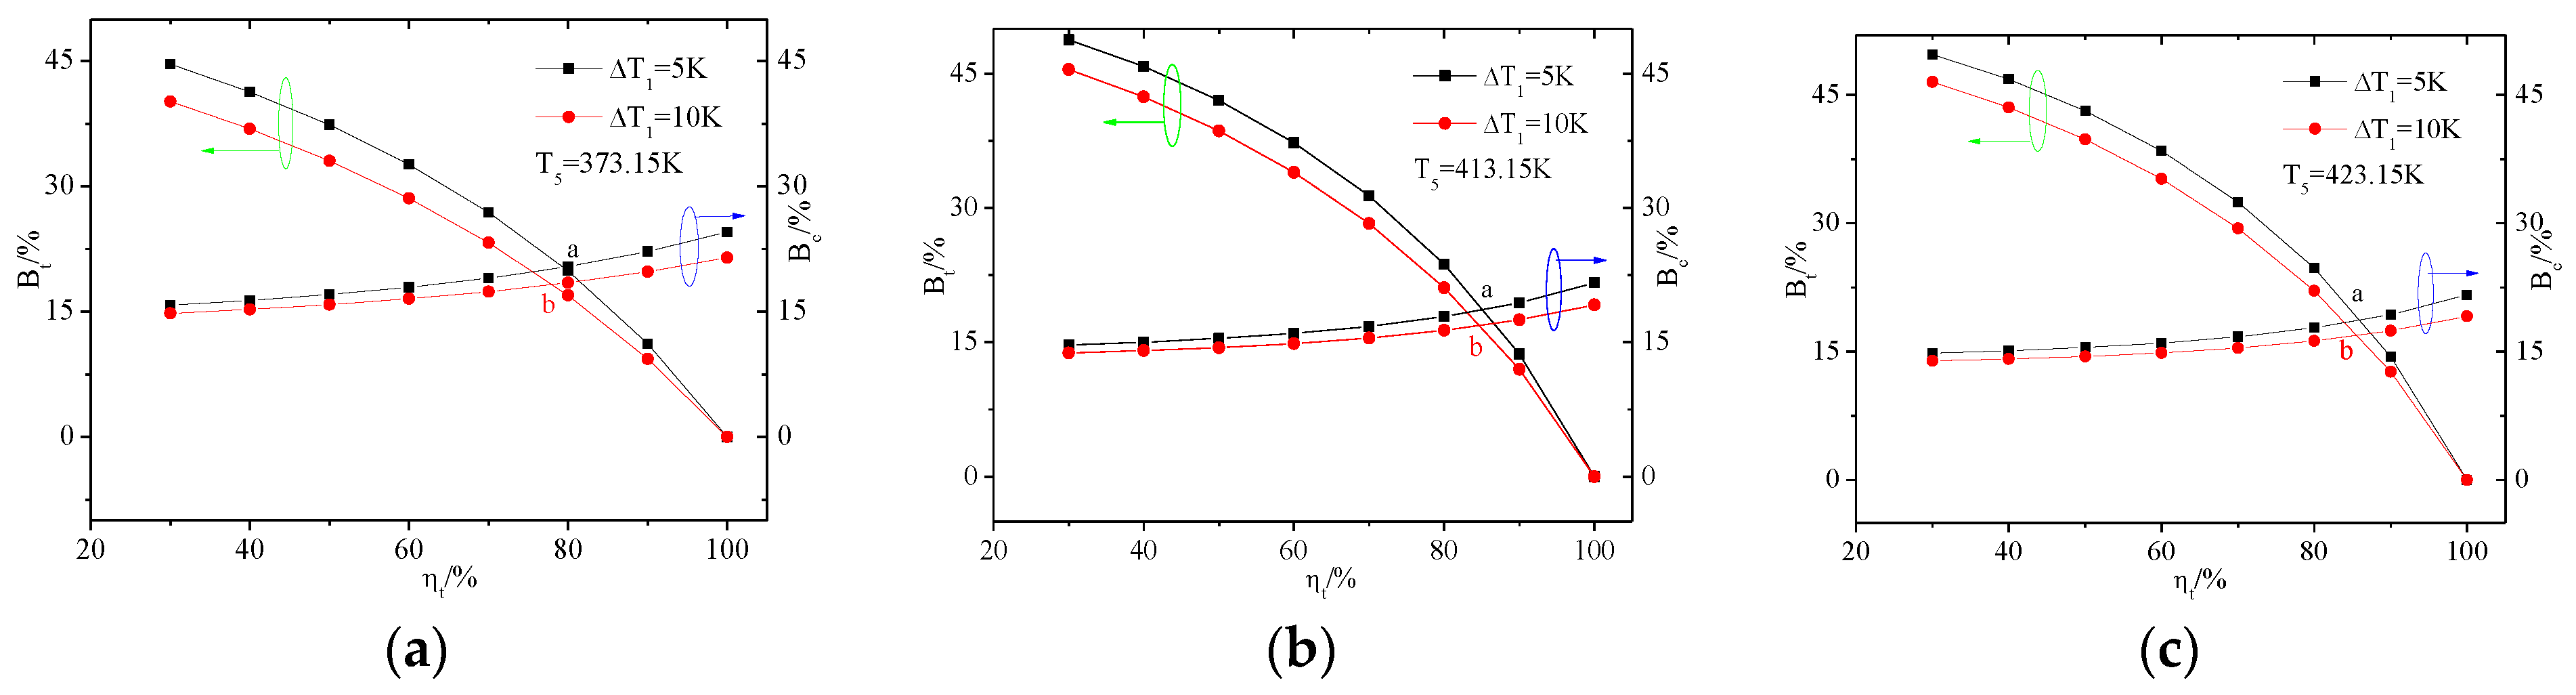
Figure 8 shows the relationship between the proportion of exergy loss in the expander and condenser at different expander isentropic efficiencies. When the heat source temperature is 373.15 K, there are two intersections at a, b on the curves in Figure 8a. The corresponding expander isentropic efficiency is about 80%. With the increase of expander isentropic efficiency, the exergy loss in the condenser is greater than that in the expander. When the heat source temperature goes up, Figure 8b,c show a similar trend, and the corresponding expander isentropic efficiency of points a and b is about 85%.
The change of the heat source temperature and the expander isentropic efficiency will result in the change of the proportion of exergy loss in the condenser and expander. During the running periods of ORC, many factors will affect the working conditions of ORC and cause a change of the proportion of exergy loss in ORC.
4.2.2. The Heat Transfer Capability of ORC System
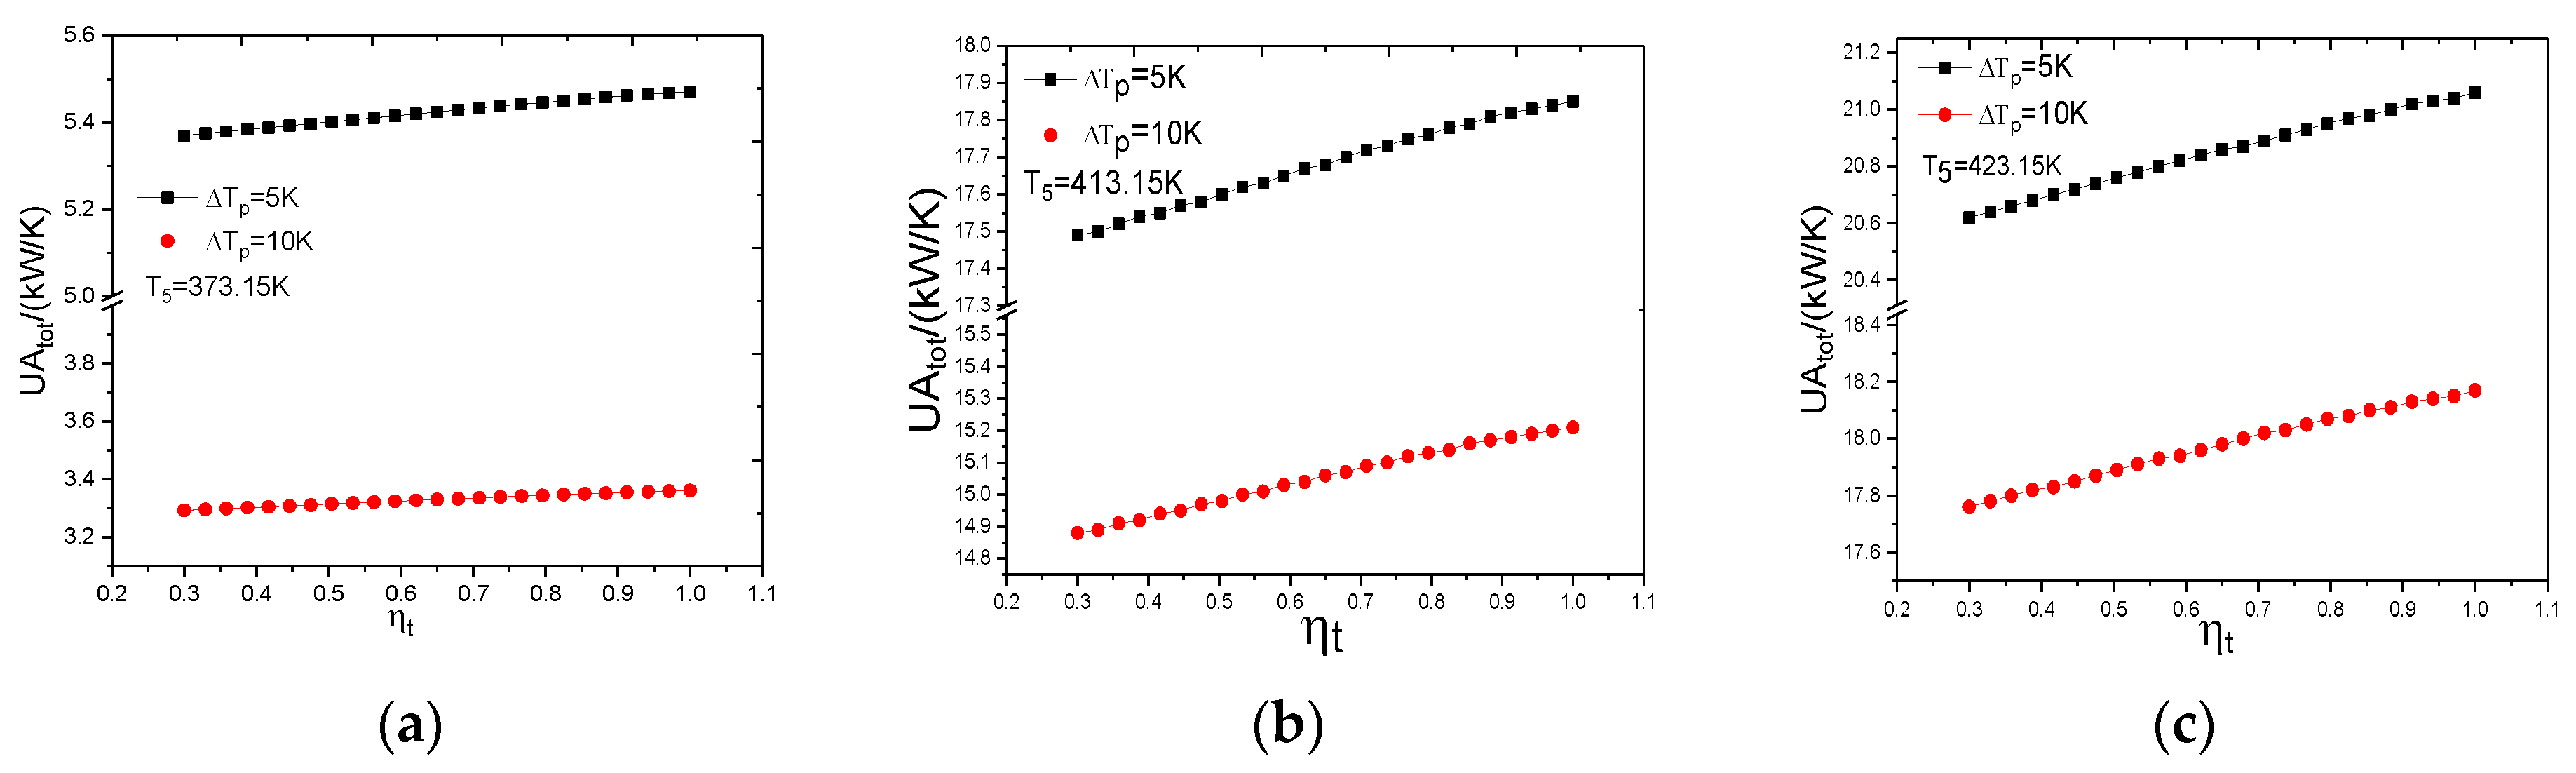
When the heat source temperature is set as 373.15 K, 413.15 K and 423.15 K, and the evaporator pinch point temperature difference is 5 K and 10 K, respectively, the variation of UAtot, the total heat transfer capability of ORC system with expander isentropic efficiency in the range of 30%~100% is shown in Figure 9a–c, respectively.
It can be seen from Figure 9 that, at the three heat source temperatures, UAtot increases as expander isentropic efficiency goes up, but the increase is rather small. In accordance with the former calculated result, UAtot at the evaporator pinch point temperature difference of 5 K is larger than at 10 K. Since the variation of expander isentropic efficiency only affects the performance of condenser when the evaporating temperature remains unchanged, UAevp doesn’t change with expander isentropic efficiency. As expander isentropic efficiency goes up, the expander outlet temperature decreases slightly so the logarithmic mean temperature difference in the condenser decreases. Consequently, UAc increases and its proportion increases as well while the change is small on the whole.
It can be summarized from the above results that as expander isentropic efficiency increases, the total exergy loss of the ORC system decreases, but the total heat transfer capability increases. The proportion of exergy loss in the evaporator decreases as expander isentropic efficiency goes up and that of the condenser increases. Meanwhile, UAc increases with expander isentropic efficiency. The effect of expander isentropic efficiency on the condenser is relatively small.
4.3. The Influence of Cooling Water Temperature Rise
4.3.1. The Exergy Loss Distribution
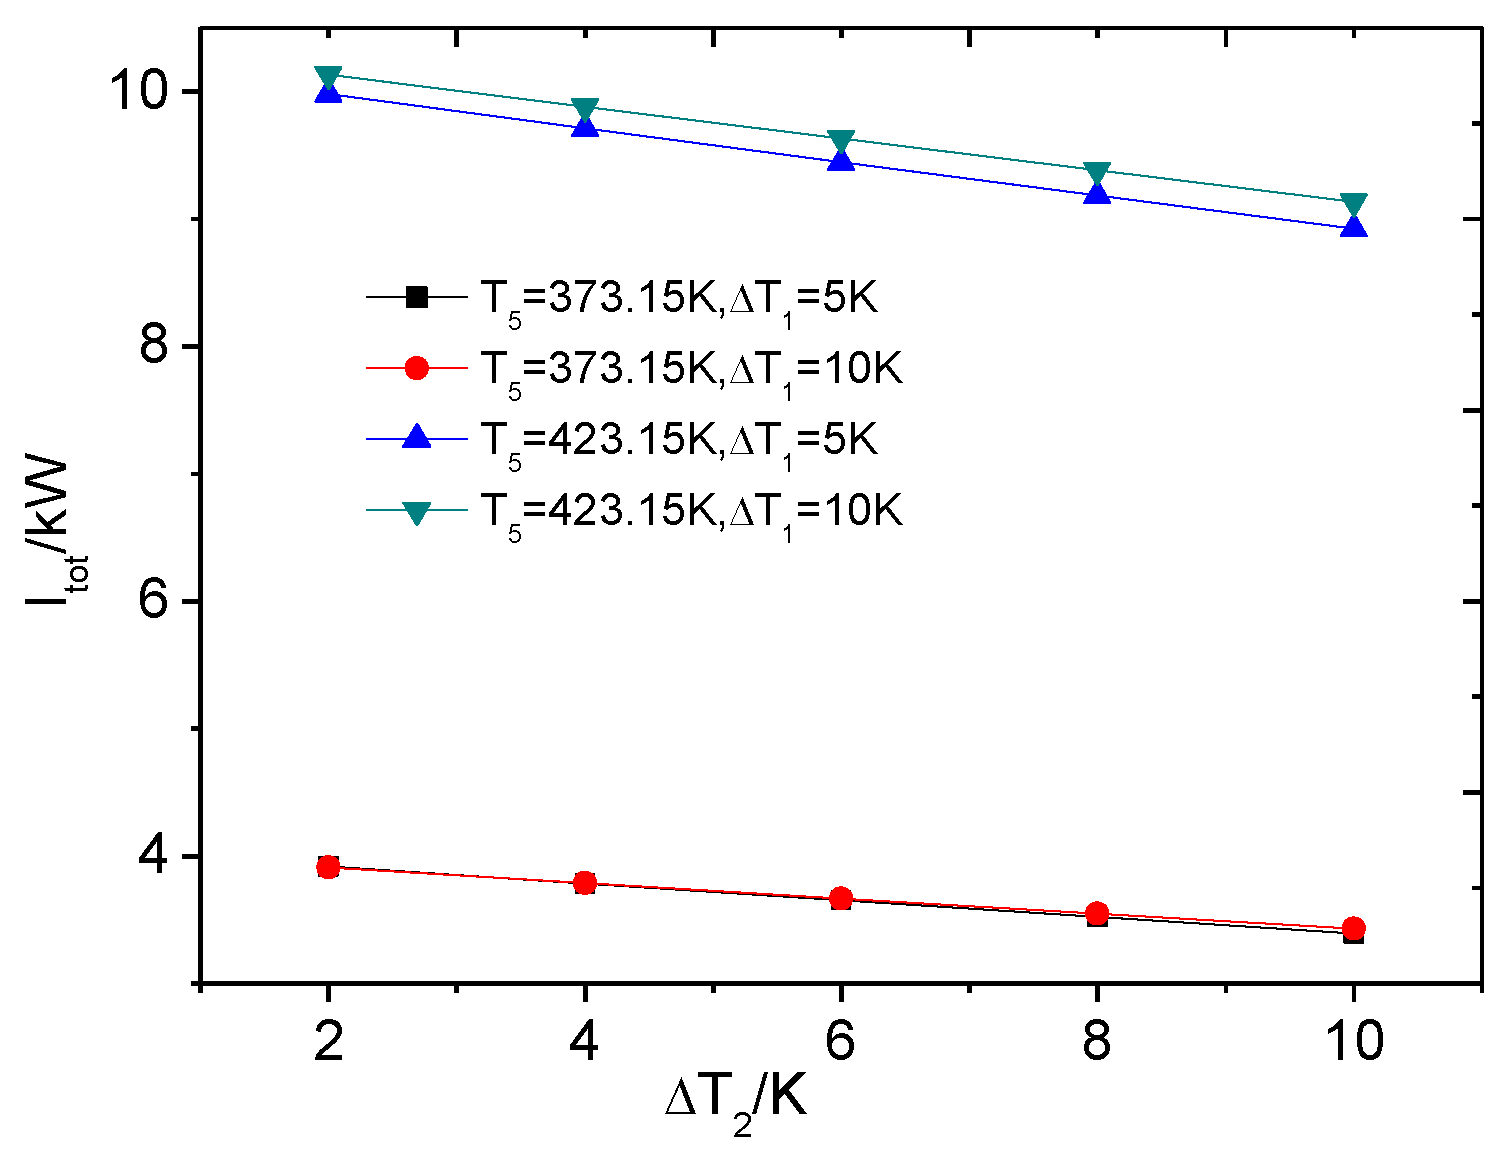
When the isentropic efficiency of the expander is 80%, the relationships between the total exergy loss in ORC, the heat source input temperature and the cooling water temperature rise are shown in Figure 10. Obviously, the total exergy loss of the system reduces with the increase of cooling water temperature rise.
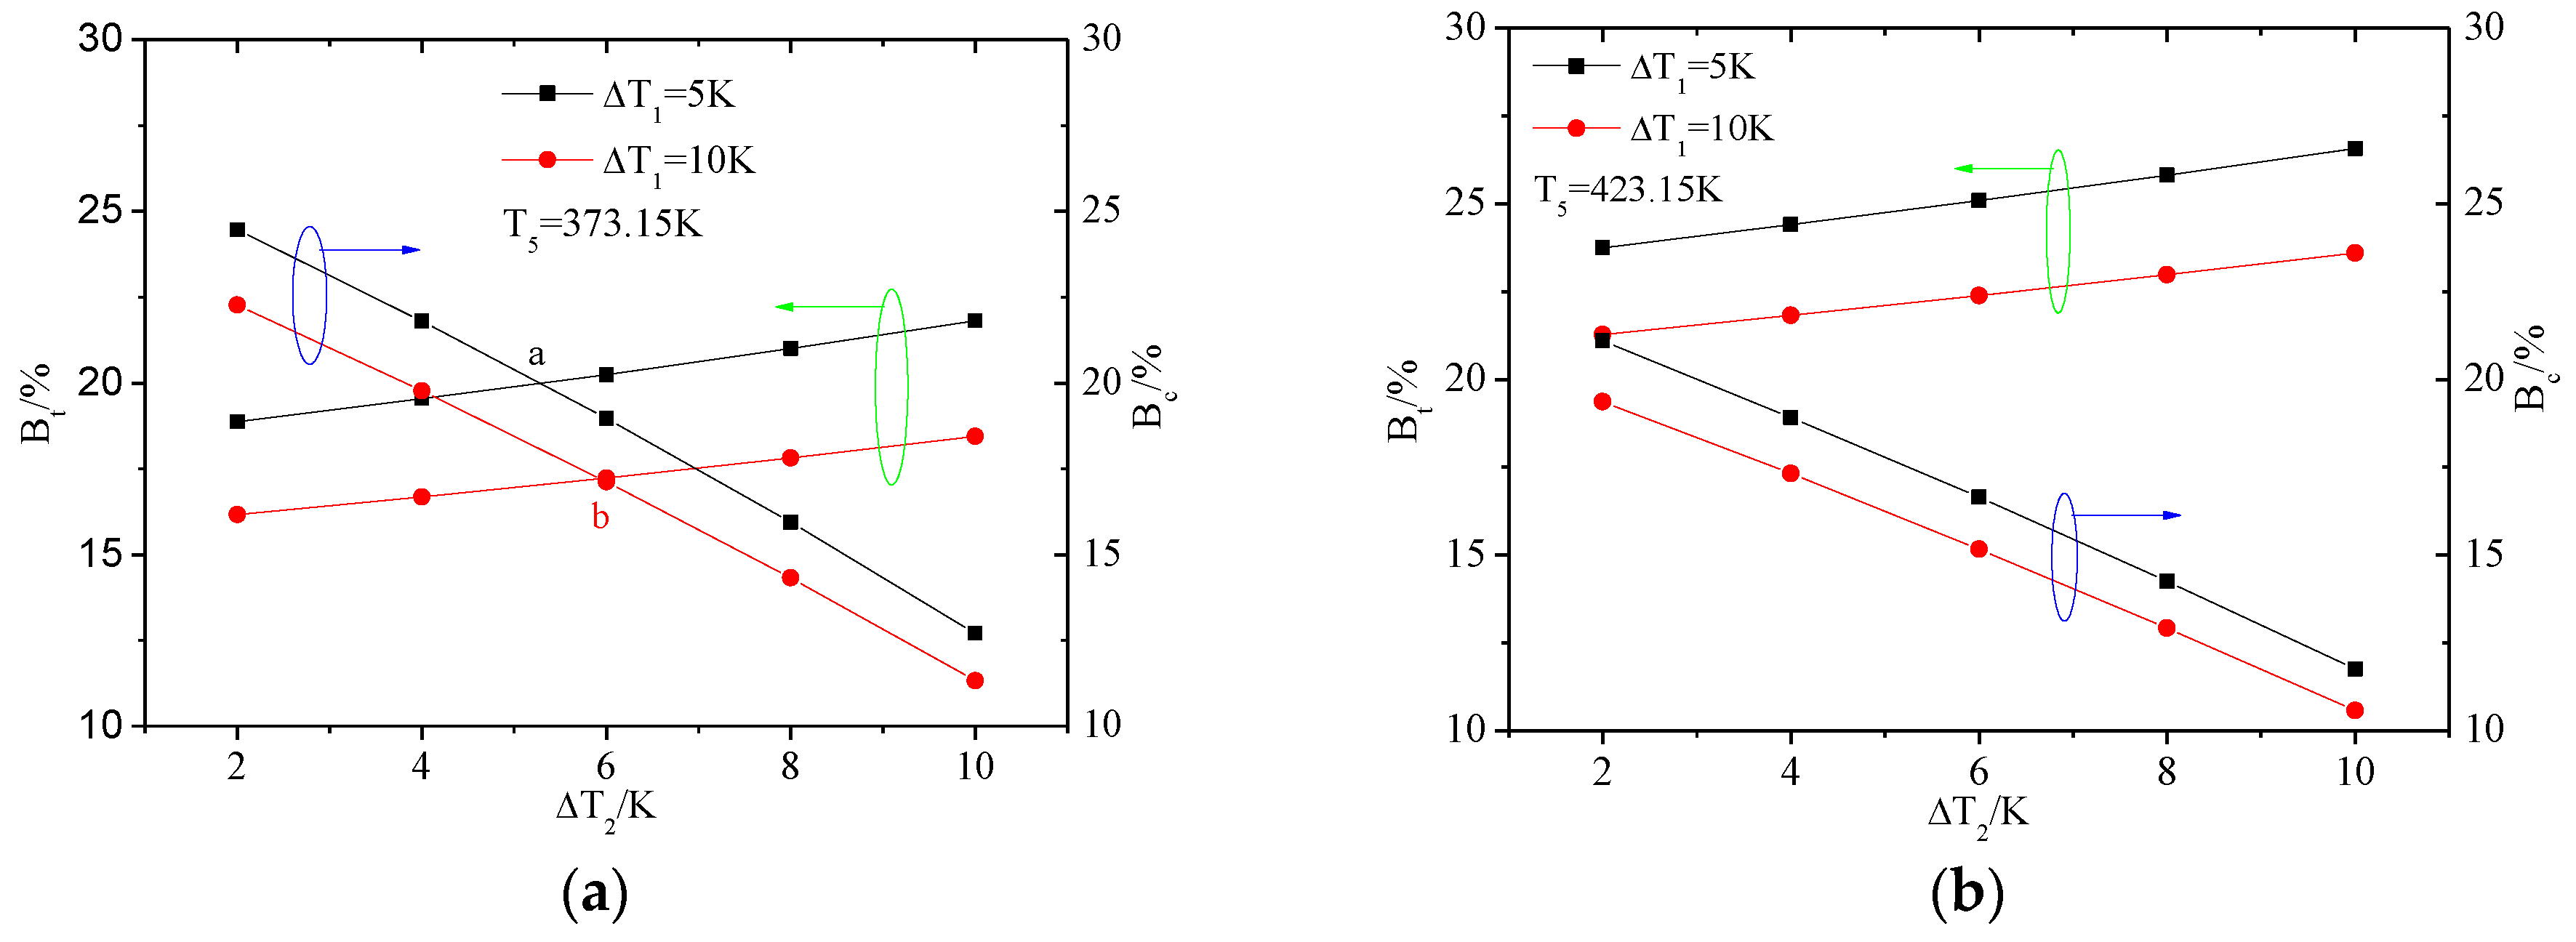
Figure 11 shows the relationship between the proportion of exergy loss in the expander and condenser with different cooling water temperature rise. There are two intersections (i.e., points a and b) in the curves in Figure 11a. The corresponding cooling water temperature rise for points a and b is about 5 K and 6 K, respectively. It can be seen that the change of cooling water temperature rise will also affect the proportion of exergy loss in the expander and condenser. The exergy loss in the expander is always greater than that in the condenser in the range of studied cooling water temperature rise in Figure 11b.
4.3.2. The Heat Transfer Capability of ORC System
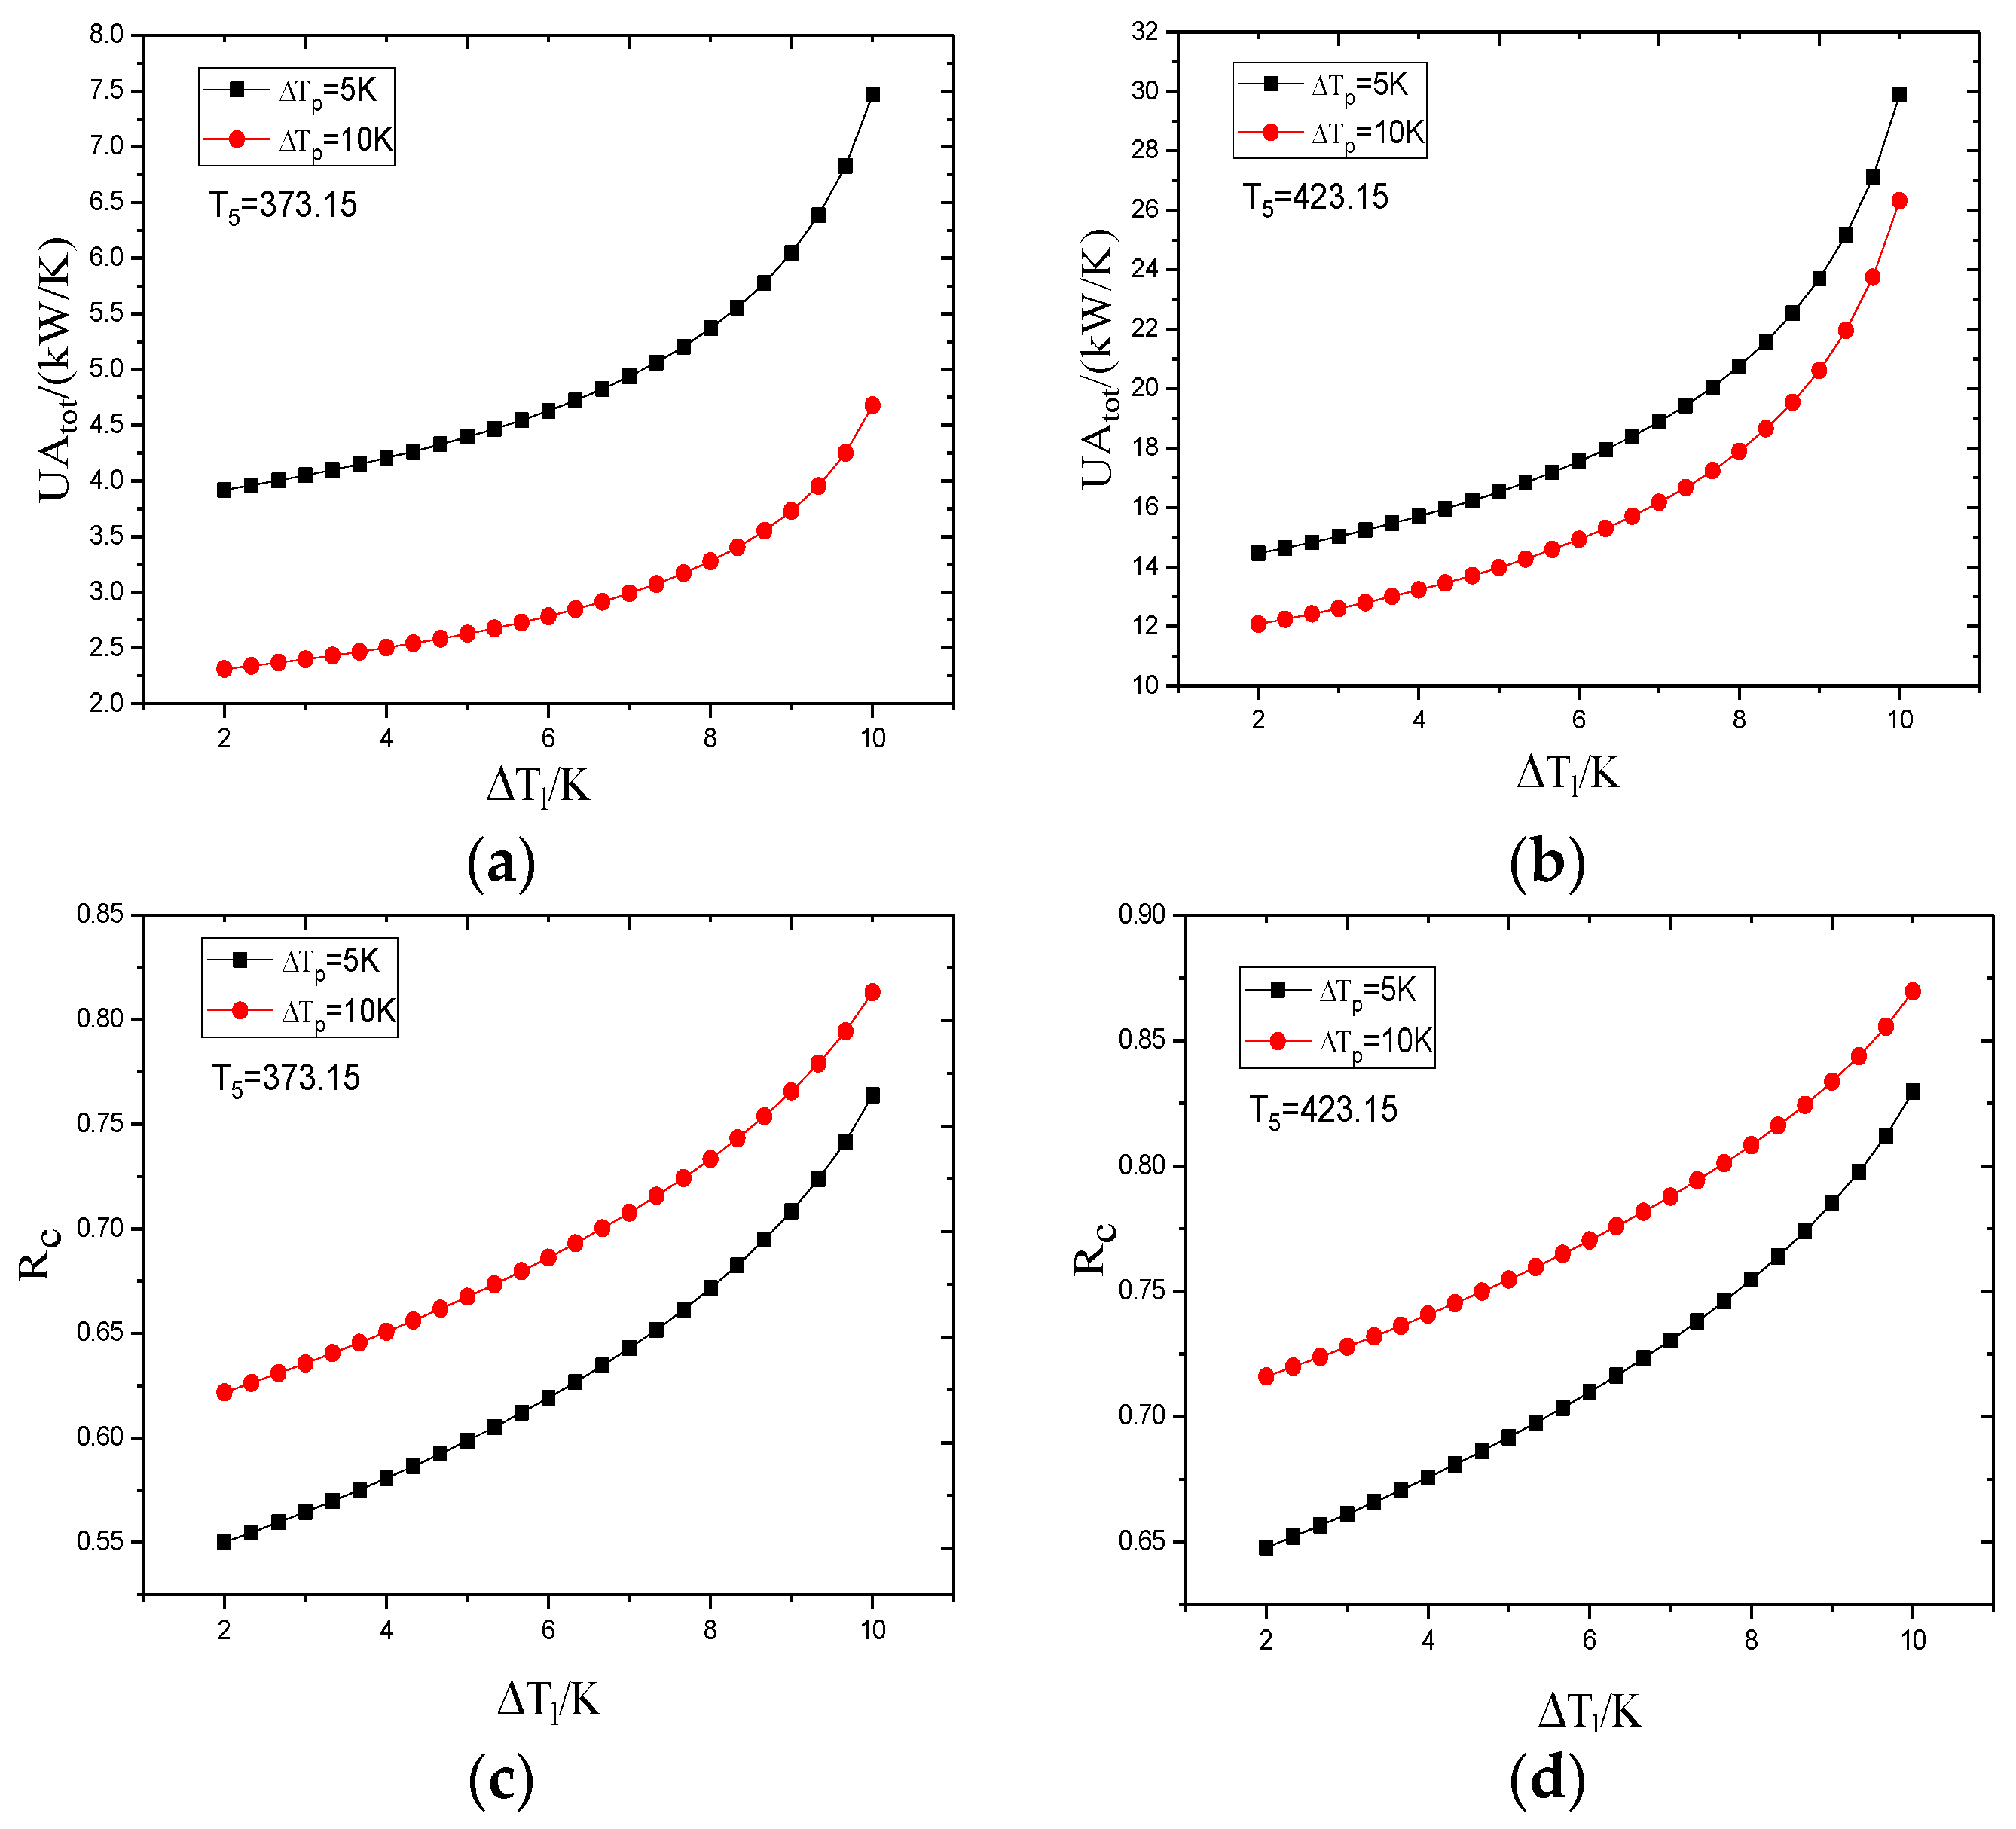
When the heat source temperature is set as 373.15 K and 423.15 K, respectively, and the evaporator pinch point temperature difference is 5 K and 10 K respectively, Figure 12 shows the variation of total heat transfer capability and the variation of proportion of condenser heat transfer capability with different cooling water temperature rise. It can be seen from Figure 12 that at the same heat source temperatures and evaporator pinch point temperature differences, UAtot as well as the proportion of UAc increases with cooling water temperature rise increasing and the increase rate goes up simultaneously. Since the increase of cooling water temperature rise only decreases the logarithmic mean temperature difference in the condenser and the heat exchange in the condenser is unchanged, UAc increases consequently.
It can be summarized from the above results that, as the cooling water temperature rise goes up, the total exergy loss of the system decreases while the total heat transfer capability of the system increases. Meanwhile, the proportions of condenser exergy loss decrease but the proportion of condenser heat transfer capability increases. So, balance should be sought between thermodynamic performance and economic performance.
5. Conclusions
This paper discussed the influence of heat source temperature, the evaporator pinch point temperature difference, the expander isentropic efficiency and the cooling water temperature rise on the exergy loss distribution and the heat transfer capability of the subcritical ORC system by using R245fa as the working fluid. The main conclusions can be summarized as follows:
The total exergy loss in ORC will increase with the rise of the heat source input temperature and will reduce with the increase of the expander isentropic efficiency. The magnitude of evaporator pinch point temperature difference almost does not affect the total exergy loss in ORC. A greater cooling water temperature rise will help to reduce the total exergy loss in ORC. Under a certain condition of the heat source temperature and the evaporator pinch point temperature difference, there exists a critical value of the expander isentropic efficiency. When the expander isentropic efficiency is smaller than the critical value, the exergy loss in the expander will be greater than that in the evaporator. For the condenser and expander, there also exists a critical value of the expander isentropic efficiency. The exergy loss in the condenser may exceed that in the expander. There exists a critical value of the cooling water temperature rise. When the cooling water temperature rise is higher than this critical value, the exergy loss in the expander will be greater than that in the condenser.
From an economic perspective, the total heat transfer capability of the ORC system will increase with the increase of the heat source input temperature and will reduce with the rise of evaporator pinch point temperature difference. The heat transfer capability of the condenser will increase with the increases of the expander isentropic efficiency and cooling water temperature rise, but the effect of the expander isentropic efficiency on the heat transfer ability of the condenser is relatively small.
Acknowledgments
This work was supported by Science and Technology Innovation Talents Program of Henan Province (164100510014), Natural Science Foundation of Henan Province (162300410156), Science and Technology Innovation Fund of Henan Agricultural University (KJCX2016A03), and Henan science and technology project (16210211012).
Author Contributions
Chao He wrote this article, and made a theoretical analysis; Youzhou Jiao helped with developing this work in discussion; Chaochao Tian helped with the Software analysis; Zhenfeng Wang made the relevant statistics; Zhiping Zhang gave the guidance of the theoretical analysis. All authors have read and approved the final manuscript.
Conflicts of Interest
The authors declare no conflict of interest.
Nomenclature
| B | the proportion of exergy loss |
| E | exergy (kW) |
| h | specific enthalpy(kJ·kg−1) |
| exergy loss (kW) | |
| UA | the heat transfer capability (kW/K) |
| mass flow rate (kg s−1) | |
| the heat rate injected and rejected (kW) | |
| s | specific entropy (kJ·kg−1) |
| T | temperature (K) |
| Th | the average temperature of waste heat source (K) |
| Tl | the average temperature of cooling water (K) |
| power output or input (kW) |
Greek symbols
| efficiency (dimensionless) |
Subscripts
| c | condenser |
| evp | evaporator |
| g | generator |
| h | waste heat source |
| net | net |
| p | pump |
| s | isentropic |
| t | expander |
| th | thermal |
| tot | total |
| wf | working fluid |
| 0 | reference state point |
| 1–8 | state points |
| 2s, 4s | stat points for the ideal case |
References
- Tamamoto, T.; Furuhata, T.; Arai, N.; Mori, K. Design and testing of the organic Rankine cycle. Energy 2001, 26, 239–251. [Google Scholar] [CrossRef]
- Liu, B.T.; Chien, K.H.; Wang, C.C. Effect of working fluids on organic Rankine cycle for waste heat recovery. Energy 2004, 29, 1207–1217. [Google Scholar] [CrossRef]
- Wei, D.H.; Lu, X.S.; Lu, Z.; Gu, J.M. Dynamic modeling and simulation of an Organic Rankine Cycle (ORC) system for waste heat recovery. Appl. Therm. Eng. 2008, 28, 1216–1224. [Google Scholar] [CrossRef]
- Roy, J.P.; Mishra, M.K.; Misra, A. Performance analysis of an Organic Rankine Cycle with superheating under different heat source temperature conditions. Appl. Energy 2011, 88, 2995–3004. [Google Scholar] [CrossRef]
- Pierobon, L.; Benato, A.; Scolari, E.; Haglind, F.; Stoppato, A. Waste heat recovery technologies for offshore platforms. Appl. Energy 2014, 136, 228–241. [Google Scholar] [CrossRef]
- Benato, A.; Kærn, M.R.; Pierobon, L.; Stoppato, A.; Haglind, F. Analysis of hot spots in boilers of organic Rankine cycle units during transient operation. Appl. Energy 2015, 151, 119–131. [Google Scholar] [CrossRef]
- Benato, A.; Macor, A. Biogas engine waste heat recovery using organic Rankine cycle. Energies 2017, 10, 327. [Google Scholar] [CrossRef]
- Hung, T.C.; Wang, S.K.; Kuo, C.H.; Pei, B.S.; Tsai, K.F. A study of organic working fluids on system efficiency of an ORC using low-grad energy sources. Energy 2010, 35, 1403–1411. [Google Scholar] [CrossRef]
- Mago, P.J.; Chamra, L.M.; Somayaji, C. Performance analysis of different working fluids for use in organic Rankin cycles. Proc. Inst. Mech. Eng. Part A 2007, 221, 255–264. [Google Scholar] [CrossRef]
- Chen, H.J.; Goswami, D.Y.; Stefanakos, E.K. A review of thermodynamic cycles and working fluids for the conversion of low-grade heat. Renew. Sustain. Energy Rev. 2010, 14, 3059–3067. [Google Scholar] [CrossRef]
- Saleh, B.; Koglbauer, G.; Wendland, M.; Fischer, J. Working fluids for low-temperature organic Rankine cycles. Energy 2007, 32, 1210–1221. [Google Scholar] [CrossRef]
- Lai, N.A.; Wendland, M.; Fischer, J. Working fluids for high-temperature organic Rankine cycles. Energy 2011, 36, 199–211. [Google Scholar] [CrossRef]
- Hung, T.C. Waste heat recovery of organic Rankine cycle using dry fluids. Energy Convers. Manag. 2001, 42, 539–553. [Google Scholar] [CrossRef]
- Wei, D.H.; Lu, X.S.; Lu, Z.; Gu, J.M. Performance analysis and optimization of organic Rankine cycle (ORC) for waste heat recovery. Energy Convers. Manag. 2007, 48, 1113–1119. [Google Scholar] [CrossRef]
- Mago, P.J.; Srinivasan, K.K.; Chamra, L.M.; Somayaji, C. An examination of exergy destruction in organic Rankine cycles. Int. J. Energy Res. 2008, 32, 926–938. [Google Scholar] [CrossRef]
- Tchanche, B.F.; Papadakis, G.; Lambrinos, G. Frangoudakis, A. Fluid selection for a low-temperature solar organic Rankine cycle. Appl. Therm. Eng. 2009, 29, 2468–2476. [Google Scholar] [CrossRef]
- Aijundi, I.H. Effect of dry hydrocarbons and critical point temperature on the efficiencies of organic Rankine cycle. Renew. Energy 2011, 36, 1196–1202. [Google Scholar] [CrossRef]
- Wang, E.H.; Zhang, H.G.; Fan, B.Y.; Ouyang, M.G.; Zhao, Y.; Mu, Q.H. Study of working fluid selection of organic Rankine cycle (ORC) for engine waste heat recovery. Energy 2011, 36, 3406–3418. [Google Scholar] [CrossRef]
- Xu, R.J.; He, Y.L. A vapor injector-based novel regenerative organic Rankine cycle. Appl. Therm. Eng. 2011, 31, 1238–1243. [Google Scholar] [CrossRef]
- Guo, T.; Wang, H.X.; Zhang, S.J. Comparative analysis of natural and conventional working fluids for use in transcriticalRankine cycle using low-temperature geothermal source. Int. J. Energy Res. 2011, 35, 530–544. [Google Scholar] [CrossRef]
- Mago, P.J.; Luck, R. Energetic and exergetic analysis of waste heat recovery from a microturbine using organic Rankine cycles. Int. J. Energy Res. 2012. [Google Scholar] [CrossRef]
- Manolakos, D.; Kosmadakis, G.; Kyritsis, S.; Papadakis, G. Identification of behaviour and evaluation of performance of small scale, low-temperature organic Rankine cycle system coupled with a RO desalination unit. Energy 2009, 34, 767–774. [Google Scholar] [CrossRef]
- Peterson, R.B.; Wang, H.; Herron, T. Performance of small-scale regenerative Rankine power cycle employing a scroll expander. Proc. Inst. Mech. Eng. Part A 2008, 222, 271–282. [Google Scholar] [CrossRef]
- Wang, X.D.; Zhao, L.; Wang, J.L.; Zhang, W.Z.; Zhao, X.Z.; Wu, W. Performance evaluation of a low-temperature solar Rankine cycle system utilizing R245fa. Sol. Energy 2010, 84, 353–364. [Google Scholar] [CrossRef]
- Lemort, V.; Quoilin, S.; Cuevas, C.; Lebrun, J. Testing and modeling a scroll expander integrated into an organic Rankine cycle. Appl. Therm. Eng. 2009, 29, 3094–3102. [Google Scholar] [CrossRef]
- Quoilin, S.; Lemort, V.; Lebrun, J. Experimental study and modeling of an organic Rankine cycle using scroll expander. Appl. Energy 2010, 87, 1260–1268. [Google Scholar] [CrossRef]
- Li, J.; Pei, G.; Li, Y.Z.; Ji, J. Evaluation of external heat loss from a small-scale expander used in organic Rankine cycle. Appl. Therm. Eng. 2011, 31, 2694–2701. [Google Scholar] [CrossRef]
- Liu, G.; Zhao, Y.; Li, L.; Shu, P. Simulation and experiment research on wide ranging working process of scroll expander driven by compressed air. Appl. Therm. Eng. 2010, 30, 2073–2079. [Google Scholar]
- James, A.M.; Jon, R.J.; Cao, J.; Douglas, K.P.; Richard, N.C. Experimental testing of gerotor and scroll expanders used in, and energetic and exergetic modeling of an organic Rankine cycle. J. Energy Resour. Technol. 2009, 131, 201–208. [Google Scholar]
- Heberle, F.; Brüggemann, D. Exergy based fluid selection for a geothermal Organic Rankine Cycle for combined heat and power generation. Appl. Therm. Eng. 2010, 30, 1326–1332. [Google Scholar] [CrossRef]
- Heberle, F.; Preißinger, M.; Brüggemann, D. Zeotropic mixtures as working fluids in Organic Rankine Cycles for low-enthalpy geothermal resources. Renew. Energy 2012, 37, 364–370. [Google Scholar] [CrossRef]
- Eller, T.; Heberle, F.; Brüggemann, D. Second law analysis of novel working fluid pairs for waste heat recovery by the Kalina cycle. Energy 2017, 119, 188–198. [Google Scholar] [CrossRef]
- Liu, C.; He, C.; Gao, H.; Xu, X.X.; Xu, J.L. The optimal evaporation temperature of subcritical ORC based on second law efficiency for waste heat recovery. Entropy 2012, 14, 491–504. [Google Scholar] [CrossRef]
- Pezzuolo, A.; Benato, A.; Stoppato, A.; Mirandola, A. The ORC-PD: A versatile tool for fluid selection and Organic Rankine Cycle unit design. Energy 2016, 102, 605–620. [Google Scholar] [CrossRef]
- Guo, T.; Wang, H.X.; Zhang, S.J. Fluids and parameters optimization for a novel cogeneration system drivenby low-temperature geothermal sources. Energy 2011, 36, 2639–2649. [Google Scholar] [CrossRef]
- Eyerera, S.; Wielanda, C.; Vandersickela, A.; Spliethoff, H. Experimental study of an ORC (Organic Rankine Cycle) and analysis of R1233zd-E as a drop-in replacement for R245fa for low temperature heat utilization. Energy 2016, 103, 660–671. [Google Scholar] [CrossRef]
- Wielanda, C.; Meinela, D.; Eyerera, S.; Spliethoff, H. Innovative CHP concept for ORC and its benefit compared to conventional concepts. Appl. Energy 2016, 183, 478–490. [Google Scholar] [CrossRef]
- Dai, Y.P.; Wang, J.F.; Lin, G. Parametric optimization and comparative study of organic Rankine cycle (ORC) for low grade waste heat recovery. Energy Convers. Manag. 2009, 50, 576–582. [Google Scholar] [CrossRef]
Figure 1.
The diagram of Organic Rankine Cycle (ORC). (a) The system diagram; (b) The T–s diagram.
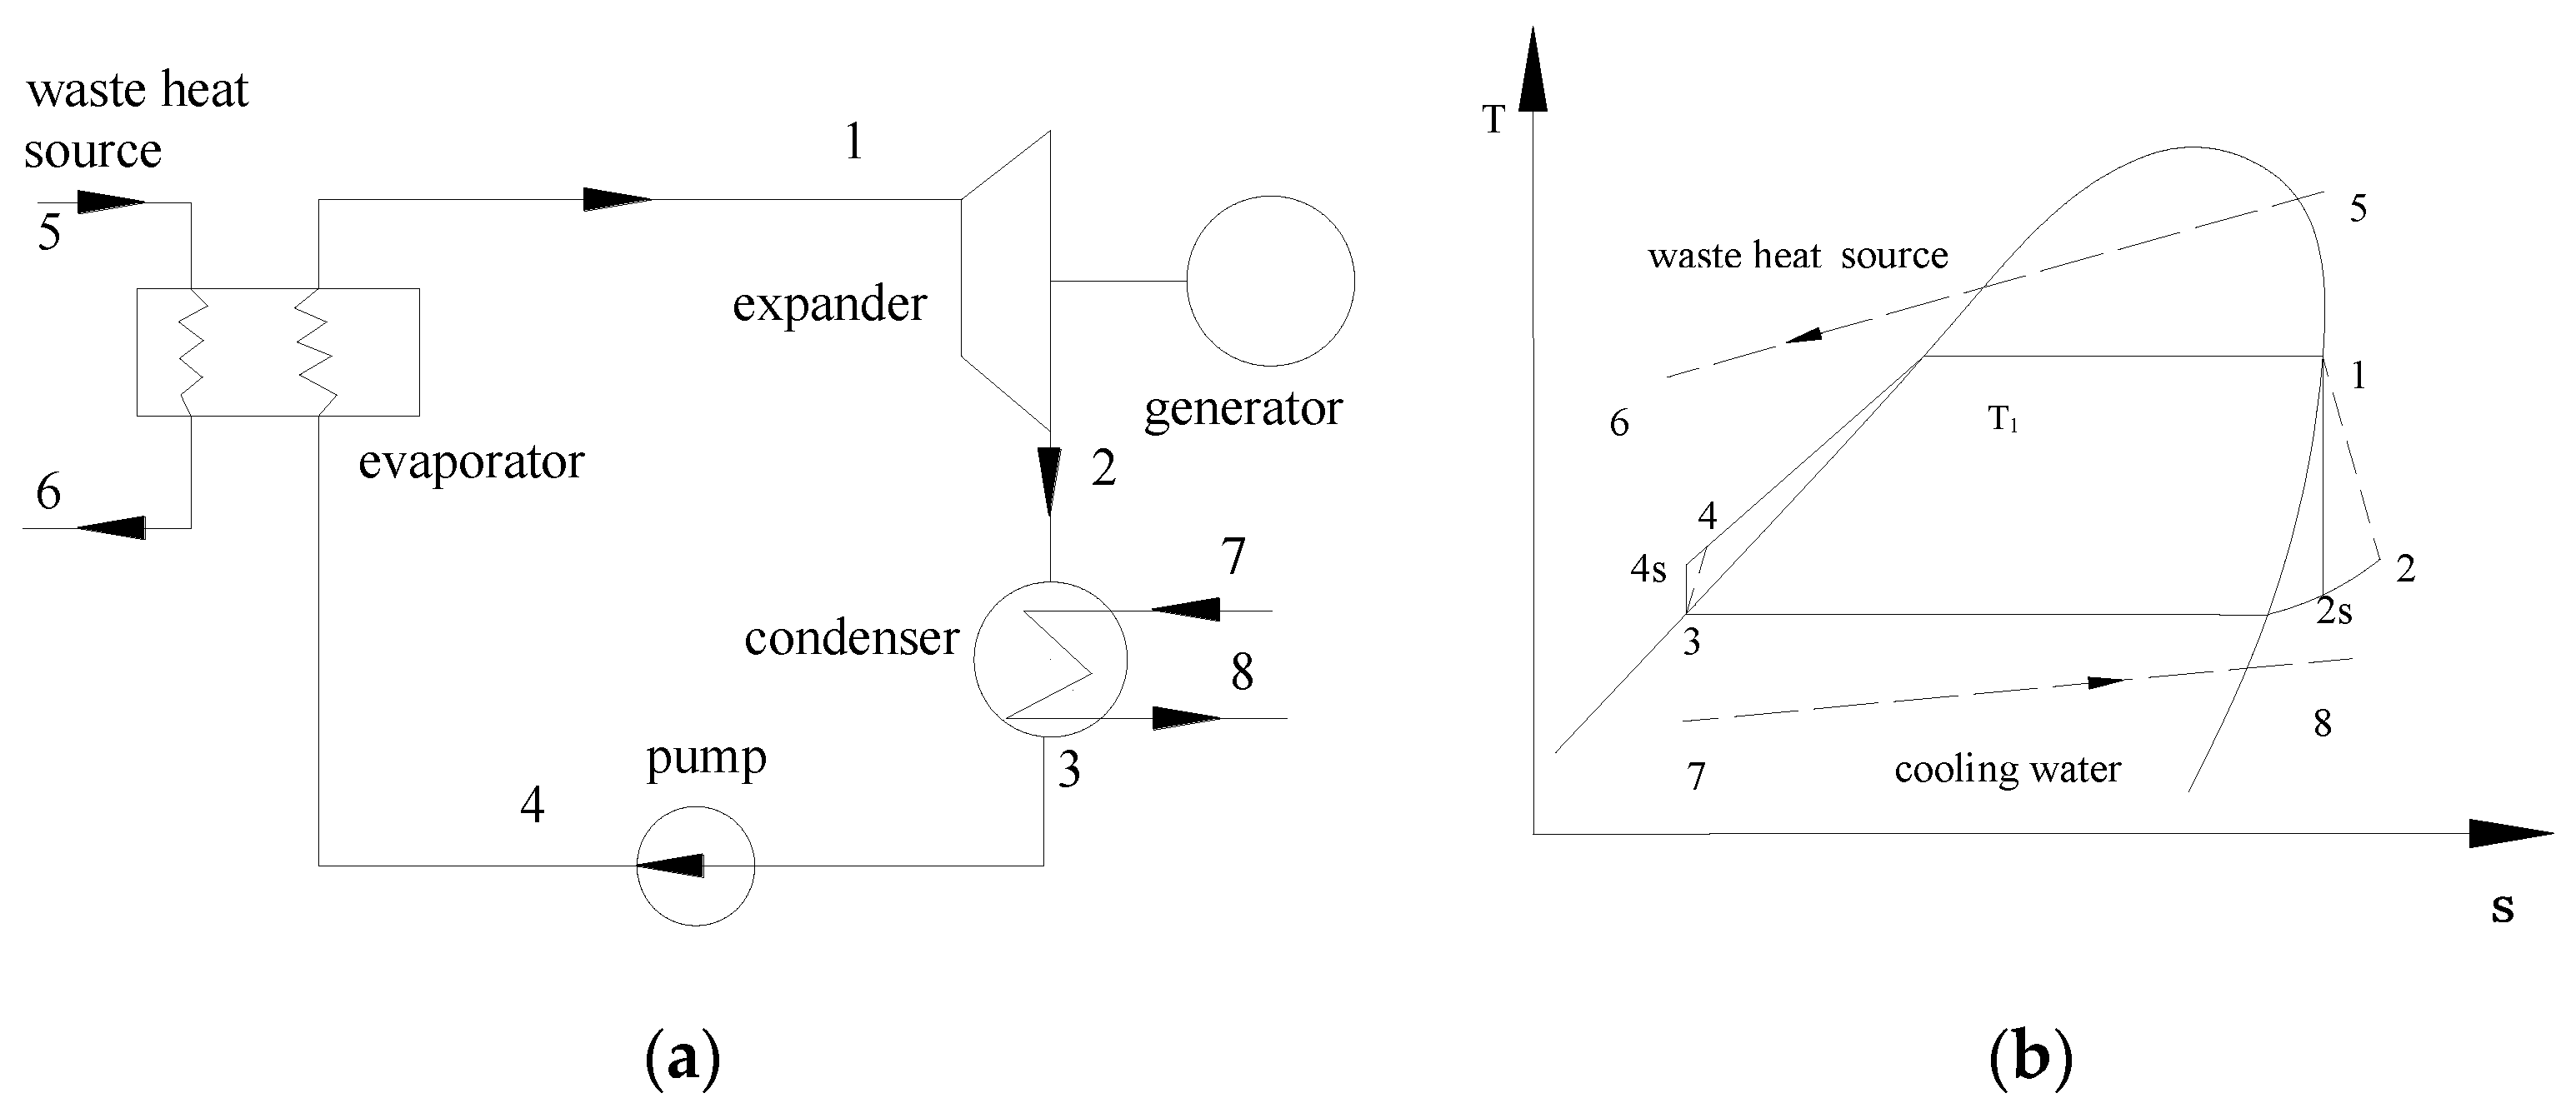
Figure 2.
The change of the total exergy loss in ORC.
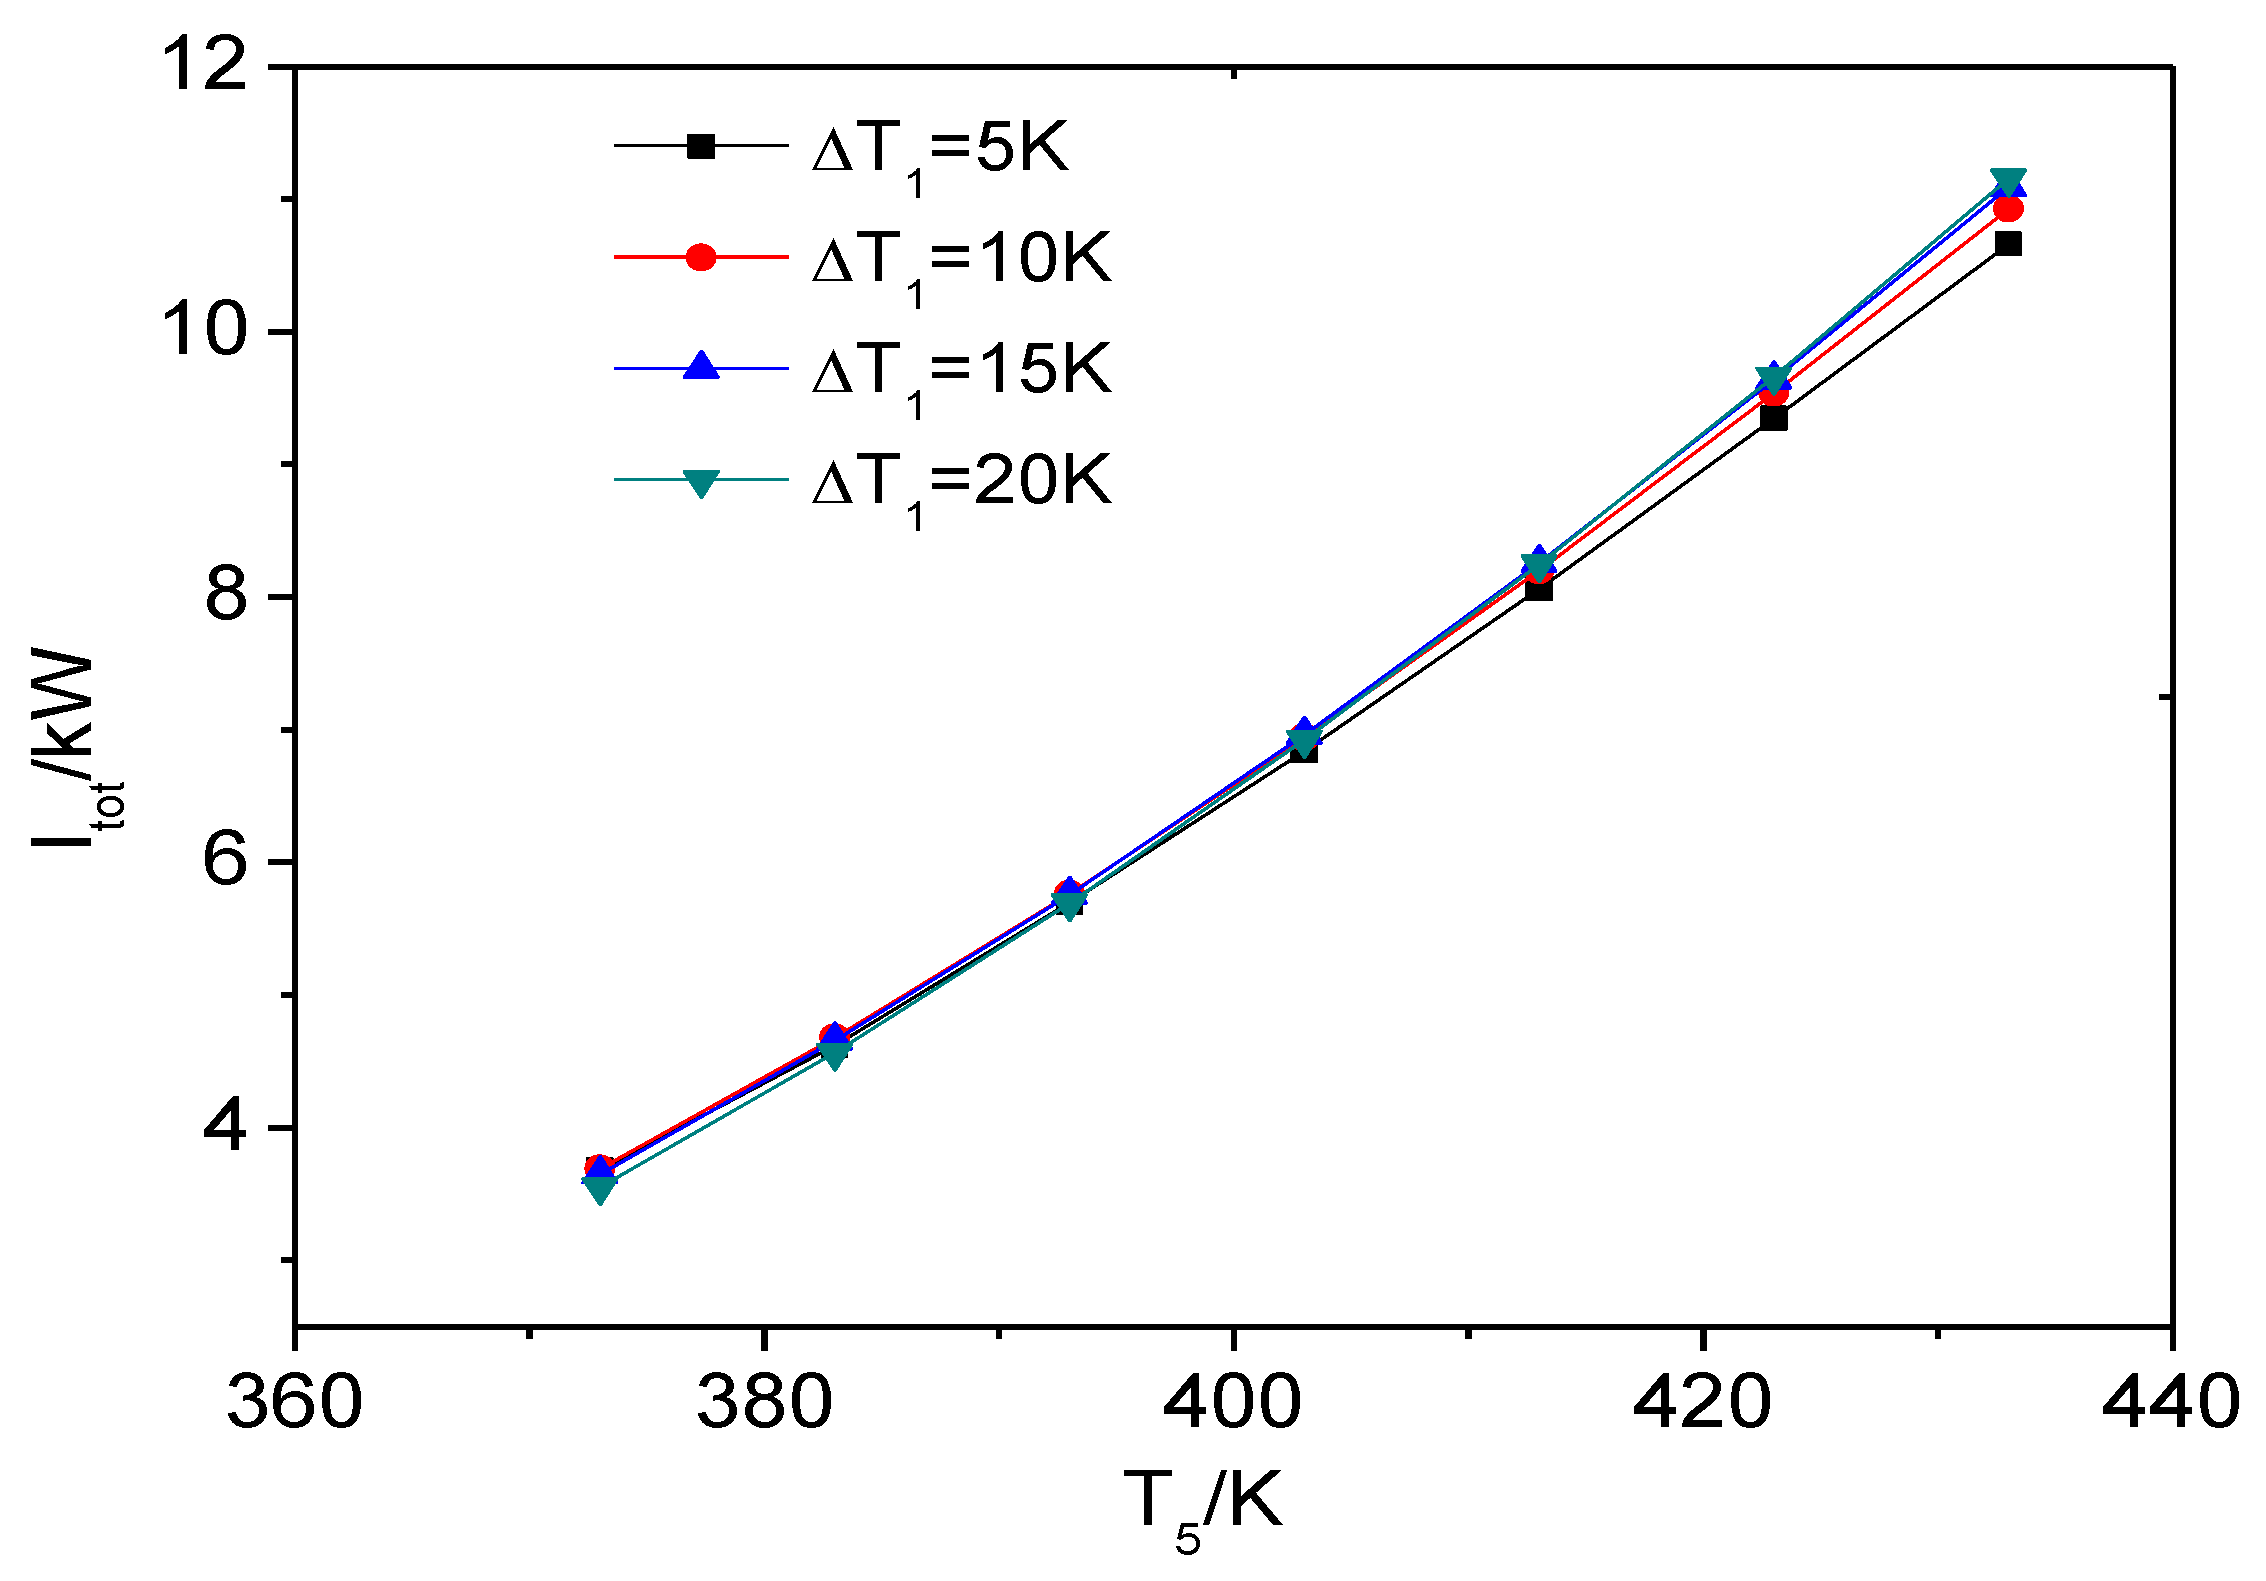
Figure 3.
The proportion of exergy loss in the evaporator, expander, condenser and pump of ORC. (a) evaporator; (b) expander; (c) condenser; (d) pump.
Figure 3.
The proportion of exergy loss in the evaporator, expander, condenser and pump of ORC. (a) evaporator; (b) expander; (c) condenser; (d) pump.

Figure 4.
The comparison of the proportion of exergy loss in the expander and condenser.

Figure 5.
The effects of T5 and evaporator pinch point temperature difference. (a) UAevp; (b) UAc; (c) proportion of UAevp; (d) proportion of UAc.
Figure 5.
The effects of T5 and evaporator pinch point temperature difference. (a) UAevp; (b) UAc; (c) proportion of UAevp; (d) proportion of UAc.

Figure 6.
The total exergy loss in ORC at different expander isentropic efficiencies.
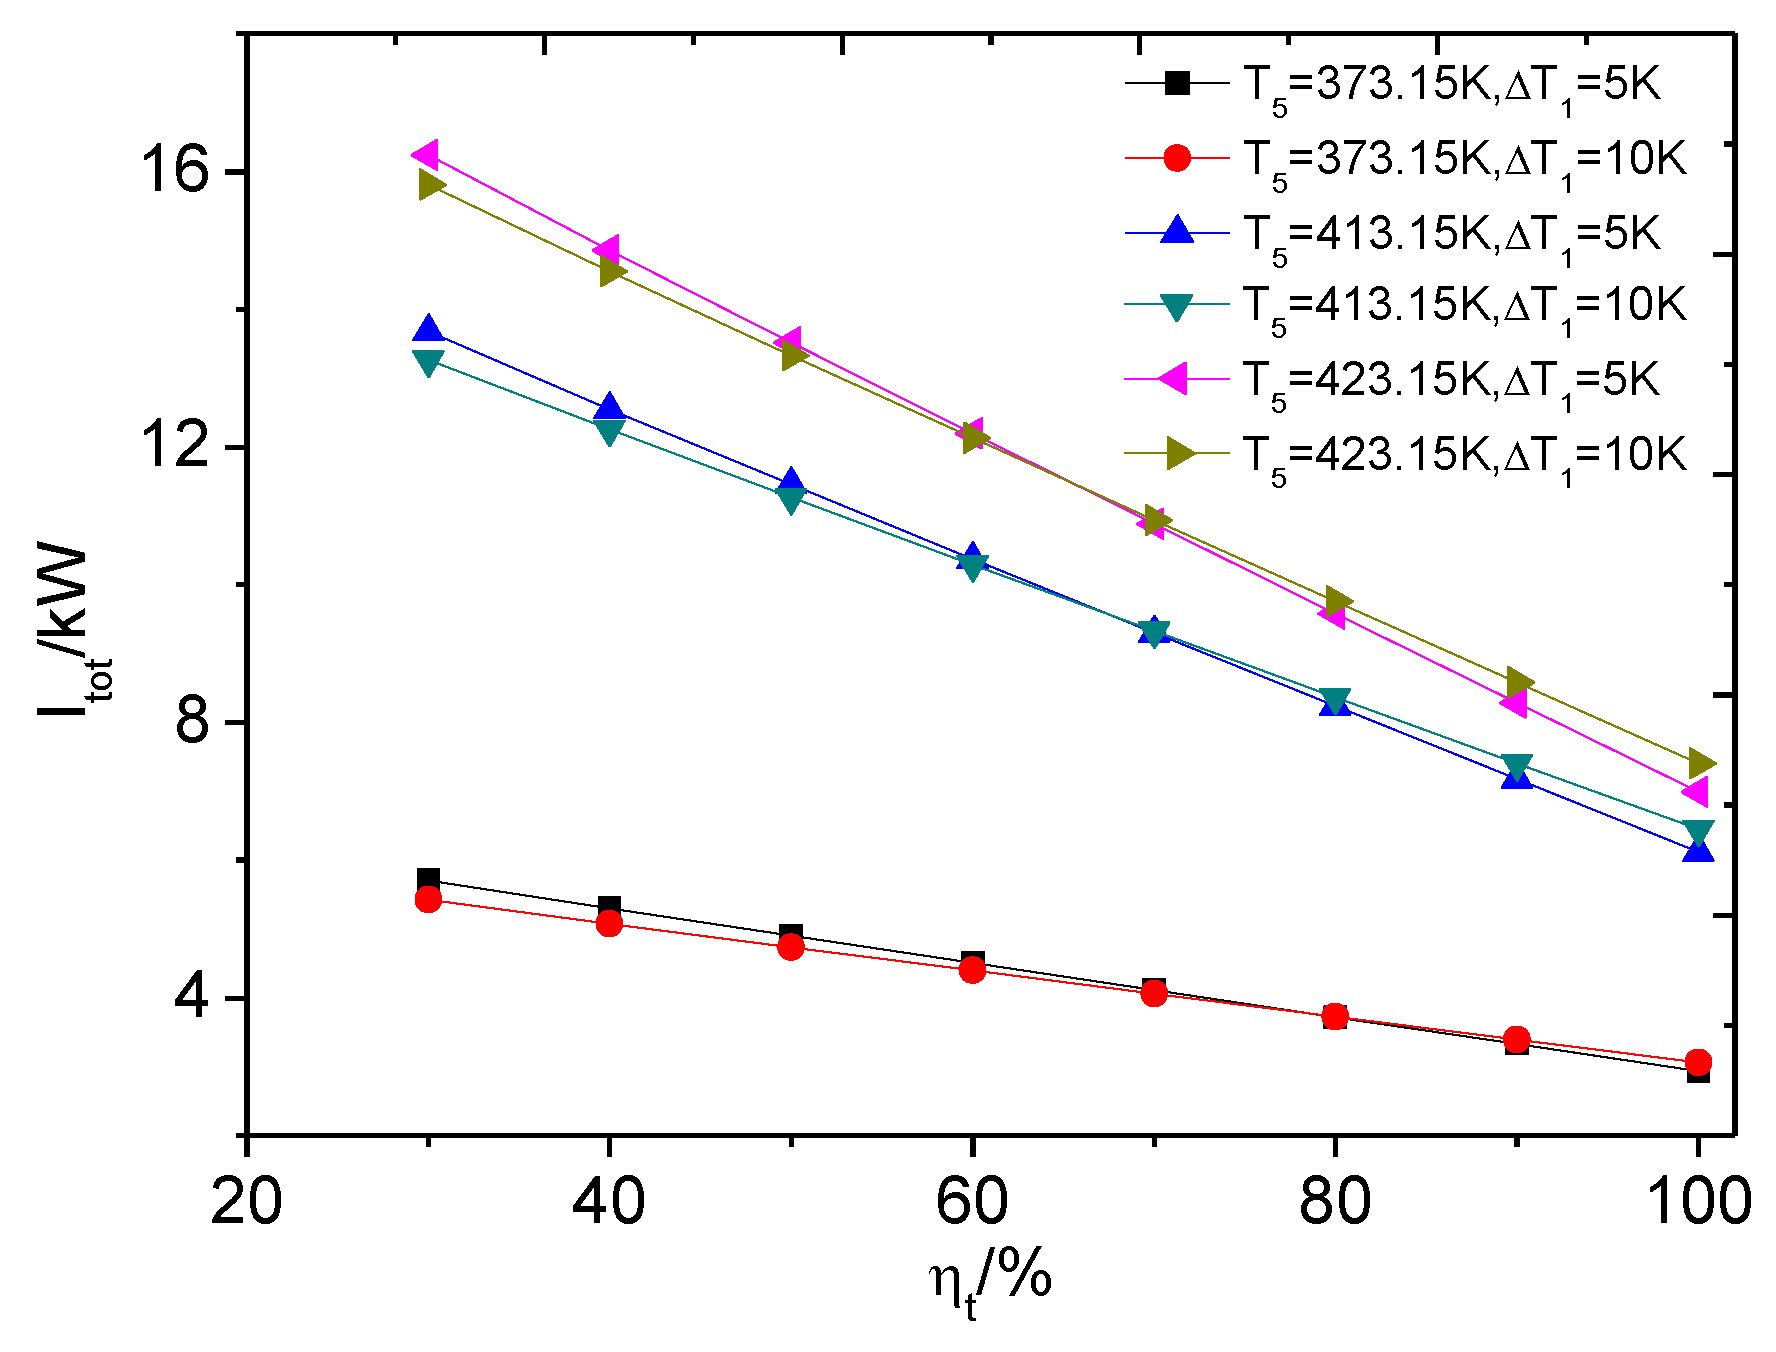
Figure 7.
The influence of expander isentropic efficiency. (a) T5 = 373.15 K; (b) T5 = 413.15 K; (c) T5 = 423.15 K.
Figure 7.
The influence of expander isentropic efficiency. (a) T5 = 373.15 K; (b) T5 = 413.15 K; (c) T5 = 423.15 K.

Figure 8.
The influence of expander isentropic efficiency. (a)T5 = 373.15 K; (b) T5 = 413.15 K; (c) T5 = 423.15 K.
Figure 8.
The influence of expander isentropic efficiency. (a)T5 = 373.15 K; (b) T5 = 413.15 K; (c) T5 = 423.15 K.

Figure 9.
The influence of expander isentropic efficiency on UAtot. (a) UAtot when T5 = 373.15 K; (b) UAtot when T5 = 413.15 K; (c) UAtot when T5 = 423.15 K.
Figure 9.
The influence of expander isentropic efficiency on UAtot. (a) UAtot when T5 = 373.15 K; (b) UAtot when T5 = 413.15 K; (c) UAtot when T5 = 423.15 K.

Figure 10.
The total exergy loss with cooling water temperature rise.

Figure 11.
The influence of cooling water temperature rise. (a) T5 = 373.15 K; (b) T5 = 423.15 K.

Figure 12.
The influence of cooling water temperature rise on UA. (a) UAtot when T5 = 373.15 K; (b) UAtot when T5 = 423.15 K; (c) The proportion of UAc when T5 = 373.15 K; (d) The proportion of UAc when T5 = 423.15 K.
Figure 12.
The influence of cooling water temperature rise on UA. (a) UAtot when T5 = 373.15 K; (b) UAtot when T5 = 423.15 K; (c) The proportion of UAc when T5 = 373.15 K; (d) The proportion of UAc when T5 = 423.15 K.


Table 1.
Specifications of the ORC conditions.
| Description | Data |
|---|---|
| Waste heat inlet temperature (K) | 373.15–433.15 |
| The mass flow rate of heat source (kg/s) | 1 |
| The evaporator pinch point temperature difference (K) | 5–20 |
| Expander isentropic efficiency (%) | 30–100 |
| Pump isentropic efficiency (%) | 75 |
| Cooling water inlet temperature (K) | 293.15 |
| Cooling water temperature rise (K) | 2–10 |
| Environment temperature (K) | 293.15 |
| Environment pressure (kPa) | 100 |
Table 2.
A comparison of results.
| Working Fluid | T1 (K) | P1 (kPa) | T2 (K) | P2 (kPa) | T4 (K) | (kg/s) | (kW) | (%) | Data Source |
|---|---|---|---|---|---|---|---|---|---|
| R123 | 356.38 | 530 | 311.59 | 91 | 298.5 | 6.47 | 156.91 | 11.83 | Reference [38] |
| R123 | 356.4 | 531.7 | 312.2 | 91.48 | 298.5 | 6.036 | 147.9 | 11.88 | This paper |
© 2017 by the authors. Licensee MDPI, Basel, Switzerland. This article is an open access article distributed under the terms and conditions of the Creative Commons Attribution (CC BY) license (http://creativecommons.org/licenses/by/4.0/).
Share and Cite
MDPI and ACS Style
He, C.; Jiao, Y.; Tian, C.; Wang, Z.; Zhang, Z. The Exergy Loss Distribution and the Heat Transfer Capability in Subcritical Organic Rankine Cycle. Entropy 2017, 19, 256. https://doi.org/10.3390/e19060256
AMA Style
He C, Jiao Y, Tian C, Wang Z, Zhang Z. The Exergy Loss Distribution and the Heat Transfer Capability in Subcritical Organic Rankine Cycle. Entropy. 2017; 19(6):256. https://doi.org/10.3390/e19060256
Chicago/Turabian StyleHe, Chao, Youzhou Jiao, Chaochao Tian, Zhenfeng Wang, and Zhiping Zhang. 2017. "The Exergy Loss Distribution and the Heat Transfer Capability in Subcritical Organic Rankine Cycle" Entropy 19, no. 6: 256. https://doi.org/10.3390/e19060256
Note that from the first issue of 2016, this journal uses article numbers instead of page numbers. See further details here.