
Assessing Catchment Resilience Using Entropy Associated with Mean Annual Runoff for the Upper Vaal Catchment in South Africa


Department of Civil Engineering, College of Science, Engineering and Technology, Private Bag X6, Florida Campus, University of South Africa, Florida 1710, South Africa
Entropy 2017, 19(5), 147; https://doi.org/10.3390/e19050147
Submission received: 19 October 2016
/
Revised: 2 March 2017
/
Accepted: 20 March 2017
/
Published: 27 April 2017
(This article belongs to the Special Issue Entropy for Sustainable and Resilient Urban Future)
Abstract
:The importance of the mean annual runoff (MAR)-hydrological variable is paramount for catchment planning, development and management. MAR depicts the amount of uncertainty or chaos (implicitly information content) of the catchment. The uncertainty associated with MAR of quaternary catchments (QCs) in the Upper Vaal catchment of South Africa has been quantified through Shannon entropy. As a result of chaos over a period of time, the hydrological catchment behavior/response in terms of MAR could be characterized by its resilience. Uncertainty (chaos) in QCs was used as a surrogate measure of catchment resilience. MAR data on surface water resources (WR) of South Africa of 1990 (i.e., WR90), 2005 (WR2005) and 2012 (W2012) were used in this study. A linear zoning for catchment resilience in terms of water resources sustainability was defined. Regression models (with high correlation) between the relative changes/variations in MAR data sets and relative changes in entropy were established, for WR2005 and WR2012. These models were compared with similar relationships for WR90 and WR2005, previously reported. The MAR pseudo-elasticity of the uncertainty associated with MAR was derived from regression models to characterize the resilience state of QCs. The MAR pseudo-elasticity values were relatively small to have an acceptable level of catchment resilience in the Upper Vaal catchment. Within the resilience zone, it was also shown that the effect of mean annual evaporation (MAE) was negatively significant on MAR pseudo-elasticity, compared to the effect of mean annual precipitation (MAP), which was positively insignificant.
1. Introduction
The second law of thermodynamics (in physics) related to the most appealing concept of entropy, which expresses the chaos, uncertainty or disorder of a system. The concept of Shannon or theoretic entropy, used for the first time in communication theory, was extended in the last two decades to water related fields, e.g., [1,2]. Shannon used entropy to express the information transmitted through a communication channel [3]. The reduction of entropy of a variable is equivalent to the information transmitted or gained, by means of making inferences about a variable [2,4,5,6]. The versatility of the entropy concept is shown across several disciplines: chemistry, engineering metallurgy, environmental sciences, urban planning, hydrology and water resources. For instance, in the field of hydrology and water resources, it was shown that entropy could be used to measure the degree of complexity or uncertainty of streamflow in catchments [2,4,5,6]. From a theoretical perspective, the connection between entropy and resilience was established, e.g., for urban systems [7], for social systems [8], for coupled human and natural systems [9], and, recently, for catchments as complex dynamic systems [10]. From this connection, system sustainability/vulnerability was associated with resilience/entropy [8,9]. It was also argued that Shannon entropy could be used to characterize resilience/sustainability of complex systems [9,10] because of the neutrality with which that this information-based concept (Shannon entropy) deals with feedbacks and their impacts on a given system with respect to human considerations [9]. Explicit mathematical relationships between entropy and resilience were established for hydraulic systems such as water distribution networks, e.g., [11,12]. The resilience of a system can be associated with the capacity of the system to recover from shock or disturbances/perturbations [13]. System resilience has also been associated with the flip side of system vulnerability [7,14,15] whereas it was argued that the robustness of the system could be considered as the flip side of vulnerability and resilience could be less than the flip side of vulnerability [16]. Both resilience and vulnerability concepts do not include exposure, but they show how the system behaves when it is exposed to disturbances [16] or changes. The connection between vulnerability and resilience means that systems with low vulnerability (potentially sustainable) also have high resilience [17]. As agreed in many cases, resilience can be associated with resistance, adaptability, transformability and sustainability [16,18,19]. Resilience can be regarded as a desired functioning state of the system [13], which could go through multiple stable states [20,21] due to transformation caused by internal and external forces acting on the system. Moreover, the results of resilience analysis depend on both the selection of indicators and reference definitions, which can be arbitrary [19]. Depending on the resilience context, different indicators or parameters have been considered [22,23]. The need for long data series in the investigation of system resilience and vulnerability has been also outlined since long-term records are likely to include a range of events, e.g., failures, disturbances [17,19]. However, it is not precisely established what the length of records is required. It has also been recognized that resilience and sustainability are not easy concepts to apply to complex systems [24]. Resilience can be defined at the system level, e.g., geo-morphologic associated with hydrological flood risk [7,25], ecological, socioecological, engineering [18], economic [7]; urban [26] etc. For instance, uncertainty, risk and chaos associated with the development of urban systems was expressed through Shannon entropy and two parametric thresholds (i.e., minimum and maximum entropy) were used to define the resilience space or space of sustainability of urban sprawl [7]. However, there were not practical cases where these thresholds were determined. Outside the sustainability space, the system can be vulnerable, or chaotic, hence the system resilience may be reduced. The thresholds could define, a relative way, the stability space of the system. Determining system resilience thresholds is not an easy task [27,28,29] and is not done unequivocally. Resilience may depend on the strategy adopted during the recovery period, after disasters such as floods [30], which are usually associated with uncertainty, chaos, risks or damage in the catchment. Entropy is a property of a system [2], likewise resilience [16], hence the connection between these two concepts is interesting. “Because a water resources system is invariably managed by human decisions, its system resilience is a property that was built into it and, at the same time, responds to what human actions do to it” ([31], p. 24). Besides, a connection between reliability, resilience and vulnerability for water supply systems, i.e., reservoirs, was established [32]. For hydrological systems, it has been reported that resilience could be associated with uncertain events or stochastic forcing such as rainfall [20,21,33,34], temperature and streamflow. For example, random hydrologic fluctuations were shown to increase the resilience of ecosystems [33]. The uncertainty of hydrological variables, in particular stochastic events such as rainfall or streamflow can be measured using entropy [35,36], in space and time. In particular, hydrological response (e.g., streamflow or runoff) is a complex function of soil moisture, which was assessed through spatial entropy across various heterogeneous basins [37]. In most hydrological studies, the connection between resilience and entropy has rarely been made explicit. Catchments display high resilience if they are able to maintain their normal functioning (by generating runoff from precipitation) in the light of changing hydro-climatic inputs [13], (e.g., precipitation, evapotranspiration, etc.). Therefore, catchment resilience can be associated with the hydrological response (streamflow/runoff) [13], which is the ultimate catchment hydrological flux [37,38] and is always associated with a degree of uncertainty or entropy in space and/or in time [4,5,39], as outlined above. Spatial entropy analysis allows the determination of catchments of high/low variability of streamflow [40]. Moreover, dynamical system analysis (DSA) is suitable for catchment hydrology and enables us to make conclusions on the state of catchment stability (resilience), and predictability (entropy or chaos) [10]. In addition, spatial streamflow network stability was measured by its insensitivity (resilience) to streamflow station removal at random [41] and the design, reduction or expansion of streamflow networks could be assessed using entropy [4,5]. Strategies and management derived from one subsystem (e.g., hydrological system) alone may stimulate surprising responses from other subsystems [31]. A detailed review on different subsystems for urban resilience has been recently carried out, e.g., [42]. It is recognized in this study, that each subsystem may be seen as complex [19]. For instance, the hydrological system (at catchment level only) has a degree of complexity under changing conditions [10,13] since its response in terms of mean annual runoff (MAR) has not been satisfactorily described unequivocally, through rainfall-runoff modeling. The existence of several modeling tools, e.g., [15], includes among others conceptual, distributed models, deterministic, stochastic models, etc., and supports the complex status of catchment response (often in terms of runoff, hence MAR). This response depends on activities occurring in the catchment (such as land use change due to urbanization, agriculture, industrial activities, ecological changes, etc.), physical characteristics (topography, soil characteristics) and vegetation [43]. MAR can be seen as the average runoff over a long period resulting from several hydrological events (e.g., frequent events, floods and droughts). Specifically, urbanization was shown to increase MAR and to contribute to flooding [44,45], while prolonged drought conditions might decrease runoff [9,43]. MAR is one of the crucial hydrological variables, at catchment level for water resources planning, development, and operation of water infrastructures and, in particular MAR impacts on reservoir sizing [44]. Recently, a connection between entropy index and change in MAR due to urbanization that may result in flooding conditions was established [24]. Moreover, the relative changes of MAR of quaternary catchments (QCs) were correlated with relative changes in entropy [46]. In the current literature, the connection between entropy of MAR (as catchment response) and catchment resilience, derived from entropy is almost nonexistent. This paper focuses mainly on this aspect. As formulated for urban systems [7], this study focuses mainly on parametric entropy values of MAR, as surrogate measures of hydrological catchment resilience. Similar to the linear resilience approach [18], this study defines the different resilience zones through entropy parameterization, with regard to catchment hydrological response. Despite a parameterization of entropy to express resilience of urban systems being proposed [7], practical cases of this parametrization have rarely been carried out. In addition, the study investigates the link between hydrological resilience and MAR elasticity of entropy associated with MAR. This was made possible by considering sensitivity/stability of Shannon entropy with respect to changes in MAR firstly, mean annual precipitation (MAP) secondly and thirdly mean annual evaporation (MAE). The elasticity analysis in this study was inspired from precipitation streamflow elasticity [10,47], particularly in line with the use of linear regression models for the determination of spatial streamflow elasticity [48,49]. For streamflow elasticity, these models have been reported to be popular because of their ability to approximate observed climate and streamflow data and because of their simple theoretical expressions [48,50]. They do not require assumptions in the vicinity of the mean for parameter estimation of streamflow elasticity [50]. Statistical analysis of streamflow elasticity (within linear regression) is relatively simple [48,49,50], e.g., the goodness-of-fit of regression models using statistical metrics [47], computation of confidence interval (significance level) and standard error about the mean of elasticity; and statistical test on the correlation coefficient can be straightforward [50]. Streamflow elasticity can be regarded as a simple tool to calculate the contribution of climate change to runoff [51] and to support policy and planning decisions, in the situation of increasing uncertainty regarding water resources due to change of climatic conditions [47]. Generally, the climate parameters are precipitation and temperature streamflow elasticity [48,49,52,53,54], but other parameters such as change in groundwater storage [55], land use and water use [50] have been considered recently. The difference between previous studies and the present study is that MAR elasticity is carried out on the sensitivity of entropy associated with changes in MAR for different catchments within the Upper Vaal region, as a means of assessing indirectly catchment resilience. These changes occurred between 1989 and 2012. Basically, the MAR elasticity of entropy is a bivariate regression model. This study quite often uses the term pseudo-elasticity since the concept has been borrowed from precipitation elasticity of streamflow [52]. The results from MAR elasticity of entropy were then assessed graphically against MAE and MAP, through scatter plots, similar to others [56,57].
In this study, entropic values were performed on MAR data extracted from surface water resources (WR) of South Africa of 1990 (WR90), 2005 (WR2005) and 2012 (WR2012), specifically for the Upper Vaal region. These are the first, second and third appraisals of water resources of South Africa, which were commissioned in 1990, 2005 and 2012 respectively. It is worth noting that the first water assessment, i.e., WR90 played a significant role in providing key hydrological data/information to water resources managers, planners, designers, researchers and decision-makers throughout South Africa [43]. Between 1989 and 2004, in particular the Upper Vaal region of South Africa has undergone several changes to its catchment activities (industrial and economic), land use, climate, etc. These changes have had an influence on MAR and are likely to be associated with a degree of chaos, uncertainty or variability in MAR, hence entropy [46] or shocks (disturbances/perturbations) occurring in the catchment. Such uncertainty (entropy) could be used as a surrogate measure to characterize the resilience state of QCs (hence tertiary catchments (TCs)) between 2005 and 2012 in the Upper Vaal catchment, as compared to the period between 1989 and 2004. Moreover, MAR elasticity was used to assess the sensitivity of entropy (associated with MAR) due to changes in MAR between 1989 and 2012, and hence could be used to establish the linkage between sensitivity and catchment resilience. Unlike Cavallaro et al. [30], or Fowler et al. [32], the current study does not deal mathematically with definitions of resilience.
The Upper Vaal catchment is one of the main river systems of the Vaal drainage system of South Africa, besides the Lower and Middle Vaal regions. The Vaal river system has played a major role in water resources planning and development in South Africa, in particular in the Gauteng province. The Upper Vaal catchment is probably the most developed in South Africa [58]. The main water source for supply is the Vaal Dam. The Upper Vaal catchment is one of 19 (water management areas) WMAs and each WMA comprises TCs. These comprise, in turn, QCs. For water resources appraisal in South Africa, the QC is the basic areal unit. Currently, the 19 WMAs have been downsized to nine WMAs; however no surface water resources have been appraised referring to the new nine WMAs. Hence WR2012 referred itself to the 19 WMAs.
For the rest of the paper, “Upper Vaal”, “Upper Vaal river system”, “Upper Vaal water management area (WMA)”, “Upper Vaal region” and “Upper Vaal catchment” will be used synonymously [46]. Likewise, “Shannon entropy”, “entropy”, “entropy index” and “marginal entropy”, will have the same meaning. The same applies to “disturbance” and “perturbation”; “factor”, “variable” and “attribute”. Often, the prefix “pseudo” will be omitted from MAR elasticity of entropy associated with MAR.
The paper is organized as follows: through the notion of sustainability/vulnerability, theoretical considerations on the connection between entropy and resilience of hydrological system are given. Then MAR pseudo-elasticity defined in terms of information-based theory concept is explained. The methods are derived from above-mentioned theoretical considerations. Study area and data for the Upper Vaal catchment available from the Water Research Commission (WRC) database are presented. The results on the application of methods to the data are presented and discussed. Finally, the conclusion summaries the findings from the results and suggestions are made for further work.
2. Entropy, Resilience, Pseudo-Elasticity and Mean Annual Runoff
2.1. Entropy and Mean Annual Runoff
The catchment response (i.e., runoff/MAR) depends on several meteorological variables (e.g., rainfall, evaporation) and catchment characteristics. The strong influence of stochastic forcing on the behavior of nonlinear fluxes (e.g., runoff and many others) has been outlined [20]. Climatic conditions, anthropogenic conditions, erosion, urbanization, etc. can contribute to changes (variations) in runoff/MAR [59]. In the specific case of South Africa, runoff is highly variable and stochastic. Hydrological models have been useful in the estimation of MAR, which determines mainly the yield/draft of water systems [43,60]. Climate change in Southern Africa is likely to impact water resources and reduce MAR, and hence the draft or yield of water resources could be reduced [60]. Sustainable catchment management can be seen as key for catchment recovery mechanisms, when significant changes in MAR occur. As outlined earlier, MAR is derived from runoff/streamflow over a relatively long period. Hydrological events such as runoff/streamflow are usually associated with a degree of uncertainty, chaos, variability or entropy [39]. Application of entropy for the following has been reported: streamflow network design [5], streamflow simulation [35,61], transfer of information among streamflow gauges [4], flood frequency analysis [36,62,63], streamflow forecasting [64] and environmental and water resources in general [39]. The vast majority of studies on entropy of streamflow/run-off the river have not dealt specifically with uncertainty associated with MAR. Nonetheless, in a recent study a relationship between the change in runoff and entropy has been established [59]. Moreover, the entropy concept has been used to assess uncertainty associated with MAR for QCs in the Upper Vaal catchment, between 1989 and 2004 [46]. From the same study [46], relationships were derived between relative changes in entropy and relative changes in MAR obtained from WR90 and WR2005 data sets.
In the following, for the purpose of this study, mathematical equations for entropy of MAR (derived from WR90 and WR2005) [46] were extended to the WR2012 data set, and those for relative changes in MAR and relative entropy of MAR were adapted to WR2005 and WR2012 data sets.
Equation (1) below is derived from the Shannon entropy of the variable yj, and shows the uncertainty associated with yj. This equation represents the entropy index or marginal entropy of yj, written as H(yj). In this specific case, yj can be MAR for a specific jth QC belonging to a given TC. The j values (j = 1, 2, 3, …, m) represent the j QCs in the TC and m varies from one TC to the other, in the Upper Vaal catchment. Each QC contributes to the total MAR of their TC:
In the above equation, Y is MAR of the TC in either WR2005 or WR2012 data set and . The base of the logarithm in Equation (1) defines the unit of H(yj). The unit is in bits if the base is 2, in Napiers if the base is e, and in decibels (dB) if the base is 10.
For a given TC in the Upper Vaal catchment, let k be the number of TCs in the Upper Vaal catchment. Since each QC contributes uniquely to the MAR of the kth TC, the marginal entropy of kth TC is the sum of all individual entropy values of QC and can be written in the form of Equation (2) as given; i.e., Hk(Y):
Y, H(yj) in Equation (2) have been defined previously and are associated with MAR in either the WR2005 or WR2012 data sets. The two extreme cases of the marginal entropy are the minimum entropy (written as Hmin) and maximum entropy (written as Hmax) [2]. The minimum entropy is reached when the value of the variable yj is 1 for j = i (i ≠ 0) and 0 for the remaining values, hence given by Equation (3a). Alternatively, the variable yj takes very few non-zero values while the remaining values are 0. The maximum entropy is reached when the variable yj takes the same value everywhere, i.e., [35], hence is given by Equation (3b):
Alternatively, Hmin is close to 0
Hmax shows a uniform/homogeneous distribution of the variable in the system, as opposed to Hmin.
For a specific jth QC in a given TC, the relative change/variation in MAR and relative change in entropy are given by Equations (4) and (5) respectively as shown below:
where δ(yj), δH(yj) are the relative change/variation in MAR and relative change/variation in entropy for a specific jth QC respectively. The variable yj has been defined previously.
2.2. Entropy and Resilience of Water Resources
Runoff/streamflow, hence MAR constitutes a major component in the determination of the yield/draft of water resources in a river system or catchment. South Africa, specifically the Upper Vaal catchment depends on this yield for several activities (economic, social, industrial, etc.). This is similar to several other parts of the world [37,65]. The required yield/draft is necessary and vital but not sufficient for managing water resources in the catchment. This section deals with water resources/system resilience, from catchment response perspective and focuses on the relationship between resilience and entropy. There are numerous studies on hydrological resilience with reference to water resources, e.g., water supply systems [31,32,66], groundwater systems [20,21,67] and many others. Resilience was shown to be linked to the recovery of the water system from failures [14] or from unsatisfactory states [15,68] and these failures were likely to make the system vulnerable [68]. System resilience could be altered due to land use, hence making the system vulnerable to disturbances [20]. It was argued that hydrological resilience was related more to vulnerability/sustainability than the reliability of water resources such as reservoir systems (e.g., [17]). Real hydrological systems (e.g., catchments) are complex [10,37,69] and have multiple attractors (steady states), which may inform how these systems may respond to and recover from perturbations such as droughts, floods, or groundwater pumping but determining multiple attractors is very challenging [20,21,33]. Selected factors (variables of concern) are often used indirectly to define or measure the resilience of hydrological systems. Moreover, resilience analysis can be affected by an arbitrary choice of indicators (of investigation) [19]. The choice of these factors depends on the resilience context. For example, a hypothetical catchment model was used to assess resilience, based on a range of saturated lateral groundwater conductivity values [20,21] whereas parameters related to salinity [22,23] and vegetation were used to monitor resilience [67]. Hence there is no unique way of selecting specific indicators or variables/factors as surrogate measures of resilience. The investigation of one factor/parameter may result in the system being “resilient”; whereas another factor may result in a “non-resilient” situation [19]. Nonetheless, the resulting assessment could stand to be right, in the case where the selected variable/factor is the only target parameter to be investigated [19]. It has been suggested that any resilience assessment should take into consideration of uncertainty or degree of ignorance about the system [31]. As in [7,25], this suggests that chaos, shock/disturbance, predictability, uncertainty or entropy should feature in hydrological system resilience. The reliability, vulnerability and risk of failure of water resources/systems depend on their yield [7], hence MAR, which is associated with entropy. In this paper, it is believed that MAR could be a very important variable for catchment resilience, with respect to water resources (sustainability/vulnerability), since the yield of water resources is a function of this variable. The literature of entropy (as a surrogate expression of catchment resilience) associated with one of the major hydrological characteristics (e.g., MAR) for water resource planning and development is rarely documented. Nonetheless, in catchment hydrology, arguments were put forward recently to characterize stability/resilience of complex (dynamical) hydrological systems with entropy, which is information-based theoretical concept [10]. The linkage between catchment resilience and sensitivity of streamflow to changing climate conditions was reported [13]. In addition, the relationship between resilience/stability and complex streamflow network was established for optimum design of the network [41] and entropy was used to characterize the optimum design of the river system network within a catchment or basin [41]. Similar to the resilience approach for urban sprawl systems [7], entropy was used in this study to measure indirectly catchment resilience. For an urban sprawl monitoring framework of resilience, three zones (states) were defined using entropy concept; i.e., chaos (uncertainty) zone which is the upper zone, tolerated disorder zone in the middle and the uniformity zone, which is the lower zone [7]. It was observed that the three zones were separated linearly using two parameters/thresholds: minimum entropy (Hmin) was a transition line between the lower and the middle zones, while maximum entropy (Hmax) was used to separate the middle zone from the upper zone. In the lower zone, the system is stable/resilient when it is subjected to disturbances or changes associated with relatively low entropy and becomes vulnerable when entropy increases. In the middle zone, the system is of acceptable resilience/sustainability as long as disturbances/changes are in the range between entropy thresholds. In the upper zone, the system becomes chaotic as disturbances have exceeded the maximum uncertainty. Zone 3 is the zone of high unpredictability or uncertainty. Zone 1 and 3 are states of vulnerability of the system, hence resilience becomes relatively low. The linear zoning of resilience via entropy could be similar to the linear resilience concept [18]; which implies that a system can only deal with one state/capacity at a time, whereas the holistic approach of resilience concept assumes the coexistence of multi-states/capacities (i.e., absorptive, adaptive and transformative capacities) within the system [18]. The linear resilience concept suggests that system resistance/absorption is required in a period of small perturbation/change; adaptation is required in a time of greater perturbation and finally transformability is required when conditions become unviable or cannot be sustained [7]. Linear resilience has been acknowledged to be an acceptable approach, but may not capture the complex interactions of different states within the system [18]. Since resilience is associated with sustainability or vulnerability of a system [7,17,25], which enables the link between entropy and resilience [17], entropy of MAR can be suggested as a surrogate measure of catchment resilience. This could also be supported from catchment resilience being associated with streamflow/runoff as hydrological response [13] or catchment hydrological flux [37,38] and this flux is always associated with a degree of uncertainty or entropy in space and/or in time [4,5,39]. Measuring systems’ resilience holistically using entropy could be appealing, however very challenging for hydrological systems, due to the complex interaction of variables, the occurrences of the different states and the selection of different thresholds. Thresholds are regarded as a range of values to accommodate fluctuation and statistical uncertainty or chaos associated with functioning states of the system [70]. Hence, the linear zoning approach of resilience was found preliminarily useful in this research, as a first step to determine, via entropy, catchment resilience in terms of hydrological response; i.e., MAR. While the resilience thresholds (i.e., Hmin and Hmax) were just parameterized [7], the current paper showed it is possible to quantify these thresholds for hydrological systems (i.e., catchments) as explained in the methods (Section 3). In principle, the development of thresholds is complex and normally requires insight in the availability of data and multiple disciplines to arrive at an acceptable range of minimum thresholds or indicators [19,28,29,71].
2.3. Elasticity and Mean Annual Runoff
The majority of hydrology and water resources studies focus on precipitation elasticity of streamflows, e.g., [48,52,56,57]. In this paper, the concept of precipitation elasticity of streamflow still constitutes the basis for MAR elasticity of entropy associated with MAR. Since the latter has been derived from the former, the pre-fix “pseudo” will be used in the case of MAR. Rainfall “elasticity is therefore a simple estimate of the sensitivity of long-term streamflow to changes in long-term rainfall, and is particularly useful as an initial estimate of climate change impact in land and water resources projects” ([56], p. 613). Since sensitivity to perturbation is seen as a component of vulnerability [16] or sustainability, elasticity of a hydrological variable may be linked to the vulnerability or sustainability of the hydrological system. The perturbation may be any change in hydroclimatic variables. To simplify, sensitivity shows the degree to which transformation occurs in a system, as a result of internal or external forces [16]. Hence a system that is sensitive to changes is elastic and could be vulnerable. Sensitivity considered as the capacity of the system to persist to disturbances, is a mechanism that underpins resilient systems [16,19]. As applicable to resilience, sensitivity or elasticity can only be assessed with respect to the change of specific factors or variables. Some factors can be “sensitive/elastic factors” while other factors may not be very sensitive/elastic when there are changes or perturbations. In the specific case of hydrological systems, the non-parametric rainfall elasticity of streamflow computed from observed (i.e., rainfall and streamflow) was pioneered by [52], later applied in several hydrological studies, e.g., [56,57]. Streamflow elasticity is non-dimensional quantity and shows the sensitivity of streamflow to climate variables; it can be positive when changes in precipitation and in streamflow are positive and it can be negative when the changes vary in opposite directions [52,72]. In essence, for 1% change in rainfall, how will streamflow vary? The parametric rainfall elasticity of streamflow was derived from hydrological modelling, e.g., rainfall-runoff and was found acceptable, but was slightly higher than the non-parametric elasticity [56]. The non-parametric estimator of elasticity is particularly useful for hydrological studies where it is not easy to establish a model between the different variables [52,57]. For instance, in the case of precipitation-runoff model, a variation of 1% rainfall that corresponds to a change of 2% (or more) runoff was considered to be relatively high [57]. In this case, streamflow elasticity is called parametric elasticity [47]. The same was also applicable to the case of non-parametric values of elasticity [52]. The majority of studies consider arbitrarily streamflow elasticities, resulting from increases (e.g., 10% to 25%)/decrease in precipitation [52]. Hence the tolerable limits of runoff variations can be arbitrarily within 10% and 20% and at the most between 10% and 25%. It was shown that streamflow elasticity analysis [10,47] was carried out easily when bivariate or multivariate linear regression models were used [49,52,53,54]. These models have been reported to be suitable for streamflow elasticity because they are cable of approximating observed climate and streamflow data and they are simple from their theoretical expressions [50,52]. In addition, they do not require model assumptions in the vicinity of the mean for regression parameter determination, hence streamflow elasticity [50]. Statistical analysis streamflow elasticity is relatively simple [52], e.g., the performance of regression models using statistical metrics [47], correlation analysis to assess the relationship between the hydrological and meteorological variables [49], computation of confidence interval, standard error of the mean of elasticity are easily performed [48,50]. Streamflow elasticity can be regarded as a simple tool to calculate the contribution of climate change to runoff [51] and to support policy and planning decisions, in the situation of increasing uncertainty regarding water resources due to change of climatic conditions [47]. The climate parameters considered are precipitation and temperature in most streamflow elasticity [49,52,53,54,56], but other parameters such as change in groundwater storage [55], land use and water use [50] have been considered recently. Andressian et al. [47] reviewed different categories of elasticity and stressed the non-dimensional aspect of precipitation and streamflow (runoff), when calculating rainfall elasticity of streamflow to make a relatively fair comparison between catchments. This has been supported in several studies on hydrological elasticity, e.g., [48,50,56,73]. The rainfall elasticity of streamflow (εp) was derived from hydrological modelling, i.e., sensitivity of the modelled streamflow to changes in rainfall [56], as shown in Equation (6):
where δQ is the change in modelled mean annual streamflow and δP is the change in mean annual rainfall. Equation (6) is a bivariate relationship between streamflow and precipitation. The single parameter or bivariate elasticity of streamflow can be used in some cases [48,51,56] to display the general relationship between precipitation and streamflow, but cannot give the complicated non-linear association between streamflow, precipitation and temperature as it is not function of temperature [53]. Hence the use of multivariate regression can be justified [40,55,72,74]. Multivariate regression methods enable to integrate easily the effects of various climate factors into streamflow elasticity [55].
An expression similar to Equation (6) was derived for the rainfall elasticity of evapotranspiration [56] and later expanded to other hydro-climatic variables [50,55,72]. In this study, Equation (6) has been extended to runoff elasticity of entropy (as information-based concept), in a first attempt of spatial entropy analysis. Nonetheless, the relationship between MAR elasticity of entropy and MAP and MAE were also assessed, in a similar way to [56,57]. The relationship (model) expressing MAR elasticity of uncertainty (chaos) associated with MAR, between hydrological data sets, is almost nonexistent. However, it was shown that relationships exist between relative change in MAR and relative change in entropy between WR90 and WR2005 data sets [46]. The linear equation (model) was the most dominant relationship [46]. Hence MAR elasticity was approached within the context of linear regression models [49,50,52,53,54,56]. For the kth TC, the simple linear model can be given in the form of Equation (7) to correlate hydrological response (i.e., MAR) and its entropy:
where δk(yj) is the relative change in MAR between WR90 and WR2005 and is dimensionless, δHk(yj) is the relative change in entropy between WR90 and WR2005 and is dimensionless, k1 is the intercept of entropy axis at the origin of MAR and j is defined as previously.
The regression coefficient or slope εk defining the rate of the relative change in entropy with respect to the relative change in MAR, can be roughly used as the MAR elasticity of the entropy associated with MAR of QCs. Moreover, its computation departs slightly from previous approaches on the usual rainfall elasticity. This justifies the prefix pseudo-elasticity. That is from streamflow elasticity [49,50,52,53,54,56], the regression coefficient (εk) is generally interpreted as MAR elasticity of entropy associated with MAR.
Similar to [47], the above-mentioned relative changes/variables are dimensionless, for a given TC, εk is the first derivative of δHk(yj) with respect to δk(yj), as displayed in Equation (8):
The pseudo-elasticity will determine the change in uncertainty of MAR corresponding to a relative change in MAR. MAR pseudo-elasticity shows the level of sensitivity of the catchment in terms of uncertainty (entropy) associated with the change in MAR. Hence, for a given change (variation) in MAR, how will entropy of MAR vary? Recall that sensitivity and elasticity express similarities in hydrological studies. Since sensitivity is considered as a mechanism underpinning resilience [13], hence MAR elasticity of entropy could be used as a mechanism for hydrological resilience. It was found out that catchments with low resilience are sensitive to changes in inputs (for rainfall-runoff modeling) [13]. That is, catchment resilience was found to be high if runoff generated from the catchment remained insensitive to the changes in hydro-climatic inputs [13]. System resilience is linked to multi-state stability [20,21,67]. Moreover; elastic stability was associated with the mechanisms of resilience for ecological systems [19]. For instance, if relatively small changes in MAR correspond to relatively high changes in entropy, the catchment could be said to display a relatively low level of elastic stability or resilience. Hence, the catchment could be vulnerable with regard to water resources capacity in sustaining the required yield.
3. Data Availability and Methods
3.1. Study Area and Data Availability
The Upper Vaal catchment is probably the most strategic and pivotal catchment from a water management perspective and impacts on water balances in 12 water management areas and in all neighbouring countries, due to water transfers into and out of the catchment [58]. As shown in Figure 1, the Upper Vaal catchment (comprising upstream of Vaal Dam, downstream of Vaal Dam and Wildge areas) is divided into several TCs, which are subdivided into QCs. Upstream of Vaal Dam covers tertiaries from C12 to C13; downstream of Vaal Dam covers from C21 to C23 and Wildge from C81 to C83. The upstream of Vaal Dam, Wildge and downstream of Vaal Dam contribute 46%, 36% and 18% of the surface flow in the Upper Vaal region respectively, and the Vaal dam realizes about 83% of the surface water yield. Most economic activities are concentrated in the upstream of Vaal Dam and downstream of Vaal Dam and hence require over 75% of total water requirements. About 80% of water is required for urban, industrial and mining activities and about 16% of water is required for irrigation, power generation and the rest for rural supplies.
MAR data for the Upper Vaal River system were obtained from the surface water resources of 2005 (WR2005) report [30] and of 2012 (WR2012) report [75]. WR2012 report contains MAR data from 1920 to 2012. The first water resources assessment of South Africa, i.e., WR90 provides key hydrological data/information for various activities: water resources management, planning, design, research and decision-making. Hence the total MAR of the Upper Vaal catchment is given by the sum of MAR for TCs, of the Upper Vaal. Table 1 gives the TC area, MAP, MAE, MAR and the number of QCs in each TC of the Upper Vaal catchment [46], as extracted from [75].
The climate over the catchment is temperate and fairly uniform and is dominated by summer seasonal rainfall [58]. MAP varies between 600 and 800 mm and MAE is between 1300 and 1700 m. WR90, W2005 and WR2012 have unchanged values for MAP and MAE [75]. For the rest of this study, decibel (dB) is a unit of information/uncertainty/chaos or entropy.
3.2. Methods
The computation of marginal entropy associated with MAR of QC is essentially used for the determination of linear resilience zoning for the different TCs in the Upper Vaal region. Hydrological resilience is assessed both at QC and TC levels. The determination of MAR elasticity of entropy is used to evaluate sensitivity (elastic stability) associated with changes in MAR, indirectly the hydrological resilience of the Upper Vaal catchment. It is reiterated that MAR is the only investigation factor of catchment resilience. Nonetheless, a brief assessment of elasticity versus MAP and MAE will be carried out.
3.2.1. Marginal Entropy Computation
The Shannon entropy, in the form of Equations (1) and (2), was used to calculate the uncertainty (chaos) associated with MAR at QC and TC levels respectively. The values of entropy at TC level depend on MAR magnitudes and the number of QCs in each TC. Hence these values were also considered as a measure of non-homogeneity/uniformity [76] in MAR over a given TC. Referring to [76], relatively low entropy values could be linked to non-uniform spatial distribution of MAR in the TC and high entropy values could be linked to uniform spatial distribution in the given TC. Nonetheless, the entropy values should remain within the range of thresholds, i.e., [Hmin, Hmax] for an acceptable resilience level [7] of the hydrological system (i.e., catchment). This constitutes the basis of the linear resilience zoning approach as outlined earlier and was adapted to hydrological systems.
3.2.2. Linear Resilience Zoning Determination
This concept is adapted from [7,18] to hydrological system. As mentioned previously, the linear resilience zoning approach assumes compartmentalization of different states of catchment resilience, which may not necessarily reflect the behavior of real catchments. However, quantifying the resilience of a hydrological system where states coexist can be very challenging, due to the complex interactions among the states in a real situation. Such a situation requires a resilience holistic approach; i.e., adsorptive, adaptive and transformative resilience [18]. Nonetheless, the linear zoning approach constitutes a departure point to define preliminarily the different zones of resilience (Zone 1, Zone 2 and Zone 3). In a vertical direction, these zones are the lower, middle and upper zone of resilience respectively and are described towards the end of this section. The zones are separated by 2 limits (thresholds), i.e., the lower limit Hmin,k and the upper limit Hmax,k for the k-th TC of the Upper Vaal catchment. The former is determined using Equation (9) and is not necessarily 0 according to [7]. The latter is determined according to Equation (10), which has been adapted from Equation (3b). Since both entropy and resilience are properties of the system (i.e., catchment), so are the thresholds Hmin,k and Hmax,k, which are given by Equations (9) and (10) respectively:
where mk is the number of QC in the k-th TC and H(yj)(j = 1,2,…,mk) are entropy values of mk QCs in the given TC, using data from WR90; Hlowest,k (Equation 9) is viewed as a local minimum entropy related to the specific TC, whereas Equation (3a) could be considered as the global minimum entropy for catchments.
There is a justification for using WR90 data in the determination of Hmin,k values. Firstly, WR90 is the first historic and comprehensive appraisal of water resources of South Africa and was considered arbitrarily as the baseline for hydrological data. It includes 70 years of records, which could be fairly reasonable for hydrological studies, planning and management of water resources in a developing country. The issue of lack of data, missing data, or short length of records has been common in developing countries [2]. Hence 70 years of records were considered relatively sufficient and acceptable for South Africa and included hydrological events of low, frequent and high occurrences. The baseline for data (i.e., length of records) is very important in the determination of resilience thresholds and may influence resilience analysis [19,28,71]. Secondly, WR90 played a significant role in making available hydrological data and information for planning, design, development, research and management of water resources of South Africa [75].
From the above, the j QCs in the k-th TC defines a set of entropy values as shown in Equation (11):
Like [7], Equation (11) displays the parametric entropy values for the k-th TC, for WR90, WR2005 and WR2012 data sets in the Upper Vaal catchment.
Consequently, parametric values that include the maximum entropy and minimum entropy, enabled the establishment of a surrogate linear zoning of catchment resilience, with regard to water resources sustainability or vulnerability. The yield of water resources is mainly defined by MAR, which is the hydrological response of the catchment. Hence, the three resilience zones as given below, described catchment vulnerability/sustainability, in relation with water resources in a specific k-th TC.
Zone 1: Hk(yj) < Hmin,k. This is the zone of low resilience and where water resources in the catchment could likely present a risk of vulnerability and instability, if subjected to disturbances associated with relative changes in MAR. Even relatively small changes in MAR may impact catchment resilience. In this situation, water resources sustainability and hence the resilience of the catchment could be compromised. The ability for the catchment to adapt and transform recognised to be pivotal for resilience [18], could be very low, due to adverse hydrological impacts on the catchment. The recovery process of water resources from impactful absorptive shocks could take longer. Therefore, the adaptive capacity of the catchment [18] could be very low. This zone could be highly dispersive in terms MAR since the entropy is very low [76].
Zone 2: Hmin < Hk(yj) < Hmax,k. In this zone, catchment resilience is perceived to be acceptable with reference to water resources. It is the zone of tolerable uncertainty or changes in hydrological response. This is the zone of relatively acceptable resilience of the catchment. The catchment may still recover from disturbances or shock associated with changes in MAR. Water resources in the catchment present a relatively low risk of vulnerability. Hence the adaptive capacity of the catchment from disturbances could still be relatively good. For example, water resources can be sustainably managed to satisfy the different water requirements; extreme hydrological events such as droughts or floods could be manageable or mitigated and the catchment could still recover quite rapidly from the disturbances, perturbations or changing climatic conditions.
Zone 3: Hk(yj) > Hmax,k. This zone is of relatively low resilience, which can be the result of rapid and significant changes in MAR, outsides acceptable margins. Relatively high values of entropy can be very demanding [7] since there is a huge pressure/stress on the catchment in terms of water resources and water infrastructures. For example, in the Upper Vaal, as the South African economic hub, rapid urban growth, new settlements (both formal and informal), could contribute to increasing water stress. The water resource/system might be unable to satisfy the different requirements. The water resources may not be sustainable and may present a high risk of vulnerability. The level of transformation and adaptation of water management in the catchment may require external water sources and additional infrastructures. In addition, extreme events (floods or droughts) or any climatic shifts could exacerbate the situation and have serious impacts on the catchment, if adaptive and transformative measures were not being put in place.
Zones 1 and 3 could be referred to as zones of elastic instability, whereas zone 1 as zone of elastic stability. Since zones 1 and 3 present a relatively high risk of vulnerability for the catchment, these two zones could be similar to unrecoverable areas or areas of slow recovery, whereas the intermediate zone is the recoverable (rapid recovery) or functional area [25] for water resources in the catchment.
3.2.3. Determination of MAR Pseudo-Elasticity of Entropy
As explained in Section 2.3, MAR elasticity was used to assess the sensitivity of entropy associated with the hydrological response for a given TC in the Upper Vaal catchment, between two sets of data. Thus, Equations (7) and (8) were used to compute MAR pseudo-elasticity of entropy between WR2005 and WR2012, as compared to MAR pseudo-elasticity of entropy between WR90 and WR2005. Equations (4) and (5) were used to compute the relative change/variation in MAR and in entropy between the different data sets and these relative changes are used in Equations (7) and (8). In this case, the MAR elasticity for TC in the Upper Vaal is parametric since it is determined from linear models (Equation (7)). Since there was a strong relationship between changes in MAR and in entropy [46], the single parameter MAR elasticity of entropy was used preliminarily. Similar to [50,51,52,53,55] the bivariate linear model was used to describe the sensitivity (resilience) of entropy due to changes in MAR, for the different TCs of the Upper Vaal. The slope (regression coefficient) was used to measure the MAR elasticity of entropy. Similar to [50,52,57], a 1% in relative change of MAR corresponding to more than 2% in relative change of entropy, would be considered arbitrarily relatively high. In this situation, the change in entropy could be sensitive to the variation in MAR, with possible consequence of affecting catchment resilience with regard to sustainability of water resources. That is, adapting from [52], the tolerable limits of variations of entropy values due to change in MAR should be arbitrarily within 10% and 25% increase/decrease in runoff, for MAR elasticity of entropy. Statistical analysis has been conducted for streamflow elasticity [49,51,52,53,54], however similar aspects covered in [50] were found appealing and were adapted to the current study:
- -
- The robust standard error of the sample of the mean of elasticity values (the standard deviation of the sampling distribution) was computed.
- -
- The 95% class interval was used for the mean elasticity (e.g., limits of critical values times the standard error to/from the mean were computed, using a t-test. This was to assess the significance of the difference in mean of sampling distribution). Hence, the significance level of variability of MAR elasticity estimates is 0.05.
- -
- The assessment of goodness-fit of regression models was carried out using the coefficient of determination R2 (correlation coefficient R). Generally, R2 between 0.5 and 1 can be considered good for the linear regression. However, the statistical t-test was used to carry out the significance of R. The level of significance used was 0.05.
In addition to precipitation, several studies on streamflow elasticity used temperature/evapo-transpiration data [40,50,52,55,72,74]. For many parts of the world [47,51,55] and for South Africa specifically the Upper Vaal catchment, since runoff/MAR depends mainly on meteorological data (i.e., evaporation and precipitation/rainfall) [75], MAR elasticity of entropy (associated with MAR) was also assessed from the spatial variations of these meteorological data over the different TCs. This approach was borrowed from streamflow elasticity studies [47,56,57]. In particular, MAE and MAP data were used as meteorological data and they remained unchanged for each respective TC and for all three data sets [75]. Hence, a graphical representation or scatter plot (MAR elasticity versus mean annual rainfall/evaporation) was used for each TC. This was carried out in a similar perspective with previous studies on streamflow elasticity [47,56,57]. For the scatter plots, at level of significance 0.05, the t-test was used to assess statistically the significance of R.
4. Results and Discussion
4.1. Entropy for Linear Resilience Zoning
As outlined previously, data extracted from the WR2012 report [75], were used to compute the entropy values associated with MAR (i.e., hydrological response) for the different QCs. The entropy computations for QCs in the different TCs of the Upper Vaal catchment are summarized in Figure 2a–i. As mentioned earlier, the TCs are distributed among the three sub-regions (i.e., upstream of Vaal Dam, downstream of Vaal Dam and Wildge) of the Upper Vaal catchment. Each figure shows the entropy parametric values for each TC. Parametric values are the set of values related to QCs in a given TC and measure indirectly the level of hydrological resilience of the catchments. Hence, for each TC in the Upper Vaal, it was possible, to determine three entropic/resilience zones, based essentially on the linear resilience zoning approach, as explained earlier. These zones are separated by the lower limit Hmin and upper limit Hmax, as depicted in Figure 2a–i.
In general, from these figures, the results revealed that entropy values for very few QCs were in the uniformity zone (i.e., below the limit Hmin but very close to this limit) whereas none of entropy values of QC were in the chaotic zone (i.e., above Hmax). This could imply that very few QCs could be highly vulnerable, in terms of their water resources since they are close to the uniformity resilience zone. In general, the majority of the entropy values for QCs were between Hmin and Hmax (i.e., the intermediate zone, which is the zone of tolerated disorder or zone of acceptable catchment resilience/vulnerability). In this zone, the uncertainty associated with changes in MAR could be tolerable and any recovery process from perturbations could be manageable. It could also mean that, although the majority of QCs in the different TCs displayed generally a certain level of sustainability/resilience for water resources, they could be vulnerable when exposed to disturbances causing significant changes in MAR. The changes in MAR for QCs of the Upper Vaal catchment, occurring between 1990 and 2004; and between 2005 and 2012 could not compromise the overall acceptable catchment resilience level and hence the water resources sustainability. But the management plan in the Upper Vaal could be reinforced, should catchments be subjected to perturbations such as extreme hydrological events, land use change, economic growth, increasing population growth, industrial, agricultural, climatic variability and climate change and ecological/ecosystem changes. This could also signal that, although catchment planning, development, and management in the Upper Vaal are within the South African National Water Strategy (NWS) [58,73], adjustments/revision to this strategy could be needed at QC level. In fact, the national water strategy has been revised recently [73], but the implementation of the new water strategy has not been effective. An integrated approach within the water management strategy of the Upper Vaal river system was already proposed since this river system plays an important role in the economy of South Africa [58]. At the quaternary catchment level, within the water strategy, adaptive and transformative measures could be put in place to anticipate any adverse impacts associated with significant changes in MAR. For instance, additional water supply could be needed in the Upper Vaal for economic and population growth, yet water requirements/demands have exceeded the current water supply [77]. This situation could be exacerbated from the geographical position of South Africa as a water scarce country associated with very high evaporation rates and high variable rainfall. (In the case of Upper Vaal region, MAE exceeds MAP, as shown in Table 1). Moreover, climate change/variability is likely to have adverse effects on the runoff in South Africa [19,78] and specifically a decrease in MAR and yield in the South Hemisphere [60]. This situation presents a risk of vulnerability to South Africa, in particular to the Upper Vaal catchment.
Figure 2a–i showed also that entropy values were generally very small and were rarely more than 10% of the maximum entropy. Based on previous work [76], relatively low values of entropy means that spatial distribution of MAR in the QCs were non-uniform, hence the dispersivity of MAR was relatively high (i.e., MAR coefficient of variation of QCs in the TCs were close to 1 or more).
Similar to Ilunga [46], entropy associated with MAR at TC level, in the Upper Vaal were computed from QCs (as shown in Figure 3). The results in this figure revealed that entropy values for WR90, WR2005 and WR2012 data sets were very close for each TC. These values were slightly lower than the maximum entropy and close to 1.00 dB. Differences between the highest entropy and lowest entropy values were relatively very small. That is, the distribution of naturalized MAR at sub-region level (i.e., downstream of Vaal Dam, upstream of Vaal Dam and Wildge) of the Upper Vaal catchment could be considered more or less uniform. This could also mean that TCs in the Upper Vaal catchment displayed similar hydrological characteristics [46], e.g., hydrological responses in terms of MAR. It could also imply that TCs in the Upper Vaal displayed an acceptable level of resilience (i.e., tolerable uncertainty or disorder), with regard to water resources. However, entropy values (close to the maximum value) could signal that further drastic hydrological changes in the Upper Vaal catchment could gradually lead to water resources losing resilience/sustainability. Hence the catchment could be susceptible to vulnerability. In this case, water resources could be under stress, due to disturbances (causing changes in runoff). These could include, e.g., a huge increase in population in the Upper Vaal catchment, economic growth, droughts and flash floods or climatic changes and variability, as experienced in recent years.
Marginal entropy values of MAR enabled us to calculate the relative changes in entropy between WR2012 and WR2005 data sets, for the different TCs. These relative changes were compared with those between WR2005 and WR90 data sets, (as shown in Table 2). It was observed that the relative changes in entropy at tertiary level were generally small between WR90 and WR2005 and even smaller (negligible), between WR2005 and WR2012. Besides, there were few zero values of relative changes in entropy between WR2005 and WR2012. Similar to [52], the variations of entropy values due to change in MAR were within the tolerable limits 10% and 25% increase/decrease in runoff. It could mean that uncertainty for each TC was associated with a certain level of temporal stability (i.e., between 1920 and 2004; and between 2005 and 2012). This could confirm a functioning level of catchment resilience during this period. It could also give an indication of sustainable management of water resources based on good planning and management strategies in the TCs. From the water resource development perspective and due to the prominent role of the Upper Vaal catchment in the economy of South Africa, a well co-ordinated water strategy was already proposed [58]. However, the impact of anthropogenic activities (water use, land use, etc.) coupled with hydro-climatic changes on catchment resilience should be further investigated, in the Upper Vaal.
The results in Table 2 show that positive relative changes in entropy would also mean that water resource management for TCs has moved from a relatively orderly state to a disorderly state. Conversely, negative relative changes in entropy, show decreasing chaos (disorder or uncertainty) in water resources planning and management. The reduction in entropy (negative values) could be equivalent to more hydrological information made available [2,4,5,6] on the Upper Vaal catchment; whereas an increase in entropy moves the catchment to a state of unpredictability [76]. Nonetheless, these variations in entropy showed that the TCs of the three sub-regions of the Upper Vaal catchment were within the zone of tolerable uncertainty (functioning resilience).
4.2. MAR Pseudo-Elasticity of Entropy
The relative change in MAR and relative change in entropy associated with MAR for quaternary catchments were computed. In a similar perspective with [50,51,52,53,55] linear regression modeling was carried out for these relative changes to determine pseudo-elasticity, as shown in Table 3 and this modeling was done within the tolerable zone of catchment resilience/vulnerability. The linear model (WR2005/WR90) was fitted between relative changes in MAR WR90 and relative changes in entropy of MAR WR2005 [46], while the linear model (WR2012/WR2005) was fitted between relative changes in MAR W2005 and relative changes in entropy of MAR WR2012. In general, the coefficient of determination (R2) values were relatively good (>0.5) for a goodness-of-fit of the linear regression. The correlation coefficient (R) values were derived from R2 values and the test conducted showed that all R values were not rejected at 0.05 significance level. The values of the MAR elasticity of uncertainty associated with MAR were in the interval [0.47–0.71], between WR2005 and WR90 data sets. Between WR2012 and WR2005, MAR elasticity ranged from 0.48 to 0.74. This could be interpreted that, for 1% increase in MAR, the uncertainty associated with MAR, varied nearly between 0.5% and 0.7%. Hence 10% increase in MAR, would correspond to the increase in entropy of 5% to 7%. The ranges of elasticity were very close; hence they could show the same level of sensitivity (stability) of entropy when MAR changes in the tertiary catchments. The level of sensitivity (elasticity) is relatively low compared with the changes in MAR. These variations are relatively smaller and below the threshold value of 2% change of uncertainty associated with MAR. These variations were confirmed from statistical analysis of MAR elasticity. For that, the standard error of the sampling distribution of the mean of MAR elasticity for both WR90/WR2005 and WR2005/WR2012 data sets was found to be the same 0.03. The means of samples corresponding to the two data sets were 0.56 and 0.60 respectively. The t-test at 95% confidence interval (at 0.05, significance level) of the mean of MAR elasticity showed there was no significant difference in the mean of MAR elasticity. Based on low sensitivity [13], this could mean that the Upper Vaal catchment displayed a certain level of resilience or elastic stability for its water resources since the linear regression models were established within the zone of tolerable uncertainty or resilience. Tertiary catchments in the Upper Vaal displayed a relatively good level of resilience such that they could be able to keep a good functioning [13], when subjected to light changing runoff. Similar to [52] and considering WR2005 and WR90 data sets, the tolerable limits of variations of entropy values due to change in MAR were within 10% and 25% increase/decrease in runoff, as shown in Table 2.
In addition, Figure 4a,b were plotted to establish the connection between MAR pseudo-elasticity and mean annual evaporation (MAE) and between MAR pseudo-elasticity and mean annual precipitation (MAP) respectively. Figure 4a shows a very small variation of MAR elasticity (i.e., between 0.5 and 0.7), when MAP changed from 615 to 723 mm. The variations of MAR elasticity were very small (insignificant) at a 0.05 significance level. However, when the goodness-of-fit of linear regression was assessed for MAR elasticity against MAP, it was found that MAR elasticity slowly increased positively with MAP. It was also found out that R2 values were 12% and 14% for WR90/WR2005 and W2005/W2012 respectively. Hence R values were 0.34 and 0.37 respectively; which implied that the derived R values were not being significant statistically. This translated in a weak relationship between MAR elasticity of entropy and MAP, despite MAP impacting positively on elasticity. Figure 4b, MAR elasticity displayed a very small decreasing variation (between 0.5 and 0.7), when MAE varied between 1351 and 1673 mm.
However, when the goodness-of-fit of linear regression was assessed for MAR elasticity against MAE, it was found out that MAR elasticity increased when MAE decreased and vice-versa. Hence the impact of MAE on MAR elasticity was negative. It could mean that the decrease in MAE might favour conditions tending towards uniformity of hydrological response (MAR) distribution in the TCs of Upper Vaal catchment whereas the increase in MAE could be associated with non-uniform distribution of MAR. It was also found that the linear regression between MAR elasticity and MAE had R2 values of 0.1 and 0.51 for WR90/WR2005 and W2005/W2012, respectively. The corresponding R values were −0.31 and −0.71, respectively. The test conducted on R values showed that only −0.71 was significant. Therefore, it showed a weak relationship between MAR elasticity and MAE for WR90/WR2005 and a good or significant relationship for W2005/W2012. This could be translated in MAE negatively affecting over time entropy associated with MAR. Catchments in South Africa are dominated by higher evaporation rates rather than precipitation levels, as can be seen in Table 1. In particular, close to the lower zone of resilience, the increase in MAE could have adverse effects on catchment hydrology. Overall, the small variations in MAR elasticity of entropy showed that entropy was not sensitive/elastic to the change in MAR, for both MAP and MAE. Similarly, previous studies showed that small variations of elasticity relate to insensitivity of changes of inputs (climate factors) to catchment generating runoff [50,52,53]. Hence, catchments in the Upper Vaal region could be associated with a certain level of stability or resilience [13], when they were subjected to changes in MAP or MAE. The effect of these meteorological parameters [56,57] on MAR elasticity was analysed independently in this preliminary study. However, the combined effect of hydro-climatic parameters [53], together with anthropogenic parameters [50] could impact on MAR elasticity. For future climate change [53], the bivariate parameter MAR elasticity may not be used, as it does not depend on the temperature (a proxy for evapotranspiration) and precipitation, which are determinant factors for runoff generation. On a spatial basis, multiple parameter elasticity [72] of entropy could be influenced positively or negatively. Multivariate regression methods could enable an easy integration of the effects of various climate factors [55] on elasticity.
Entropy measures have been shown to be a good tool for assessing the level of catchment resilience/sustainability of water resources. The entropy concept is a fairly good informative tool for the response of hydrological systems (catchments) subjected to disturbances/changes over time. This could be used as a guide to management, planning and operation of water infrastructures. As approached in this study, a linear resilience zoning was considered in the first instance. In reality, resilience should be perceived within sustainable development [26] of the water resources. Hence, the building resilience approach [79] that strengthens absorptive, adaptive and transformative resilience [18] could be appealing. The MAR pseudo-elasticity was introduced, using a bivariate linear model to assess the sensitivity of entropy due to changes in MAR. The effect of climatic parameters was not considered in the formulation of the bivariate MAR elasticity of entropy, and instead the effect of MAE and MAP on elasticity was investigated independently.
5. Conclusions
The versatility of Shannon entropy concept has been shown for the field of water resources management. Uncertainty associated with catchment hydrological response; i.e., MAR, was used as a surrogate measure of catchment resilience, in the Upper Vaal region. The analysis of resilience was carried out on surface water resource data sets; i.e., WR90, WR2005 and WR2012. A catchment linear resilience zoning was derived from entropy calculations, with baseline records from WR90. Catchment resilience (with regard to sustainability of water resources) was linked to smaller variations in entropy and was within the acceptable zone of resilience/uncertainty. However, entropy values were close to the lower resilience threshold and to the upper resilience threshold for QCs and TCs respectively. This suggested that sound planning, development and management of water resources and infrastructures should be put in place. In general, relationships between the relative variations in entropy and the relative variations in MAR for the Upper Vaal catchment were bivariate linear regression models. The MAR pseudo-elasticity of uncertainty associated with MAR, was derived from these relationships and was shown to be generally statistically small/stable. Hence, this supported also an acceptable level of catchment resilience in the Upper Vaal. Besides, the MAR pseudo-elasticity was shown to be linked to MAP and MAE, and was relatively very small/stable for the catchments to remain in the zone of acceptable resilience/tolerable vulnerability. Nonetheless, MAP positively influenced elasticity in an insignificant way, while MAE significantly influenced negatively elasticity, with consequence for reduction of entropy associated with runoff, hence promoting a non-uniform distribution of MAR in the different sub-regions of Upper Vaal. The effect of these meteorological parameters; i.e., MAP and MAE was analysed independently in this preliminary study; hence the elasticity analysis did not give a thorough insight in the combined effects of these parameters. The findings of this study are only limited to MAR, as a parameter of resilience investigation and to WR90 as baseline records for determination of resilience thresholds. This was considered as a first step in the analysis of catchment resilience, with respect to one of the most interesting hydrological responses (i.e., MAR). In principle, more parameters should be considered. Hence the combined effect of hydro-climatic parameters [53], including anthropogenic parameters [50] could give more light on MAR elasticity. For future climate change [53], the bivariate parameter MAR elasticity may not be used as it is not an explicit function of hydroclimatic factors, which influence runoff generation. On a spatial basis, multiple parameter elasticity [72] of entropy should be investigated. Although challenging, the inclusion of other factors such as socio-economic factors and many other could be suggested for further study. The present study was limited to the Upper Vaal WMA and does not include data beyond WR2012, as there was no study yet commissioned at the time of this research paper. Assessment of catchment resilience, via entropy could be extended to other WMAs of South Africa and a building resilience approach should be explored.
Acknowledgments
The author thanks the Water Research Commission of South Africa for making available data used in this study, on its website.
Conflicts of Interest
The author declares no conflict of interest.
References
- Liu, D.; Wang, D.; Wang, Y.; Wu, J.; Singh, V.P.; Zeng, X.; Wang, L.; Chen, Y.; Chen, X.; Zhang, L.; et al. Entropy of hydrological systems under small samples: Uncertainty and variability. J. Hydrol. 2016, 532, 163–176. [Google Scholar] [CrossRef]
- Singh, V.P. Hydrologic synthesis using entropy theory: Review. J. Hydrol. Eng. 2011, 16, 421–433. [Google Scholar] [CrossRef]
- Shannon, C.E.; Weaver, W. The Mathematical Theory of Communication; University of Illinois Press Urbana: Chicago, IL, USA; London, UK, 1949. [Google Scholar]
- Harmancioglu, N.B.; Yevjevich, V. Transfer of hydrologic information among rivers points. J. Hydrol. 1987, 93, 103–118. [Google Scholar] [CrossRef]
- Yang, Y.; Burn, H. Entropy approach to data collection network design. J. Hydrol. 1994, 94, 307–324. [Google Scholar] [CrossRef]
- Pan, F.; Pachepsky, Y.A.; Guber, A.K.; McPherson, B.J.; Hill, R.L. Scale effects on information theory-based measures applied to streamflow in two rural watersheds. J. Hydrol. 2012, 414–415, 99–107. [Google Scholar] [CrossRef]
- Cabral, P.; Augusto, G.; Tewolde, M.; Araya, Y. Entropy in Urban Systems. Entropy 2013, 15, 5223–5236. [Google Scholar] [CrossRef]
- Comfort, L.K.; Oh, N.; Ertan, G. The Dynamics of Disaster Recovery: Resilience and Entropy in Hurricane Response Systems 2005–2008. Public Org. Rev. 2009, 9, 309–323. [Google Scholar] [CrossRef]
- Mayer, A.L.; Donovan, R.P.; Pawlowski, C.W. Information and entropy theory for the sustainability of coupled human and natural systems. Ecol. Soc. 2014, 19, 11. [Google Scholar] [CrossRef]
- Ehret, U.; Gupta, H.V.; Sivapalan, M.; Weijs, S.V.; Schymanski, S.J.; Blöschl, G.; Gelfan, A.N.; Harman, C.; Kleidon, A.; Bogaard, T.A.; et al. Advancing catchment hydrology to deal with predictions under change. Hydrol. Earth Syst. Sci. 2014, 18, 649–671. [Google Scholar] [CrossRef]
- Greco, R.; Dinardo, A.; Santonastaso, G. Resilience and entropy as indices of robustness of water distribution networks. J. Hydroinform. 2012, 14, 761–771. [Google Scholar] [CrossRef]
- Creaco, E.; Fortunato, A.; Franchinia, M.; Mazzola, M.R. Comparison between entropy and resilience as indirect measures of reliability in the framework of water distribution network design. Procedia Eng. 2014, 70, 379–388. [Google Scholar] [CrossRef]
- Carey, S.K.; Tetzlaff, D.; Seibert, J.; Soulsby, C.; Buttle, J.; Laudon, H.; McDonnell, J.; McGuire, K.; Caissie, D.; Shanley, J.; et al. Inter-comparison of hydro-climatic regimes across Northern catchments: Synchronicity, resistance and resilience. Hydrol. Process. 2010. [Google Scholar] [CrossRef]
- Vogel, R.M.; Bolognese, R.A. Storage-reliability-resilience-yield relations for over-year water supply systems. Water Resour. Res. 1995, 31, 645–654. [Google Scholar] [CrossRef]
- Asefa, T.; Clayton, J.; Adams, A.; Anderson, D. Performance evaluation of a water resources system under varying climatic conditions: Reliability, Resilience, Vulnerability and beyond. J. Hydrol. 2014, 508, 53–65. [Google Scholar] [CrossRef]
- Gallopin, G.C. Linkages between vulnerability, resilience, and adaptive capacity. Glob. Environ. Chang. 2006, 16, 293–303. [Google Scholar] [CrossRef]
- Kjeldsen, T.R.; Rosbjerg, D. Choice of reliability, resilience and vulnerability estimators for risk assessments of water resources systems. Hydrol. Sci. J. Sci. Hydrol. 2004, 49, 755–767. [Google Scholar]
- Béné, C.; Newsham, C.; Davies, M.; Ulrichs, M.; Godfrey-Wood, R. Review article: Resilience, Poverty and Development. J. Int. Dev. 2014, 26, 598–623. [Google Scholar] [CrossRef]
- Müller, F.; Bergmann, M.; Dannowski, R.; Dippner, J.W.; Gnauck, A.; Haase, P.; Jochimsen, M.C.; Kasprzak, P.; Krönckei, I.; Kümmerlin, R.; et al. Assessing resilience in long-term ecological data sets. Ecol. Indic. 2016, 65, 10–43. [Google Scholar] [CrossRef]
- Peterson, T.J.; Western, A.W. Multiple hydrological attractors under stochastic daily forcing: 1. Can multiple attractors exist? Water Resour. Res. 2014, 50, 2993–3009. [Google Scholar] [CrossRef]
- Peterson, T.J.; Western, A.W.; Argent, R.M. Multiple hydrological attractors under stochastic daily forcing: 2. Can multiple attractors emerge? Water Resour. Res. 2014, 50, 3010–3029. [Google Scholar] [CrossRef]
- Anderies, J.M. Minimal models and agroecological policy at the regional scale: An application to salinity problems in southeastern Australia. Reg. Environ. Chang. 2005, 5, 1–17. [Google Scholar] [CrossRef]
- Tamea, S.; Laio, F.; Ridolfi, L.; D’Odorico, P.; Rodriguez-Iturbe, I. Ecohydrology of groundwater-dependent ecosystems: 2. Stochastic soil moisture dynamics. Water Resour. Res. 2009, 45, W05420. [Google Scholar] [CrossRef]
- Desouza, K.C.; Flanery, T.H. Designing, planning, and managing resilient cities: A Conceptual Framework. Cities 2013, 35, 89–99. [Google Scholar] [CrossRef]
- Fistola, R.; La Rocca, R.A. The Sustainable City and the Smart City: Measuring urban entropy first. WIT Trans. Ecol. Environ. 2014, 191, 537–548. [Google Scholar]
- Liquan, X.; Junqing, Z. The New Town Development in Ecological Sensitive Area Based on Resilience Thinking. Procedia Soc. Behav. Sci. 2016, 216, 998–1005. [Google Scholar] [CrossRef]
- Anderies, J.M.; Janssen, M.A.; Walker, B.H. Grazing management, resilience, and the dynamics of a fire-driven rangeland system. Ecosystems 2002, 5, 23–44. [Google Scholar] [CrossRef]
- Walker, B.; Meyers, J.A. Thresholds in ecological and social–ecological systems: A developing database. Ecol. Soc. 2004, 9, 3. [Google Scholar] [CrossRef]
- Forbes, B.C.; Stammler, F.; Kumpula, T.; Meschtyb, N.; Pajunen, A.; Kaarlejarvi, E. High Resilience in the Yamal-Nenets Social–Ecological System, West Siberian Arctic, Russia. Proc. Natl. Acad. Sci. USA 2009, 106, 22041–22048. [Google Scholar] [CrossRef] [PubMed]
- Cavallaro, M.; Asprone, D.; Latora, V.; Manfredi, G.; Nicosia, V. Assessment of Urban Ecosystem Resilience through Hybrid Social–Physical Complex Networks. Comput. Aided Civ. Infrastruct. Eng. 2014, 29, 608–625. [Google Scholar] [CrossRef]
- Wang, C.-H.; Blackmore, J.; Wang, X.; Yum, K.-K.; Zhou, M.; Diaper, C.; McGregor, G.; Anticev, J. Overview of Resilience Concepts, with Application to Water Resource Systems. eWater Technical Report, Canberra. 2009. Available online: http://ewatercrc.com.au/reports/ResilienceConcepts.pdf (accessed on 12 November 2014).
- Fowler, H.J.; Kilsby, C.G.; O’Connell, P.E. Modeling the impacts of climatic change and variability on the reliability, resilience, and vulnerability of a water resource system. Water Resour. Res. 2003, 39. [Google Scholar] [CrossRef]
- D’Odorico, P.; Bhattachan, A. Hydrologic variability in dryland regions: Impacts on ecosystem dynamics and food security. Philos. Trans. R. Soc. Lond. B Biol. Sci. 2012, 367, 3145–3157. [Google Scholar] [CrossRef] [PubMed]
- Borgogno, F.; D’Odorico, P.; Laio, F.; Ridolfi, L. Effect of rainfall interannual variability on the stability and resilience of dryland plant ecosystems. Water Resour. Res. 2007, 43, W06411. [Google Scholar] [CrossRef]
- Singh, V.P.; Fiorentino, M. A Historical Perspective of Entropy Applications in Water Resources; Kluwer Academic Publishers: Dodrecht, The Netherlands, 1992; pp. 21–61. [Google Scholar]
- Singh, V.P. The use of entropy in hydrology and water resources. Hydrol. Process. 1997, 11, 587–626. [Google Scholar] [CrossRef]
- Castillo, A.; Castelli, F.; Entekhabi, D. An entropy-based measure of hydrologic complexity and its applications. Water Resour. Res. 2014, 5145–5160. [Google Scholar] [CrossRef] [PubMed]
- Teutschbein, C.; Grabs, T.; Karlsen, R.H.; Laudon, H.; Bishop, K. Hydrological response to changing climate conditions: Spatial streamflow variability in the boreal region. Water Resour. Res. 2015, 1–22. [Google Scholar] [CrossRef]
- Singh, V.P. Entropy as a decision tool in environmental and water resources. Indian Assoc. Hydrol. Hydrol. J. 1998, 21, 1–12. [Google Scholar]
- Marini, G.; Zollo, R.; Fontanaa, N.; Giugni, M.; Singh, V.P. Variability and trends in streamflow in northeast United States, The Fourth Italian Workshop on Landslides. Procedia Earth Planet. Sci. 2016, 16, 156–165. [Google Scholar] [CrossRef]
- Halverson, M.J.; Fleming, S.W. Complex network theory, streamflow, and hydrometric monitoring system design. Hydrol. Earth Syst. Sci. 2015, 19, 3301–3318. [Google Scholar] [CrossRef]
- Meerow, S.; Newell, J.P.; Stults, M. Defining urban resilience: A review. Landsc. Urban Plan. 2016, 147, 38–49. [Google Scholar] [CrossRef]
- Middleton, B.J.; Bailey, A.K. Water Resources of South Africa, 2005 Study (WR2005), version 2; User’s Guide, Water Research Commission Report No TT 513/11; Water Research Commission: Pretoria, South Africa, 2011. [Google Scholar]
- Midgley, D.C.; Pitman, W.V.; Middleton, B.J. Surface Water Resources of South Africa 1990; WRC Report No. 298/1.1/94 to 298/6.2/94; Water Research Commission: Pretoria, South Africa, 1994; Volume I–IV. [Google Scholar]
- Shi, P.J.; Yuan, Y.; Zheng, J.; Wang, J.A.; GE, Y.; Qiu, G.Y. The effect of land use/cover change on surface runoff in Shenzhen, China. Catena 2007, 69, 31–35. [Google Scholar] [CrossRef]
- Ilunga, M.; Onyari, E.K. Measuring variability of mean annual runoff for the Upper Vaal catchment using entropy. In Proceedings of the 35th IASTED International Conference, Modelling, Identification and Control (MIC 2016), Innsbruck, Austria, 15–16 February 2016; pp. 221–226. [Google Scholar]
- Andréassian, V.; Coron, L.; Lerat, J.; Le Moine, N. Climate elasticity of streamflow revisited—An elasticity index based on long-term hydrometeorological records. Hydrol. Earth Syst. Sci. 2016, 20, 4503–4524. [Google Scholar] [CrossRef]
- Bassiouni, M.; Vogel, R.M.; Archfield, S.A. Panel regressions to estimate low-flow response to rainfall variability in ungaged basins. Water Resour. Res. 2016, 1–25. [Google Scholar] [CrossRef]
- Meng, F.; Su, F.; Yang, D.; Tong, K.; Hao, Z. Impacts of recent climate change on the hydrology in thesource region of the Yellow River basin. J. Hydrol. Reg. Stud. 2016, 6, 66–81. [Google Scholar] [CrossRef]
- Allaire, M.C.; Vogel, M.R.; Kroll, C.N. The hydro-morphology of an urbanizing watershed using multivariate elasticity. Adv. Water Resour. 2015, 86, 147–154. [Google Scholar] [CrossRef]
- Li, E.; Mu, X.; Zhao, G.; Gao, P.; Shao, H. Variation of Runoff and Precipitation in the Hekou-Longmen Region of the Yellow River Based on Elasticity Analysis. Sci. World J. 2014, 2014, 929858. [Google Scholar] [CrossRef] [PubMed]
- Sankarasubramaniam, A.; Vogel, R.M.; Limburner, J.F. Climate elasticity of streamflow in the United States. Water Resour. Res. 2001, 37, 1771–1781. [Google Scholar] [CrossRef]
- Fu, G.; Charles, S.P.; Chiew, F.H.S. A two-parameter climate elasticity of streamflow index to assess climate change effects on annual streamflow. Water Resour. Res. 2007, 43, W11419. [Google Scholar] [CrossRef]
- Potter, N.J.; Petheram, C.; Zhang, L. Sensitivity of streamflow to rainfall and temperature in south-eastern Australia during the Millennium drought. In Proceedings of the 19th International Congress on Modelling and Simulation, Perth, Australia, 12–16 December 2011; Available online: http://mssanz.org.au/modsim2011 (accessed on 17 February 2016).
- Konapala, G.; Ashok, K.; Mishra, A.K. Three-parameter-based streamflow elasticity model: Application to MOPEX basins in the USA at annual and seasonal scales. Hydrol. Earth Syst. Sci. 2016, 20, 2545–2556. [Google Scholar] [CrossRef]
- Chiew, H.S.F. Estimation of rainfall elasticity of streamflow in Australia. Hydrol. Sci. J. 2006, 51, 613–625. [Google Scholar] [CrossRef]
- Chiew, F.H.S.; Peel, M.C.; McMahon, T.A.; Siriwardena, L.W. Precipitation elasticity of streamflow in catchments across the world. In Climate Variability and Change—Hydrological Impacts, Proceedings of the Fifth FRIEND World Conference, Havana, Cuba, 27 November–1 December 2006; IAHS Publ. 2006; 308, pp. 256–262. [Google Scholar]
- Department of Water Affairs. Upper Vaal Management Area: Overview of Water Resources Availability and Utilisation; Report No. PWA 08/000/00/0203; Department of Water Affairs: Pretoria, South Africa, 2003.
- Ilunga, M.; Singh, V.P. Measuring spatial variability of land use associated with hydrological impact in urbanized quaternary catchment using entropy. Water SA 2015, 41, 41–54. [Google Scholar] [CrossRef]
- McMahon, T.A.; PeeL, M.C.; Pegram, G.G.S.; Smith, I.N. A Simple Methodology for Estimating Mean and Variability of Annual Runoff and Reservoir Yield under Present and Future Climates. J. Hydrometeorol. 2011, 11, 135–146. [Google Scholar] [CrossRef]
- Amorocho, J.; Espildora, B. Entropy in the assessment of uncertainty in hydrologic systems and models. Water Resour. Res. 1973, 9, 1511–1522. [Google Scholar] [CrossRef]
- Jowitt, P.M. The Extreme Value Type-1 distribution and the principle of maximum entropy. J. Hydrol. 1979, 42, 23–38. [Google Scholar] [CrossRef]
- Sonuga, J.O. Principle of maximum entropy in hydrologic frequency analysis. J. Hydrol. 1972, 30, 81–94. [Google Scholar] [CrossRef]
- Krstanovic, P.F.; Singh, V.P. A Univariate model for long-term streamflow forecasting. Stoch. Hydrol. Hydraul. 1991, 5, 173–188. [Google Scholar] [CrossRef]
- Yang, Z.F.; Yan, Y.; Liu, Q. The relationship of Streamflow-Precipitation-Temperature in the Yellow River Basin of China during 1961–2000. Procedia Environ. Sci. 2012, 13, 2336–2345. [Google Scholar] [CrossRef]
- Jain, S.K.; Bhunya, P.K. Reliability, resilience and vulnerability of a multipurpose storage reservoir. Hydrol. Sci. J. Sci. Hydrol. 2008, 53, 434–447. [Google Scholar] [CrossRef]
- Runyan, C.W.; D’Odorico, P. Ecohydrological feedbacks between salt accumulation and vegetation dynamics: Role of vegetation-groundwater interactions. Water Resour. Res. 2010, 46, W11561. [Google Scholar] [CrossRef]
- Ajami, N.K.; Hornberger, G.M.; Sunding, D.L. Sustainable water resource management under hydrological Uncertainty. Water Resour. Res. 2008, 44, W11406. [Google Scholar] [CrossRef]
- Huang, F.; Chunyu, X.; Wang, Y.; Wu, Y.; Qian, B.; Guo, L.; Zhao, D.; Xia, Z. Investigation into Multi-Temporal Scale Complexity of Streamflows and Water Levels in the Poyang Lake Basin, China. Entropy 2017, 19, 67. [Google Scholar] [CrossRef]
- Thompson, I. Biodiversity, ecosystem thresholds, resilience and forest degradation. Unasylva 2012, 238, 25–30. [Google Scholar]
- Willis, K.J.; Bailey, R.M.; Bhagwat, S.A.; Birks, H.J.B. Biodiversity baselines, thresholds and resilience: Testing predictions and assumptions using palaeoecological data. Trends Ecol. Evolut. 2010, 25, 583–591. [Google Scholar] [CrossRef] [PubMed]
- Vano, J.A.; Das, T.; Lettenmaier, D.P. Hydrologic Sensitivities of Colorado River Runoff to Changes in Precipitation and Temperature. J. Hydrometeorol. 2012, 13, 932–949. [Google Scholar] [CrossRef]
- National Water Resource Strategy. Department of Water Affairs (Pretoria: DWA): South Africa, 2013. Available online: https://www.dwa.gov.za/nwrs/NWRS2013.aspx (accessed on 29 September 2016).
- Zhou, X.; Zhang, Y.; Yang, Y. Comparison of Two Approaches for Estimating Precipitation Elasticity of Streamflow in China’s Main River Basins. Adv. Meteorol. 2015, 2015, 924572. [Google Scholar] [CrossRef]
- Water Resources of South Africa. 2012 Study (WR2012). Available online: http://waterresourceswr2012.co.za/ (accessed on 29 September 2016).
- Wrzesinski, D. Use of Entropy in the Assessment of Uncertainty of River Runoff Regime in Poland. Acta Geophys. 2016, 64, 1825–1839. [Google Scholar] [CrossRef]
- McKenzie, R.S.; Allen, R.B. Modern water resource assessment techniques for the Vaal system. Proc. Inst. Civ. Eng. 1990, 88, 995–1014. [Google Scholar] [CrossRef]
- Mukheibir, P. Water resources management strategies for adaptation to climate-induced impacts in South Africa. Water Resour. Manag. 2008, 22, 1259–1276. [Google Scholar] [CrossRef]
- Friend, R.; Moench, M. What is the purpose of urban climate resilience? Implications for addressing poverty and Vulnerability. Urban Clim. 2013, 6, 98–113. [Google Scholar] [CrossRef]
Figure 1.
Quaternary and tertiary catchments of the Upper Vaal catchment: upstream of Vaal Dam covers from C12 to C13; downstream of Vaal from C21 to C23 and Wildge from C81 to C83.
Figure 1.
Quaternary and tertiary catchments of the Upper Vaal catchment: upstream of Vaal Dam covers from C12 to C13; downstream of Vaal from C21 to C23 and Wildge from C81 to C83.

Figure 2.
Entropy associated with mean annual runoff for each quaternary catchment in its respective tertiary catchment, Hmin and Hmax are entropy thresholds for: (a) tertiary C11; (b) tertiary C12; (c) tertiary C12; (d) tertiary C21; (e) tertiary C22; (f) tertiary C23; (g) tertiary C81; (h) tertiary C82 and (i) tertiary C83.


Figure 3.
Entropy associated with mean annual runoff (MAR) for each tertiary catchment in the Upper Vaal catchment.
Figure 3.
Entropy associated with mean annual runoff (MAR) for each tertiary catchment in the Upper Vaal catchment.

Figure 4.
MAR pseudo-elasticity versus (a) mean annual precipitation; (b) mean annual evaporation.
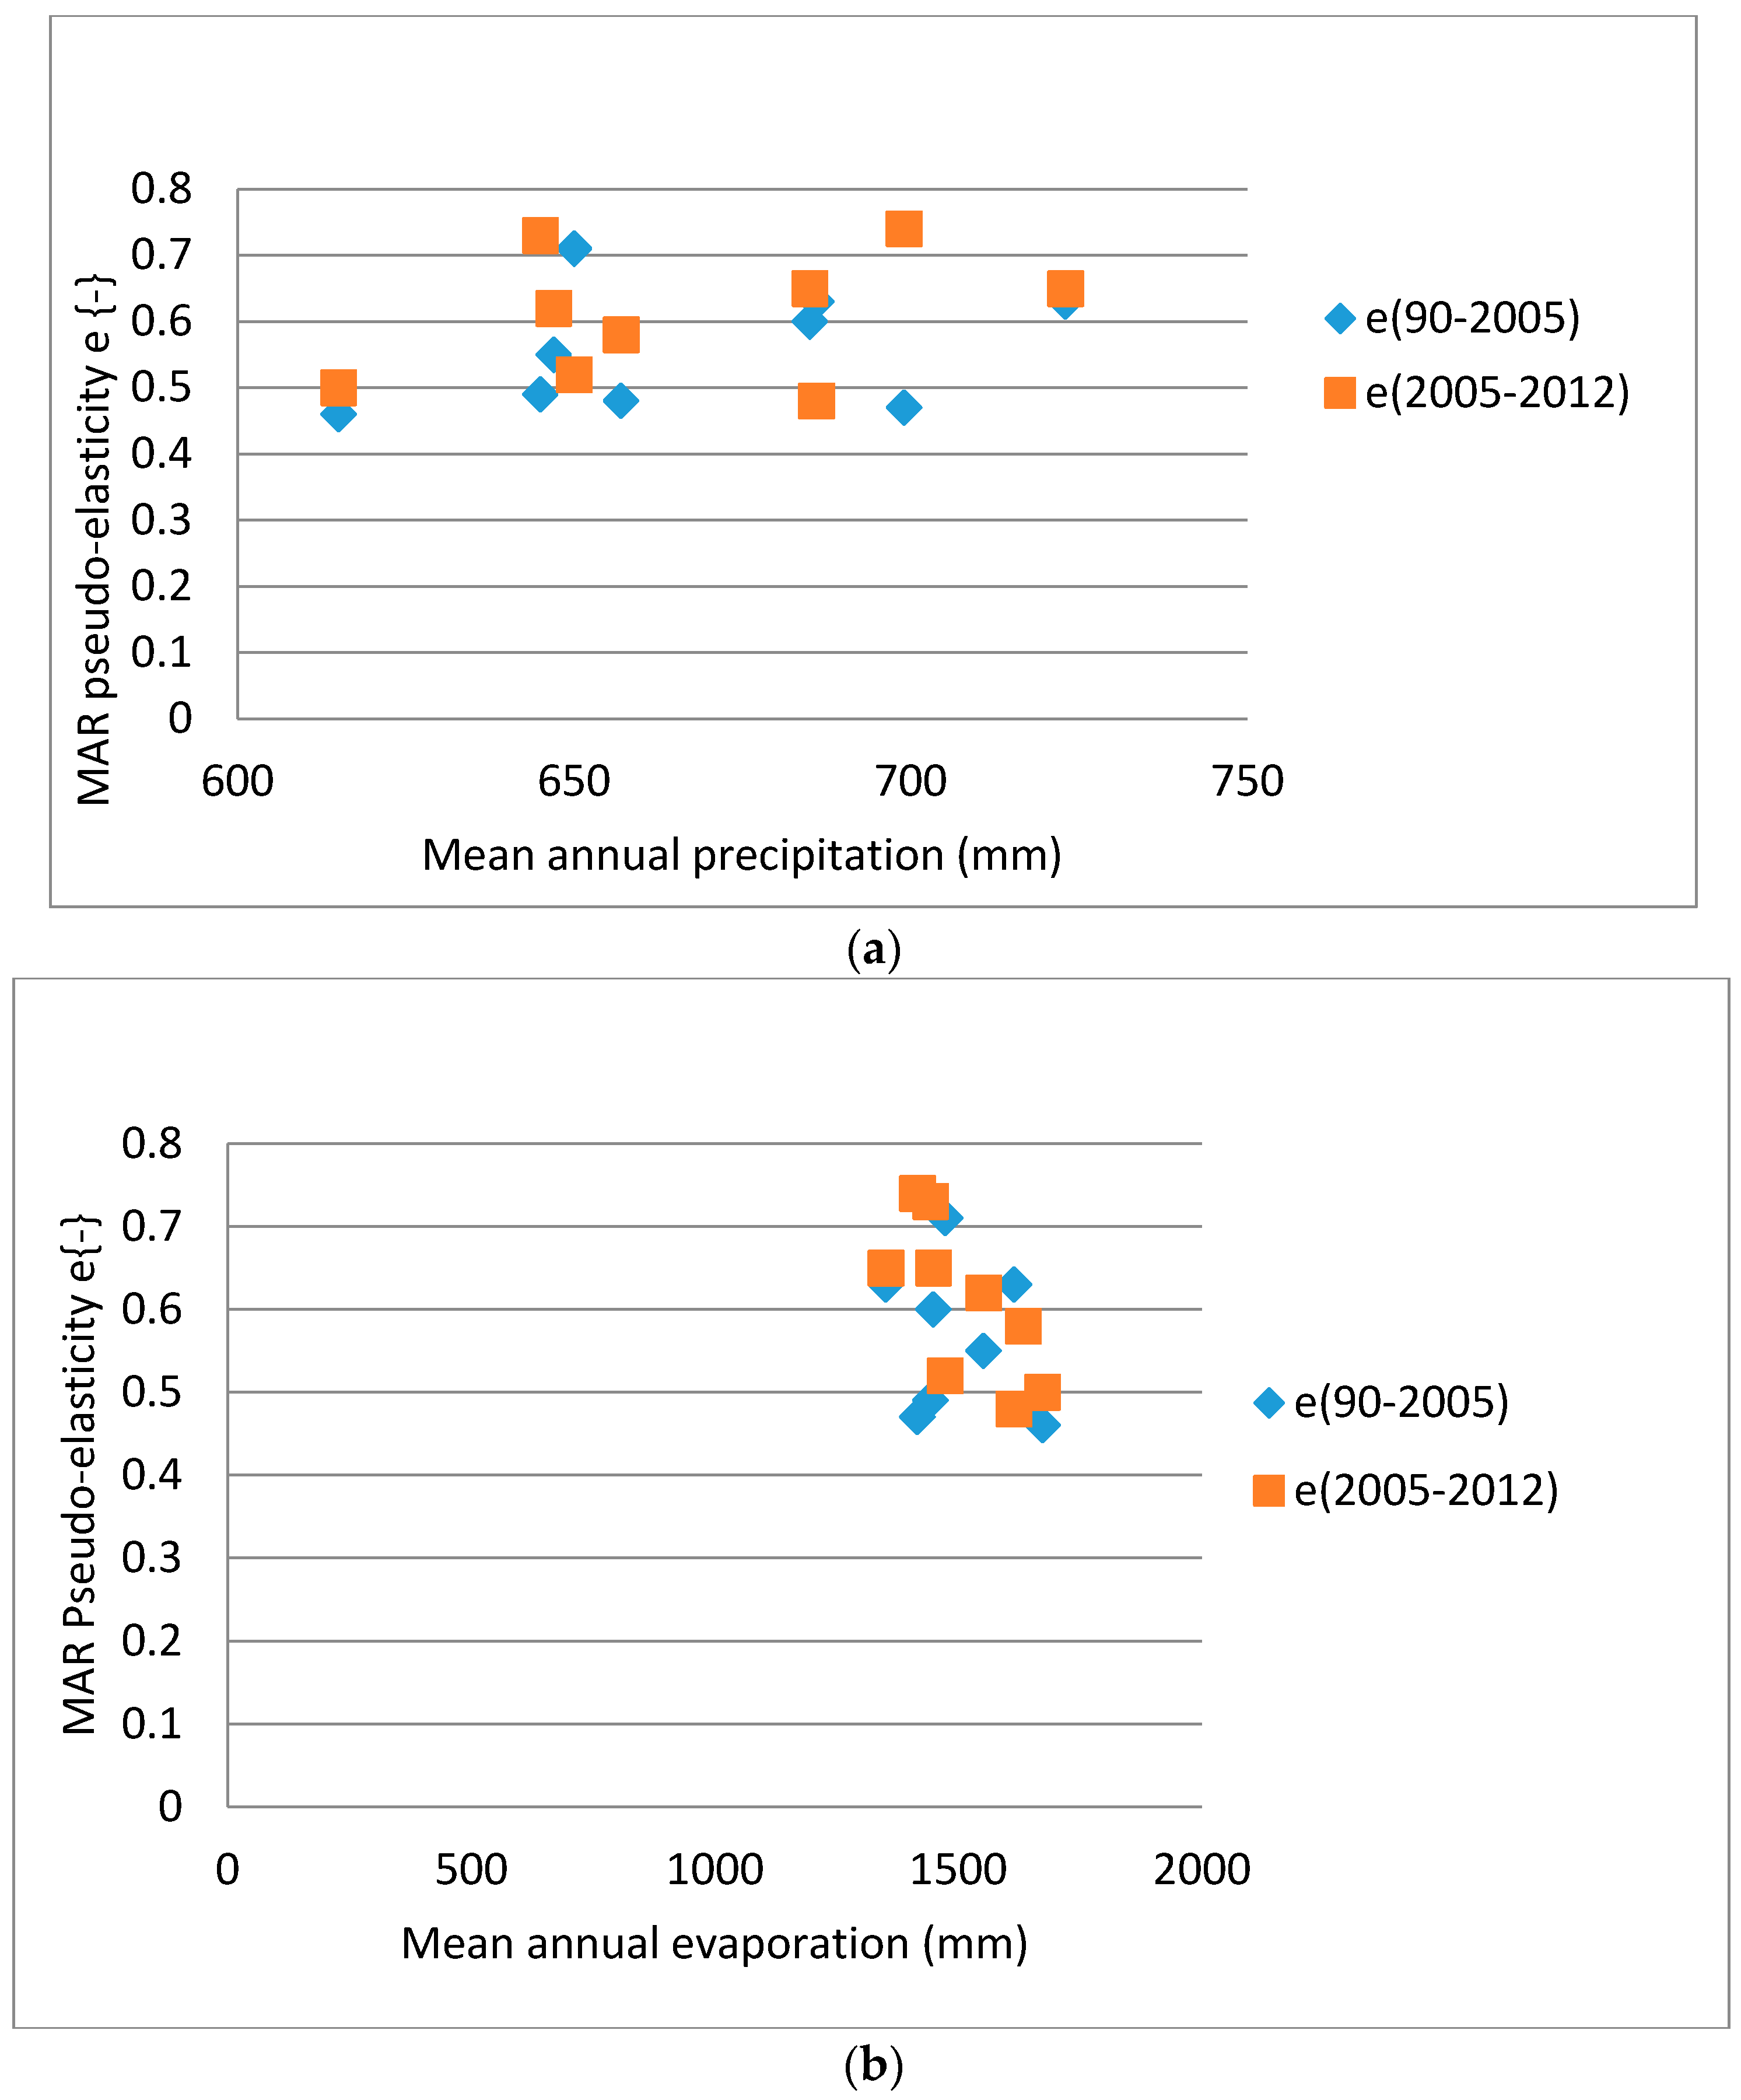

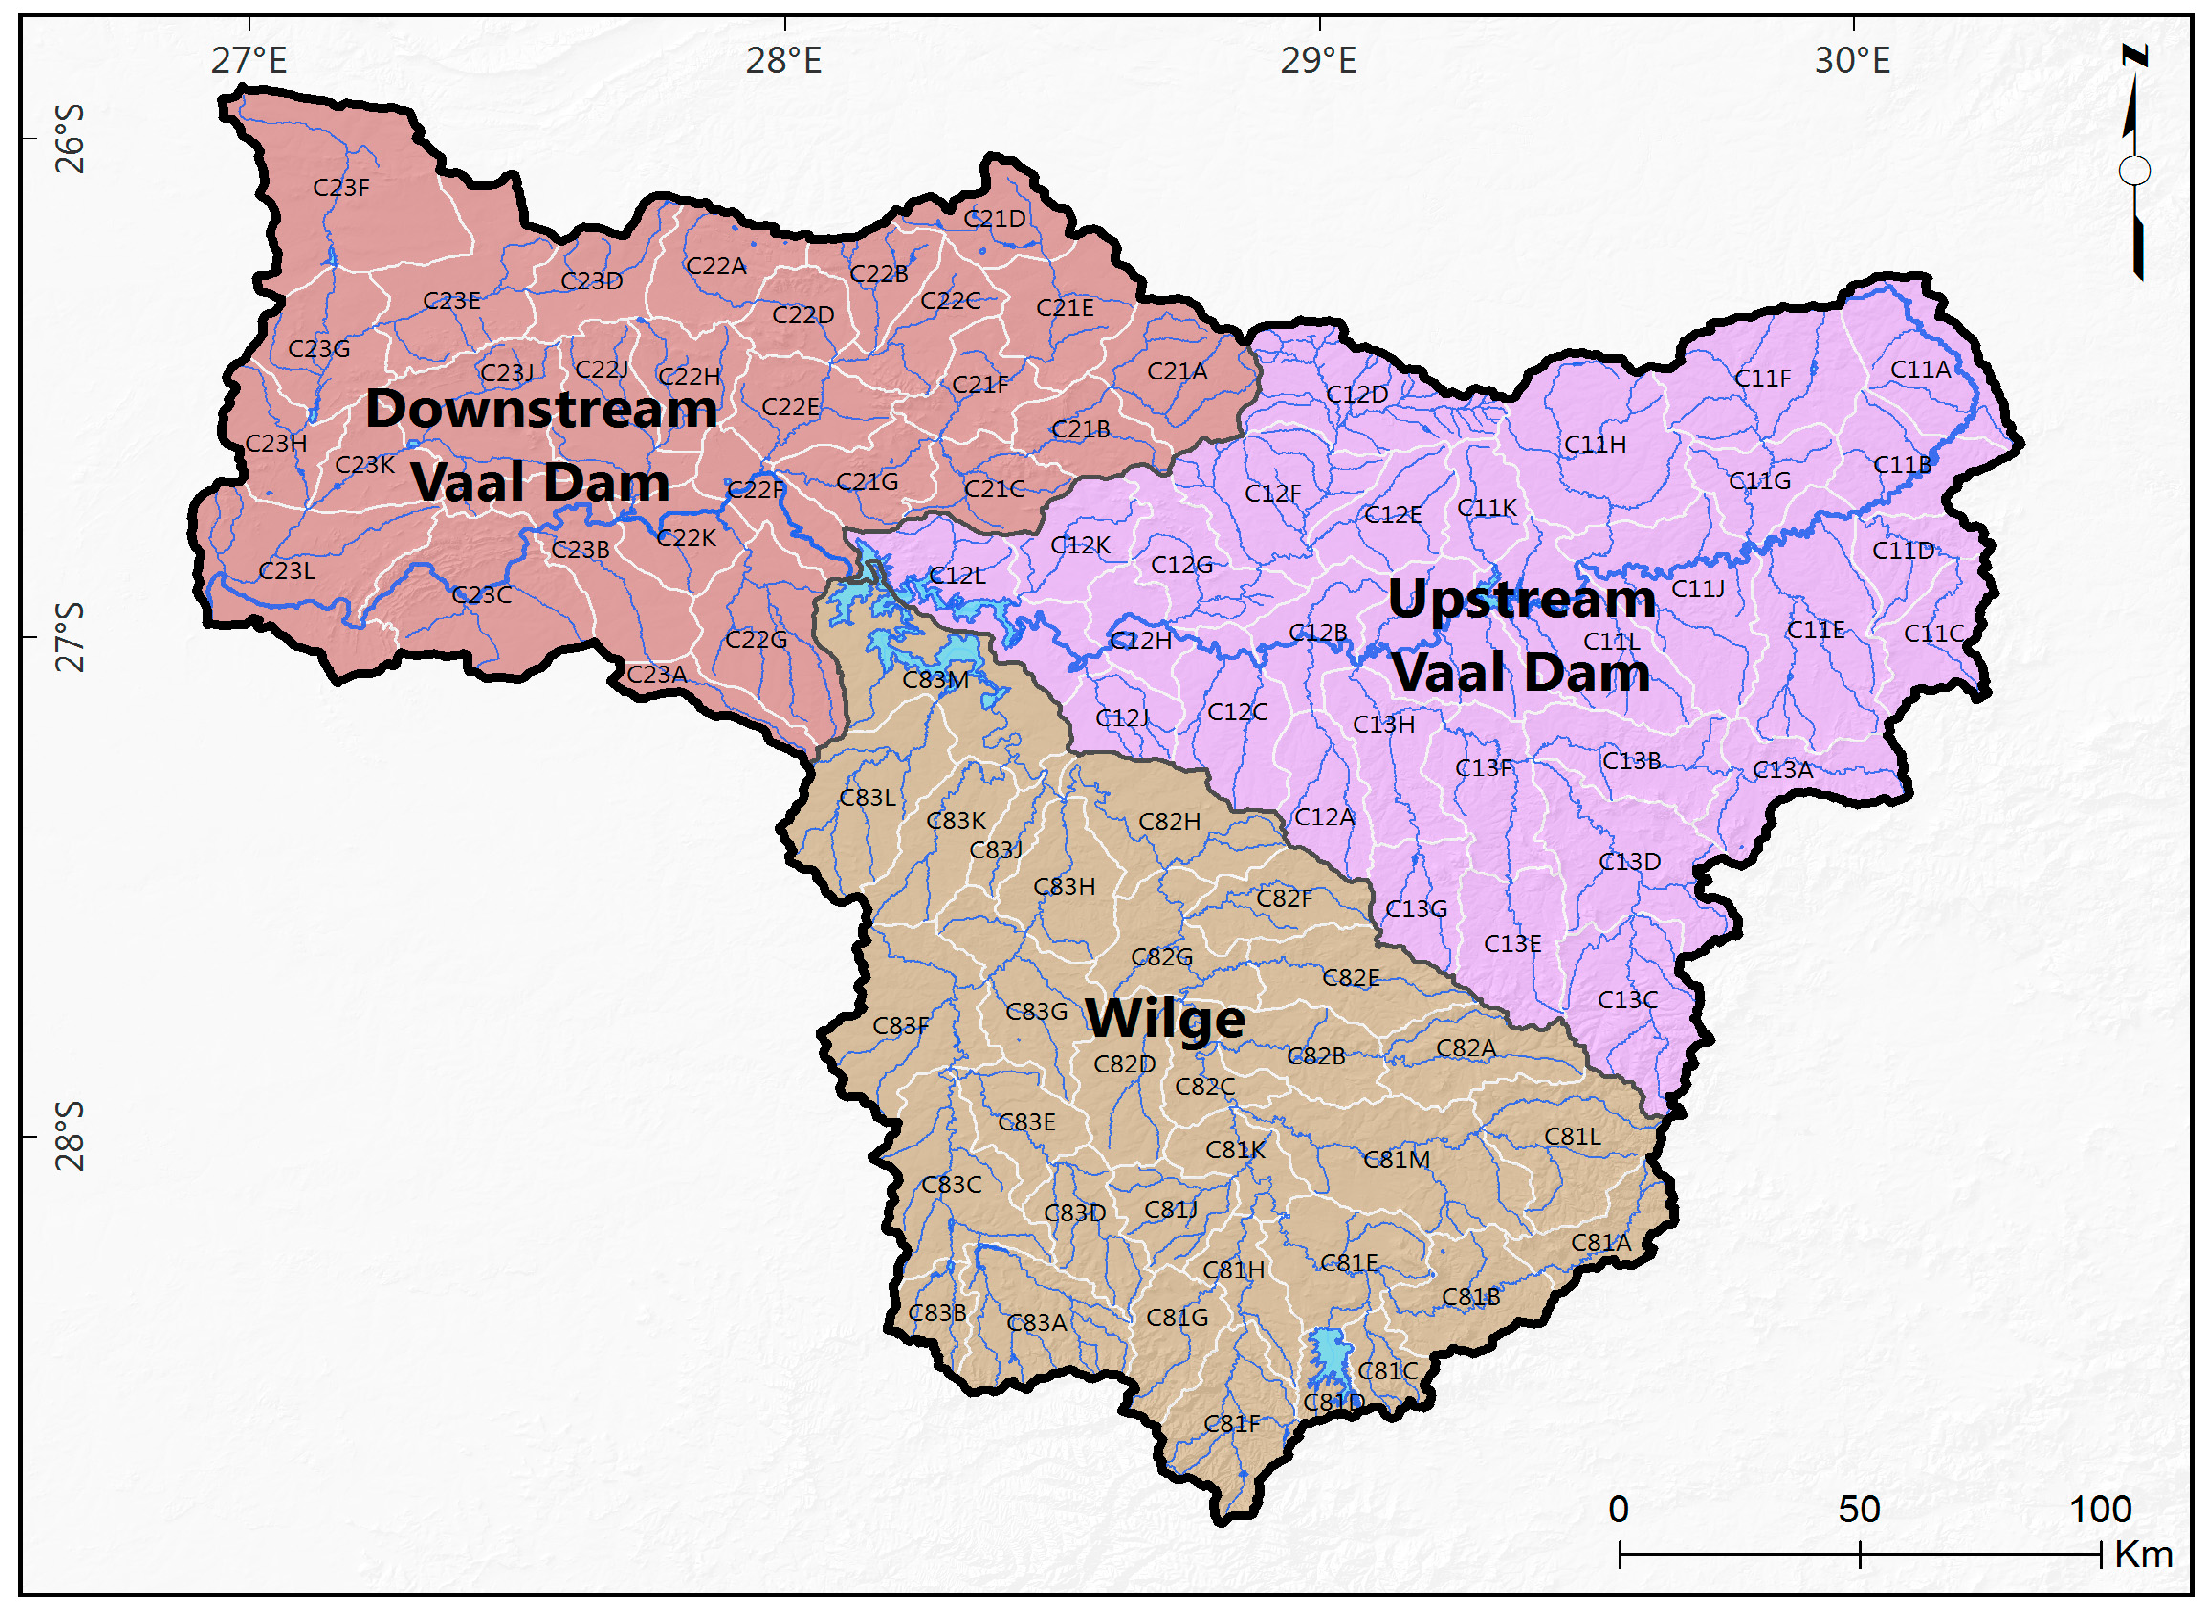
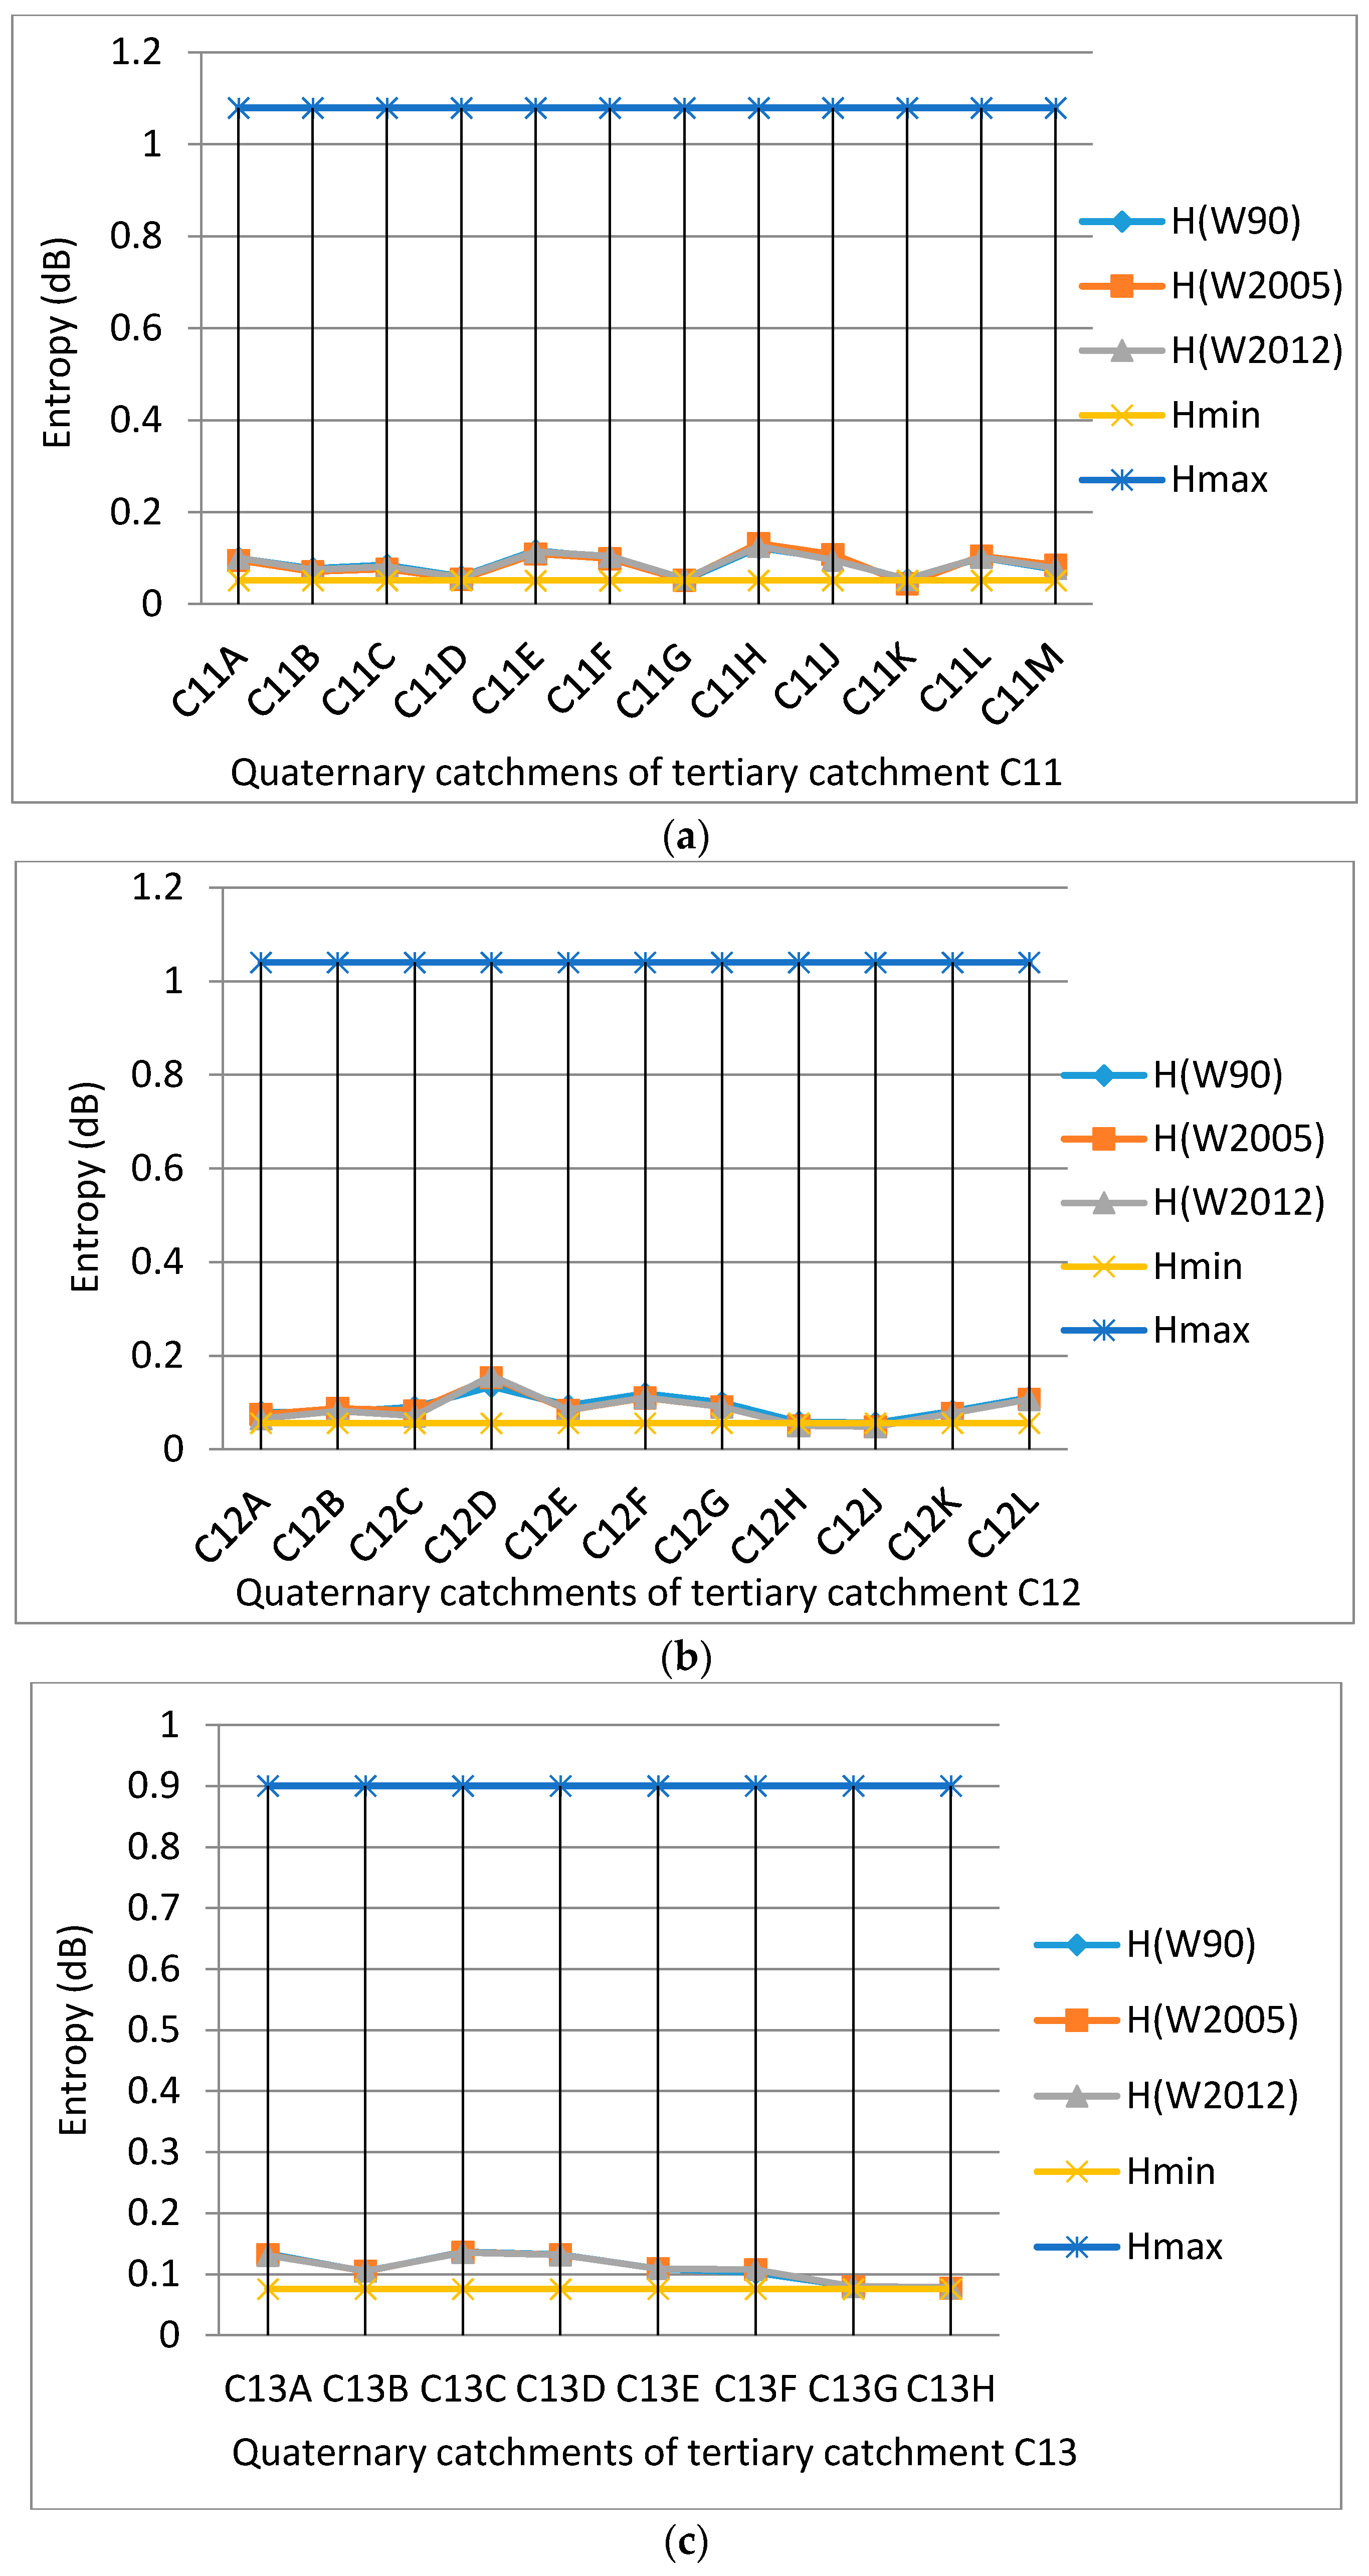
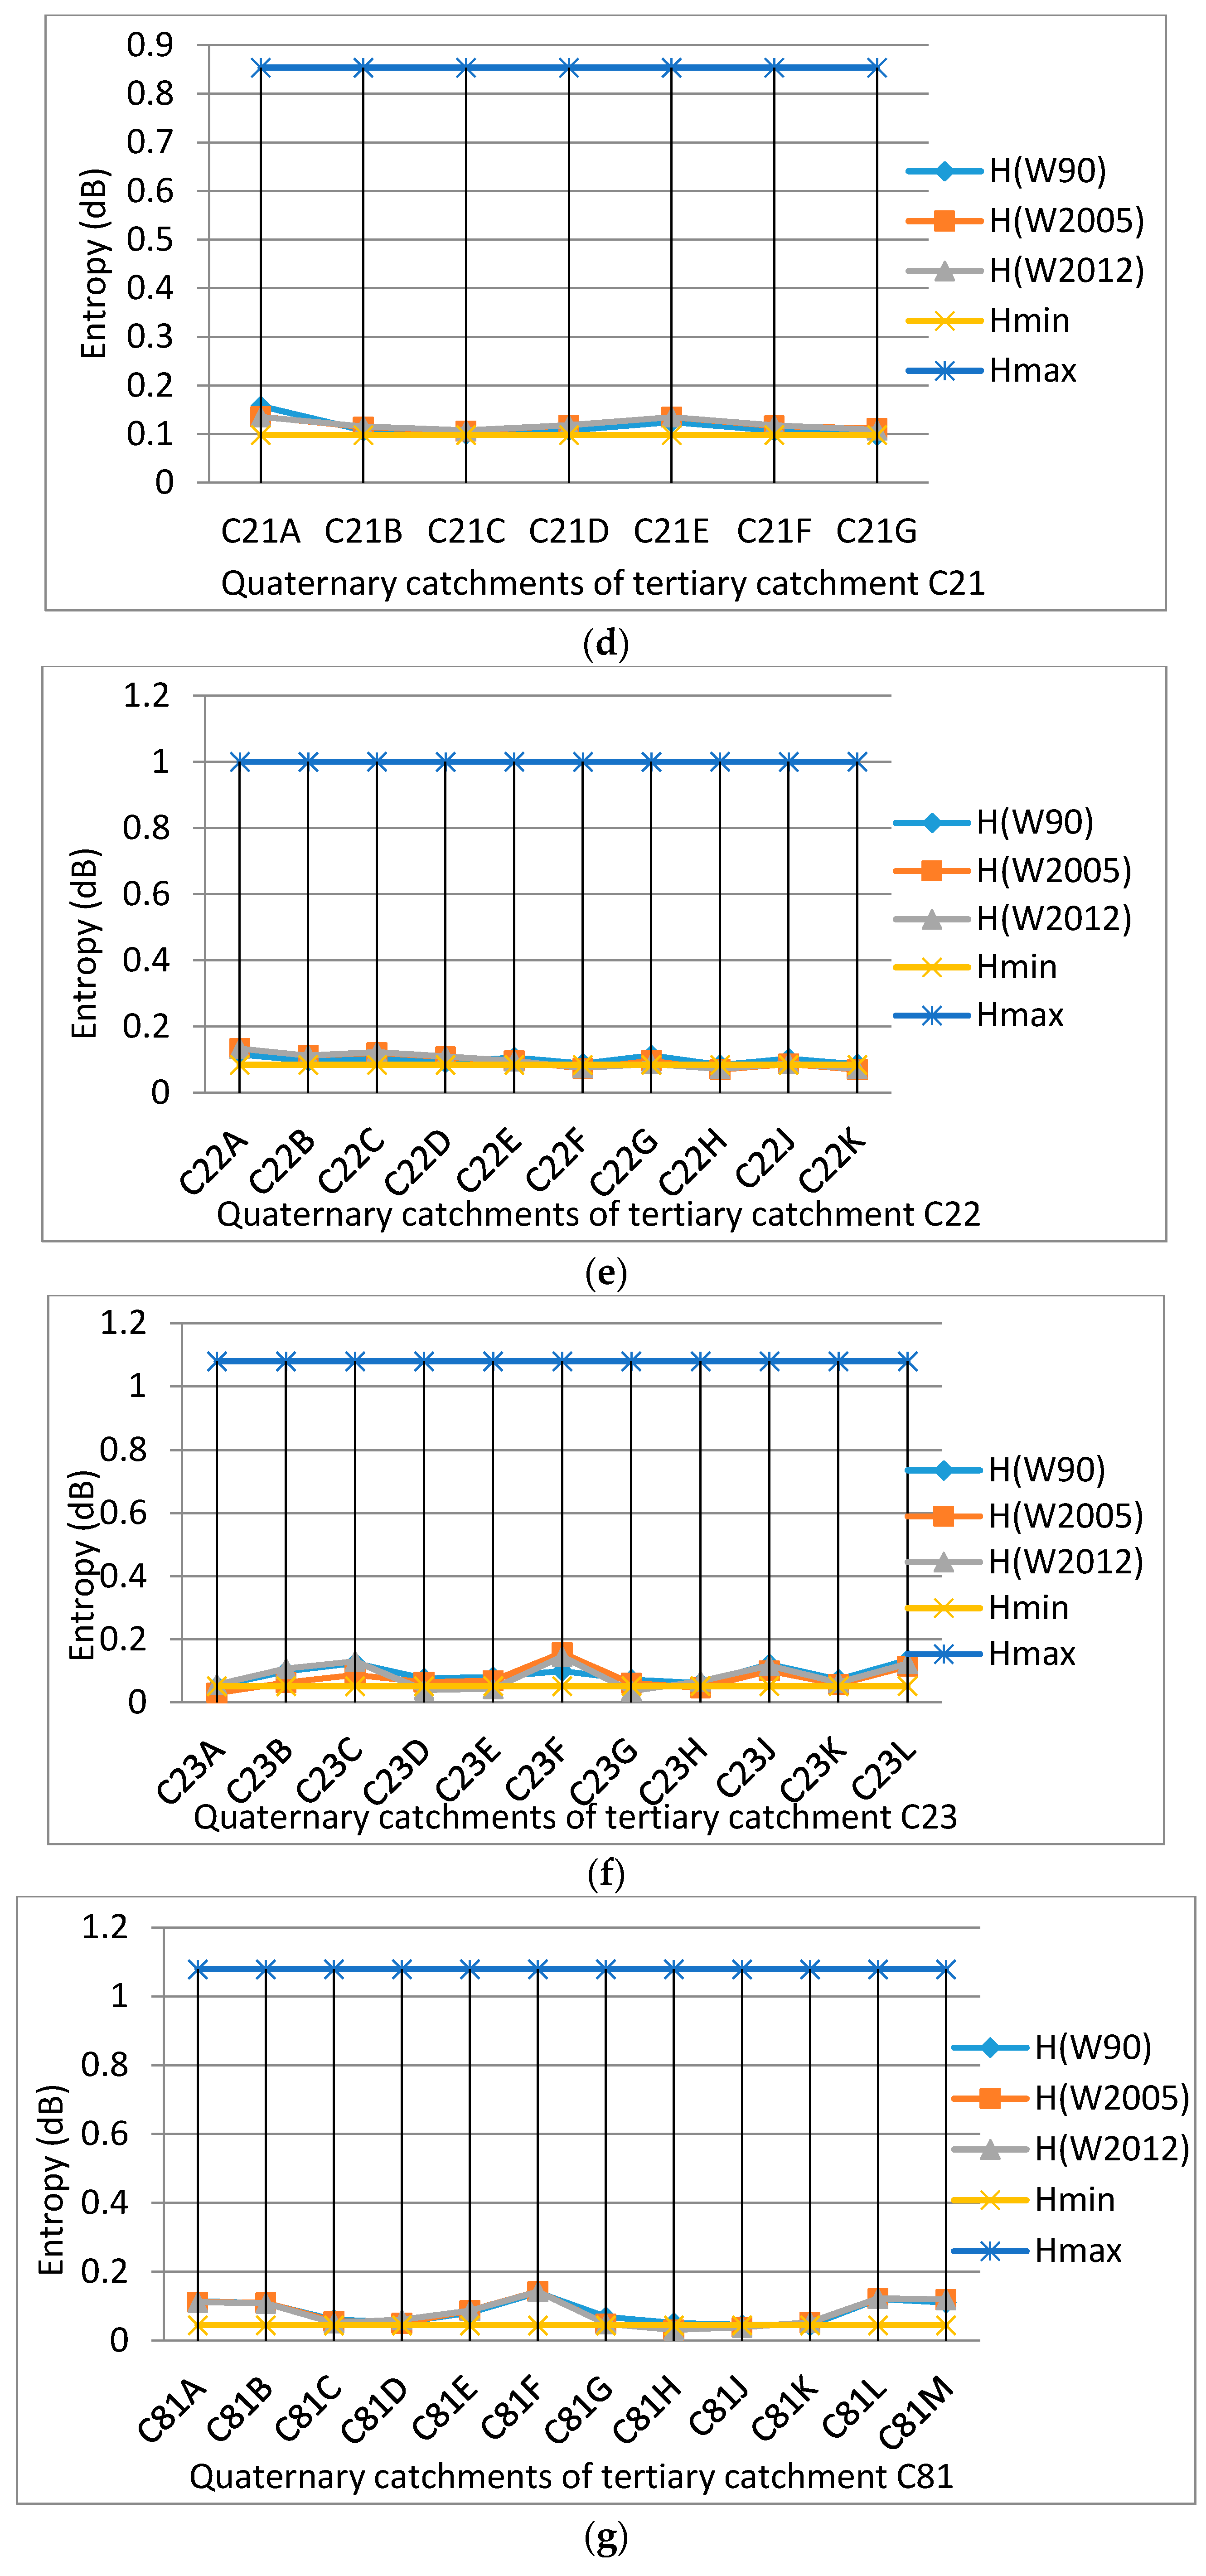
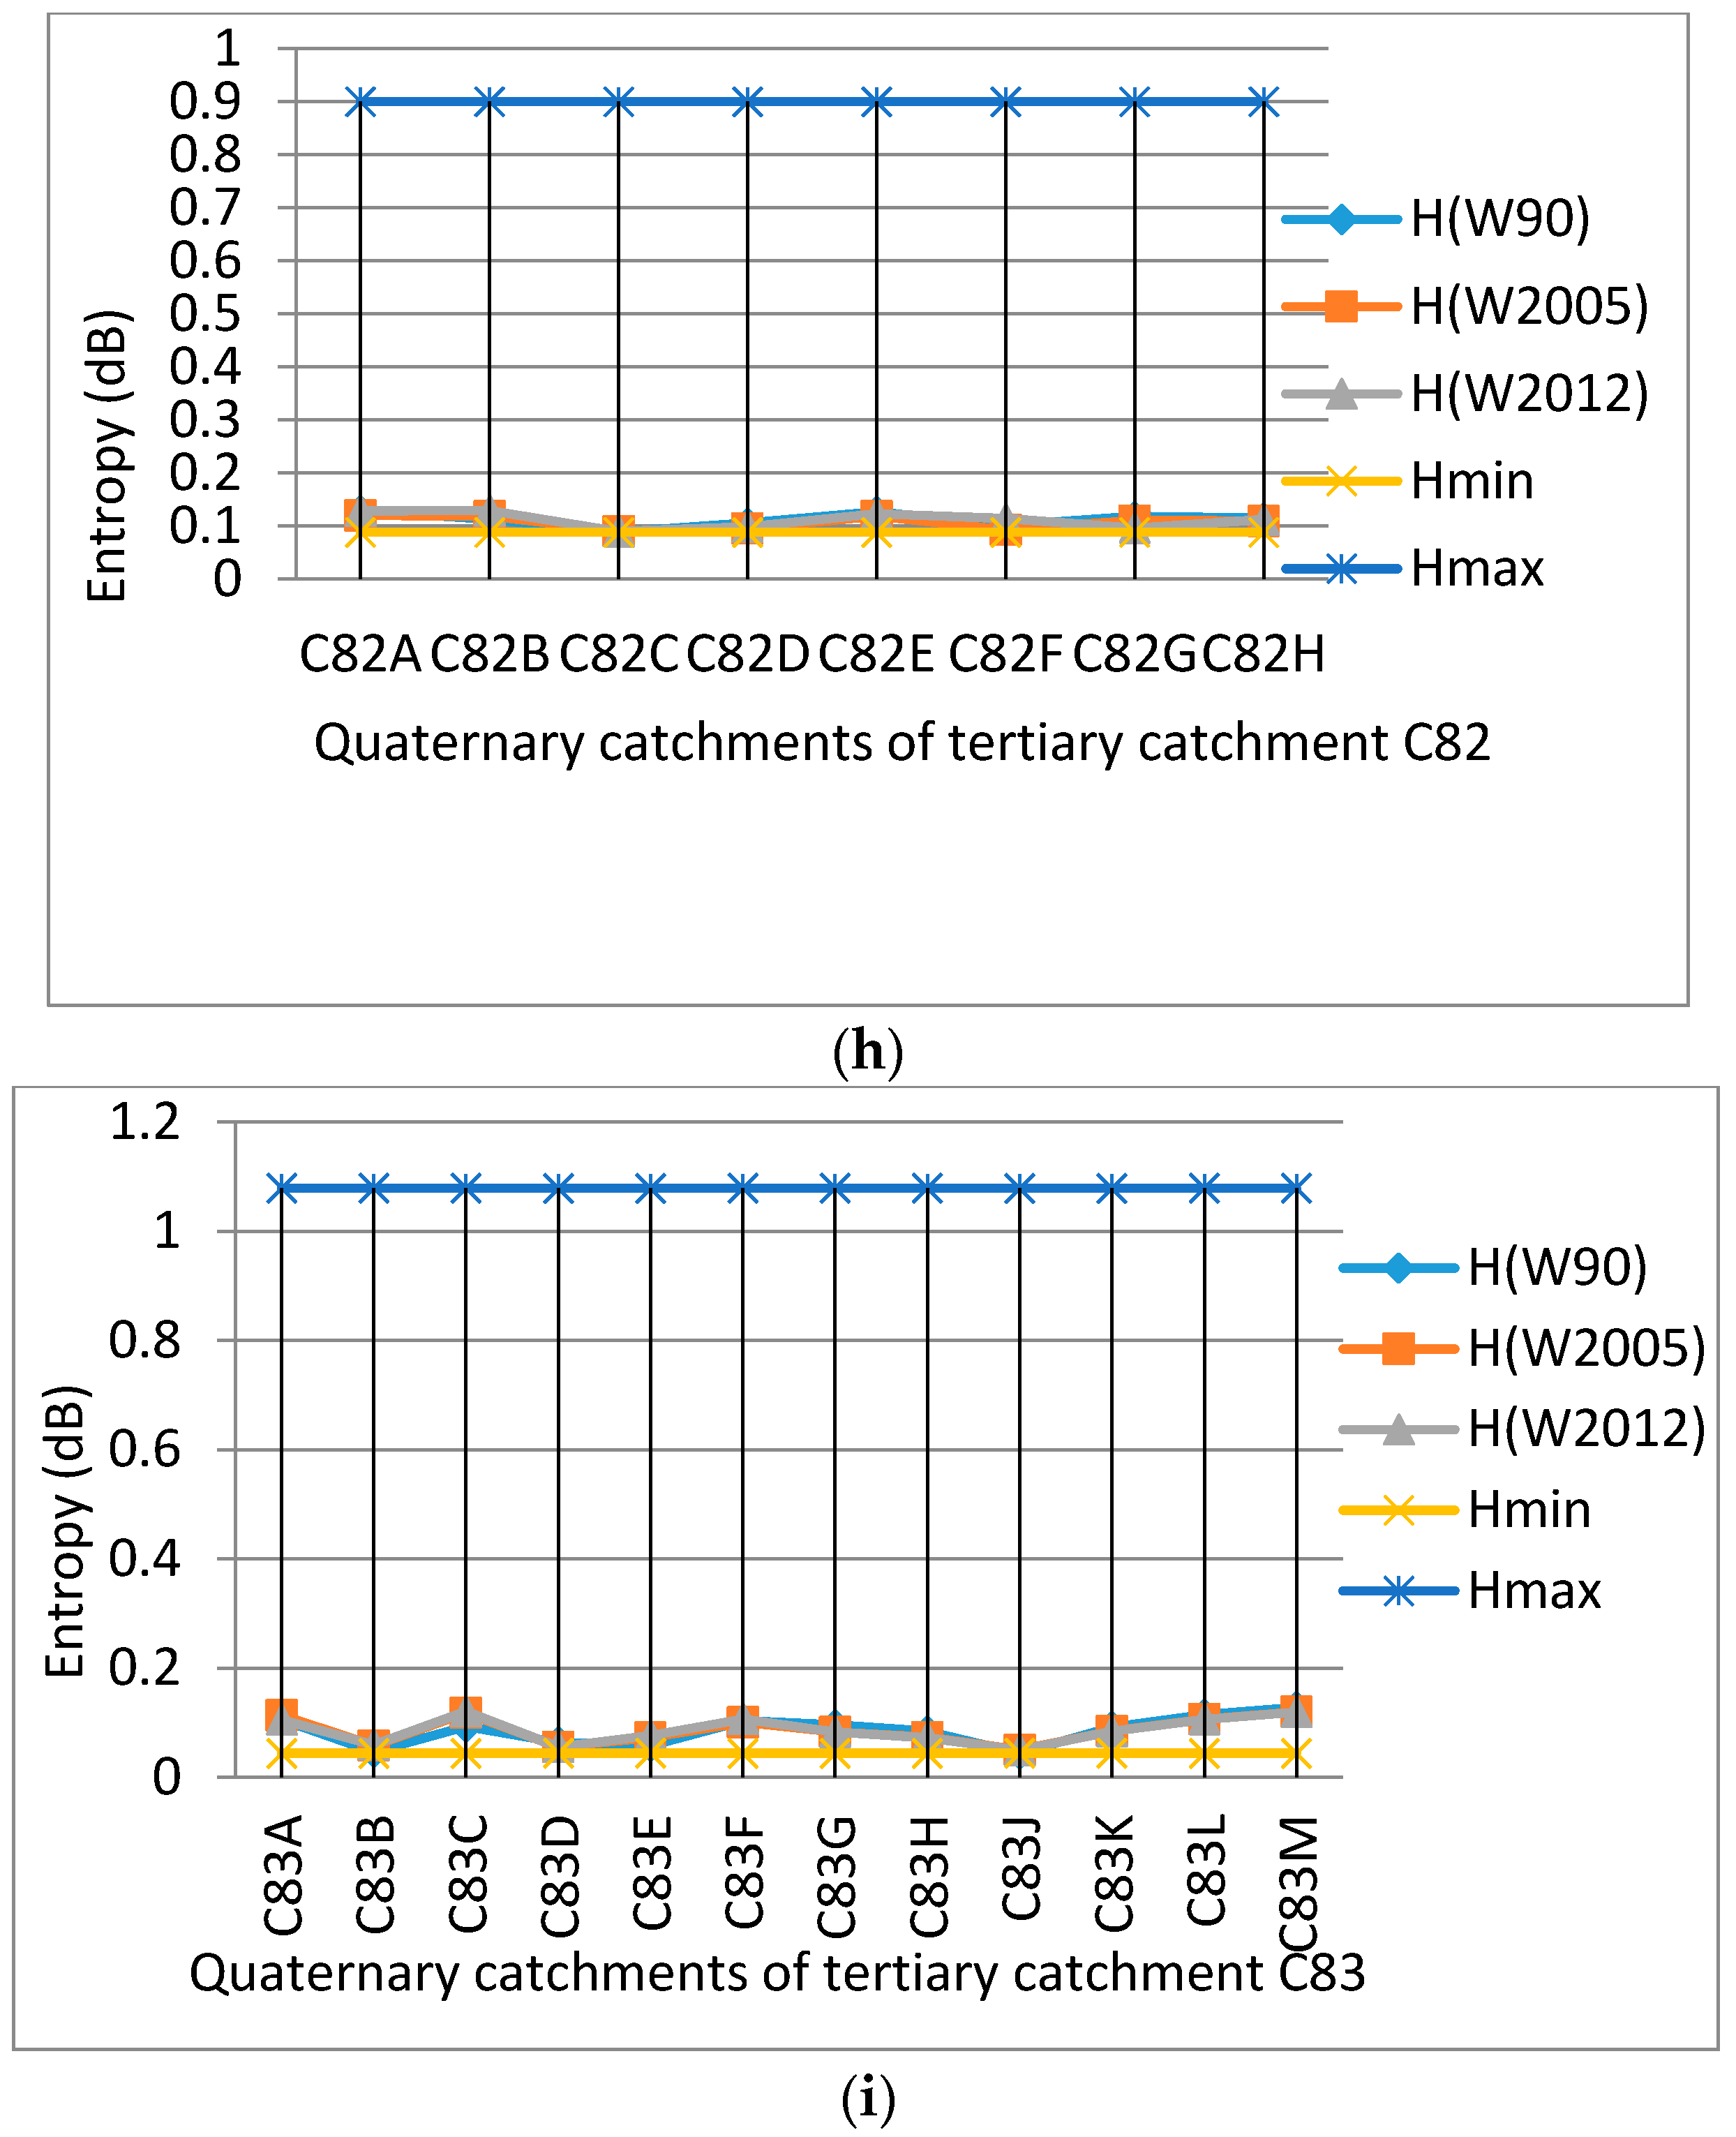
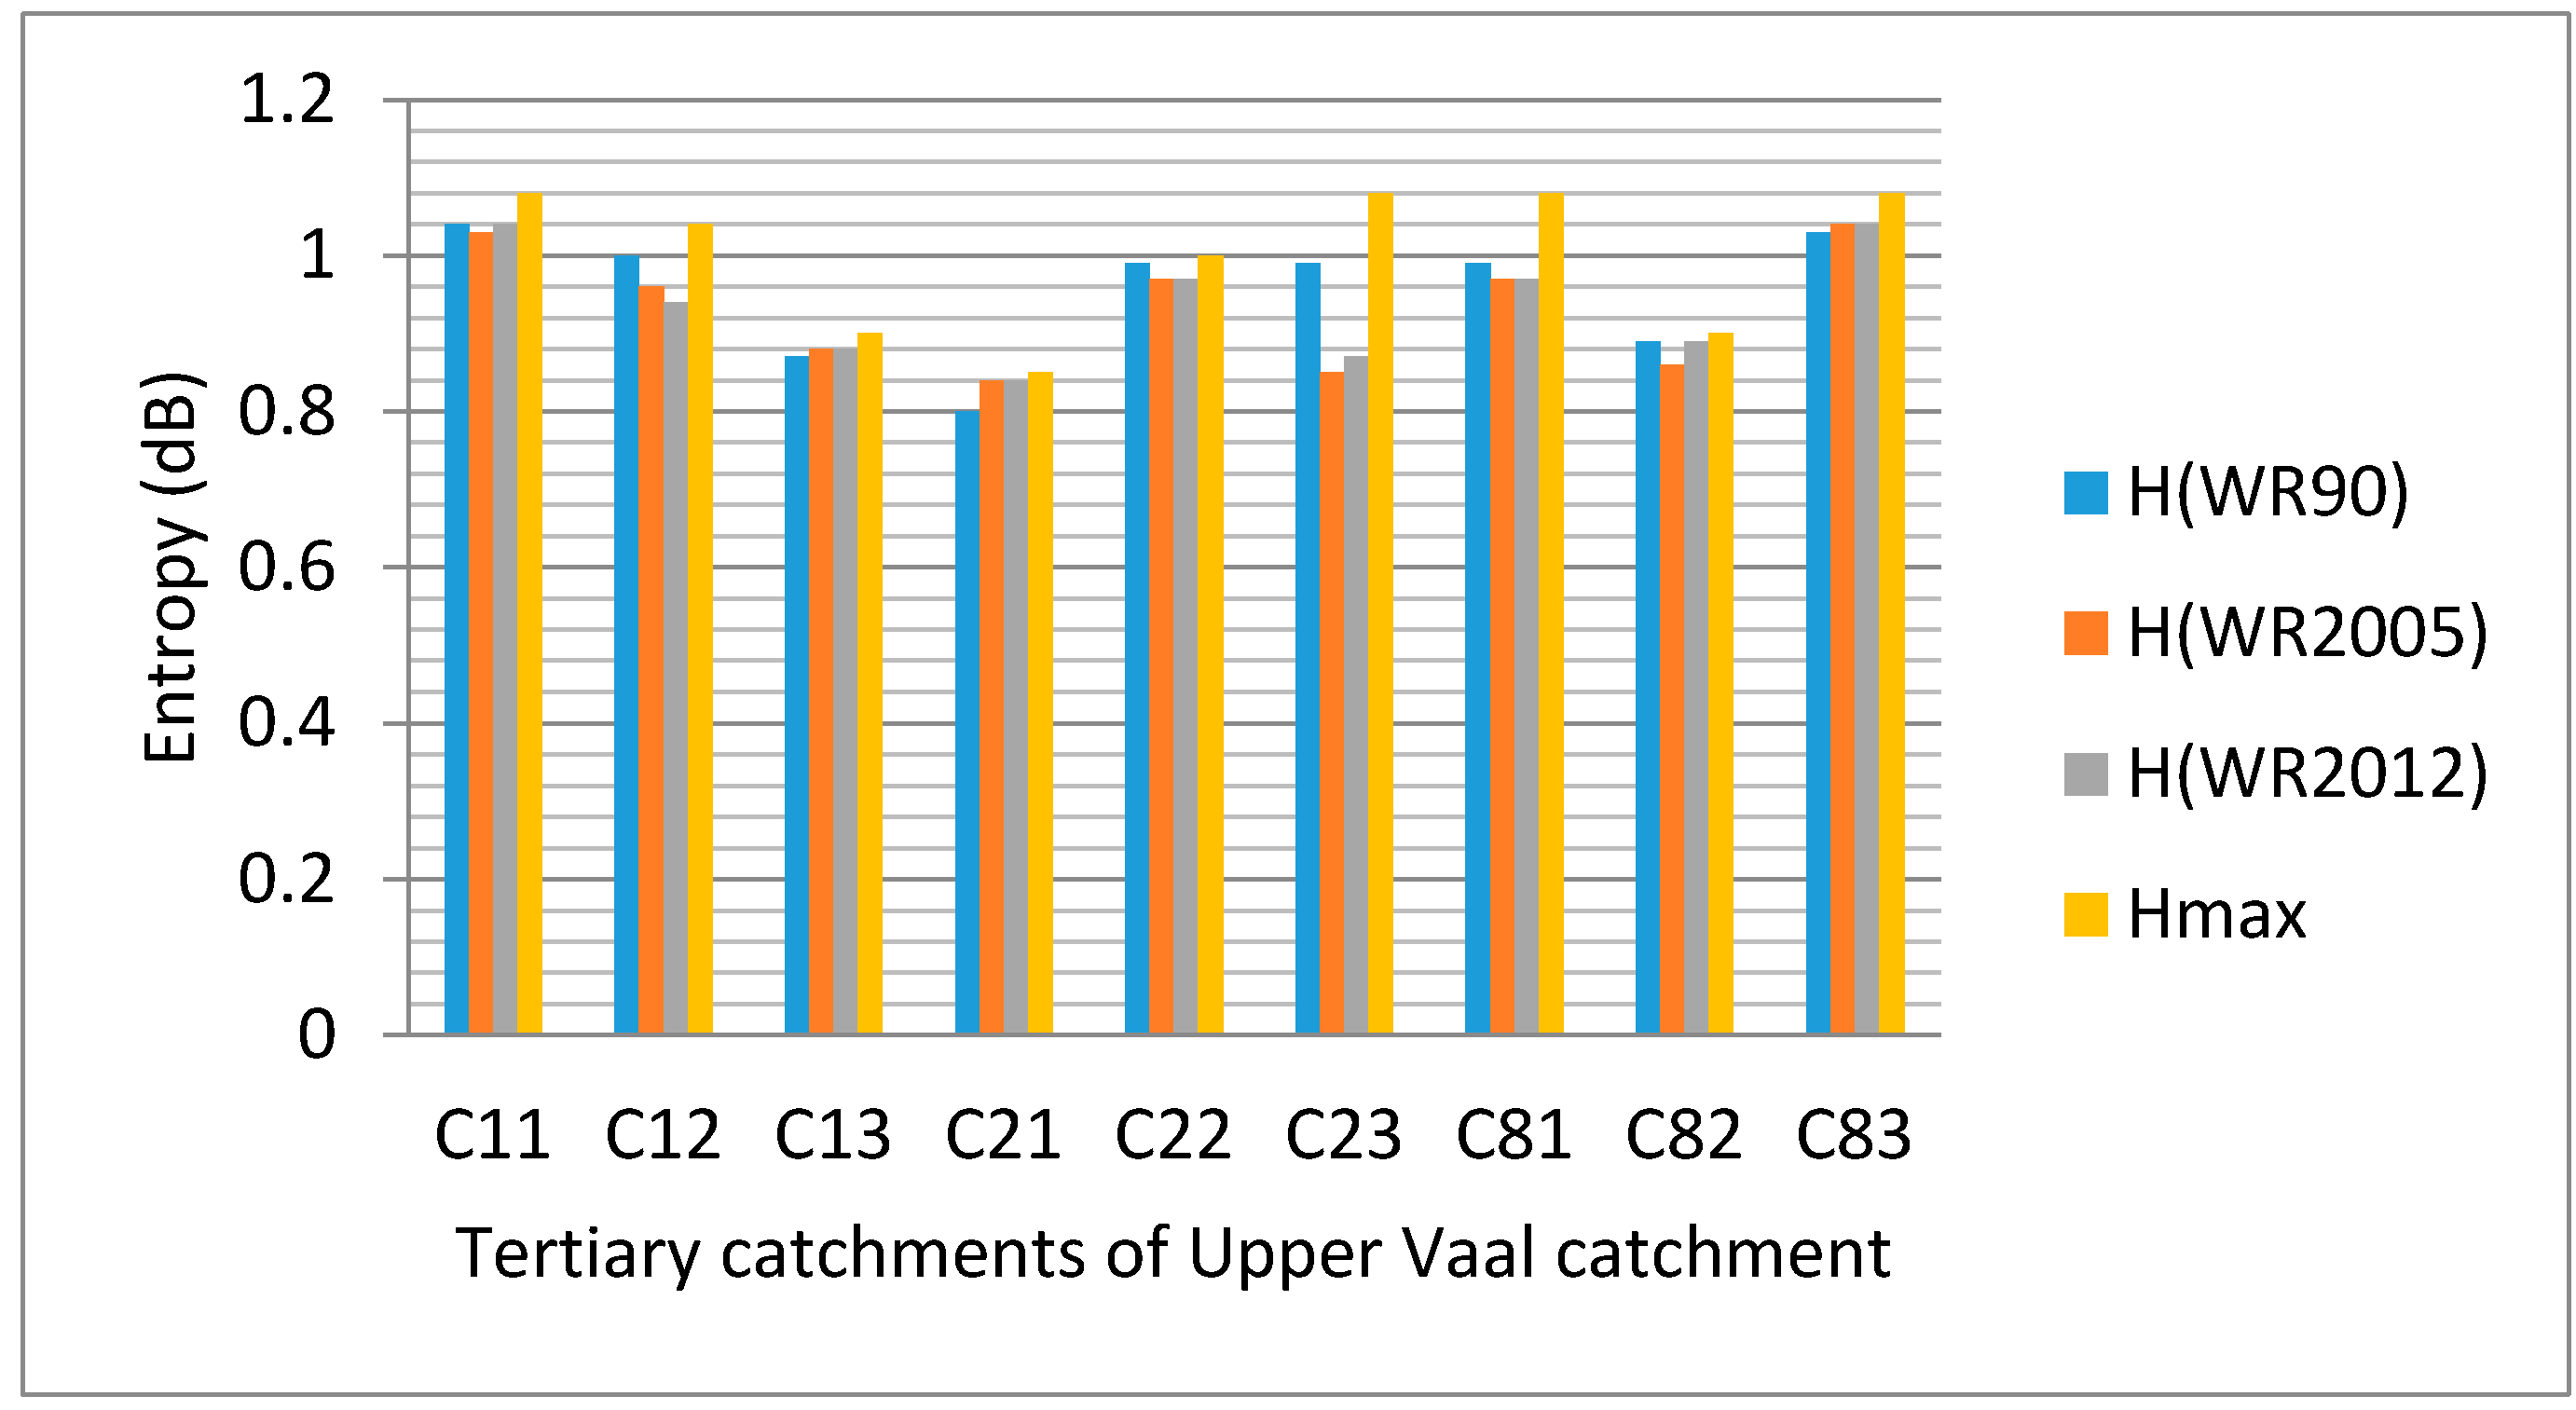
Table 1.
Characteristics of tertiary catchments (TC) of the Upper Vaal river system [46], as extracted from [75].
| Tertiary Catchment (TC) | Area (km2) | MAP (mm) | MAE (mm) | MAR (WR90) MCM | MAR (WR2005) MCM | MAR (WR2012) MCM | Number of QC in TC |
|---|---|---|---|---|---|---|---|
| C11 | 8791 | 685 | 1449 | 548.2 | 546.28 | 527.34 | 12 |
| C12 | 6498 | 647 | 1552 | 296.7 | 231.32 | 211.96 | 11 |
| C13 | 5182 | 699 | 1416 | 291.8 | 322.49 | 343.05 | 8 |
| C21 | 3541 | 686 | 1614 | 141.5 | 89.88 | 98.98 | 7 |
| C22 | 5110 | 657 | 1633 | 131.5 | 150.02 | 157.51 | 10 |
| C23 | 8273 | 615 | 1673 | 238.7 | 185.68 | 219.00 | 11 |
| C81 | 6167 | 723 | 1351 | 450.6 | 515.02 | 529.08 | 12 |
| C82 | 4471 | 645 | 1443 | 198 | 214.82 | 151.72 | 8 |
| C83 | 7529 | 650 | 1478 | 283.8 | 236.76 | 252.56 | 12 |
Table 2.
Relative changes in entropy associated with mean annual runoff (MAR) for TCs in the Upper Vaal for WR90, W2005 [46] and WR2012.
Table 2.
Relative changes in entropy associated with mean annual runoff (MAR) for TCs in the Upper Vaal for WR90, W2005 [46] and WR2012.
| Tertiary Catchment | Relative Change in H (WR2005/WR90) | Relative Change in H (WR2012/WR2005) |
|---|---|---|
| C11 | −1.13 | 0.97 |
| C12 | −3.78 | −1.04 |
| C13 | 0.30 | 0 |
| C21 | 4.45 | 0 |
| C22 | −2.39 | 0 |
| C23 | −14.35 | −2.35 |
| C81 | −2.50 | 0 |
| C82 | 4.40 | 3.5 |
| C83 | 0.68 | 0 |
Table 3.
Models for tertiary catchments (TCs) in Upper Vaal: relative change in entropy δH(yj) associated with MAR versus relative change in MAR (δ(yj) for quaternary catchments.
Table 3.
Models for tertiary catchments (TCs) in Upper Vaal: relative change in entropy δH(yj) associated with MAR versus relative change in MAR (δ(yj) for quaternary catchments.
| Tertiary Catchment | Linear Model (WR2005/WR90) | Linear Model (WR2012/WR2005) |
|---|---|---|
| C11 | (R2 = 98.36%, = 0.65 ) | (R2 = 99.12%, = 0.65) |
| C12 | (R2 = 91.8%, = 0.55) | (R2 = 98.2%, = 0.62) |
| C13 | (R2 = 99.00%, = 0.47 ) | (R2 = 98.40%, = 0.74 ) |
| C21 | (R2 = 99.10%, = 0.63) | (R2 = 99.1%, = 0.48) |
| C22 | (R2 = 98.36%, = 0.48) | (R2 = 99.8%, = 0.58) |
| C23 | (R2 = 95.40%, = 0.46) | (R2 = 96.9%, = 0.5) |
| C81 | (R2 = 99.0%, = 0.63) | (R2 = 99.88%, = 0.65) |
| C82 | (R2 = 98.85%, = 0.49) | (R2 = 99.57%, = 0.74) |
| C83 | (R2 = 98.00%, = 0.71 ) | (R2 = 99.41%, = 0.52) |
© 2017 by the author. Licensee MDPI, Basel, Switzerland. This article is an open access article distributed under the terms and conditions of the Creative Commons Attribution (CC BY) license (http://creativecommons.org/licenses/by/4.0/).
Share and Cite
MDPI and ACS Style
Ilunga, M. Assessing Catchment Resilience Using Entropy Associated with Mean Annual Runoff for the Upper Vaal Catchment in South Africa. Entropy 2017, 19, 147. https://doi.org/10.3390/e19050147
AMA Style
Ilunga M. Assessing Catchment Resilience Using Entropy Associated with Mean Annual Runoff for the Upper Vaal Catchment in South Africa. Entropy. 2017; 19(5):147. https://doi.org/10.3390/e19050147
Chicago/Turabian StyleIlunga, Masengo. 2017. "Assessing Catchment Resilience Using Entropy Associated with Mean Annual Runoff for the Upper Vaal Catchment in South Africa" Entropy 19, no. 5: 147. https://doi.org/10.3390/e19050147
Note that from the first issue of 2016, this journal uses article numbers instead of page numbers. See further details here.