Oscillations in Multiparticle Production Processes †

1
Department of Fundamental Research, National Centre for Nuclear Research, 00-681 Warsaw, Poland
2
Institute of Physics, Jan Kochanowski University, 25-406 Kielce, Poland
*
Author to whom correspondence should be addressed.
†
This paper is an extended version of conference paper given at the SigmaPhi 2017, Corfu, Greece, 10–14 July 2017.
Entropy 2017, 19(12), 670; https://doi.org/10.3390/e19120670
Submission received: 22 November 2017
/
Revised: 30 November 2017
/
Accepted: 4 December 2017
/
Published: 6 December 2017
(This article belongs to the Special Issue New Trends in Statistical Physics of Complex Systems)
Abstract
:We discuss two examples of oscillations apparently hidden in some experimental results for high-energy multiparticle production processes: (i) the log-periodic oscillatory pattern decorating the power-like Tsallis distributions of transverse momenta; (ii) the oscillations of the modified combinants obtained from the measured multiplicity distributions. Our calculations are confronted with data from the Large Hadron Collider (LHC). We show that in both cases, these phenomena can provide new insight into the dynamics of these processes.
1. Introduction
In this work, we argue that closer scrutiny of the available experimental results from Large Hadron Collider (LHC) experiments can result in some new, so-far unnoticed (or underrated) features, which can provide new insight into the dynamics of the processes under consideration. More specifically, we shall concentrate on multiparticle production processes at high energies and on two examples of hidden oscillations apparently visible there: (i) the log-periodic oscillations in data on the large transverse momenta spectra, (presented in Section 2); (ii) the oscillations of some coefficients in the recurrence relation defining the multiplicity distributions, (presented in Section 3).
As will be seen, the first phenomenon is connected with the fact that large distributions follow a quasi power-like pattern, which is best described by the Tsallis distribution [1,2,3]:
This is a quasi power-law distribution with two parameters: power index n (connected with the nonextensivity parameter q) and scale parameter T (in many applications identified with temperature) [3]. In Figure 1, we present examples of applications of the nonextensive approach to multiparticle distributions represented by Equation (1). Figure 1a,b show the high-quality Tsallis fit as well as a kind of self-similarity of distributions of jets and hadrons [4]. Figure 1c demonstrates that the values of the nonextensivity parameters q for particles in jets correspond rather closely to values of q obtained from the inclusive distributions measured in collisions [4,5]. (This observation should be connected with the fact that multiplicity distributions, , are closely connected with the nonextensive approach, and that for negative binomial distributions (NBDs), Poisson distributions (PDs) and binomial distributions (BDs) [5]). In general, one observes the self-similar characteristics of the production process, in both cases originating from their cascading characteristic, which always results in a Tsallis distribution. (In fact, this is a very old idea, introduced by Hagedorn in [6,7], that the production of hadrons proceeds through the formation of fireballs, which produces a statistical equilibrium of an undetermined number of all kinds of fireballs, each of which in turn is considered to be a fireball. This idea returned recently in the form of thermofractals introduced in [8]. We note that the NBD discussed below also has a self-similar character [9]. We note also that the self-similarity and fractality features of the multiparticle production process were exhaustively discussed in [10,11].). In the pure dynamical QCD approach to hadronization, one could think of partons fragmenting into final-state hadrons through multiple sub-jet production [11].
2. Log-Periodic Oscillations in Data on Large Momenta Distributions
To start with the first example, we note that, despite the exceptional quality of the Tsallis fit presented in Figure 1a (in fact, only such a two-parameter quasi-power-like formula can fit the data over the whole range of ), the ratio (which is expected to be a flat function of , ) presented in Figure 2a shows clear log-periodic oscillatory behaviour as a function of the transverse momentum . In fact, it turns out that such behaviour occurs (at the same strength) in data from all LHC experiments, at all energies (provided that the range of the measured is large enough), and that its amplitude increases substantially for the nuclear collisions [21]. These observations strongly suggest that closer scrutiny should be undertaken to understand its possible physical origin.
We note that we have two parameters in the Tsallis formula (Equation (1)), n and T, and each of them (or both, but we do not consider such a situation) could be a priori responsible for the observed effect. We start with the power index n. In this case, the observed oscillations may be related to some scale invariance present in the system and are an immanent feature of any power-like distribution [23]. In [24], we showed that they also appear in quasi-power-like distributions of the Tsallis type. In general, they are attributed to a discrete scale invariance (connected with a possible fractal structure of the process under consideration) and are described by introducing a complex power index n (or q). This, in turn, has a number of interesting consequences [25,26,27], such as a complex heat capacity of the system or complex probability and complex multiplicative noise, all of these known already from other branches of physics. In short, one relies on the fact that power-like distributions, say , exhibit scale invariant behaviour, , where parameters and are, in general, related by the condition that , which means that the power index m can take complex values: . In the case of a Tsallis distribution, this means that Equation (1) is decorated by some oscillating factor , the form of which (when keeping only the and terms) is
As one can see in Figure 2, this perfectly fits the observed log-oscillatory pattern.
The second possibility is to keep n constant but allow the scale parameter T to vary with in such a way as to allow a fit to the data on [27]. The result is shown in Figure 2b. The resulting has the form of log-periodic oscillations in , which can be parameterized by
Such behaviour of can originate from the well-known stochastic equation for the temperature evolution, which in the Langevin formulation has the following form:
where is the relaxation time and is time-dependent white noise. Assuming additionally that we have time-dependent transverse momentum increasing in a way following the scenario of the preferential growth of networks [28],
where n is the power index and is some characteristic time-step, one may write
Equation (3) is obtained in two cases: (i) The noise term increases logarithmically with while the relaxation time remains constant:
(ii) The white noise is constant, , but the relaxation time becomes -dependent, for example,
In both cases is some new parameter [3,27]. (To fit data, one needs only a rather small admixture of the stochastic processes with noise depending on . The main contribution comes from the usual energy-independent Gaussian white noise. We note that whereas each of the proposed approaches is based on a different dynamical picture, they are numerically equivalent.).
However, we can use Equation (3) in a way that allows us to look deeper into our dynamical process. To this end, we calculate the Fourier transform of presented there:
One can see now how the temperature T (more exactly, its part that varies with r, ) changes with distance r from the collision axis (defined in the plane perpendicular to the collision axis and located at the collision point). The result of this operation is seen in Figure 2c as specific log-periodic oscillations in . Such behaviour can be studied by considering the flow of a compressible fluid in a cylindrical source. Assuming oscillations with small amplitude and velocity , and introducing the velocity potential f such that , one finds that f must satisfy the following cylindrical wave equation:
It can be shown that this represents a travelling sound wave with velocity in the direction of propagation. Because the oscillating part of the temperature, , is related to the velocity v, then
where is the coefficient of thermal expansion and denotes the specific heat at constant pressure [29]; in the case of a monochromatic wave where , we have that
with K being the wave number depending in general on r. For
the solution of Equation (12) takes the form of some log-periodic oscillation:
Because in our case , using Equation (11), we can write that
which is what we have used in describing the presented in panel (c) of Figure 2. The space picture of the collision (in the plane perpendicular to the collision axis and located at the collision point) that emerges is some regular logarithmic structure for small distances, which disappears when r reaches the dimension of the nucleon, that is, for r ∼ 1 fm. Whether it is connected with the parton structure of the nucleon remains for the moment an open question.
To end this section, we note that Equation (12) with given by Equation (13) is scale invariant and that . We note also that in the variable , Equation (12) is also self-similar because in this variable, it takes the form of the traveling wave equation:
which has the self-similar solution
for which (with or , where ). This is the self-similar solution of the second kind, usually encountered in the description of the intermediate asymptotic. Such asymptotics are observed in phenomena that do not depend on the initial conditions because sufficient time has already passed; nevertheless the system considered is still out of equilibrium [30].
3. Oscillations Hidden in the Multiplicity Distributions Data
Whereas the previous section is concerned with oscillations hidden in the distributions of produced particles in transverse momenta (which by using the Fourier transformation allows us to gain some insight into the space picture of the interaction process), in this section, we concentrate on another important characteristic of the multiparticle production process, namely, on the question of how many particles are produced and with what probability, that is, on the multiplicity distribution function , where N is the observed number of particles. This is usually one of the first observables measured in any multiparticle production experiment [11].
At first we note that any can be defined in terms of some recurrence relation, the most popular takes the following form:
Such a linear form of leads to a NBD, BD or PD:
Suitable modifications of result in more involved distributions (cf. [31] for references).
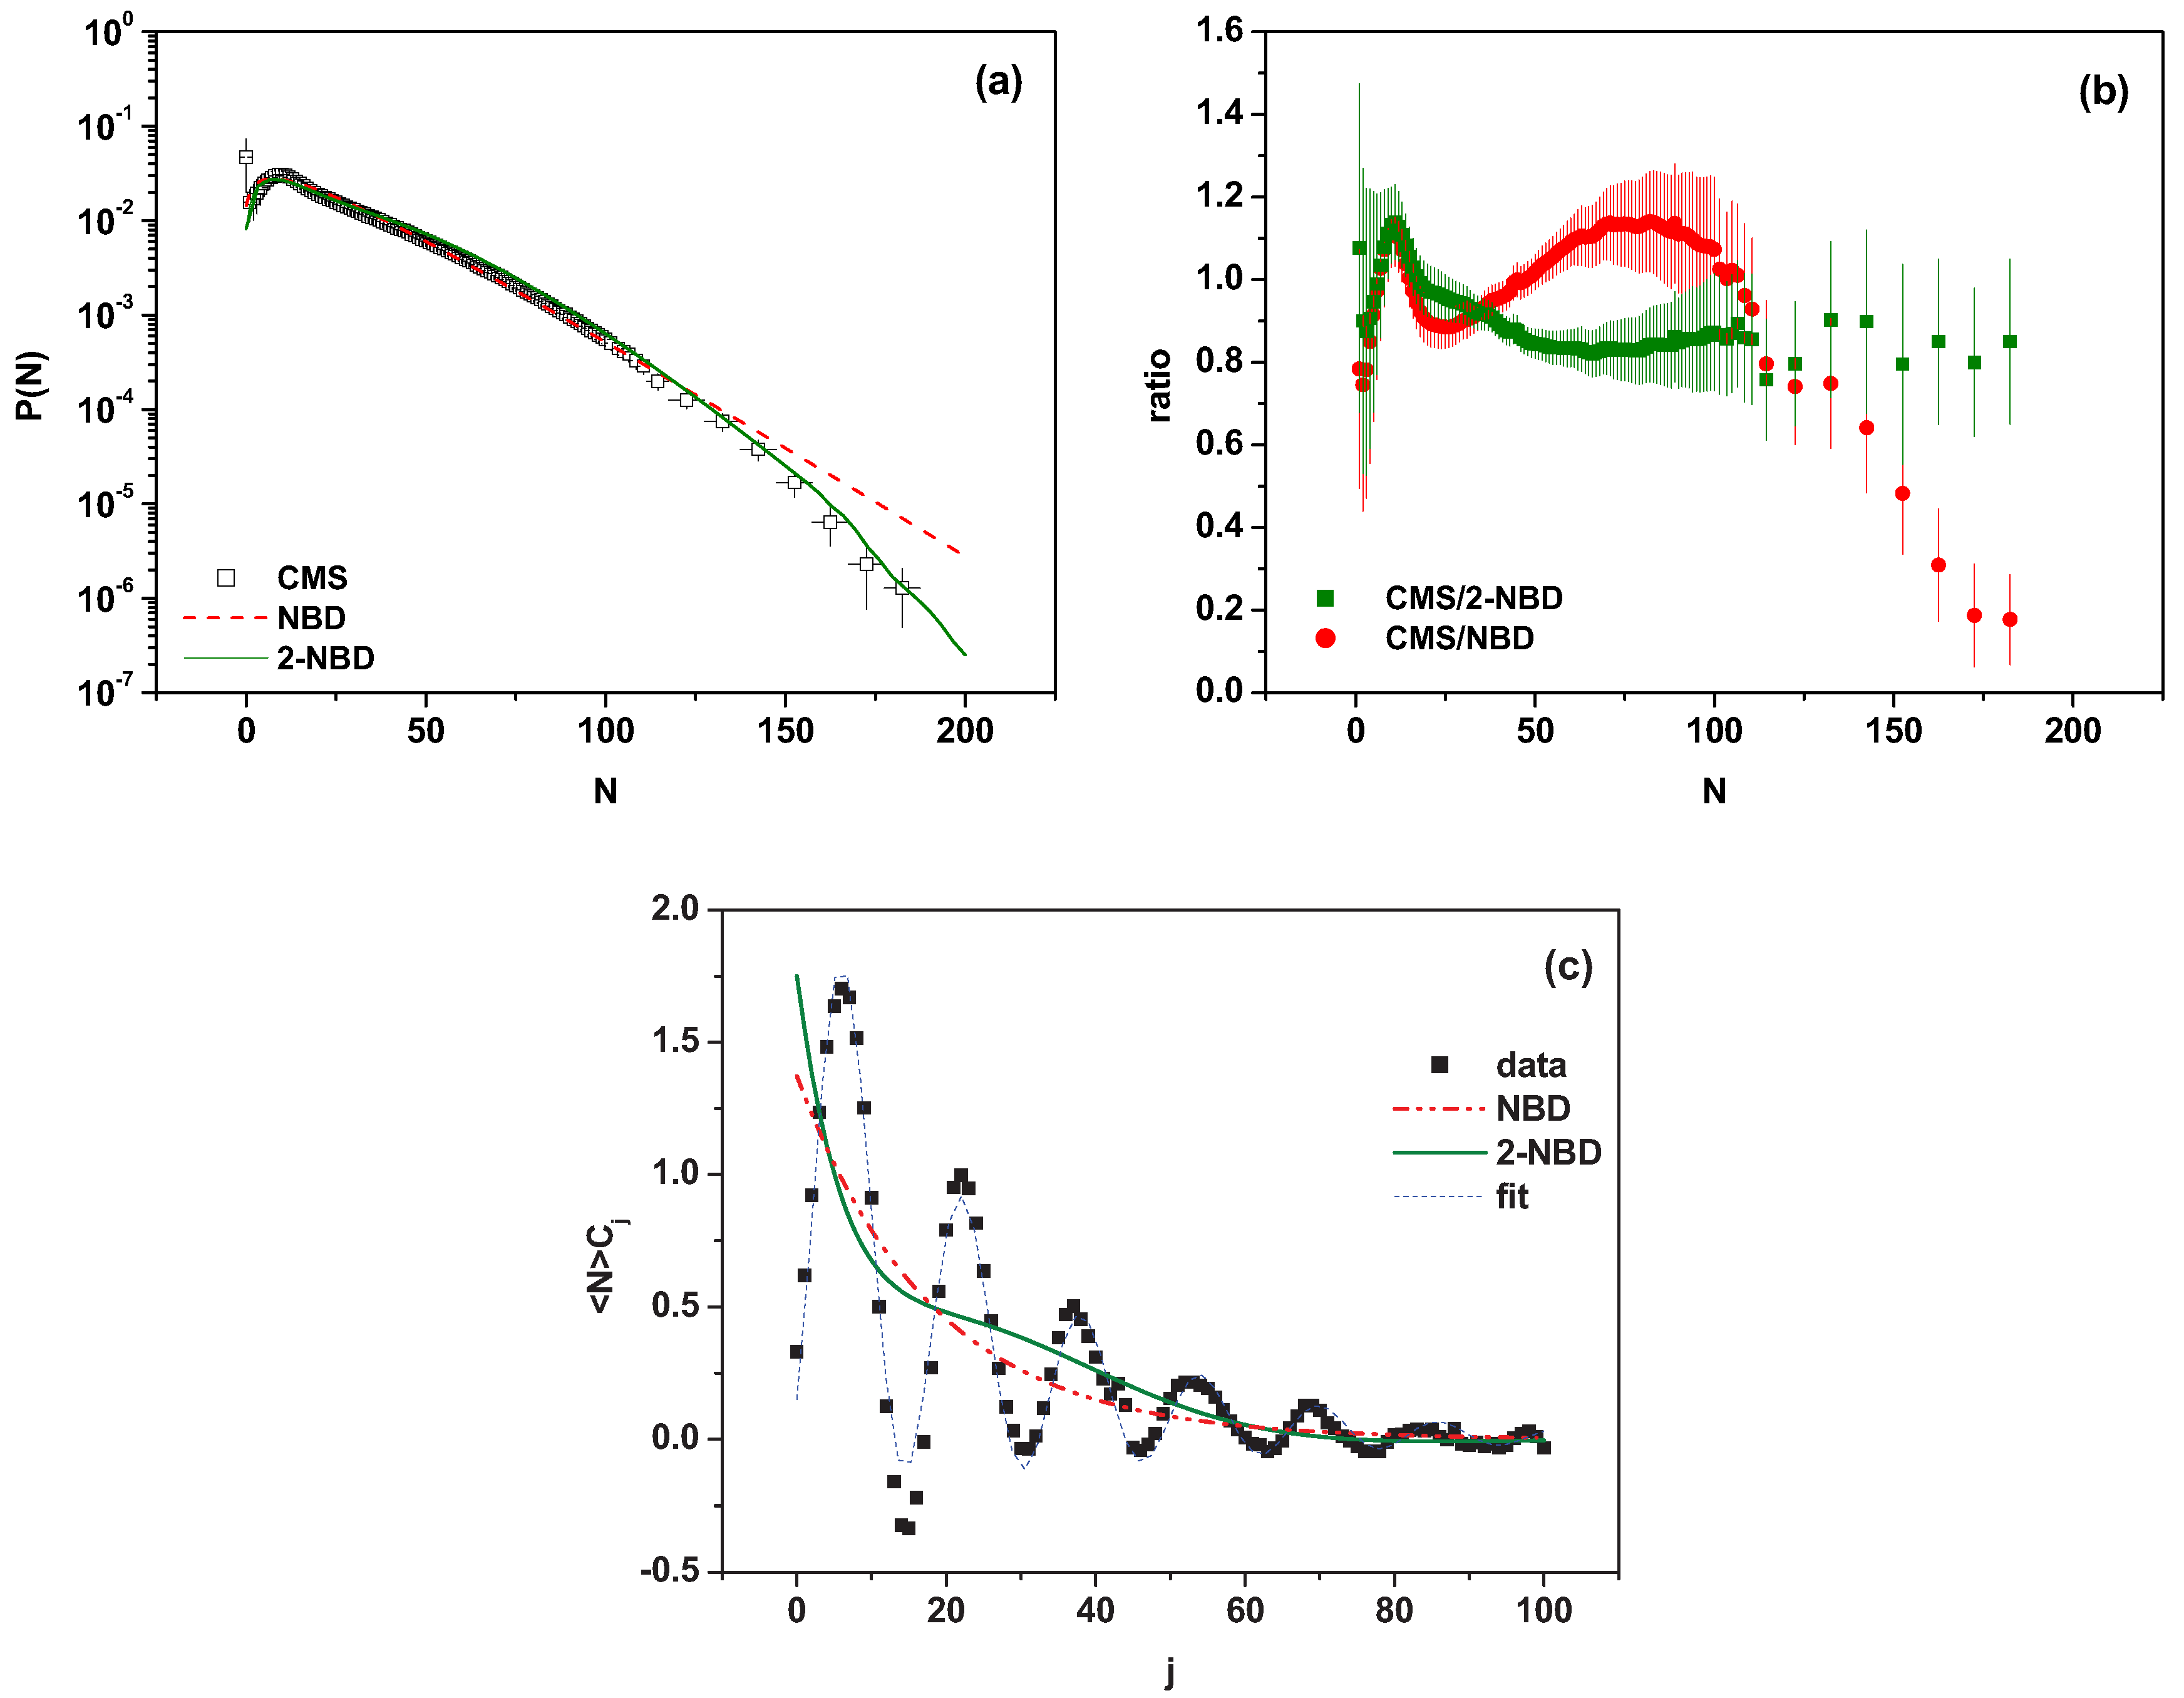
The most popular form of is the NBD type of distribution, Equation (19). However, with a growing energy and number of produced secondaries, the NBD starts to deviate from data for large N, and one has to use combinations of NBDs (two [32], three [33] and multicomponent NBDs [34] were proposed) or try to use some other form of [11,35,36]. For example, in Figure 3a, a single NBD is compared with a two-NBD. However, as shown there, the improvement, although substantial, is not completely adequate. It is best seen when looking at the ratio , which still shows some wiggly structure (albeit substantially weaker than in the case of using only a single NBD to fit the data). Taken seriously, this observation suggests that there is some additional information hidden in the . The question of how to retrieve this information was addressed in [31] by resorting to a more general form of Equation (18) usually used in counting statistics when dealing with cascade stochastic processes [37] in which all multiplicities are connected. In this case, one has coefficients defining the corresponding in the following way:
These coefficients contain the memory of particle about all previously produced particles. Assuming now that all are given by experiment, one can reverse Equation (22) and obtain a recurrence formula for the coefficients :
As can be seen in Figure 3c, the coefficients obtained from the data presented in Figure 3a show oscillatory behaviour (with period roughly equal to 16) gradually disappearing with N. They can be fitted by the following formula:
with parameters , , , and . Such oscillations do not appear in the single NBD fit presented in Figure 3a, and there is only a small trace of oscillations for the two-NBD fit presented in Figure 3a. This is because for a single NBD, one has a smooth exponential dependence of the corresponding on the rank j:
and one can expect any structure only for the multi-NBD cases [31].
Before proceeding further we note that the coefficients are closely related to the combinants , which were introduced in [40] (see also [11,41,42]) and are defined in terms of the generating function as
or by the following relation [31]:
From the above, one can deduce the following [31]:
This means that one can rewrite the recurrence relation, Equation (22), in terms of the combinants :
When compared with Equation (22), this allows us to express our coefficients , which henceforth we shall call modified combinants, by the generating function of :
This is the relation we use in the following when calculating the from distributions defined by some .
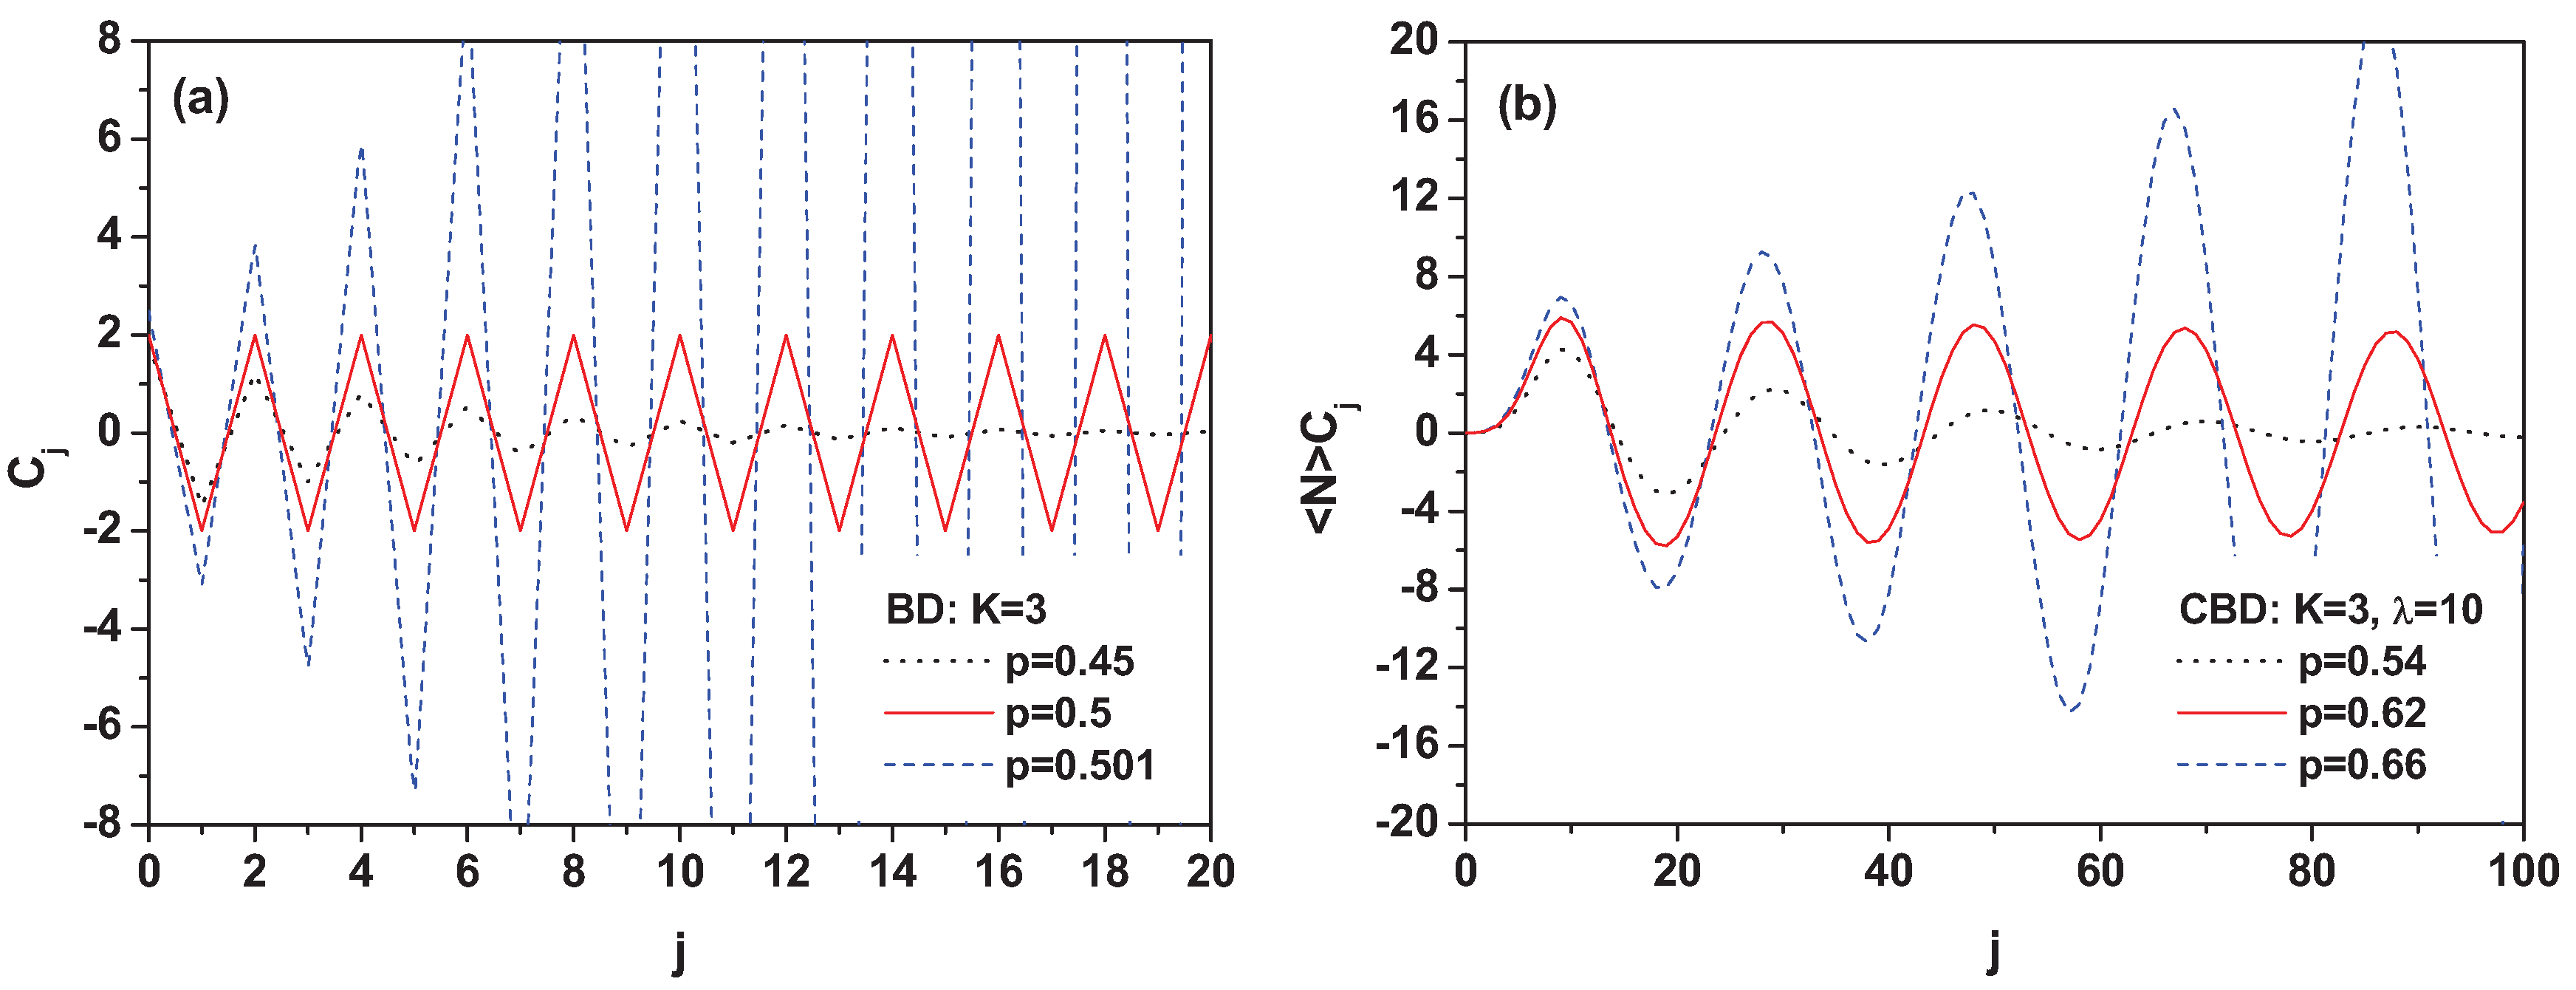
To continue our reasoning, we note first that whereas a single NBD does not lead to oscillatory behaviour of the modified combinants , there is a distribution for which the corresponding oscillate in a maximum way. This is the BD for which the modified combinants are given by the following formula:
which oscillates rapidly with a period equal to 2. In Figure 4a, one can see that the amplitude of these oscillations depends on p; generally the increase with rank j for and decrease for . However, their general shape lacks the fading-down feature of the observed experimentally. This suggests that the BD alone is not enough to explain the data but must be somehow combined with some other distribution. (In fact, in [43], we have already used a combination of elementary emitting cells (EECs) producing particles following a geometrical distribution (our aim at that time was to explain the phenomenon of Bose–Einstein correlations). For a constant number k of EECs, one obtains the NBD as the resultant , whereas for k distributed according to the BD, the resulting is a modified NBD. However, we could not find a set of parameters providing both the observed and oscillating . We note that originally, the NBD was seen as a compound PD, with the number of clusters given by a PD and the particle inside the clusters distributed according to a logarithmic distribution [44].).
We resort therefore to the idea of compound distributions (CDs) [45], which, from the point of view of the physics involved in our case, could for example describe a production process in which a number M of some objects (clusters, fireballs, etc.) are produced following, in general, some distribution (with generating function ), and subsequently decay independently into a number of secondaries, , always following some other (the same for all) distribution (with a generating function ). The distribution , where
is a CD of f and g: . For CDs, we have that
and its generating function is equal to
It should be mentioned that for the class of distributions of M that satisfy our recursion relation, Equation (18), the CD is given by Panjer’s recursion relation [46]:
with the initial value . However, the coefficients occurring here depend on N, contrary to our recursion given by Equation (22), for which the modified combinants, , are independent of N. Moreover, Equation (22) is not limited to the class of distributions satisfying Equation (18) but is valid for any distribution . For this reason, the recursion relation, Equation (35), is not suitable for us.
To visualize the CD in action, we take for f a BD with generating function , and for g we take a PD with generating function . The generating function of the resultant distribution is now equal to
and the corresponding modified combinants are
where
is the Stirling number of the second kind. Figure 4b shows the above modified combinants for the compound binomial distribution (CBD; a combination of a BD with a PD) with and calculated for three different values of p in the BD: . We note that in general, the period of the oscillations is equal to , that is, in Figure 4b, where it is equal 20. The multiplicity distribution in this case is
The proper normalization comes from the fact that . This shows that the choice of a BD as the basis of the CDs to be used seems to be crucial to obtain oscillatory (e.g., a CD formed from a NBD and some other NBD provides smooth ).
Unfortunately, such a single component CBD (depending on three parameters: p, K and ; does not describe the experimental . We return therefore to the idea of using a multicomponent version of the CBD, for example, a three-component CBD defined as follows (with being weights):
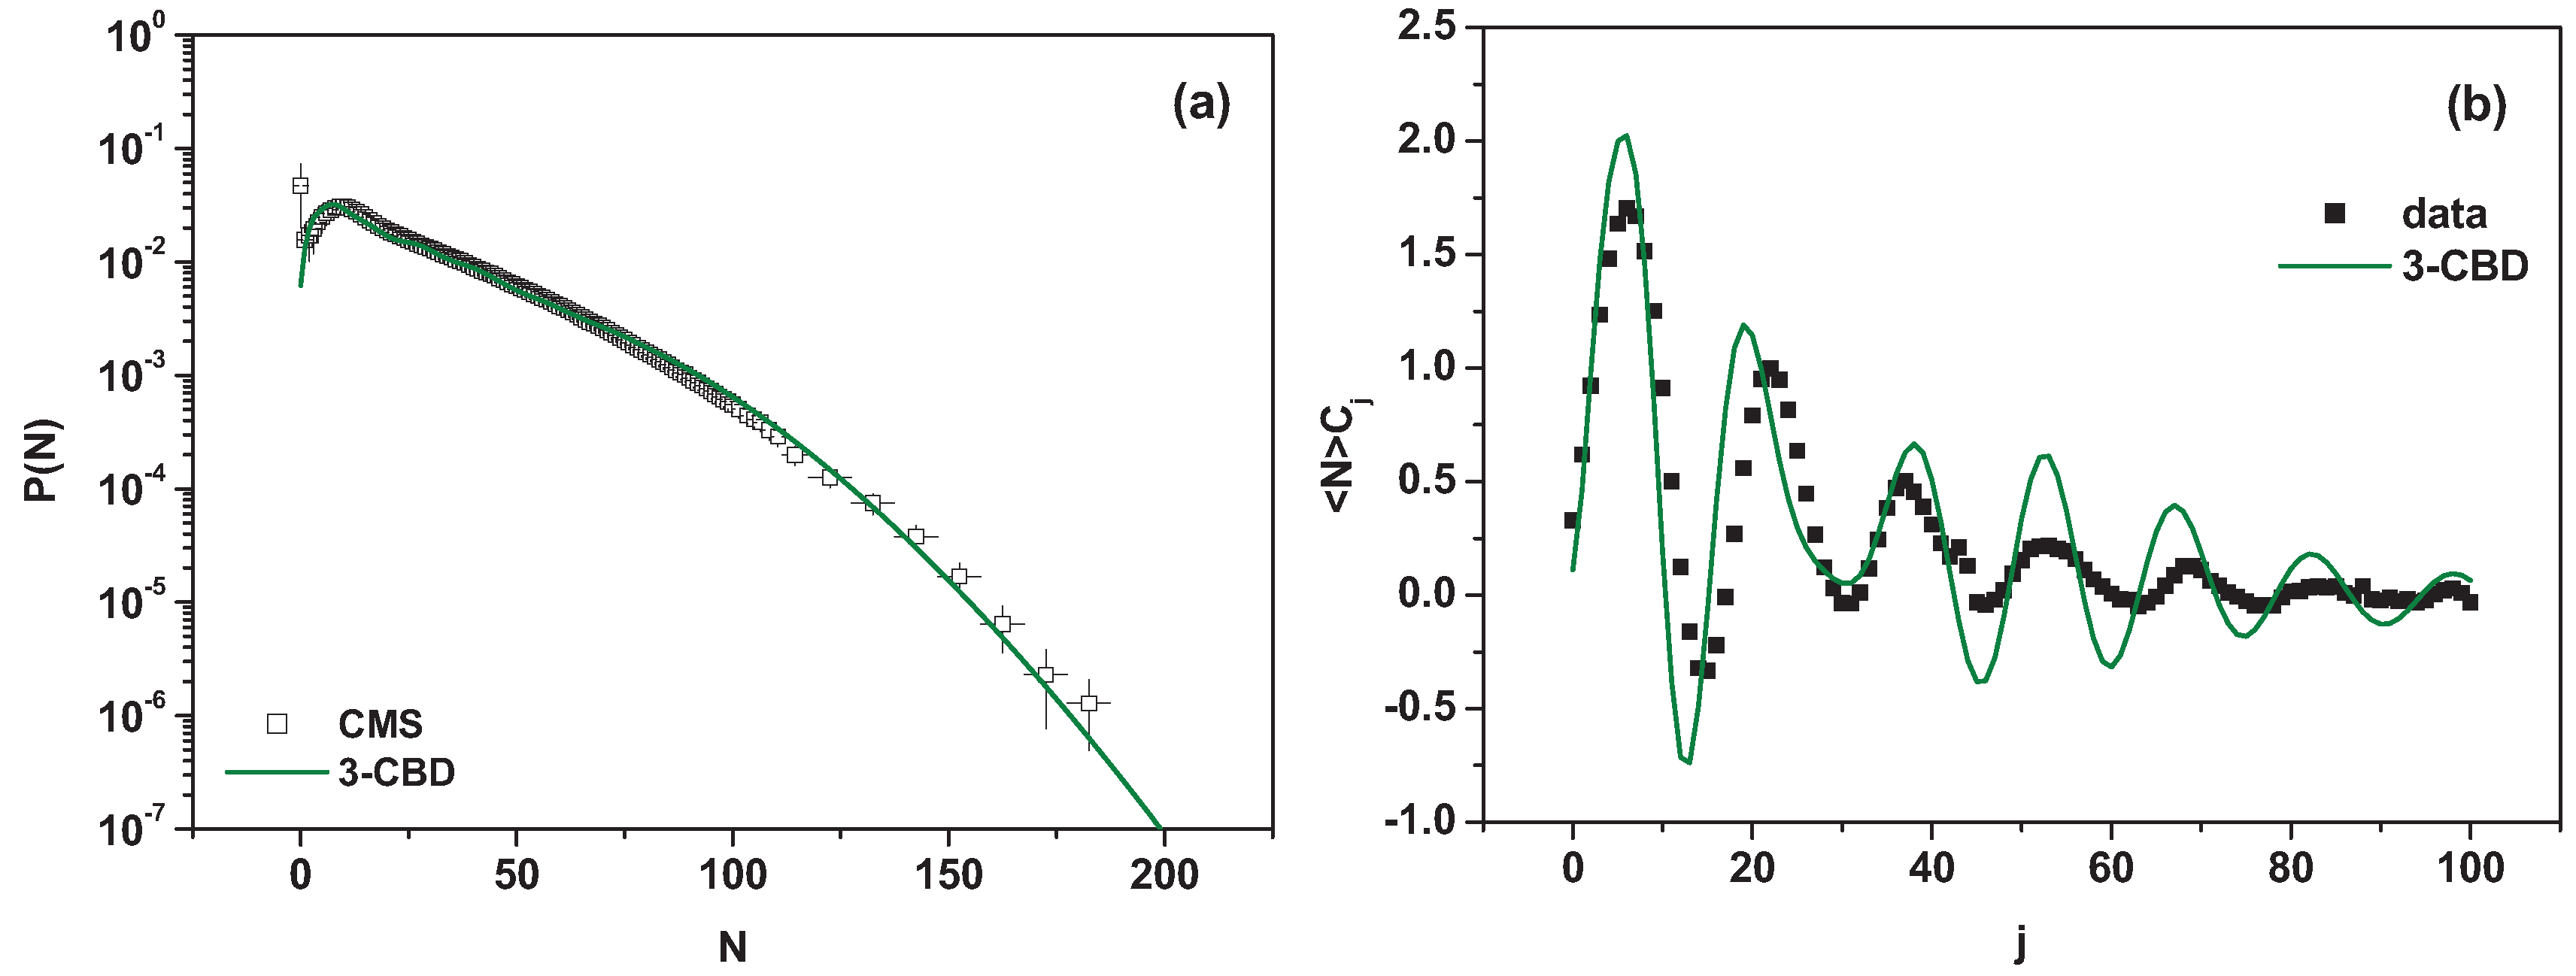
As can be seen in Figure 5, in this case, the fit to is quite good, and the modified combinants follow an oscillatory pattern as far as the period of the oscillations is concerned, albeit their amplitudes still decaying too slowly.
4. Summary
To summarize, we would like to mention that power law and quasi-power-law distributions are ubiquitous in many different, apparently very disparate, branches of science (such as, e.g., earthquakes, escape probabilities in chaotic maps close to crisis, biased diffusion of tracers in random systems, kinetic and dynamic processes in random quenched and fractal media, diffusion limited aggregates, growth models, or stock markets near financial crashes, to name only a few). Also ubiquitous is the fact that, in most cases, they are decorated with log-periodic oscillations of different kinds [23,24,26,27]. It is then natural to expect that oscillations of certain variables constitute a universal phenomenon, which should occur in a large class of stochastic processes, independently of the microscopic details. In this paper, we have concentrated on some specific oscillation phenomena seen at LHC energies in transverse momentum distributions. Their log-periodic characteristics suggest that either the exponent of the power-like behavior of these distributions is complex, or that there is a scale parameter that exhibits specific log-periodic oscillations. Whereas the most natural thing seems to be attributing the observed oscillations to some discrete scale invariance present in the system considered [23,24], it turns out that such scale-invariant functions also satisfy some specific wave equations showing a self-similarity property [21]. In both cases, these functions exhibit log-periodic behavior.
Concerning the second topic considered here, the presence of oscillations in counting statistics, one should realize that it is also a well-established phenomenon. The known examples include oscillations of the high-order cumulants of the probability distributions describing the transport through a double quantum dot, oscillations in quantum optics (in the photon distribution function in slightly squeezed states; see [47] for more information and references). In elementary particle physics, oscillations of the moments, which represent ratios of the cumulants to factorial moments, also have a long history [11,35,36].
Our expectation that the oscillations discussed here could also be observed (and successfully measured) in multiparticle production processes is new. To see these, one must first deduce from the experimental data on the multiplicity distribution the modified combinants (which are defined by the recurrence relation presented in Equation (22); we note that, contrary to the moments, the are independent of the multiplicity distribution for ). In the case for which these modified combinants show oscillatory behavior, they can be used to search for some underlying dynamical mechanism that could be responsible for it. The present situation is such that the measured multiplicity distributions (for which, as we claim in [31], the corresponding modified combinants oscillate), are most frequently described by NBDs (the modified combinants of which do not oscillate). Furthermore, with increasing collision energy and increasing multiplicity of produced secondaries, some systematic discrepancies between the data and the NBD form of the used to fit them become more and more apparent. We propose therefore to use a novel phenomenological approach to the observed multiplicity distributions on the basis of the modified combinants obtained from the measured multiplicity distributions. Together with the fitted multiplicity distributions , these would allow for a more detailed quantitative description of the complex structure of the multiparticle production process. We argue that the observed strong oscillations of the coefficients in the data at LHC energies indicate the compound characteristics of the measured distributions with a central role played by the BD, which provides the oscillatory characteristics of the . This must be supplemented by some other distribution in such a way that the CD fits both the observed and the deduced from it. However, at the moment, we are not able to obtain fits to both and of acceptable quality. Therefore, these oscillations still await their physical justification, that is, the identification of some physical process (or combination of such processes) that would result in such phenomena.
We close by noting that both phenomena discussed here describe, in fact, different dynamical aspects of the multiparticle production process at high energies. The quasi-power-like distributions and the related log-periodic oscillations are related with events with rather small multiplicities of secondaries with large and very large momenta; these are called hard collisions, and they essentially probe the collision dynamics towards the edge of the phase space. The multiparticle distributions collect instead all produced particles, the majority of which come from the soft collisions concentrated in the middle of the phase space. In this sense, both the phenomena discussed provide us with complementary new information on these processes and, because of this, they should be considered, as much as possible, jointly. (Because of some similarities observed between hadronic, nuclear and collisions [11,48,49] (see also Chapter 20 of [50]), one might expect that the phenomena discussed above will also appear in these reactions. However, this is a separate problem, too extensive and not yet sufficiently discussed to be presented here).
Acknowledgments
This research was supported in part (GW) by the National Science Center (NCN) under contract 2016/22/M/ST2/00176. We would like to warmly thank Nicholas Keeley for reading the manuscript.
Author Contributions
Both authors analyzed experimental data, described the observed oscillation and equally contributed to the work on the manuscript. All authors have read and approved the final manuscript.
Conflicts of Interest
The authors declare no conflict of interest.
References
- Tsallis, C. Possible generalization of Boltzman–Gibbs statistics. J. Stat. Phys. 1998, 52, 479–487. [Google Scholar] [CrossRef]
- Tsallis, C. Introduction to Nonextensive Statistical Mechanics; Springer: New York, NY, USA, 2009. [Google Scholar]
- Wilk, G.; Włodarczyk, Z. Quasi-power law ensembles. Acta Phys. Pol. B 2015, 46, 1103. [Google Scholar] [CrossRef]
- Wilk, G.; Włodarczyk, Z. Self-similarity in jet events following from pp collisions at LHC. Phys. Lett. B 2013, 727, 163–167. [Google Scholar] [CrossRef]
- Wilk, G.; Włodarczyk, Z. Power laws in elementary and heavy-ion collisions. Eur. Phys. J. A 2009, 40, 299–312. [Google Scholar] [CrossRef]
- Hagedorn, R.; Ranft, R. Statistical thermodynamics of strong interactions at high energies. II–Momentum spectra of particles produced in pp collisions. Suppl. Nuovo Cim. 1968, 6, 169–310. [Google Scholar]
- Hagedorn, R. Remarks of the thermodynamical model of strong interactions. Nucl. Phys. B 1970, 24, 93–139. [Google Scholar] [CrossRef]
- Deppman, A. Thermodynamics with fractal structure, tsallis statistics, and hadrons. Phys. Rev. D 2016, 93, 054001. [Google Scholar] [CrossRef]
- Calucci, G.; Treleani, D. Self-similarity of the negative binomial multiplicity distributions. Phys. Rev. D 1998, 57, 602–605. [Google Scholar] [CrossRef]
- De Wolf, E.A.; Dremin, I.M.; Kittel, W. Scaling laws for density correlations and fluctuations and fluctuations in multiparticle dynamics. Phys. Rep. 1996, 270, 1–141. [Google Scholar] [CrossRef]
- Kittel, W.; De Wolf, E.A. Soft Multihadron Dynamics; World Scientific: Singapore, 2005. [Google Scholar]
- Aad, G.; Abbott, B.; Abdallah, J.; Abdelalim, A.A.; Abdesselam, A.; Abdinov, O.; Abi, B.; Abolins, M.; Abramowicz, H.; Abreu, H.; et al. Charged-particle multiplicities in pp interactions measured with the ATLAS detector at the LHC. New J. Phys. 2011, 13, 053033. [Google Scholar] [CrossRef]
- Aad, G.; Abbott, B.; Abdallah, J.; Abdelalim, A.; Abdesselam, A.; Abdinov, O.; Abi, B.; Abolins, M.; Abramowicz, H.; Abreu, H.; et al. Properties of jets measured from tracks in proton-proton collisions at center-of-mass energy TeV with the ATLAS detector. Phys. Rev. D 2011, 84, 054001. [Google Scholar] [CrossRef]
- Khachatryan, V.; Sirunyan, A.M.; Tumasyan, A.; Adam, W.; Bergauer, T.; Dragicevic, M.; Ero, J.; Friedl, M.; Fruehwirth, R.; Ghete, V.M.; et al. Transverse-momentum and pseudorapidity distributions of charged hadrons in pp collisions at and 2.36 TeV. J. High Energy Phys. 2010, 2, 41. [Google Scholar] [CrossRef]
- Khachatryan, V.; Sirunyan, A.M.; Tumasyan, A.; Adam, W.; Bergauer, T.; Dragicevic, M.; Ero, J.; Fabjan, C.; Friedl, M.; Fruehwirth, R.; et al. Transverse-momentum and pseudorapidity distributions of charged hadrons in pp collisions at TeV. Phys. Rev. Lett. 2010, 105, 022002. [Google Scholar] [CrossRef] [PubMed]
- Wong, C.-T.; Wilk, G.; Cirto, L.J.L.; Tsallis, C. From QCD-based hard-scattering to nonextensive statistical mechanical descriptions of transverse momentum spectra in high-energy pp and collisions. Phys. Rev. D 2015, 91, 114027. [Google Scholar] [CrossRef]
- Aad, G.; Brad, A.; Jalal, A.; Ahmed, A.; Abdelouahab, A.; Ovsat, A.; Babak, A.; Maris, A.; Halina, A.; Henso, A.; et al. Measurement of the jet fragmentation function and transverse profile in proton-proton collisions at a center-of-mass energy of 7 TeV with the ATLAS detector. Eur. Phys. J. C 2011, 71, 1795. [Google Scholar] [CrossRef]
- Wróblewski, A. Multiplicity distributions in proton-proton collisions. Acta Phys. Pol. B 1973, 4, 857–884. [Google Scholar]
- Geich-Gimbel, C. Particle production at collider energies. Int. J. Mod. Phys. A 1989, 4, 1527–1680. [Google Scholar] [CrossRef]
- Aad, G.; Abbott, B.; Abdallah, J.; Abdinov, O.; Abeloos, B.; Aben, R.; Abolins, M.; AbouZeid, O.S.; Abraham, N.L.; Abramowicz, H.; et al. Measurement of the charged particle multiplicity inside jets from TeV pp collisions with the ATLAS detector. Eur. Phys. J. C 2016, 76, 322. [Google Scholar] [CrossRef] [PubMed]
- Wilk, G.; Włodarczyk, Z. Temperature oscillations and sound waves in hadronic matter. Phys. A 2017, 486, 579–586. [Google Scholar] [CrossRef]
- Chatrchyan, S.; Khachatryan, V.; Sirunyan, A.M.; Tumasyan, A.; Adam, W.; Bergauer, T.; Dragicevic, M.; Ero, J.; Fabjan, C.; Friedl, M.; et al. Charged particle transverse momentum spectra in pp collisions at and 7 TeV. J. High Energy Phys. 2011, 8, 86. [Google Scholar] [CrossRef]
- Sornette, D. Discrete-scale invariance and complex dimensions. Phys. Rep. 1998, 297, 239–270. [Google Scholar] [CrossRef]
- Wilk, G.; Włodarczyk, Z. Tsallis distribution with complex nonextensivity parameter q. Phys. A 2014, 413, 53–58. [Google Scholar] [CrossRef]
- Rybczyński, M.; Wilk, G.; Włodarczyk, Z. System size dependence of the log-periodic oscillations of transverse momentum spectra. EPJ Web Conf. 2015, 90, 01002. [Google Scholar] [CrossRef]
- Wilk, G.; Włodarczyk, Z. Tsallis distribution decorated with log-periodic oscillation. Entropy 2015, 17, 384–400. [Google Scholar] [CrossRef]
- Wilk, G.; Włodarczyk, Z. Quasi-power laws in multiparticle production processes. Chaos Solitons Fractals 2015, 81, 487–496. [Google Scholar] [CrossRef]
- Wilk, G.; Włodarczyk, Z. Nonextensive information entropy for stochastic networks. Acta Phys. Pol. B 2004, 35, 871–879. [Google Scholar]
- Landau, L.D.; Lifshitz, E.M. Fluid Mechanics; Pergamon Press: Oxford, UK, 1987. [Google Scholar]
- Barenblatt, G.I. Scaling, Self-Similarity, and Intermediate Asymptotics; Cambridge University Press: Cambridge, UK, 1996. [Google Scholar]
- Wilk, G.; Włodarczyk, Z. How to retrieve additional information from the multiplicity distributions. J. Phys. G 2017, 44, 015002. [Google Scholar] [CrossRef]
- Giovannini, A.; Ugocciono, R. Signals of new physics in global event properties in pp collisions in the TeV energy domain. Phys. Rev. D 2003, 68, 034009. [Google Scholar] [CrossRef]
- Zborovsky, I.J. A three-component description of multiplicity distributions in pp collisions at the LHC. J. Phys. G 2013, 40, 055005. [Google Scholar] [CrossRef]
- Dremin, I.M.; Nechitailo, V.A. Independent pair parton interactions model of hadron interactions. Phys. Rev. D 2004, 70, 034005. [Google Scholar] [CrossRef]
- Dremin, I.M.; Gary, J.W. Hadron multiplicities. Phys. Rep. 2001, 349, 301–393. [Google Scholar] [CrossRef]
- Grosse-Oetringhaus, J.F.; Teygers, K. Charged-particle multiplicity in proton–proton collisions. J. Phys. G 2010, 37, 083001. [Google Scholar] [CrossRef]
- Saleh, B.E.A.; Teich, M.K. Multiplied-Poisson Noise in Pulse, Particle, and Photon Detection. Proc. IEEE 1982, 70, 229–245. [Google Scholar] [CrossRef]
- Khachatryan, V.; Sirunyan, A.M.; Tumasyan, A.; Adam, W.; Bergauer, T.; Dragicevic, M.; Ero, J.; Fabjan, C.; Friedl, M.; Fruehwirth, R.; et al. Charged particle multiplicities in pp interactions at , 2.36, and 7 TeV. J. High Energy Phys. 2011, 2011, 79. [Google Scholar] [CrossRef]
- Ghosh, P. Negative binomial multiplicity distribution in proton-proton collisions in limited pseudorapidity intervals at LHC up to TeV and the clan model. Phys. Rev. D 2012, 85, 054017. [Google Scholar] [CrossRef]
- Kauffmann, S.K.; Gyulassy, M. Multiplicity distributions of created bosons: The method of combinants. J. Phys. A 1978, 11, 1715–1727. [Google Scholar] [CrossRef]
- Balantekin, A.B.; Seger, J.E. Description of pion multiplicities using combinants. Phys. Lett. B 1991, 266, 231–235. [Google Scholar] [CrossRef]
- Hegyi, S. Correlation studies in quark jets using combinants. Phys. Lett. B 1999, 463, 126–131. [Google Scholar] [CrossRef]
- Biyajima, M.; Suzuki, N.; Wilk, G.; Włodarczyk, Z. Totally chaotic poissonian-like sources in multiparticle production processes? Phys. Lett. B 1996, 386, 297–303. [Google Scholar] [CrossRef]
- Giovannini, A.; Van Hove, L. Negative binomial multiplicity distributions in high energy hadron collisions. Z. Phys. C 1986, 30, 391–400. [Google Scholar] [CrossRef]
- Sundt, B.; Vernic, R. Recursions for Convolutions and Compound Distributions with Insurance Applications; Springer: Berlin/Heidelberg, Germany, 2009. [Google Scholar]
- Panjer, H.H. Recursive evaluation of a family of compound distributions. ASTIN Bull. 1981, 12, 22–26. [Google Scholar] [CrossRef]
- Flindt, C.; Fricke, C.; Hohls, F.; Novotny, T.; Netocny, K.; Brandes, T.; Haug, R.J. Universal oscillations in counting statistics. Proc. Natl. Acad. Sci. USA 2009, 106, 10116–10119. [Google Scholar] [CrossRef] [PubMed]
- Sarkisyan, E.K.; Mishra, A.N.; Sahoo, R.; Alexander, S.; Sakharov, A.S. Multihadron production dynamics exploring the energy balance in hadronic and nuclear collisions. Phys. Rev. D 2016, 93, 054046. [Google Scholar] [CrossRef]
- Bzdak, A. Universality of multiplicity distribution in proton-proton and electron-positron collisions. Phys. Rev. D 2017, 96, 036007. [Google Scholar] [CrossRef]
- Patrignani, C.; Agashe, K.; Aielli, G.; Amsler, C.; Antonelli, M.; Asner, D.M.; Baer, H.; Banerjee, S.; Barnett, R.M.; Basaglia, T.; et al. Review of particle physics. Chin. Phys. C 2016, 40, 100001. [Google Scholar] [CrossRef]
Figure 1.
(a) Transverse momentum spectra for jets (open symbols) compared with spectra for hadrons (full symbols) from proton–proton collisions at TeV (with arbitrary normalization at GeV; data are from [12,13,14,15]). The dashed line shows the fit using Equation (1). (b) The power index n extracted from fits to the jet spectra shown in (a) (full symbols) compared with n from distributions of charged particles (open symbols, data are from [14,15,16]. (c) Compilation of values of the parameters q obtained from the spectra (triangles) and from the multiplicity distributions (circles). Triangles at small are obtained from [12,13]; those for larger are from [17]. Full squares and circles are from data on multiparticle production in collisions: squares (inelastic data) are from the compilation for beam energy 3.7−303 GeV presented in [18], full circles (non-single diffractive data) are from the compilation in [19], and open-red circ les are from [20].
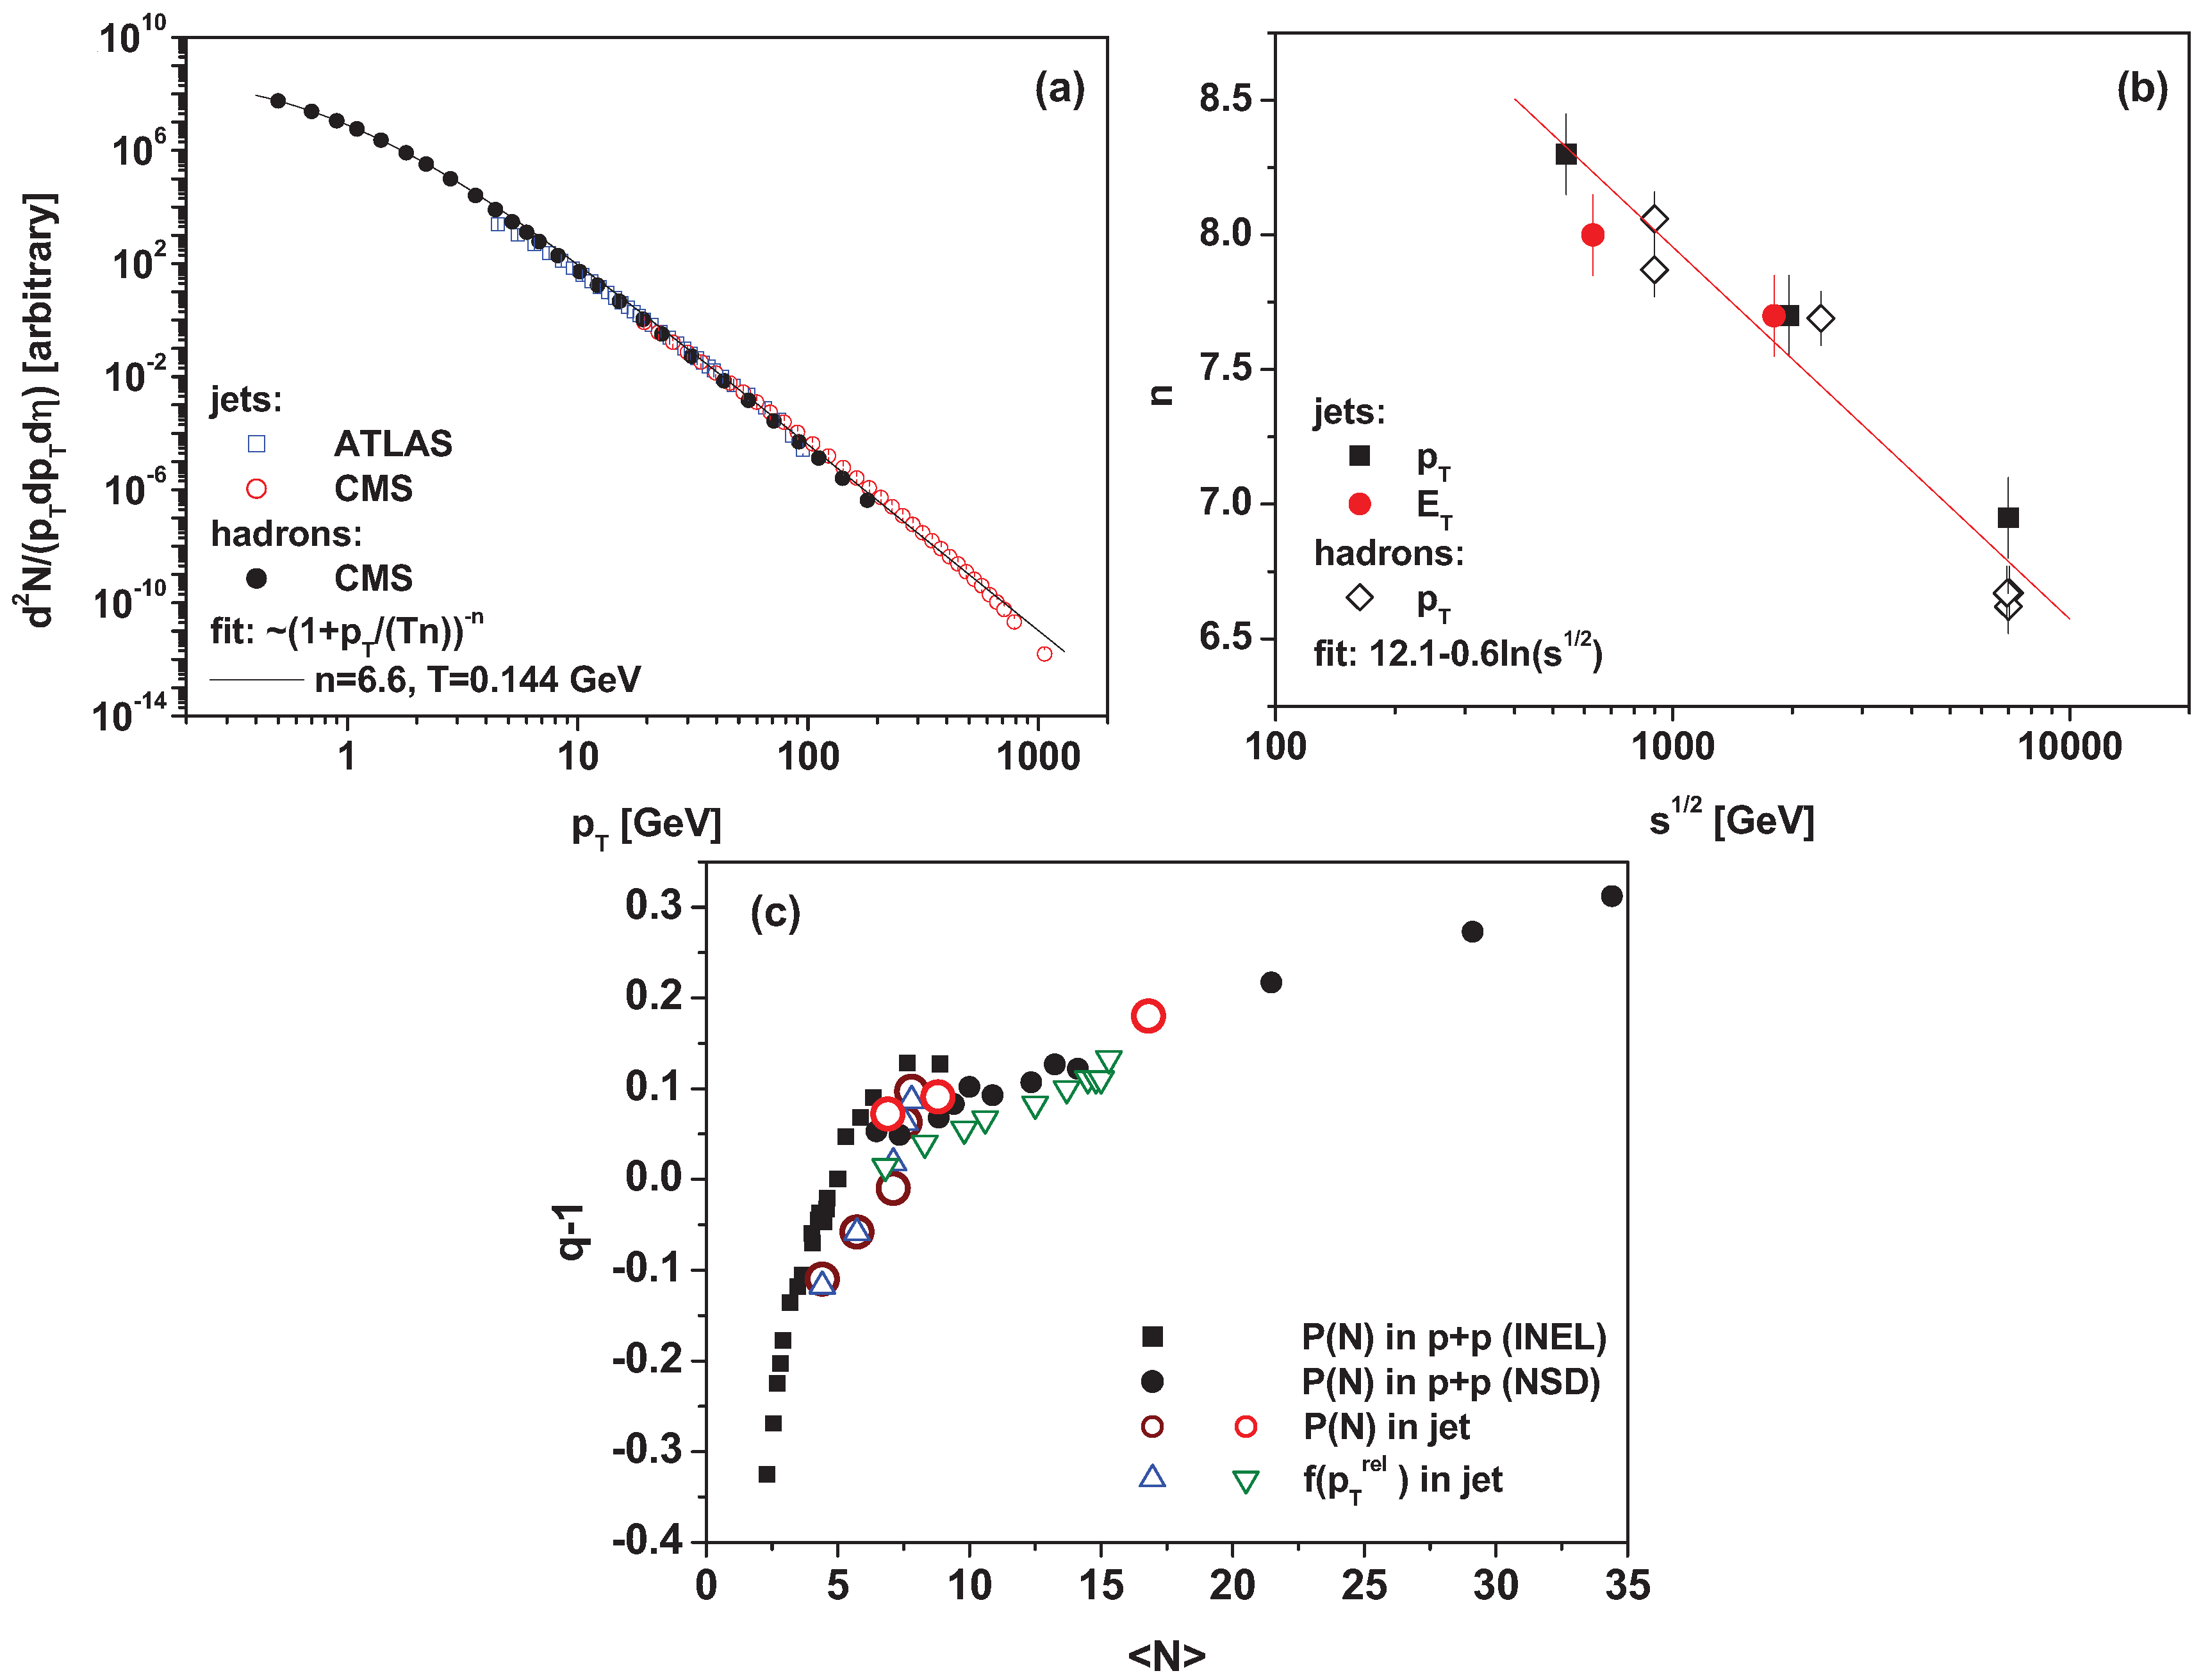
Figure 2.
(a) The ratio for collisions at TeV from the CMS [14,15,22] and ATLAS [12] experiments fitted by Equation (2) with parameters , , , and . (b) The log-periodic oscillations of fitting from panel (a) for collisions at and 7 TeV from the CMS experiment [14,15,22]. These can be fitted by Equation (3) with parameters , , , , and for TeV and , , , , and for 7 TeV. (c) The results of the Fourier transform of from Figure 2b. The continuous line represents versus r, and the dashed line denotes the function fitted for small values of r.
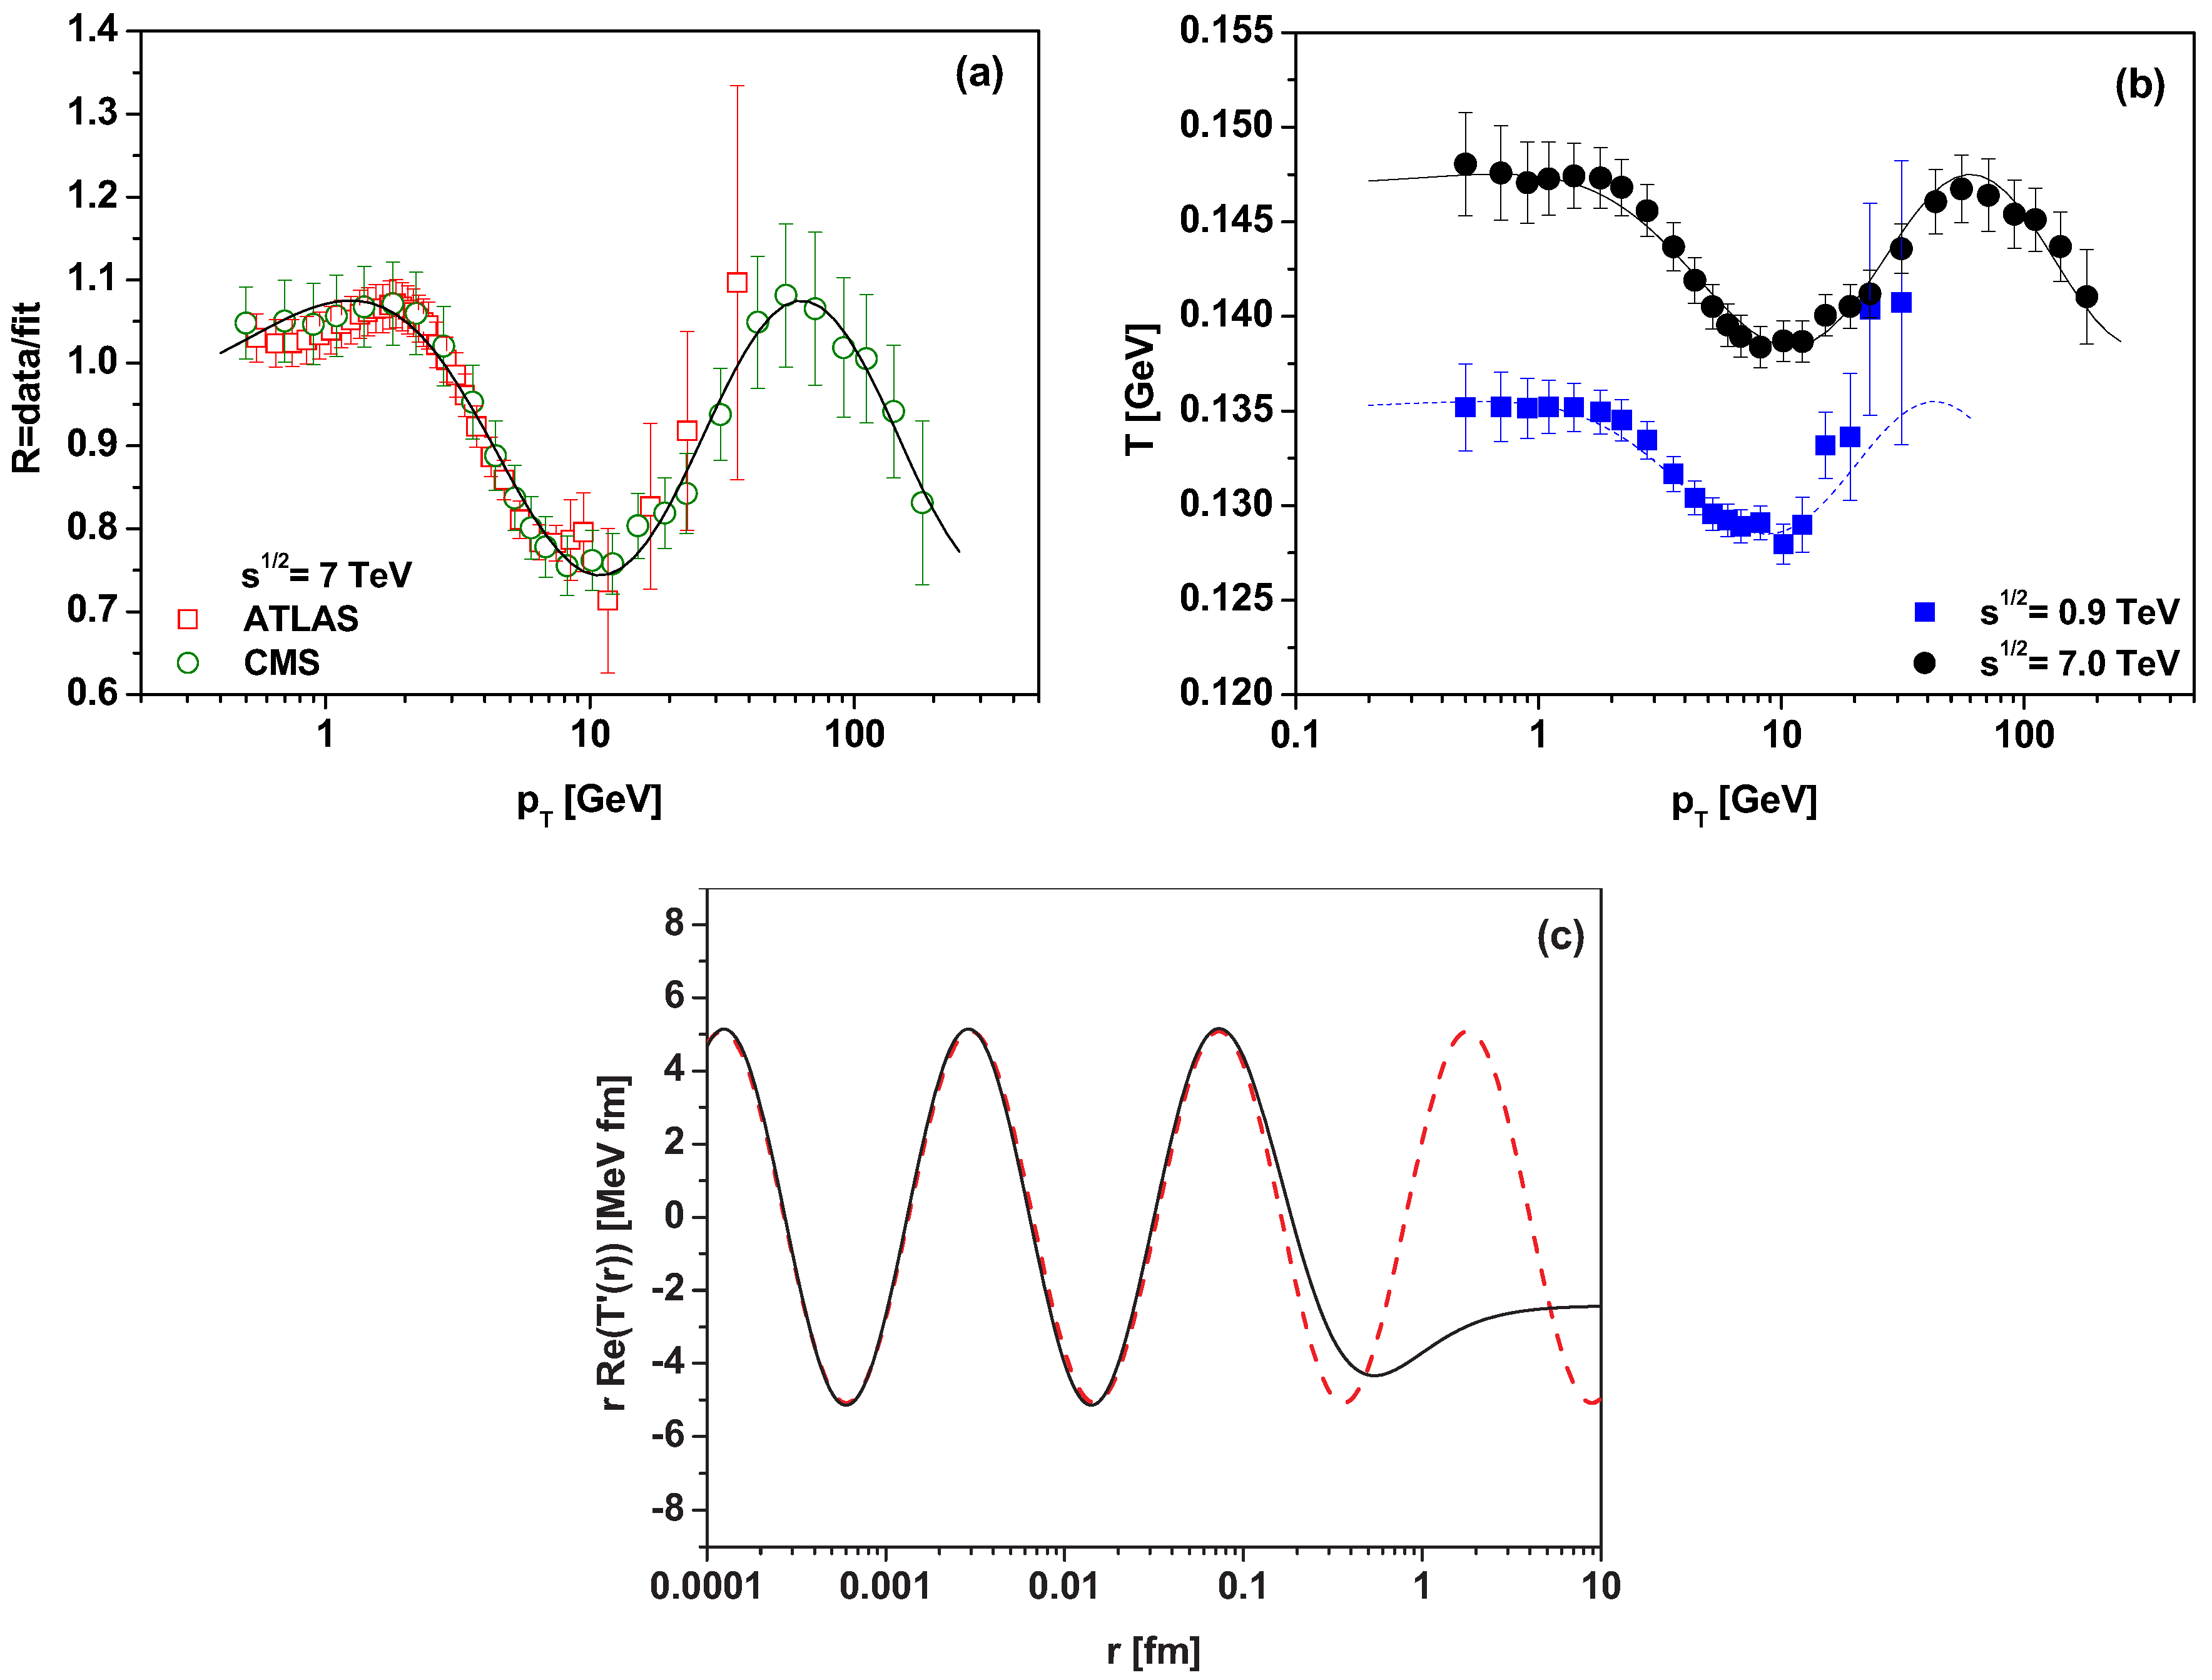
Figure 3.
(a) Charged hadron multiplicity distributions for the pseudorapidity range at TeV, as given by the CMS experiment [38] (points), compared with the negative binomial distribution (NBD) for parameters and (dashed line) and with the two-component NBD (solid line) with parameters from [39]. (b) Multiplicity dependence of the ratio for the NBD (red circles) and for the two-component NBD for the same data as in panel (a) (green squares). (c) Coefficients emerging from the data and NBD fits presented in panel (a). The data points are fitted by Equation (24); see text for details.

Figure 4.
Examples of for binomial distributions (a), and compound binomial distributions (b) from Equation (37).
Figure 4.
Examples of for binomial distributions (a), and compound binomial distributions (b) from Equation (37).

Figure 5.
Results of using the compound binomial distribution (CBD) approach given by Equation (41) with parameters , , ; , , and ; , , and ; and , , and . (a) Charged hadron multiplicity distributions for at TeV, as given by the CMS experiment [38] (points), compared with a three-component CBD (3-CBD; Equation (41)). (b) Coefficients emerging from the CMS data used in panel (a) compared with the corresponding obtained from the 3-CBD.
© 2017 by the authors. Licensee MDPI, Basel, Switzerland. This article is an open access article distributed under the terms and conditions of the Creative Commons Attribution (CC BY) license (http://creativecommons.org/licenses/by/4.0/).
Share and Cite
MDPI and ACS Style
Wilk, G.; Włodarczyk, Z. Oscillations in Multiparticle Production Processes. Entropy 2017, 19, 670. https://doi.org/10.3390/e19120670
AMA Style
Wilk G, Włodarczyk Z. Oscillations in Multiparticle Production Processes. Entropy. 2017; 19(12):670. https://doi.org/10.3390/e19120670
Chicago/Turabian StyleWilk, Grzegorz, and Zbigniew Włodarczyk. 2017. "Oscillations in Multiparticle Production Processes" Entropy 19, no. 12: 670. https://doi.org/10.3390/e19120670
Note that from the first issue of 2016, this journal uses article numbers instead of page numbers. See further details here.