Spatial Optimization of Agricultural Land Use Based on Cross-Entropy Method


1
College of Water Resources and Architectural Engineering, Northwest A & F University, Yangling 712100, China
2
Department of Biological & Agricultural Engineering and Zachry Department of Civil Engineering, Texas A & M University, College Station, TX 77843-2117, USA
3
Department of Water Resources Management and Agricultural-Meteorology, Federal University of Agriculture, PMB 2240 Abeokuta, Nigeria
*
Author to whom correspondence should be addressed.
Entropy 2017, 19(11), 592; https://doi.org/10.3390/e19110592
Submission received: 4 September 2017
/
Revised: 26 October 2017
/
Accepted: 2 November 2017
/
Published: 7 November 2017
(This article belongs to the Special Issue Entropy Applications in Environmental and Water Engineering)
Abstract
:An integrated optimization model was developed for the spatial distribution of agricultural crops in order to efficiently utilize agricultural water and land resources simultaneously. The model is based on the spatial distribution of crop suitability, spatial distribution of population density, and agricultural land use data. Multi-source remote sensing data are combined with constraints of optimal crop area, which are obtained from agricultural cropping pattern optimization model. Using the middle reaches of the Heihe River basin as an example, the spatial distribution of maize and wheat were optimized by minimizing cross-entropy between crop distribution probabilities and desired but unknown distribution probabilities. Results showed that the area of maize should increase and the area of wheat should decrease in the study area compared with the situation in 2013. The comprehensive suitable area distribution of maize is approximately in accordance with the distribution in the present situation; however, the comprehensive suitable area distribution of wheat is not consistent with the distribution in the present situation. Through optimization, the high proportion of maize and wheat area was more concentrated than before. The maize area with more than 80% allocation concentrates on the south of the study area, and the wheat area with more than 30% allocation concentrates on the central part of the study area. The outcome of this study provides a scientific basis for farmers to select crops that are suitable in a particular area.
1. Introduction
Scarcity of agricultural water and land resources is becoming severe due to the growing population and continued economic development, and has become a critical issue in formulating sustainable developmental policies [1,2,3]. Therefore, appropriate and efficient allocation of agricultural water and land resources has become necessary in regional agricultural sustainable development [4]. Agricultural land use allocation is the core issue of agricultural land and water resource allocation optimization [5,6]. Not only can it guide decision makers in assessing land demand for different crop types, but it can also identify the optimum land spatial unit with characteristics that are related to their geographical locations for each crop type [7,8,9], as well as simultaneously seeking the best land use layout [10,11].
The process of agricultural land-use allocation would be undertaken in three main stages: (i) demand assessment; (ii) agricultural land suitability evaluation; and (iii) spatial distribution of crop types [7].
To assess the agricultural land suitability of crops, the required environmental and socio-economic conditions are considered [12]. The Food and Agricultural Organization (FAO) developed crop-specific maps of crop suitability classes using the spatial data on soil, topography, features, and crop characteristics [13]. Many studies have developed methods for land suitability allocation based on the FAO framework. In these methods, input attributes and suitability indices were classified into different classes, and weights were assigned to the attributes, depending on their relative importance [5,14,15,16,17]. However, the main shortcoming of FAO-based methods is that their crop suitability data are usually available at a 5 min (approximately 9 km × 9 km at the equator) grid and such resolution is too coarse to satisfy the research demand at the irrigation district scale. Furthermore, when evaluating land suitability, very few studies have taken into account the actual distribution of various crops. For example, You and Wood [18] improved the pre-allocation by providing the existing crop distribution maps. To a significant extent, land suitability are determined by biophysical and soil conditions, such as organic matter, total nitrogen, total phosphorus. When the observed data of these attributes cannot be completely covered on the entire region, the actual distribution of crops can provide the supplement of crop distribution information. Using the research findings of Peng [19], an integrated model combined with multi-source remote sensing data was developed to generate maps of spatial distribution with 1 km × 1 km resolution suitable for crop planting.
The main objective of agricultural land use allocation is the spatial allocation of crop types to different spatial units having characteristics related to their geographical locations, for the purpose of seeking the best land use layout [11]. There is extensive literature on various methods of optimization for agricultural cropping patterns, such as linear programming [20], non-linear programming [21], multi-objective programming [22], fuzzy programming [23,24], and stochastic optimization [25]. However, these methods have ignored the effective unification of quantity and space, and have merely focused on the quantity optimization. In other words, these models can provide an optimal cropping pattern but cannot analyze the optimal spatial distribution of crops, which has an important guiding significance in actual production work.
Since numerous variables are involved in spatial optimization, conventional mathematical models are deemed unfit to determine the optimal solution within an acceptable timeframe [12]. Various heuristic algorithms for land-use spatial optimization have also been developed, including particle swarm algorithms [26,27], colony algorithms [28], and genetic algorithms [11,29]. Although these algorithms have a significant global optimization capability, they involve complex patch coding, resulting in programming difficulties. Other methods adopted cellular automation models, based on land-use conversion rules for local areas, to generate land-use patterns under different conditions using a bottom-up approach [12,29,30]. However, cellular automaton is restricted by neighborhood rules, and cannot search across space. In this study, spatial crop optimization is defined in the framework of minimum cross entropy. The principle of minimum cross-entropy (POMCE) was formulated by Kullback and Leibler [31] and is detailed by Kullback [32]. The cross entropy can measure the variation between different information contents, which seems an ideal approach to resolve the spatial allocation problem [33]. However, the cross entropy method has usually been applied in determining spatial-temporal changes of land use and applied a meso-scale model for the spatial disaggregation of crop production [34,35,36], but has rarely been coupled with spatial optimization modeling [18]. For example, You and Wood [37] described an entropy-based approach to conduct a spatially disaggregated assessment of the distribution of crop production. Considering the difficulty in coupling spatial variables with non-spatial variables, a loosely coupled model, based on minimum cross entropy and nonlinear optimization, is constructed in this study. The crop spatial allocation can be performed by determining the minimum cross entropy between the prior distribution and the desired distribution. The prior distribution produces crop-related and environment-related information obtained from integrated multi-source analysis in agricultural land suitability.
This study develops an integrated optimization model for the spatial distribution of agricultural cropping. The model is based on the spatial distribution of crop suitability, spatial distribution of population density, and agricultural land use data. It combines multi-source remote sensing data with constraints of optimal crop areas, which are obtained from an agricultural cropping pattern optimization model. Minimization of cross-entropy is applied to build the model. The model determines the suitable planting region for a specified crop well.
2. Materials and Methods
2.1. Study Area
The study area is the middle reaches of the Heihe River basin (98°30′–101° E, 38°30′–40° N), lying in an arid region of Gansu Provence, northwest of China, and covers an area of 11,427 km2. The Heihe River basin is the second largest inland river basin in China. In this region, crop production mainly depends on agricultural irrigation, because the mean annual precipitation and evaporation are about 117 mm and 1065 mm, respectively. Water consumption from agricultural irrigation accounts for approximately 90% of the total water consumption in this region [38]. Therefore, the optimal distribution of limited irrigation water and land resources is a key factor for agricultural development and sustainability [4,39]. The study area presents a higher terrain in the southeast and low in the northwest, and the elevation is between 1235 m and 3634 m. there is heterogeneity of biophysical and soil condition in this region. The content of organic matter and nitrogen is higher in the southern part than in the northern part [19]. The middle reaches of Heihe River basin is a commodity grain production base, which is made up of 17 irrigation districts (as shown in Figure 1). The main crops in this region are maize, potato, seed maize, cotton, oil crops, and vegetable. Therefore, planting crops in a suitable region, as well as integration between the quantity structure optimization and spatial allocation optimization, are of primary importance to agricultural production management [40].
The letters in the figure represent the names of irrigation districts. LC is for Luocheng irrigation district, LB is for Liuba irrigation district, YL is for Youlian irrigation district, XB is for Xinba irrigation district, HYZ is for Hongyazi irrigation district, PC is for Pingchuan irrigation district, LQ is for Liaoquan irrigation district, LYH is for Liyuanhe irrigation district, BQ is for Banqiao irrigation district, YN is for Yanuan irrigation district, SH is for Shahe irrigation district, XJ is for Xijun irrigation district, YK is for Yingke irrigation district, DM is for Daman irrigation district, SS is for Shangsan irrigation district, HZ is for Huazhai irrigation district, and AY is for Anyang irrigation district.
2.2. Methods and Data
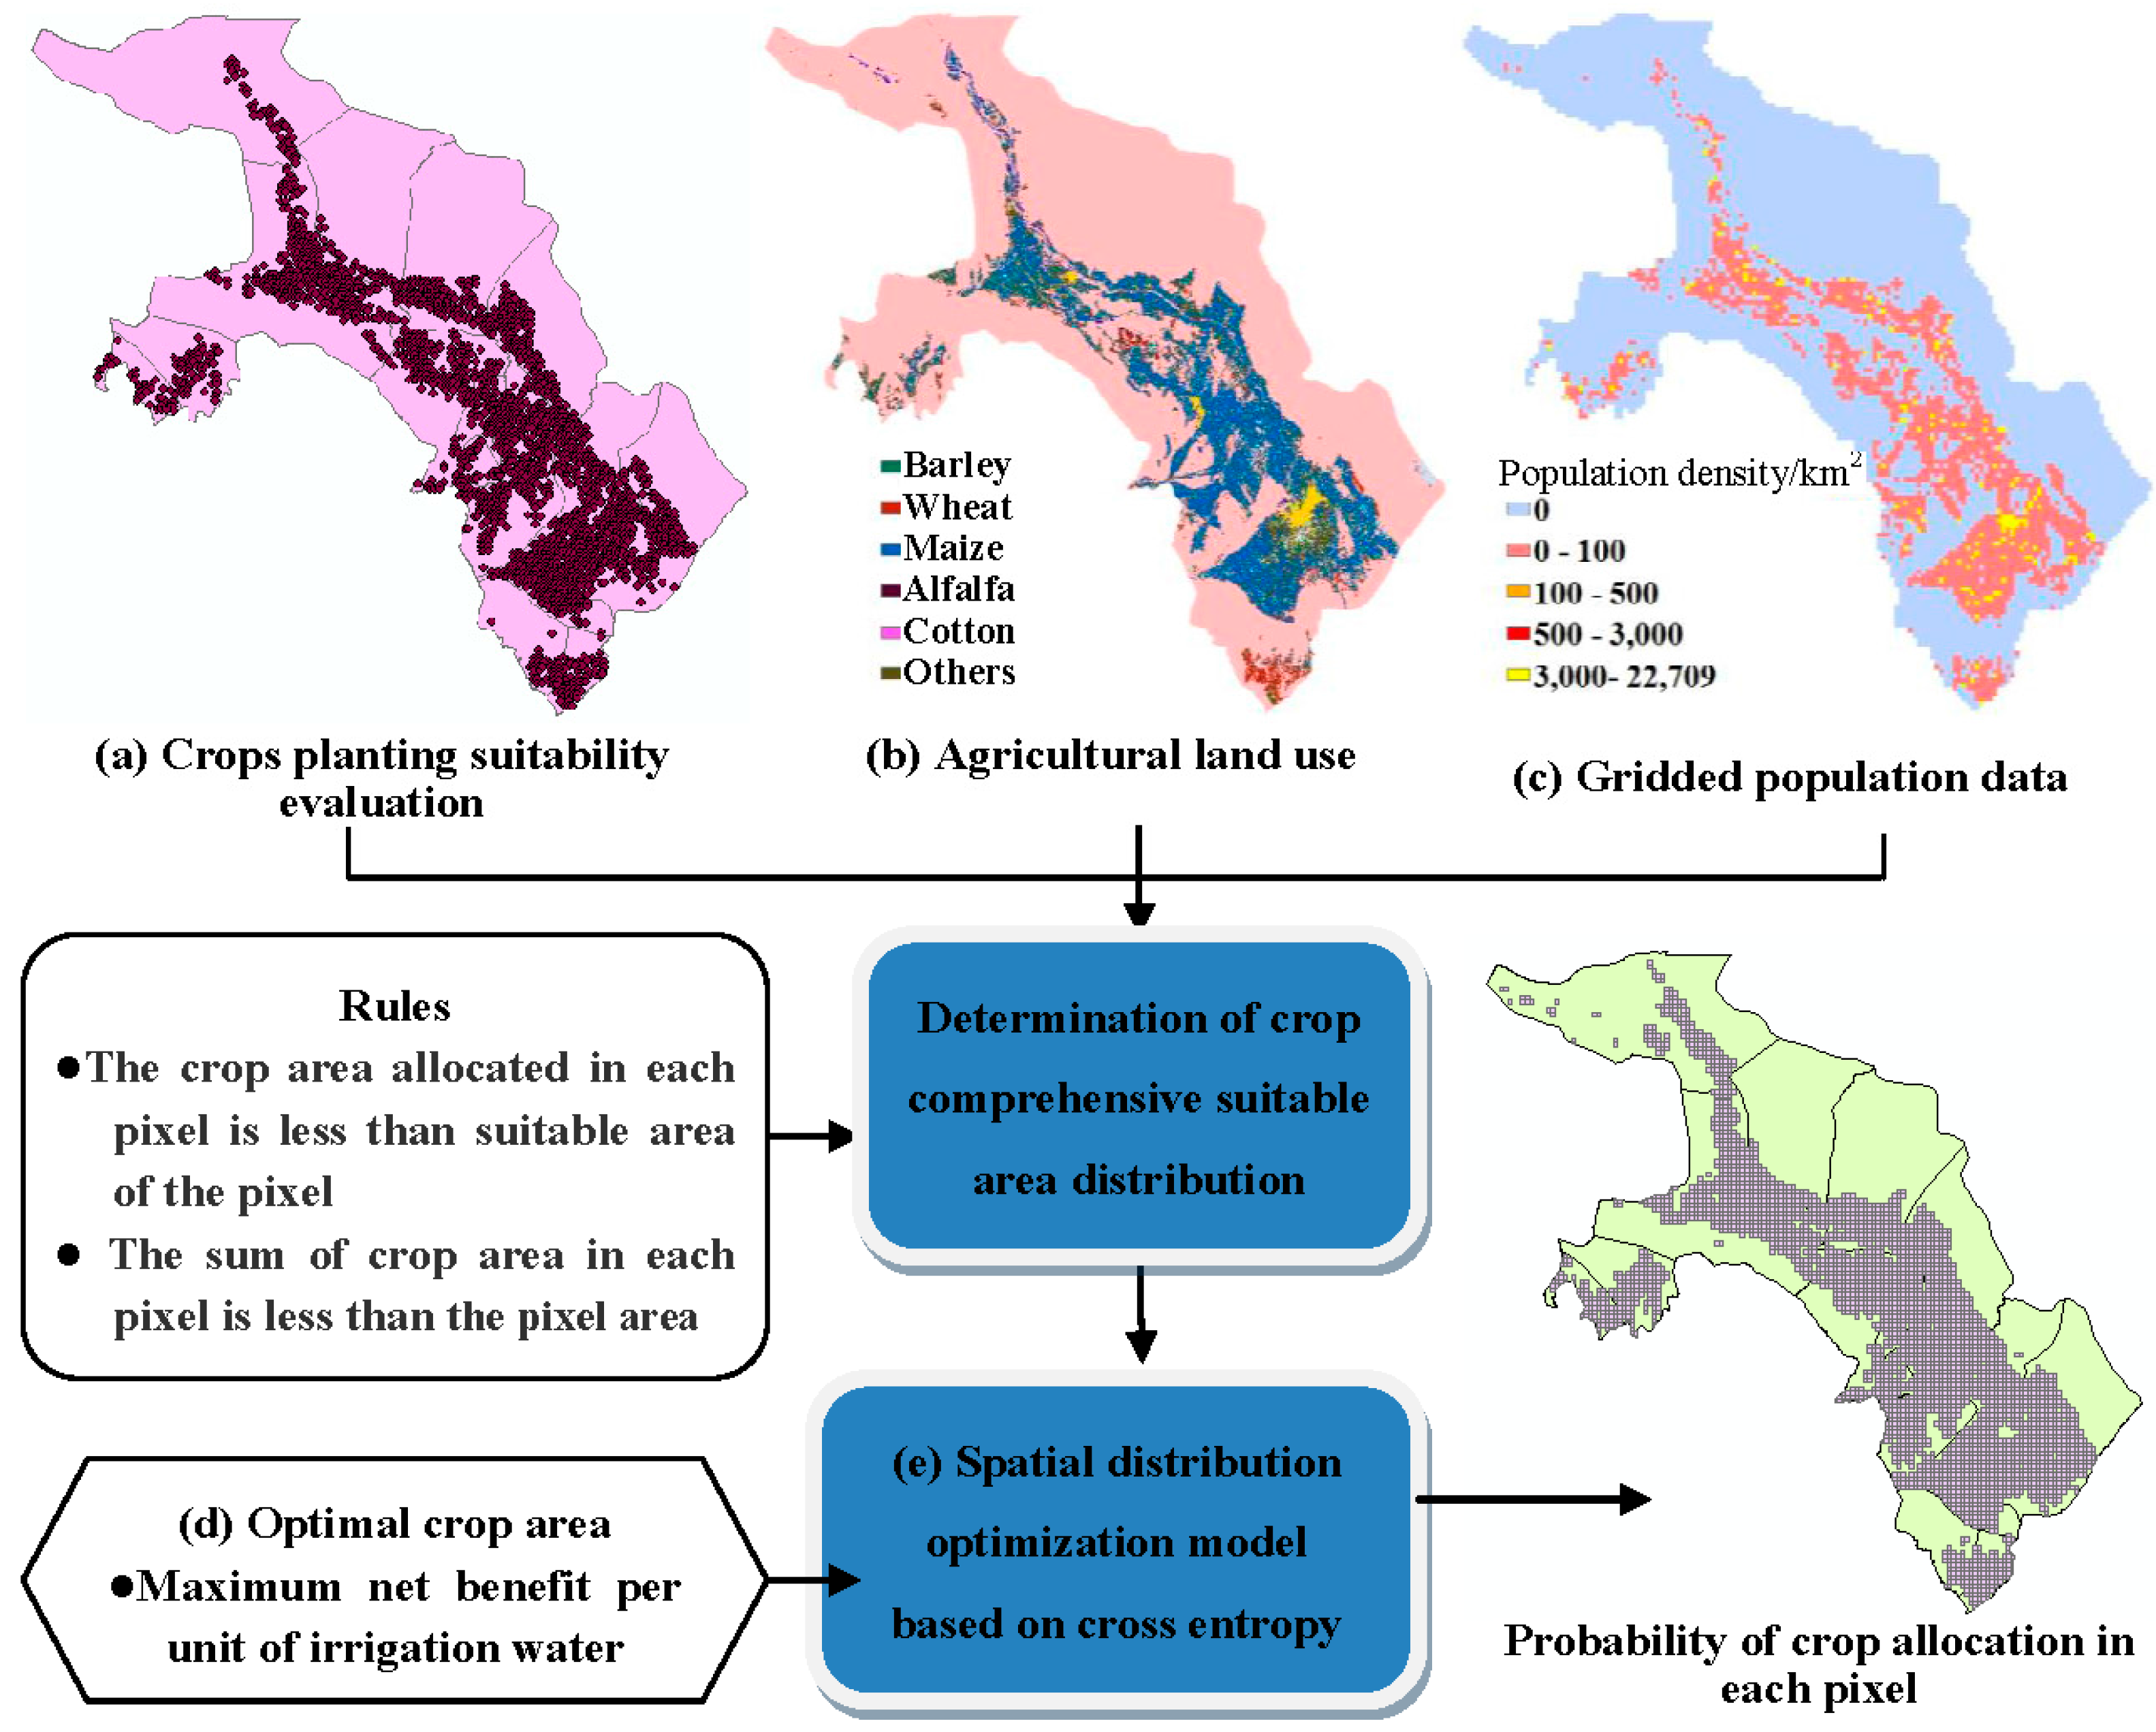
Figure 2 shows an overview of the integrated agricultural cropping spatial distribution optimization model. This model is based on minimizing cross-entropy, re-aggregating administrative statistics data, and multi-source remote sensing information data, such as spatial distribution of crop suitability, spatial distribution of population density, and agricultural land use data in a logical framework.
2.2.1. Evaluation of Crop Planting Suitability
The evaluation of crop planting suitability is important for agricultural land use allocation. It provides the essential data for the optimization of crop spatial framework in order to realize reasonable utilization of land resources as well as providing references for the scientific management and sustainable utilization of cultivated land resources.
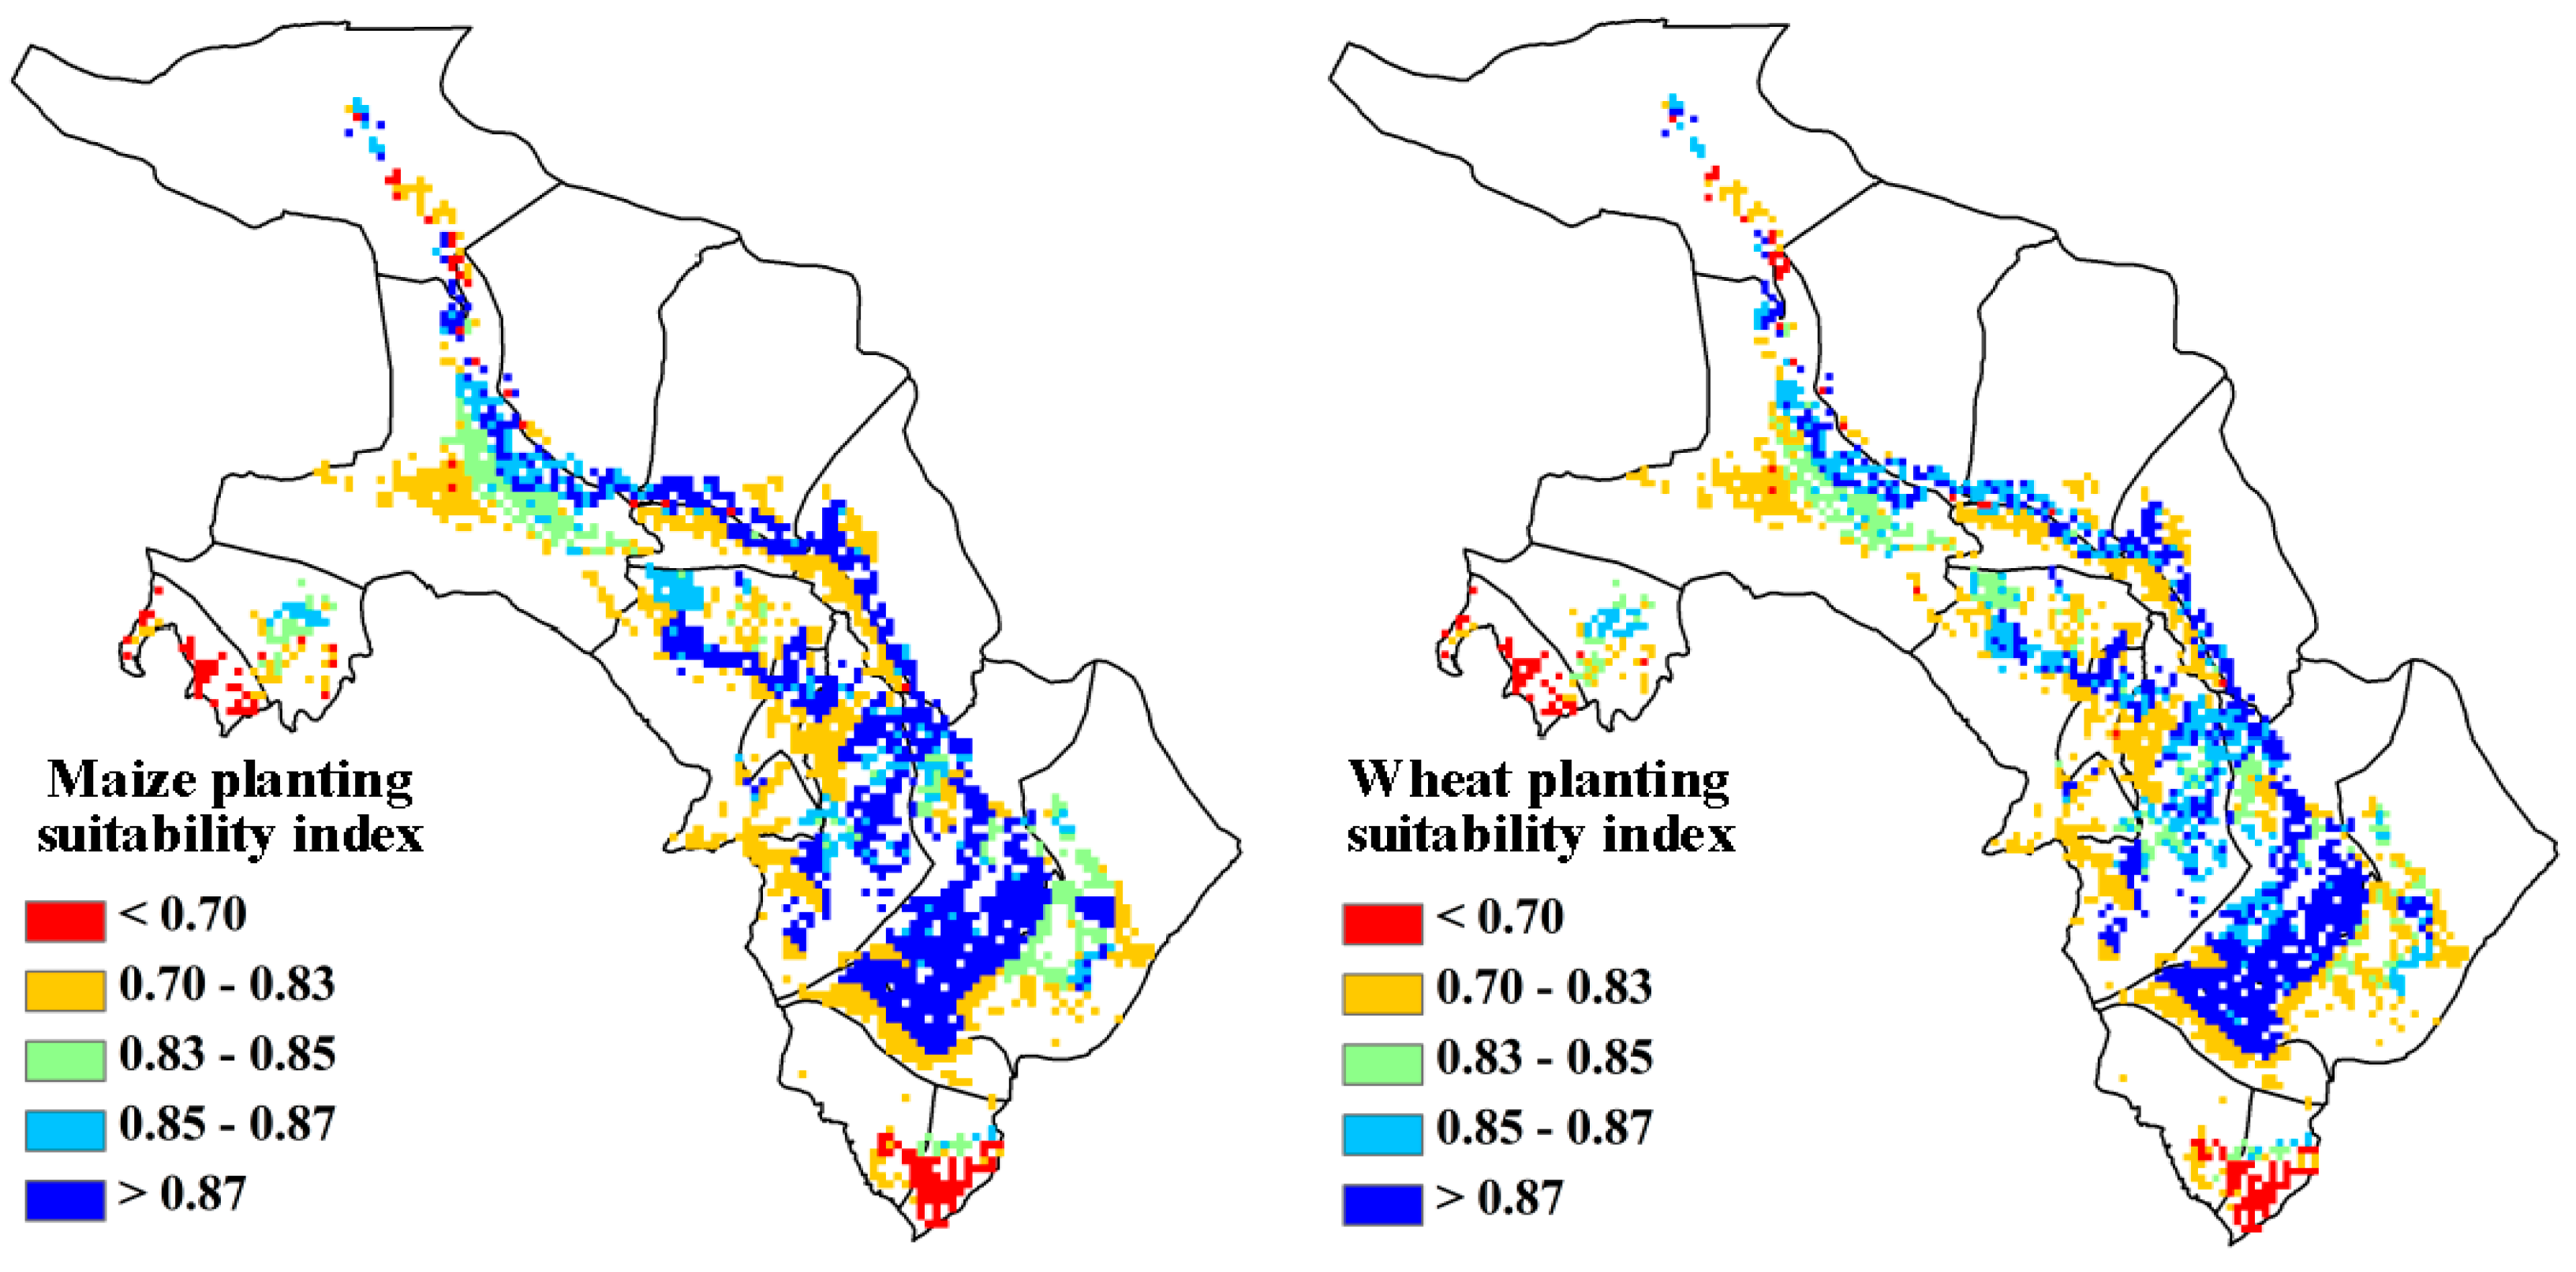
The suitability of crop cultivation in this study is referenced from Peng [19]. Based on the ecological niche fitness theory, Peng [19] selected climatic and environment factors (rainfall, temperature, ET0), soil characteristics (organic matter, total nitrogen, total phosphorus, total potassium, pH, bulk density), and geographical factors (terrain elevation, slope and aspect). These factors are closely related to crop growth and are used for evaluating the ecological niche and crop planting suitability. Figure 3 shows the spatial distribution of crop planting suitability index. Owing to the limitation of data collection, Peng’s [19] study on the maize and wheat planting suitability was employed.
2.2.2. Agricultural Land Use
The Heihe River basin land use and land cover data set (HiWATER: Land cover map of Heihe River basin) were obtained from the Cold and Arid Regions Sciences Data Center (http://westdc.westgis.ac.cn/) which provided the 2011–2015 monthly data covering the type of surface. The data set is based on China’s domestic satellite HJ/CCD data which has a high temporal and spatial resolution (30 M) [41,42]. This data set increases the classification of cultivated crops, including barley, wheat, maize, alfalfa, cotton and others, and can provide the current crop spatial distribution to determine the crop suitable distribution area.
2.2.3. Gridded Population Data
The spatial distribution of population density data is from the gridded population data of the Heihe River basin and provides the spatial distribution of population density in a 1 km × 1 km grid. The data set is given by the Cold and Arid Regions Sciences Data Center at Lanzhou (http://westdc.westgis.ac.cn) [40].
2.2.4. Optimization Model of Agricultural Cropping Pattern
To realize the appropriate allocation and efficient use of agricultural water and land resources and provide the primary input data for spatial allocation, the optimization model for agricultural cropping pattern is established with the objective of maximum agricultural net benefit per unit of irrigation water under certain agricultural water resources. The planting area of crops in an irrigation district is a decision variable for the model. Crops considered include maize, wheat, potato, maize seed, cotton, oil crop, and vegetable, while the basic data of 2013 used in the model are crop yield, crop prices, cost, agricultural irrigation quota and water availability. This model references the results of the project supported by National Natural Science Fund in China (91,425,302).
(1) Objective function
The agricultural cropping pattern optimization model can be written as follows, the variables xij is expected area of crop j in irrigation district i (ha); and the objective of optimization model is the maximum agricultural net benefit per unit of irrigation water:
where f is the net benefit per unit of irrigation water (RMB/m3); i (i = 1,2,…, n) is irrigation district identifier, of which there are 17 within the study area; j (j = 1,2,…, 7) is the crop type identifier, of which 7 main types are considered in this model (maize, wheat, potato, maize seed, cotton, oil crops, and vegetable); vij is the price of crop j in the irrigation district i (RMB/kg); yij is the yield of crop j in the irrigation district i (kg/ha); cij is the cost of crop j in the irrigation district i (RMB/ha); ETij is the net irrigation quota of crop j in the irrigation district i (m3/ha).
(2) Constraints
The irrigation water of irrigation district i should be less than the available water supply:
where mij is the gross irrigation quota of crop j in the irrigation district i (m3/ha); Qi is the available water supply in the irrigation district i (m3).
The irrigation area of irrigation district i would be less than the effective irrigation area Xi (ha):
The agriculture product would be to meet the local demand:
where P is the population in the study area; FN is the per person grain demand, 135 kg/per; and VN is the per person vegetable demand, 140 kg/per; K is demand coefficient, when the agriculture product meet the local demand, K = 1.
non-negative constraint:
2.2.5. Spatial Distribution Optimization Model Based on Cross Entropy
Shannon (1948) introduced information entropy to measure the uncertainty of the expected information. He defined entropy H(p) as a weighted sum of the information [34]. The entropy of a random variable with probability distribution P (p1, p2, …, pk) can be expressed using Equation (7) [43]
Jaynes (1957) proposed the maximum entropy principle in statistical inference: the least informative probability distribution P (p1, p2, …, pk) can be found by maximizing the entropy H(p) [44]. In Equation (7), the solutions are: pi = 1/n, i = 1,2, …, n, H(p) = ln n [34,35].
The cross-entropy formulation is based on the Shannon Entropy theory [36]. Cross-entropy was formulated by Kullback and Leibler [31] and is detailed by Kullback [32]. It measures the divergence between the prior distribution and the desired distribution. The principle of minimum cross entropy (POMCE), also referred to as the principle of minimum discrimination information, is obtained by minimizing cross-entropy with respect to the given prior distribution, subject to given constraints [33]. POMCE can be expressed as
where D is the cross-entropy or the discrimination information and the objective is to minimize D. P (p1, p2, …, pk) is the desired distribution, Q = (q1, q2, …, qk) is prior distribution chosen based on all the given information, but does not satisfy the prescribed constraints [45,46,47].
In this study, we considered a comprehensive crop suitable distribution based on the integrated multi-source data analysis as prior knowledge in the POMCE. Let qij represent the suitable cultivated land area shares of crop j on pixel i. Therefore,
Based on the spatial distribution of crop suitability, spatial distribution of population density, and agricultural land use data, the spatial distribution optimization model based on cross entropy, subject to the constraints of optimal crop area obtained from agricultural cropping pattern optimization model, is used to determine the optimal spatial distribution of crops.
The objective of crop spatial distribution optimization is to minimize cross-entropy of comprehensive crop distribution probability and desired distribution probability, subject to area constraint on the pixel scale and other related limitations.
The spatial distribution optimization model, based on cross entropy, can be written as follows, variables pij represent the desired area shares of crop j on pixel i:
subject to the following constraints:
making sure the allocated area of crop j on pixel i would be less than suitable cultivated land area of crop j on pixel i:
making sure the allocated area on pixel i would be less than the arable land area on pixel i:
where i = 1, 2, 3, …, represents the pixel identifier within the study area; j = 1, 2, represents the crop identifier within the study area; qij represent the suitable area shares of crop j on pixel i; Availablei represent the arable land area on pixel i; Suitableij represent the suitable cultivated land area of crop j on pixel i; and Areaj represent the optimal crop areas, which are obtained from the agricultural cropping pattern optimization model.
3. Results and Discussion
3.1. Crop Demand Assessment
Based on limited data on crop planting suitability, this study focuses only on the spatial allocation of two crops, maize and wheat. Thus, in this section, the maize and wheat demands in the middle reaches of Heihe River basin are analyzed.
As shown in Table 1, seed maize controls the priority of water allocation, due to its higher unit net irrigation benefit and lower water requirement in these irrigation districts compared with other crops. Compared with the actual situation in 2013, the proportion of the total planting areas of corn and wheat through optimization all accounts for about 87%. However, the area of maize should increase, and the area of wheat should decrease in a region-wide range.
Table 2 compares maize and wheat areas between present and optimal allocations in different irrigation districts. Comparing the actual crop structure, results revealed that except for the XJ, SS, PC, SH, YL, LC, XB irrigation districts, the maize area in the remaining irrigation districts increased, especially in DM and YK. The change was apparent with 2809 and 2057 ha increases, respectively, while the maize area in YL decreased by 2128 ha. However, DM, YK, PC, BQ, LYH and LC would be more favorable to wheat because of lower water requirement, while in other irrigation districts, the area of wheat decreased. For example, it would reduce to 504 ha and 436 ha in LQ and HYZ district, respectively.
3.2. Crop Comprehensive Suitable Area Distribution
Using the ArcGIS platform, the whole research area was divided into 9041 1 km × 1 km grids. According to crop planting suitability evaluation, different colors were selected to represent different crop suitability indices, and grids were filled to generate the spatial distribution map of crop planting suitability index.
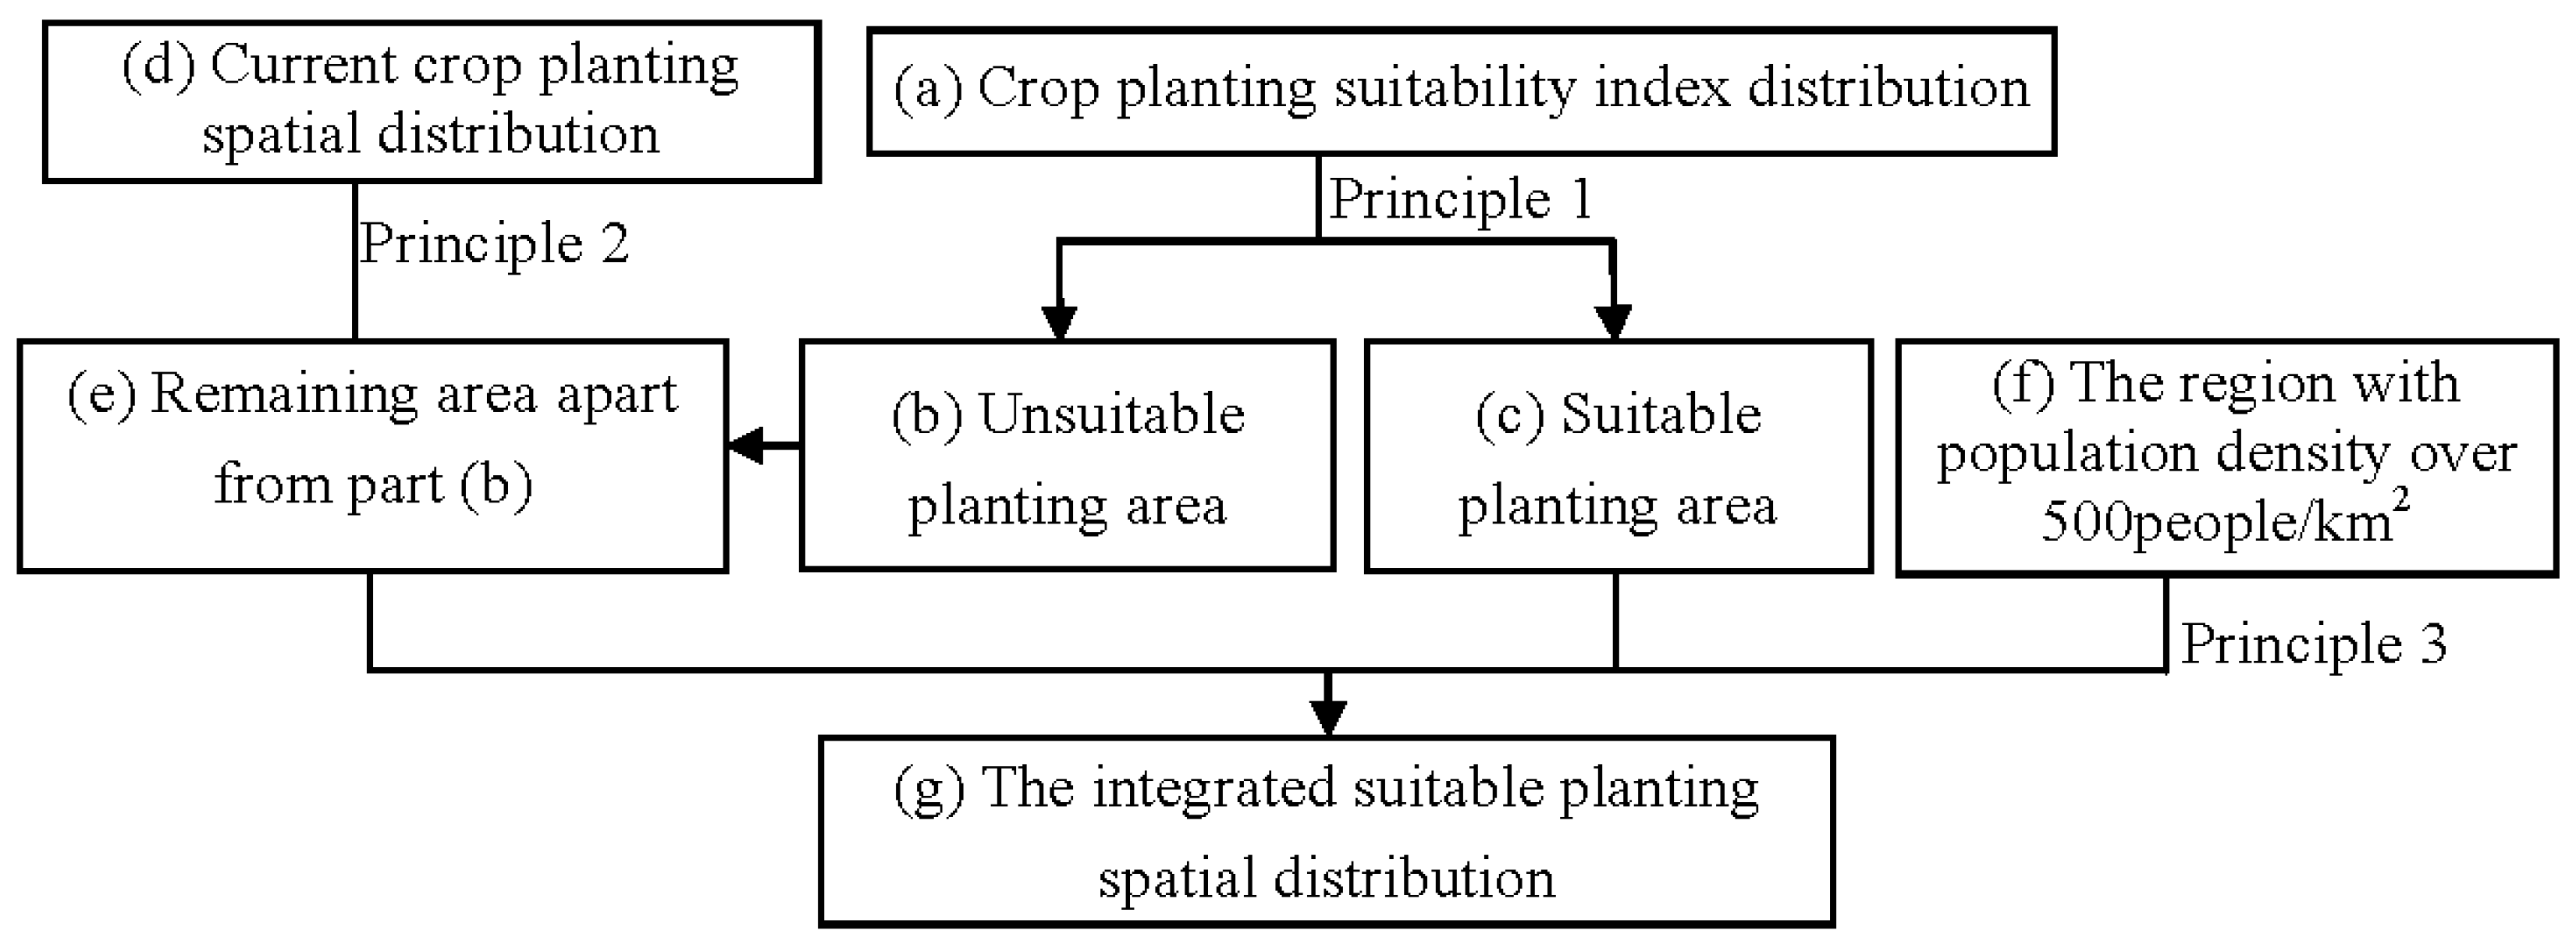
In light of the spatial distribution of maize and wheat planting suitability obtained above, combined with the spatial distribution of population density and agricultural land use data, the crop comprehensive suitable area distribution can be determined according to the following principles. Figure 4 shows an overview of this process.
Principle 1: Preferentially assigning crops to the area with high suitability. First, rank crop planting suitability index (part a in Figure 4) in descending order, then contrast the area corresponding to the crop planting suitability index with the optimized area needed to be allocated, when the former is just larger than the latter, select the corresponding suitability index as a threshold of crops planting suitability index.
For example, Table 3 shows the maize planting suitability index and its corresponding area. When the index is greater than or equal to 0.83, its area is 103,337 ha, which is large enough to allocate the expected area of 96,896 ha obtained from the optimal model. Similarly, Table 4 shows that when the wheat planting suitability index is greater than or equal to 0.83, the area is 20,315 ha which can allocate the expected area of 12,817 ha. As a result, we can distinguish the unsuitable planting area (part b in Figure 4) and the suitable planting area (part c in Figure 4).
Principle 2: The evaluation of crop planting suitability index is based on fixed-point sampling, and owing to the limitation of field investigation, there is inevitably some missing information on crop spatial distribution. In order to make up for this deficiency, the current crop planting spatial distribution (part d in Figure 4) is taken into account. Taking part b away from part d, the remaining area (part e in Figure 4) can be considered a supplement of crop distribution information.
Principle 3: According to [18], when the population density exceeds 500 people/km2, it would be unsuitable for crop growing area. The land would be urban with little agriculture. Combined with the spatial distribution of population density, the region with population density over 500 people/km2 (part f in Figure 4) is deducted from the suitable planting area.
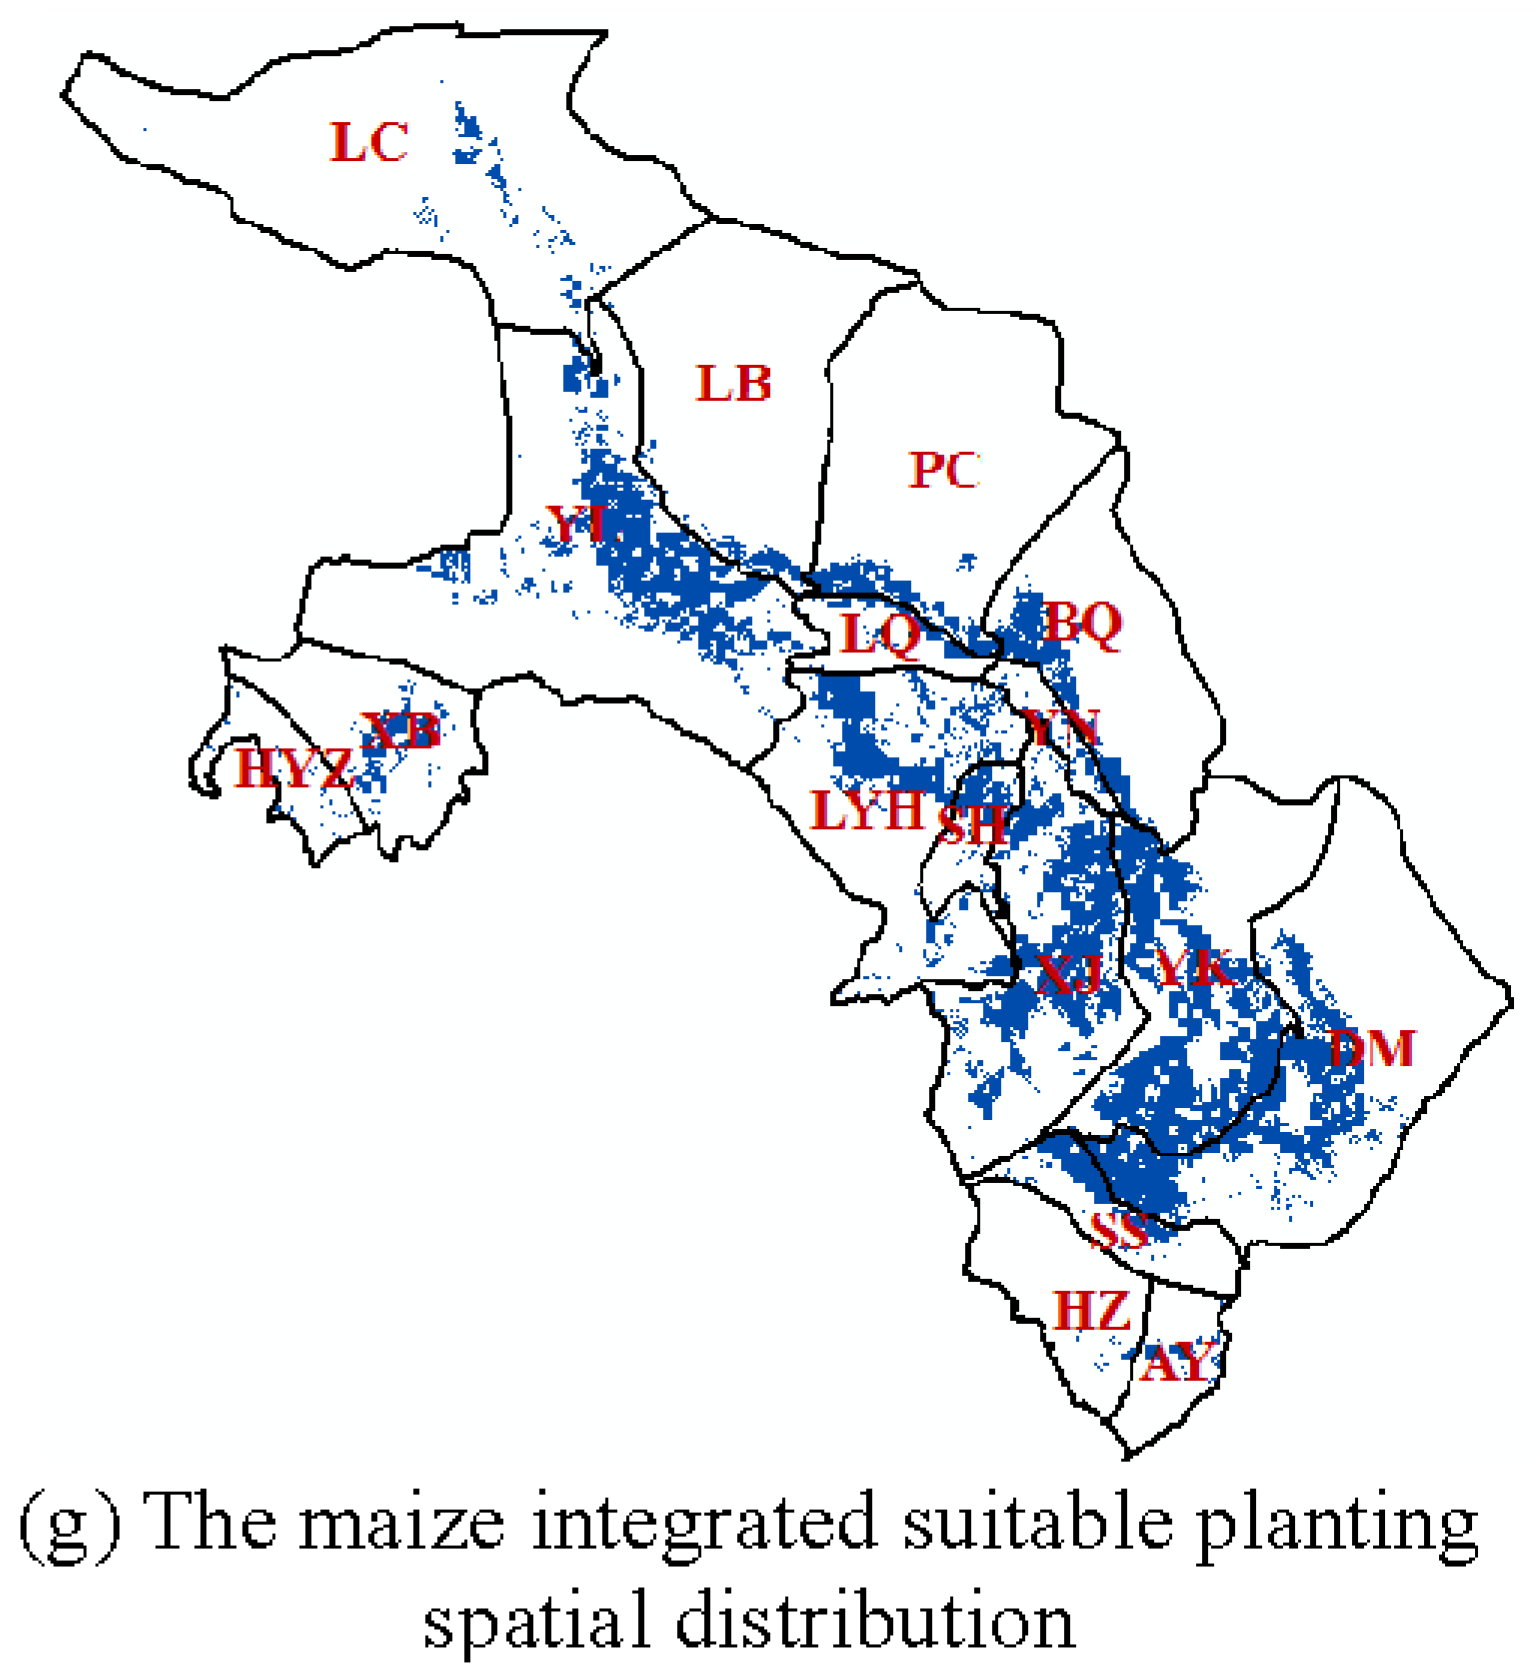
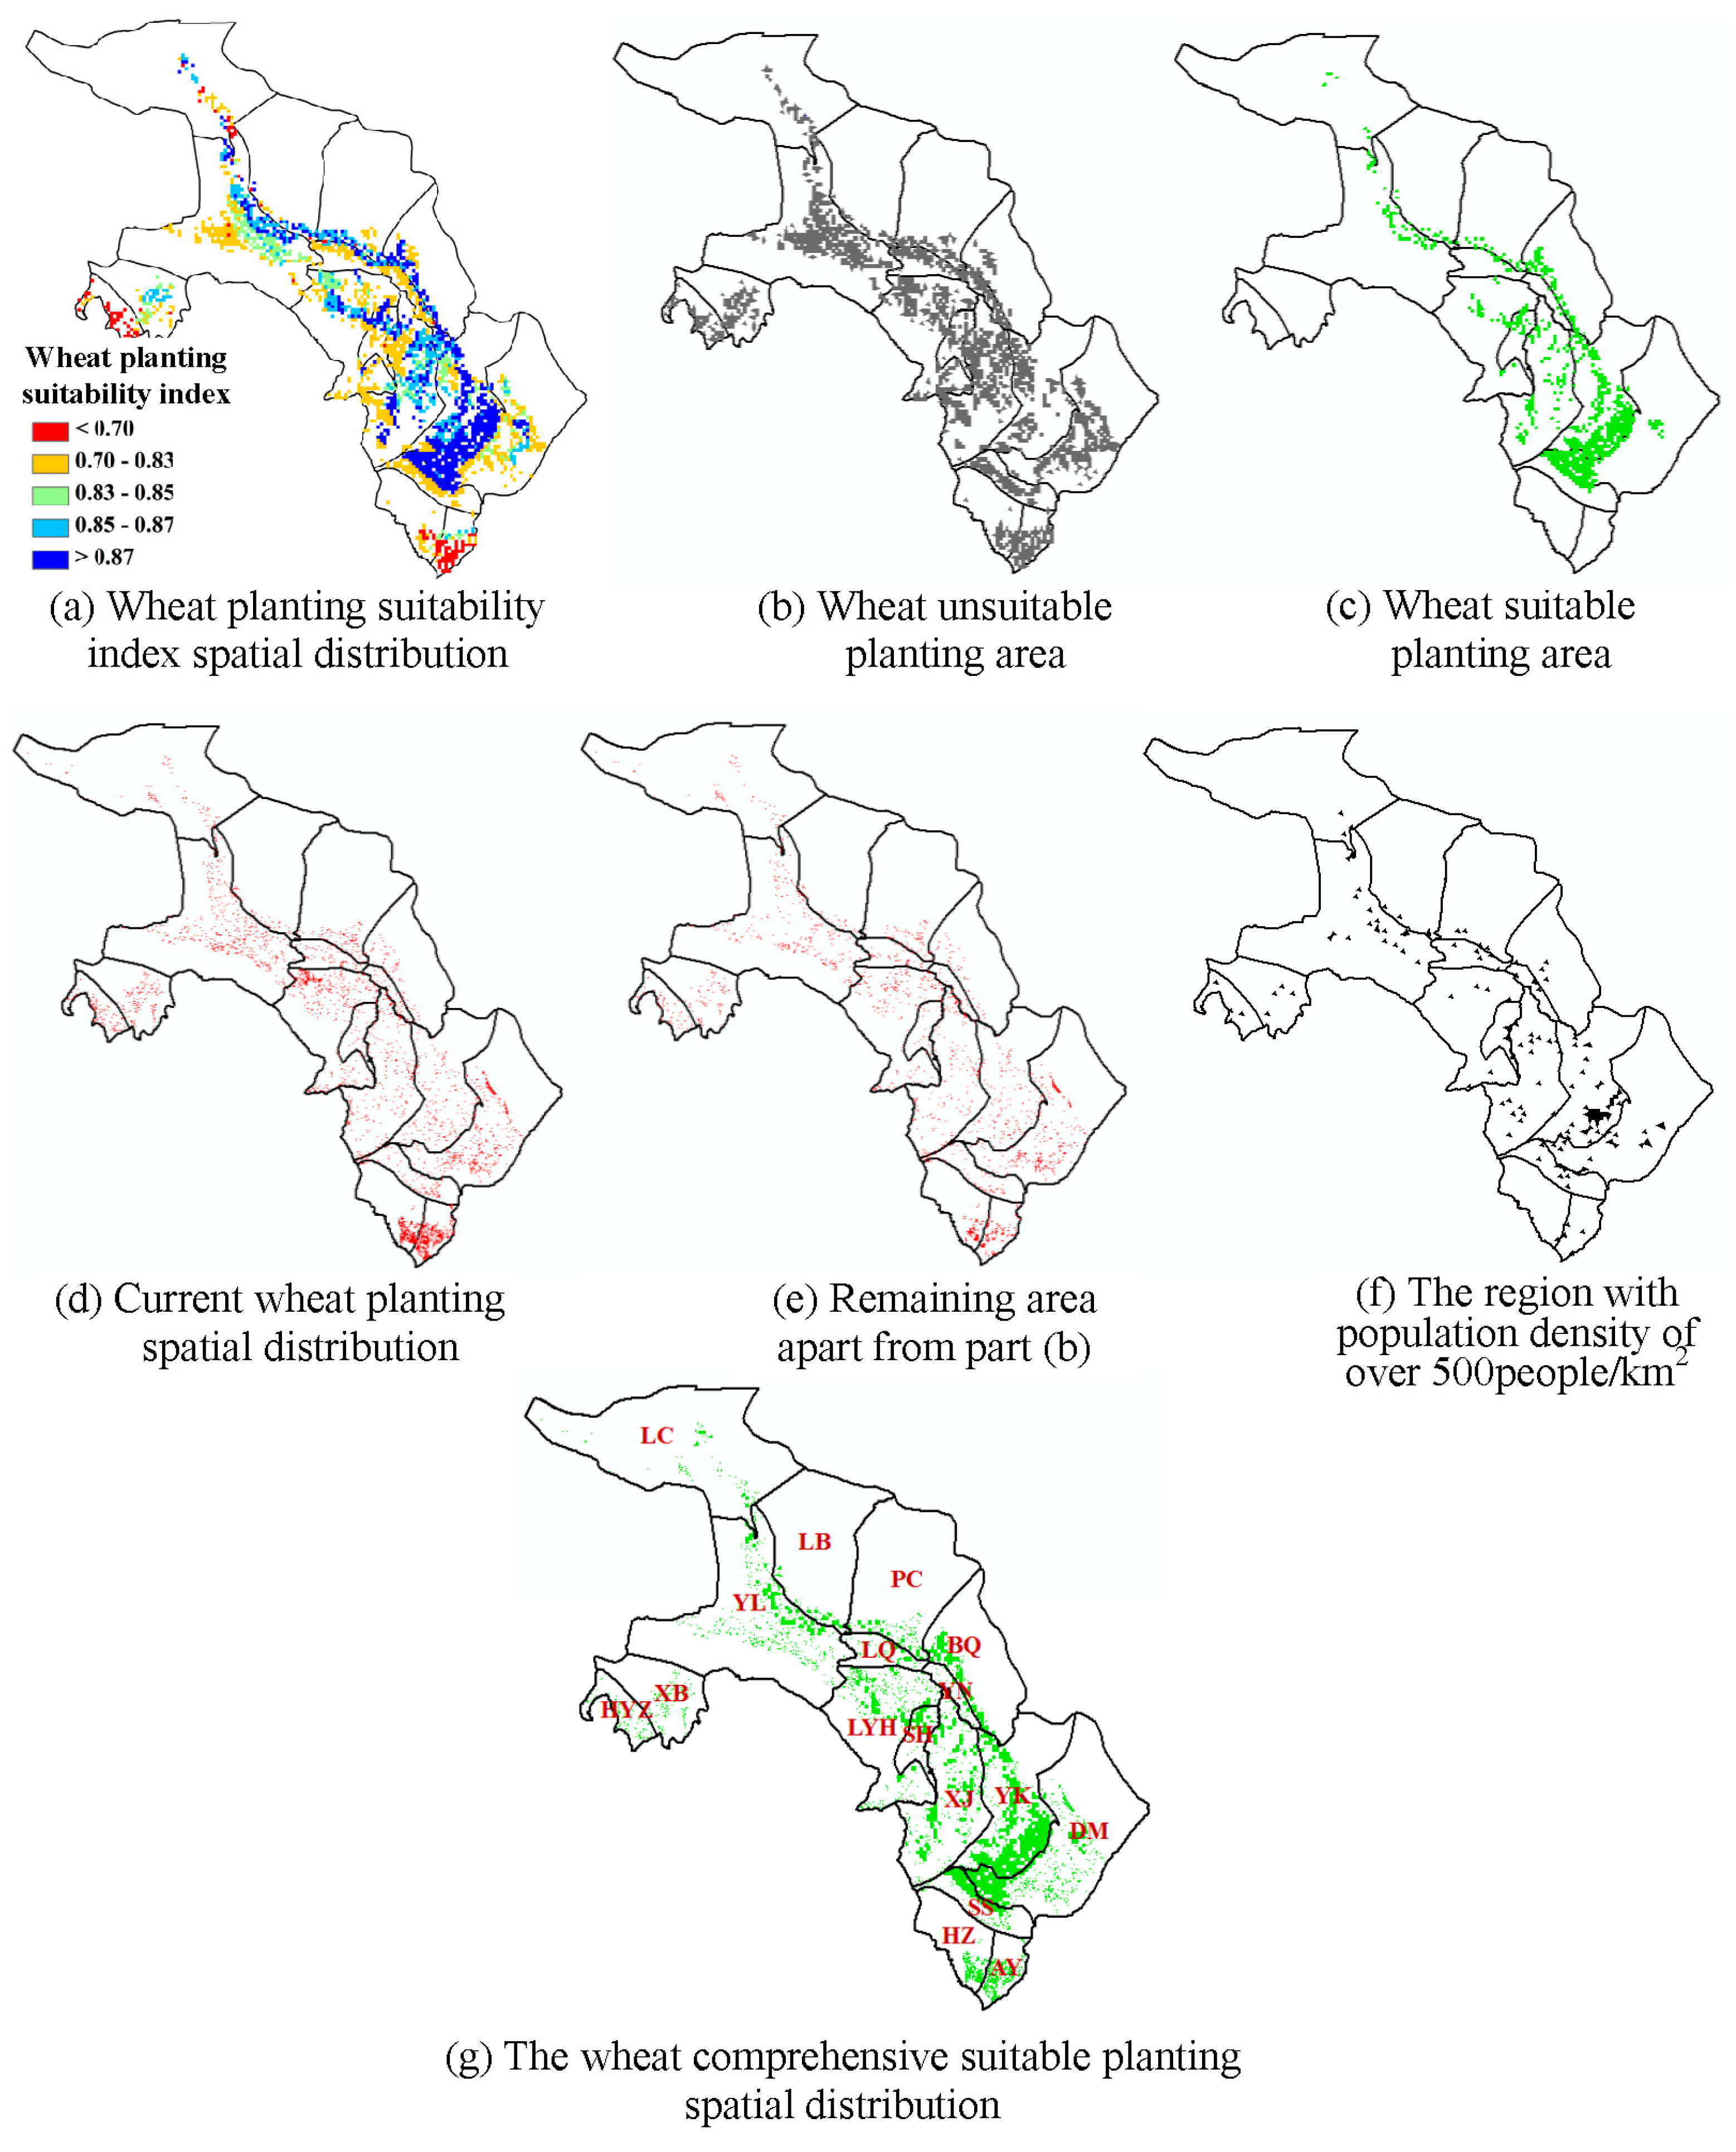
Figure 5 and Figure 6 show the formation process of maize and wheat comprehensive suitable planting spatial distribution.
Results show that the maize comprehensive suitable planting spatial distribution is consistent with the current maize planting spatial distribution. The suitable area mainly focuses on the east of the YL irrigation district, the north of the LYH irrigation district, and most areas of the XJ, YK, DM irrigation districts. However, there are fewer areas suitable for growing maize in HYZ, HZ, and LQ.
In YK and DM irrigation district, the suitable area for planting maize is larger than the current area; therefore, an increase in the maize area is suggested in these districts. On the contrary, in YL, XJ and XB irrigation district, the maize area should be reduced because the suitable area is smaller than the current planting area.
Results show that the wheat comprehensive suitable planting spatial distribution has exhibited its obvious characteristics and the regular difference from the current wheat planting spatial distribution. For example, the planting areas of wheat are relatively centralized in the HZ and AY irrigation districts and evenly distributed in other regions under the existing circumstances. However, the suitable areas for planting wheat are mainly concentrated in the YK, DM and SS irrigation district.
In the LQ, YN and HYZ irrigation districts, the suitable area for planting wheat is smaller than current area; therefore, a reduced area of wheat is suggested in these districts. However, in the BQ, YK, DM and SS irrigation districts, the maize area should be increased, for the suitable area is larger than current planting area.
3.3. Comparison of Crop Area Spatial Distribution between Present and Optimal Allocations
Comparison of maize area spatial distribution between present and optimal allocations is shown in Figure 7. Results show that after optimization, it tends to centralize grids, and the proportion of maize area in each grid is greater than 80% in the south of study area. This mainly focuses on the SS irrigation district, as the suitable area for planting maize in SS irrigation approaches the optimized area needed to be allocated.
The number of grids with higher proportion, including the proportion greater than 80% and between 75% and 80% is less than the actual situation, mainly owing to the deduction of unsuitable area for planting maize according to the principles in Section 3.1.
Meanwhile, the optimal spatial distribution shows more centralization than before optimization, because of the number of grids with a proportion of 50–75% increase, while the amount of grids with a proportion of 10–20% and less than a 10% decrease.
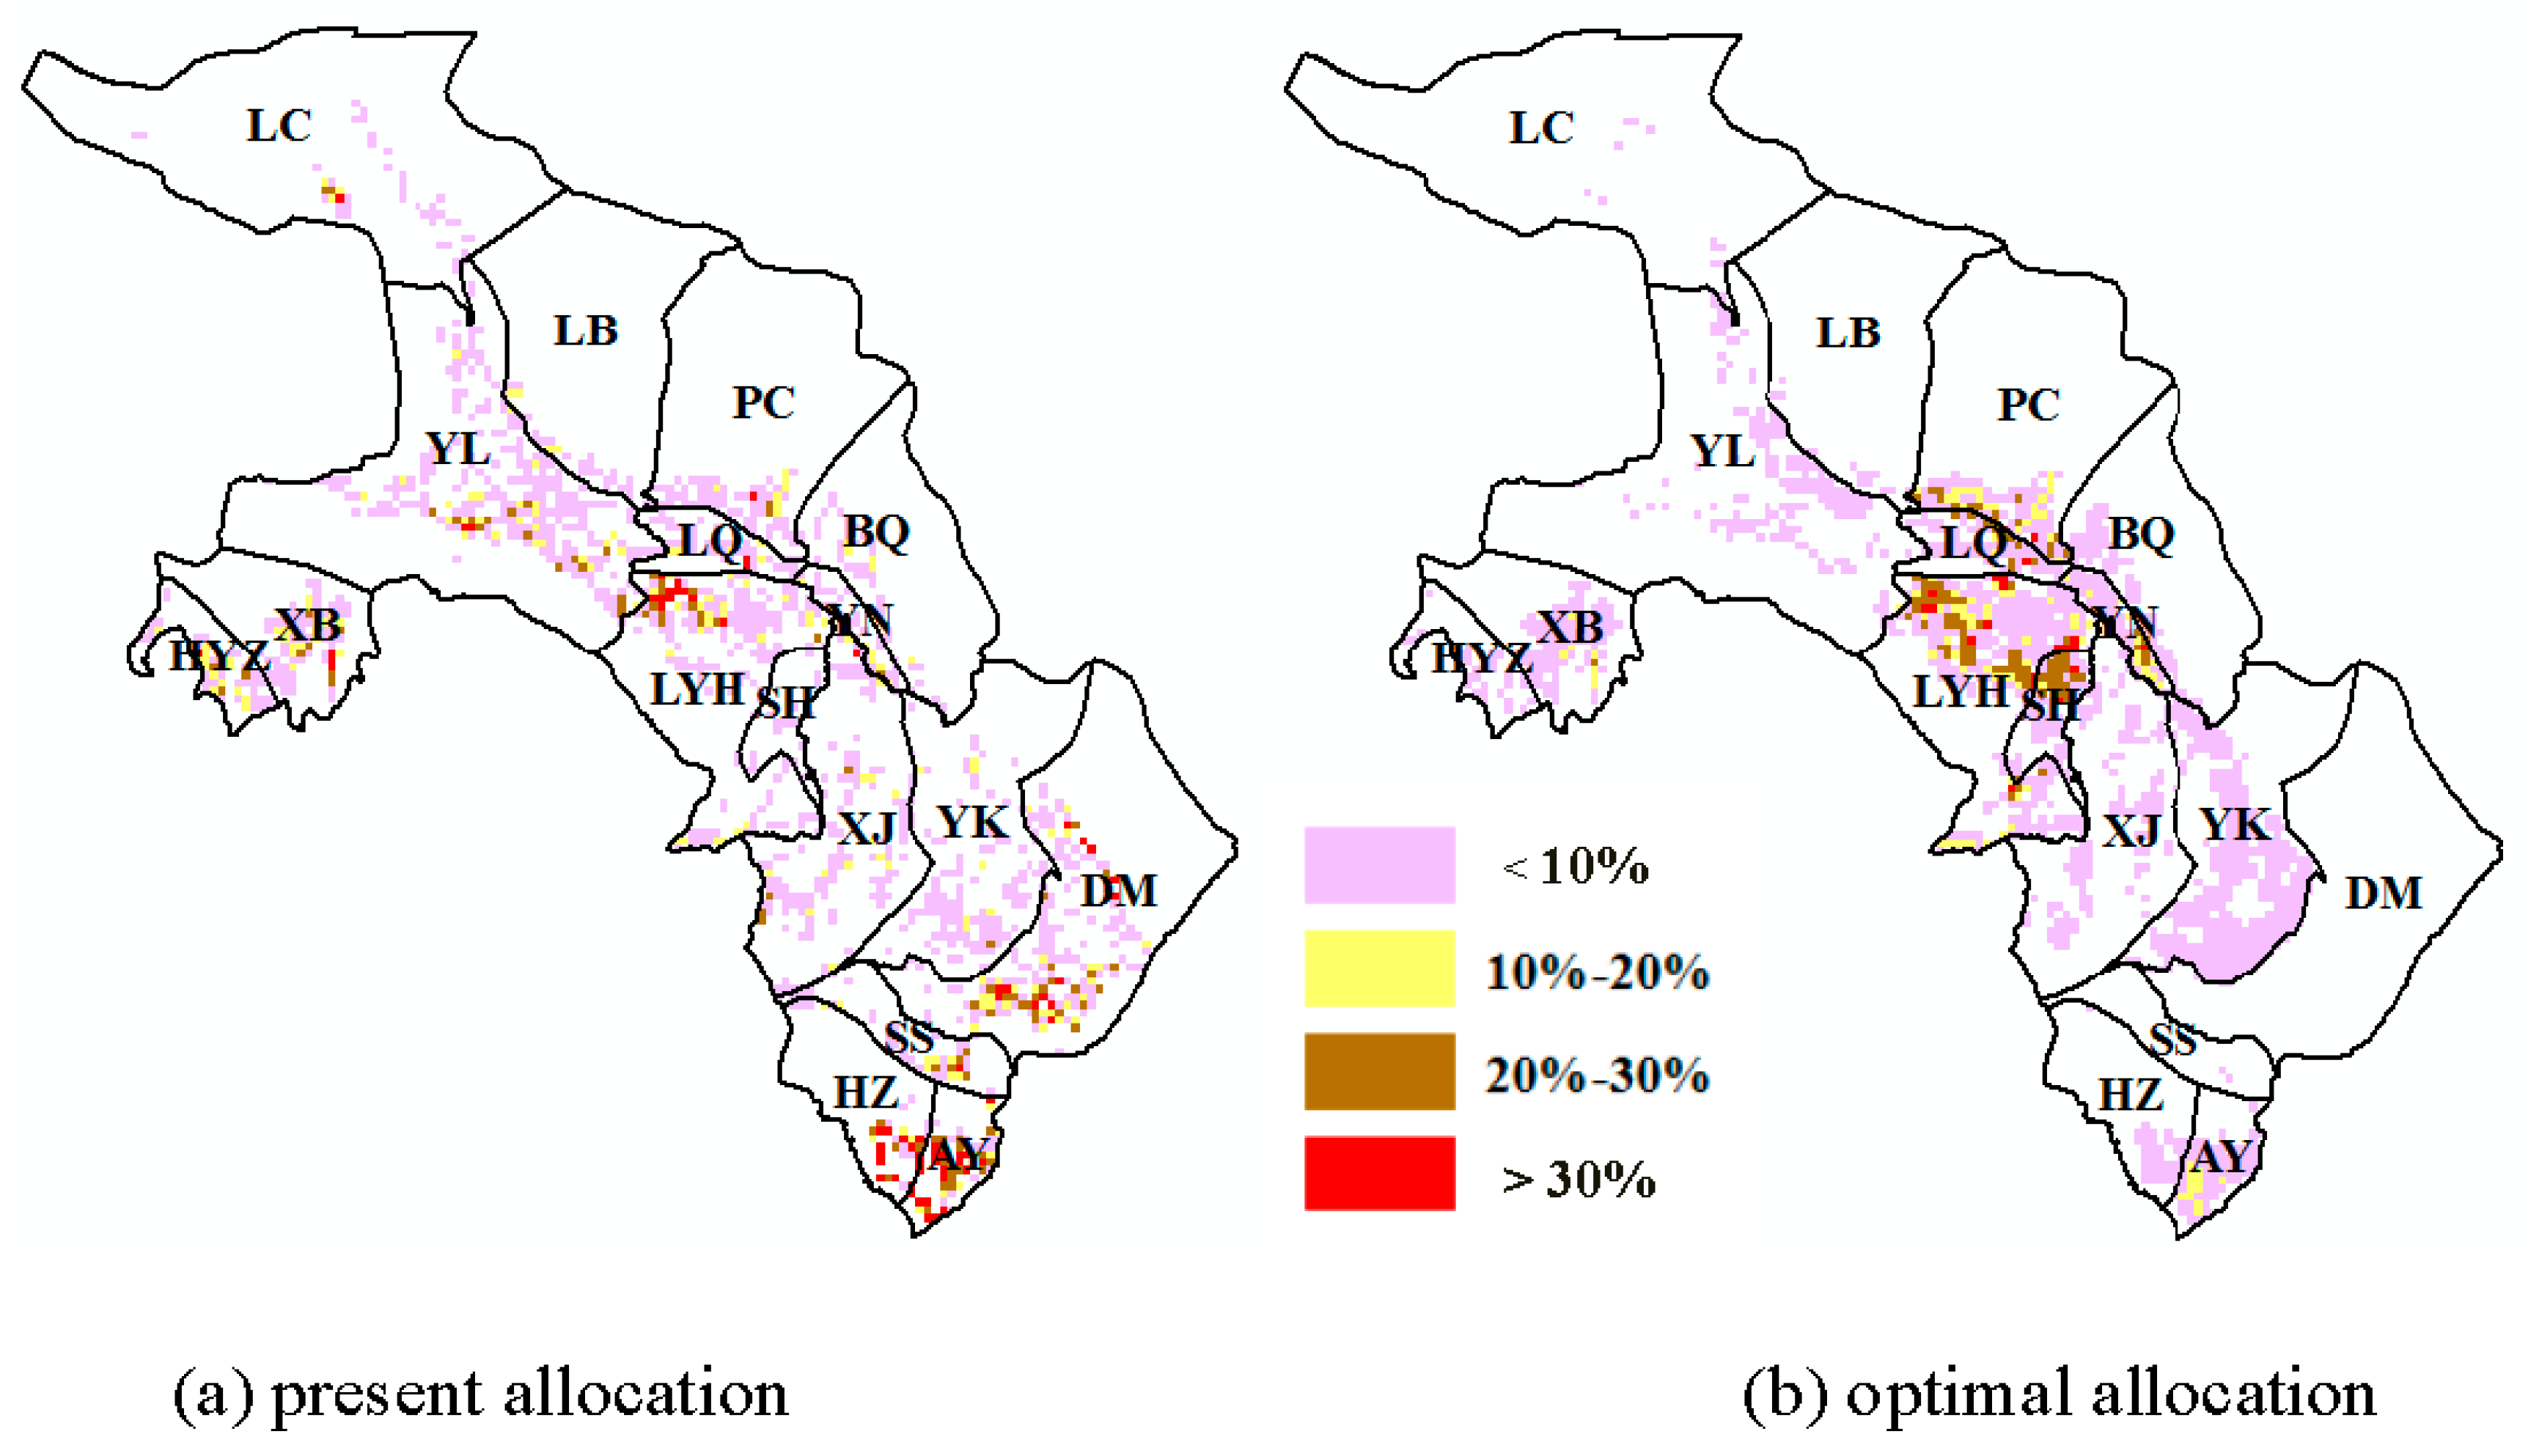
Figure 8 shows a comparison of wheat area spatial distribution between present and optimal allocations. Similarly, it indicates that grids with a high proportion of wheat area in each grid are more concentrated than in the actual situation, mainly distributed in LYH, LQ and SH irrigation districts.
Compared with the maize proportion in each grid, the wheat proportion is lower, owing to less optimal wheat area and the decentralization of wheat comprehensive suitable planting spatial distribution. The number of grids with proportion greater than 30% decreases, while the amount of grids with proportion less than 10% and between 10% and 30% increases after spatial optimization.
In the south of the study area (AY and HZ irrigation district), based on the comparison of crop area spatial distribution between present and optimal allocations, the wheat area was more overloaded than its area suitable to plant in the actual situation. Therefore, it is suggested that the wheat area should be reduced in these two districts.
The optimization of crop spatial distribution, which is based on crop planting suitability evaluation and agricultural cropping pattern optimization, can improve the efficient utilization of agricultural water and land resources. The study ensures that crops are planted in suitable areas to provide the agricultural planting results of specialization and visualization.
4. Conclusions
In this study, an integrated agricultural cropping spatial distribution optimization is achieved at the irrigation district scale, based on the combination of multi-source remote sensing information data with optimal crop area. Minimizing cross-entropy was applied to build the model. This study considers the maize and wheat comprehensive suitable area distribution in the middle reaches of Heihe River basin and maize and wheat spatial distribution optimization is obtained. The high proportion of maize and wheat areas is more concentrated than before optimization. The integrated model contributed a new idea to cropping pattern spatial optimization. An optimizing approach based on cross-entropy minimization can lead to the efficient allocation of water resources and appropriate crop spatial distribution simultaneously. This study can ensure that crops are planted in a suitable region and provide a scientific basis for farmers to make crop selection decisions, which has an important guiding significance in the actual production work. However, due to the limitations of data on the planting suitability evaluation of other crops, only the main crops (maize and wheat) were studied. Further studies are therefore recommended using more crops.
Acknowledgments
We are grateful for the grant support from the National Natural Science Fund in China (91425302), National Key Research and Development Program during the 13th Five-year Plan in China (2016YFC0401306) and China Water Resources Industry Research Special Funds for Public Welfare Projects (No. 201301016).
Author Contributions
Lina Hao and Xiaoling Su designed the computations; Lina Hao and Xiaoling Su analyzed the data and wrote the paper; Vijay P. Singh and Olusola O. Ayantobo provides an English editing service and some improvement of style where necessary.
Conflicts of Interest
The authors declare no conflict of interest.
References
- Li, M.; Guo, P. A coupled random fuzzy two-stage programming model for crop area optimization—A case study of the middle Heihe River basin, China. Agric. Water Manag. 2015, 155, 53–66. [Google Scholar] [CrossRef]
- Dai, Z.Y.; Li, Y.P. A multistage irrigation water allocation model for agricultural land-use planning under uncertainty. Agric. Water Manag. 2013, 129, 69–79. [Google Scholar] [CrossRef]
- Mianabadi, H.; Mostert, E.; Zarghami, M.; van de Giesen, N. A new bankruptcy method for conflict resolution in water resources allocation. J. Environ. Manag. 2014, 144, 152–159. [Google Scholar] [CrossRef] [PubMed]
- Su, X.; Li, J.; Singh, V.P. Optimal Allocation of Agricultural Water Resources Based on Virtual Water Subdivision in Shiyang River Basin. Water Resour. Manag. 2014, 28, 2243–2257. [Google Scholar] [CrossRef]
- Karimi, M.; Sharifi, M.A.; Mesgari, M.S. Modeling land use interaction using linguistic variables. Int. J. Appl. Earth Obs. Geoinf. 2012, 16, 42–53. [Google Scholar]
- Ma, S.; He, J.; Liu, F.; Yu, Y. Model of urban land-use spatial optimization based on particle swarm optimization algorithm. Trans. Chin. Soc. Agric. Eng. 2010, 26, 321–326. [Google Scholar]
- Pilehforooshha, P.; Karimi, M.; Taleai, M. A GIS-based agricultural land-use allocation model coupling increase and decrease in land demand. Agric. Syst. 2014, 130, 116–125. [Google Scholar] [CrossRef]
- Cao, K.; Ye, X. Coarse-grained parallel genetic algorithm applied to a vector based land use allocation optimization problem: The case study of Tongzhou Newtown, Beijing, China. Stoch. Environ. Res. Risk Assess. 2012, 27, 1133–1142. [Google Scholar]
- Cao, K.; Huang, B.; Wang, S.; Lin, H. Sustainable land use optimization using Boundary-based Fast Genetic Algorithm. Comput. Environ. Urban Syst. 2012, 36, 257–269. [Google Scholar] [CrossRef]
- Baja, S.; Arif, S.; Neswati, R. Developing a User Friendly Decision Tool for Agricultural Land Use Allocation at a Regional Scale. Mod. Appl. Sci. 2017, 11, 11. [Google Scholar] [CrossRef]
- Li, X.; Parrott, L. An improved Genetic Algorithm for spatial optimization of multi-objective and multi-site land use allocation. Comput. Environ. Urban Syst. 2016, 59, 184–194. [Google Scholar] [CrossRef]
- Liu, Y.; Tang, W.; He, J.; Liu, Y.; Ai, T.; Liu, D. A land-use spatial optimization model based on genetic optimization and game theory. Comput. Environ. Urban Syst. 2015, 49, 1–14. [Google Scholar] [CrossRef]
- Maleki, F.; Kazemi, H.; Siahmarguee, A.; Kamkar, B. Development of a land use suitability model for saffron (Crocus sativus L.) cultivation by multi-criteria evaluation and spatial analysis. Ecol. Eng. 2017, 106, 140–153. [Google Scholar] [CrossRef]
- Reshmidevi, T.V.; Eldho, T.I.; Jana, R. A GIS-integrated fuzzy rule-based inference system for land suitability evaluation in agricultural watersheds. Agric. Syst. 2009, 101, 101–109. [Google Scholar] [CrossRef]
- Sorel, L.; Viaud, V.; Durand, P.; Walter, C. Modeling spatio-temporal crop allocation patterns by a stochastic decision tree method, considering agronomic driving factors. Agric. Syst. 2010, 103, 647–655. [Google Scholar] [CrossRef]
- Akıncı, H.; Özalp, A.Y.; Turgut, B. Agricultural land use suitability analysis using GIS and AHP technique. Comput. Electron. Agric. 2013, 97, 71–82. [Google Scholar] [CrossRef]
- Nouri, H.; Mason, R.J.; Moradi, N. Land suitability evaluation for changing spatial organization in Urmia County towards conservation of Urmia Lake. Appl. Geogr. 2017, 81, 1–12. [Google Scholar] [CrossRef]
- You, L.; Wood, S. Assessing the spatial distribution of crop areas using a cross-entropy method. Int. J. Appl. Earth Obs. Geoinf. 2005, 7, 310–323. [Google Scholar] [CrossRef]
- Peng, C. Research on the Optimization of Temporal and Spatial Distribution of Regional Crop Evapotranspiration and Its Application in Middle Reaches of Heihe River; China Agricultural University: Beijing, China, 2016. [Google Scholar]
- Sahoo, B.; Lohani, A.K.; Sahu, R.K. Fuzzy Multiobjective and Linear Programming Based Management Models for Optimal Land-Water-Crop System Planning. Water Resour. Manag. 2006, 20, 931–948. [Google Scholar] [CrossRef]
- Henseler, M.; Wirsig, A.; Herrmann, S.; Krimly, T.; Dabbert, S. Modeling the impact of global change on regional agricultural land use through an activity-based non-linear programming approach. Agric. Syst. 2009, 100, 31–42. [Google Scholar] [CrossRef]
- Sarker, R.; Ray, T. An improved evolutionary algorithm for solving multi-objective crop planning models. Comput. Electron. Agric. 2009, 68, 191–199. [Google Scholar] [CrossRef]
- Niu, G.; Li, Y.P.; Huang, G.H.; Liu, J.; Fan, Y.R. Crop planning and water resource allocation for sustainable development of an irrigation region in China under multiple uncertainties. Agric. Water Manag. 2016, 166, 53–69. [Google Scholar] [CrossRef]
- Biswas, A.; Pal, B.B. Application of fuzzy goal programming technique to land use planning in agricultural system. Omega 2005, 33, 391–398. [Google Scholar] [CrossRef]
- Liu, J.; Li, Y.P.; Huang, G.H.; Zhuang, X.W.; Fu, H.Y. Assessment of uncertainty effects on crop planning and irrigation water supply using a Monte Carlo simulation based dual-interval stochastic programming method. J. Clean. Prod. 2017, 149, 945–967. [Google Scholar] [CrossRef]
- Liu, X.; Ou, J.; Li, X.; Ai, B. Combining system dynamics and hybrid particle swarm optimization for land use allocation. Ecol. Model. 2013, 257, 11–24. [Google Scholar] [CrossRef]
- Liu, Y.; Wang, H.; Ji, Y.; Liu, Z.; Zhao, X. Land use zoning at the county level based on a multi-objective particle swarm optimization algorithm: A case study from Yicheng, China. Int. J. Environ. Res. Public Health 2012, 9, 2801–2826. [Google Scholar] [CrossRef] [PubMed]
- Yu, J.; Chen, Y.; Wu, J. Modeling and implementation of classification rule discovery by ant colony optimisation for spatial land-use suitability assessment. Comput. Environ. Urban Syst. 2011, 35, 308–319. [Google Scholar] [CrossRef]
- Liu, Y.; Yuan, M.; He, J.; Liu, Y. Regional land-use allocation with a spatially explicit genetic algorithm. Landsc. Ecol. Eng. 2014, 11, 209–219. [Google Scholar] [CrossRef]
- Li, X.; Yeh, A.G.-O. Neural-network-based cellular automata for simulating multiple land use changes using GIS. Int. J. Geogr. Inf. Sci. 2002, 16, 323–343. [Google Scholar] [CrossRef]
- Kullback, S.; Leibler, R.A. On information and sufficiency. Ann. Math. Stat. 1951, 22, 79–86. [Google Scholar] [CrossRef]
- Kullback, S. Information Theory and Statistics; John Wiley: Hoboken, NJ, USA, 1959. [Google Scholar]
- Singh, V.P. Entropy Theory and Its Application in Environmental and Water Engineering; John Wiley & Sons: Hoboken, NJ, USA, 2013. [Google Scholar]
- You, L.; Wood, S.; Wood-Sichra, U. Generating plausible crop distribution maps for Sub-Saharan Africa using a spatially disaggregated data fusion and optimization approach. Agric. Syst. 2009, 99, 126–140. [Google Scholar] [CrossRef]
- You, L.; Wood, S.; Wood-Sichra, U.; Wu, W. Generating global crop distribution maps: From census to grid. Agric. Syst. 2014, 127, 53–60. [Google Scholar] [CrossRef]
- Tan, J.; Yang, P.; Liu, Z.; Wu, W.; Zhang, L.; Li, Z.; You, L.; Tang, H.; Li, Z. Spatio-temporal dynamics of maize cropping system in Northeast China between 1980 and 2010 by using spatial production allocation model. J. Geogr. Sci. 2014, 24, 397–410. [Google Scholar] [CrossRef]
- You, L.; Wood, S. An entropy approach to spatial disaggregation of agricultural production. Agric. Syst. 2006, 90, 329–347. [Google Scholar] [CrossRef]
- Li, M.; Guo, P.; Singh, V.P.; Yang, G. An uncertainty-based framework for agricultural water-land resources allocation and risk evaluation. Agric. Water Manag. 2016, 177, 10–23. [Google Scholar] [CrossRef]
- Hao, L.; Su, X. Determination for suitable scale of oasis and cultivated land in middle reaches of Heihe River basin. Trans. Chin. Soc. Agric. Eng. 2015, 31, 262–268. [Google Scholar]
- Li, X.; Tong, L.; Niu, J.; Kang, S.; Du, T.; Li, S.; Ding, R. Spatio-temporal distribution of irrigation water productivity and its driving factors for cereal crops in Hexi Corridor, Northwest China. Agric. Water Manag. 2017, 179, 55–63. [Google Scholar] [CrossRef]
- Zhong, B.; Ma, P.; Nie, A.; Yang, A.; Yao, Y.; Lü, W.; Zhang, H.; Liu, Q. Land cover mapping using time series HJ-1/CCD data. Sci. China Earth Sci. 2014, 57, 1790–1799. [Google Scholar] [CrossRef]
- Zhong, B.; Yang, A.; Nie, A.; Yao, Y.; Zhang, H.; Wu, S.; Liu, Q. Finer resolution land-cover mapping using multiple classifiers and multisource remotely sensed data in the Heihe river basin. IEEE J. Sel. Top. Appl. Earth Obs. Remote Sens. 2015, 1–20. [Google Scholar] [CrossRef]
- Shannon, C.E. A mathematical theory of communication, Part I, Part II. Bell Syst. Tech. J. 1948, 27, 623–656. [Google Scholar] [CrossRef]
- Jaynes, E.T. Information Theory and Statistical Mechanics. Phys. Rev. 1957, 106, 620–630. [Google Scholar] [CrossRef]
- Tan, J.; Li, Z.; Yang, P.; Liu, Z.; Li, Z.; Zhang, L.; Wu, W.; You, L.; Tang, H. Spatiotemporal changes of maize sown area and yield in Northeast China between 1980 and 2010 using spatial production allocation model. Acta Geogr. Sin. 2014, 69, 353–364. [Google Scholar]
- Tang, P.; Yang, P.; Chen, Z. Using cross-entropy method simulates spatial distribution of rice in Northeast China. Trans. Chin. Soc. Agric. Eng. 2013, 29, 96–104. [Google Scholar]
- Liu, Z.; Li, Z.; Tang, P.; Li, Z.; Wu, W.; Yang, P.; You, L.; Tang, H. Change analysis of rice area and production in China during the past three decades. J. Geogr. Sci. 2013, 23, 1005–1018. [Google Scholar] [CrossRef]
Figure 1.
Location of study area in China.
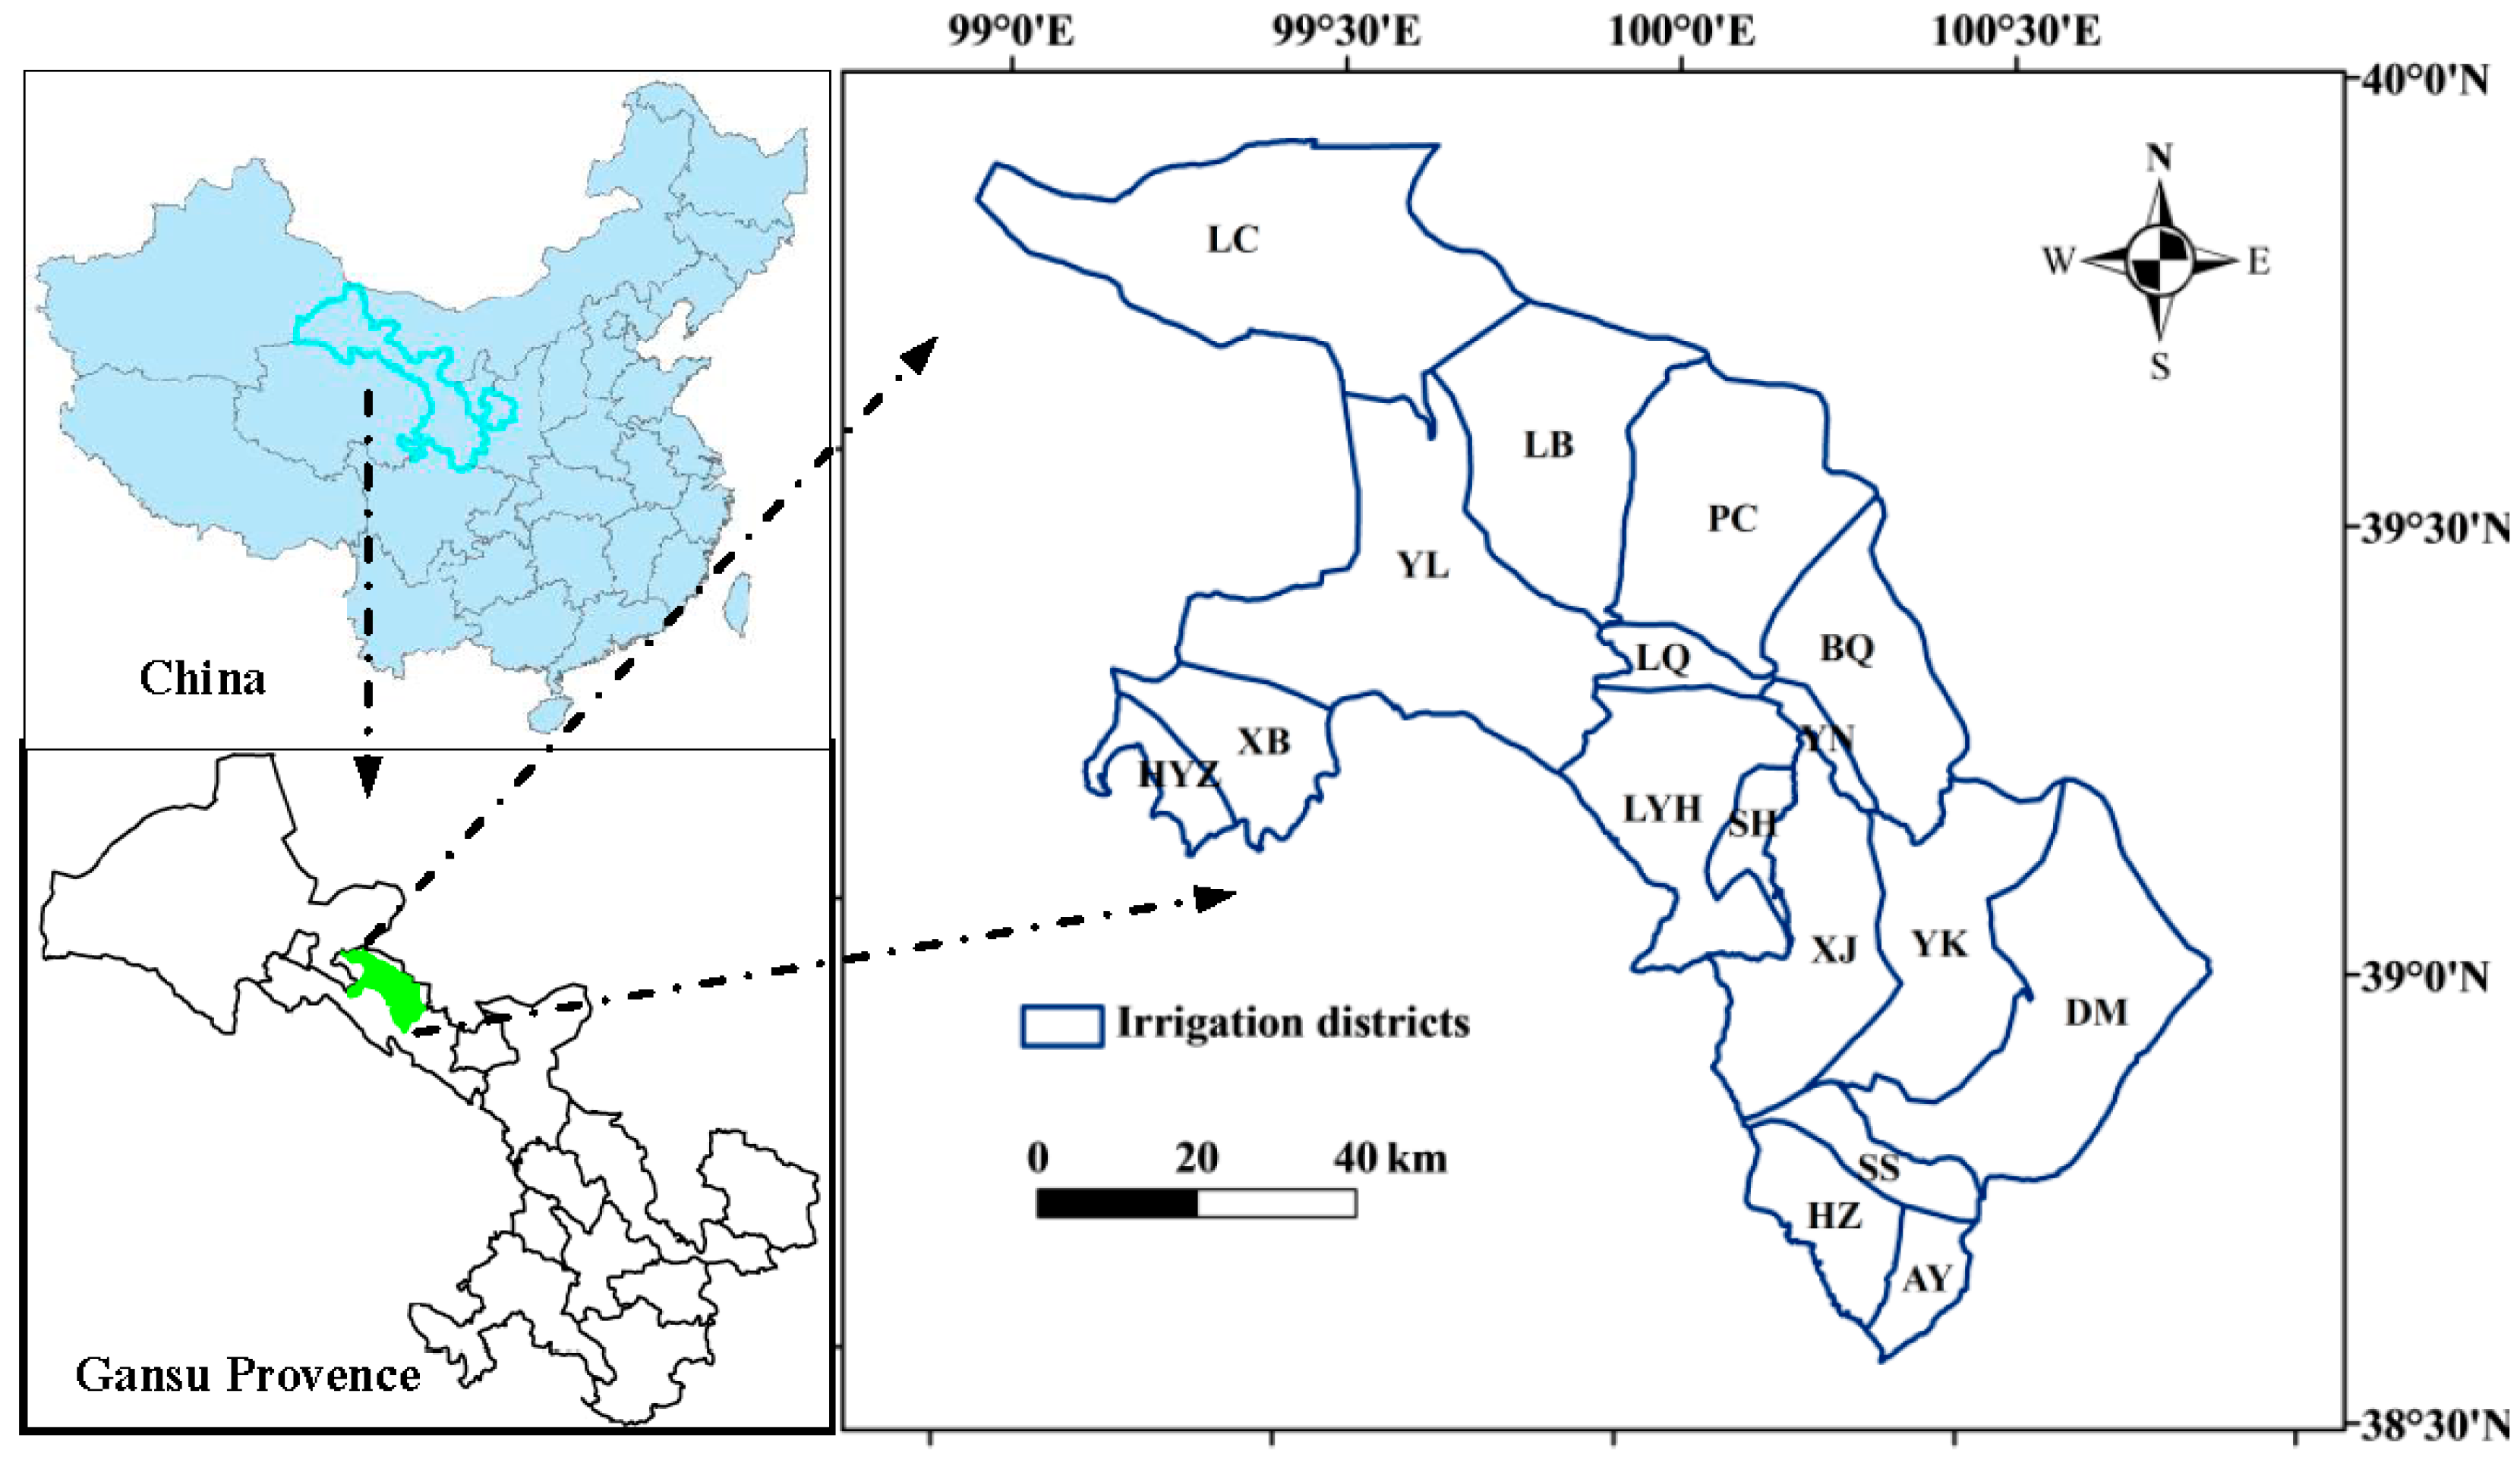
Figure 2.
Overview of integrated agricultural cropping spatial distribution optimization model.

Figure 3.
Spatial distribution of crop planting suitability index [19].
Figure 3.
Spatial distribution of crop planting suitability index [19].

Figure 4.
Overview of comprehensive suitable planting spatial distribution.

Figure 5.
Development of maize comprehensive suitable planting spatial distribution.
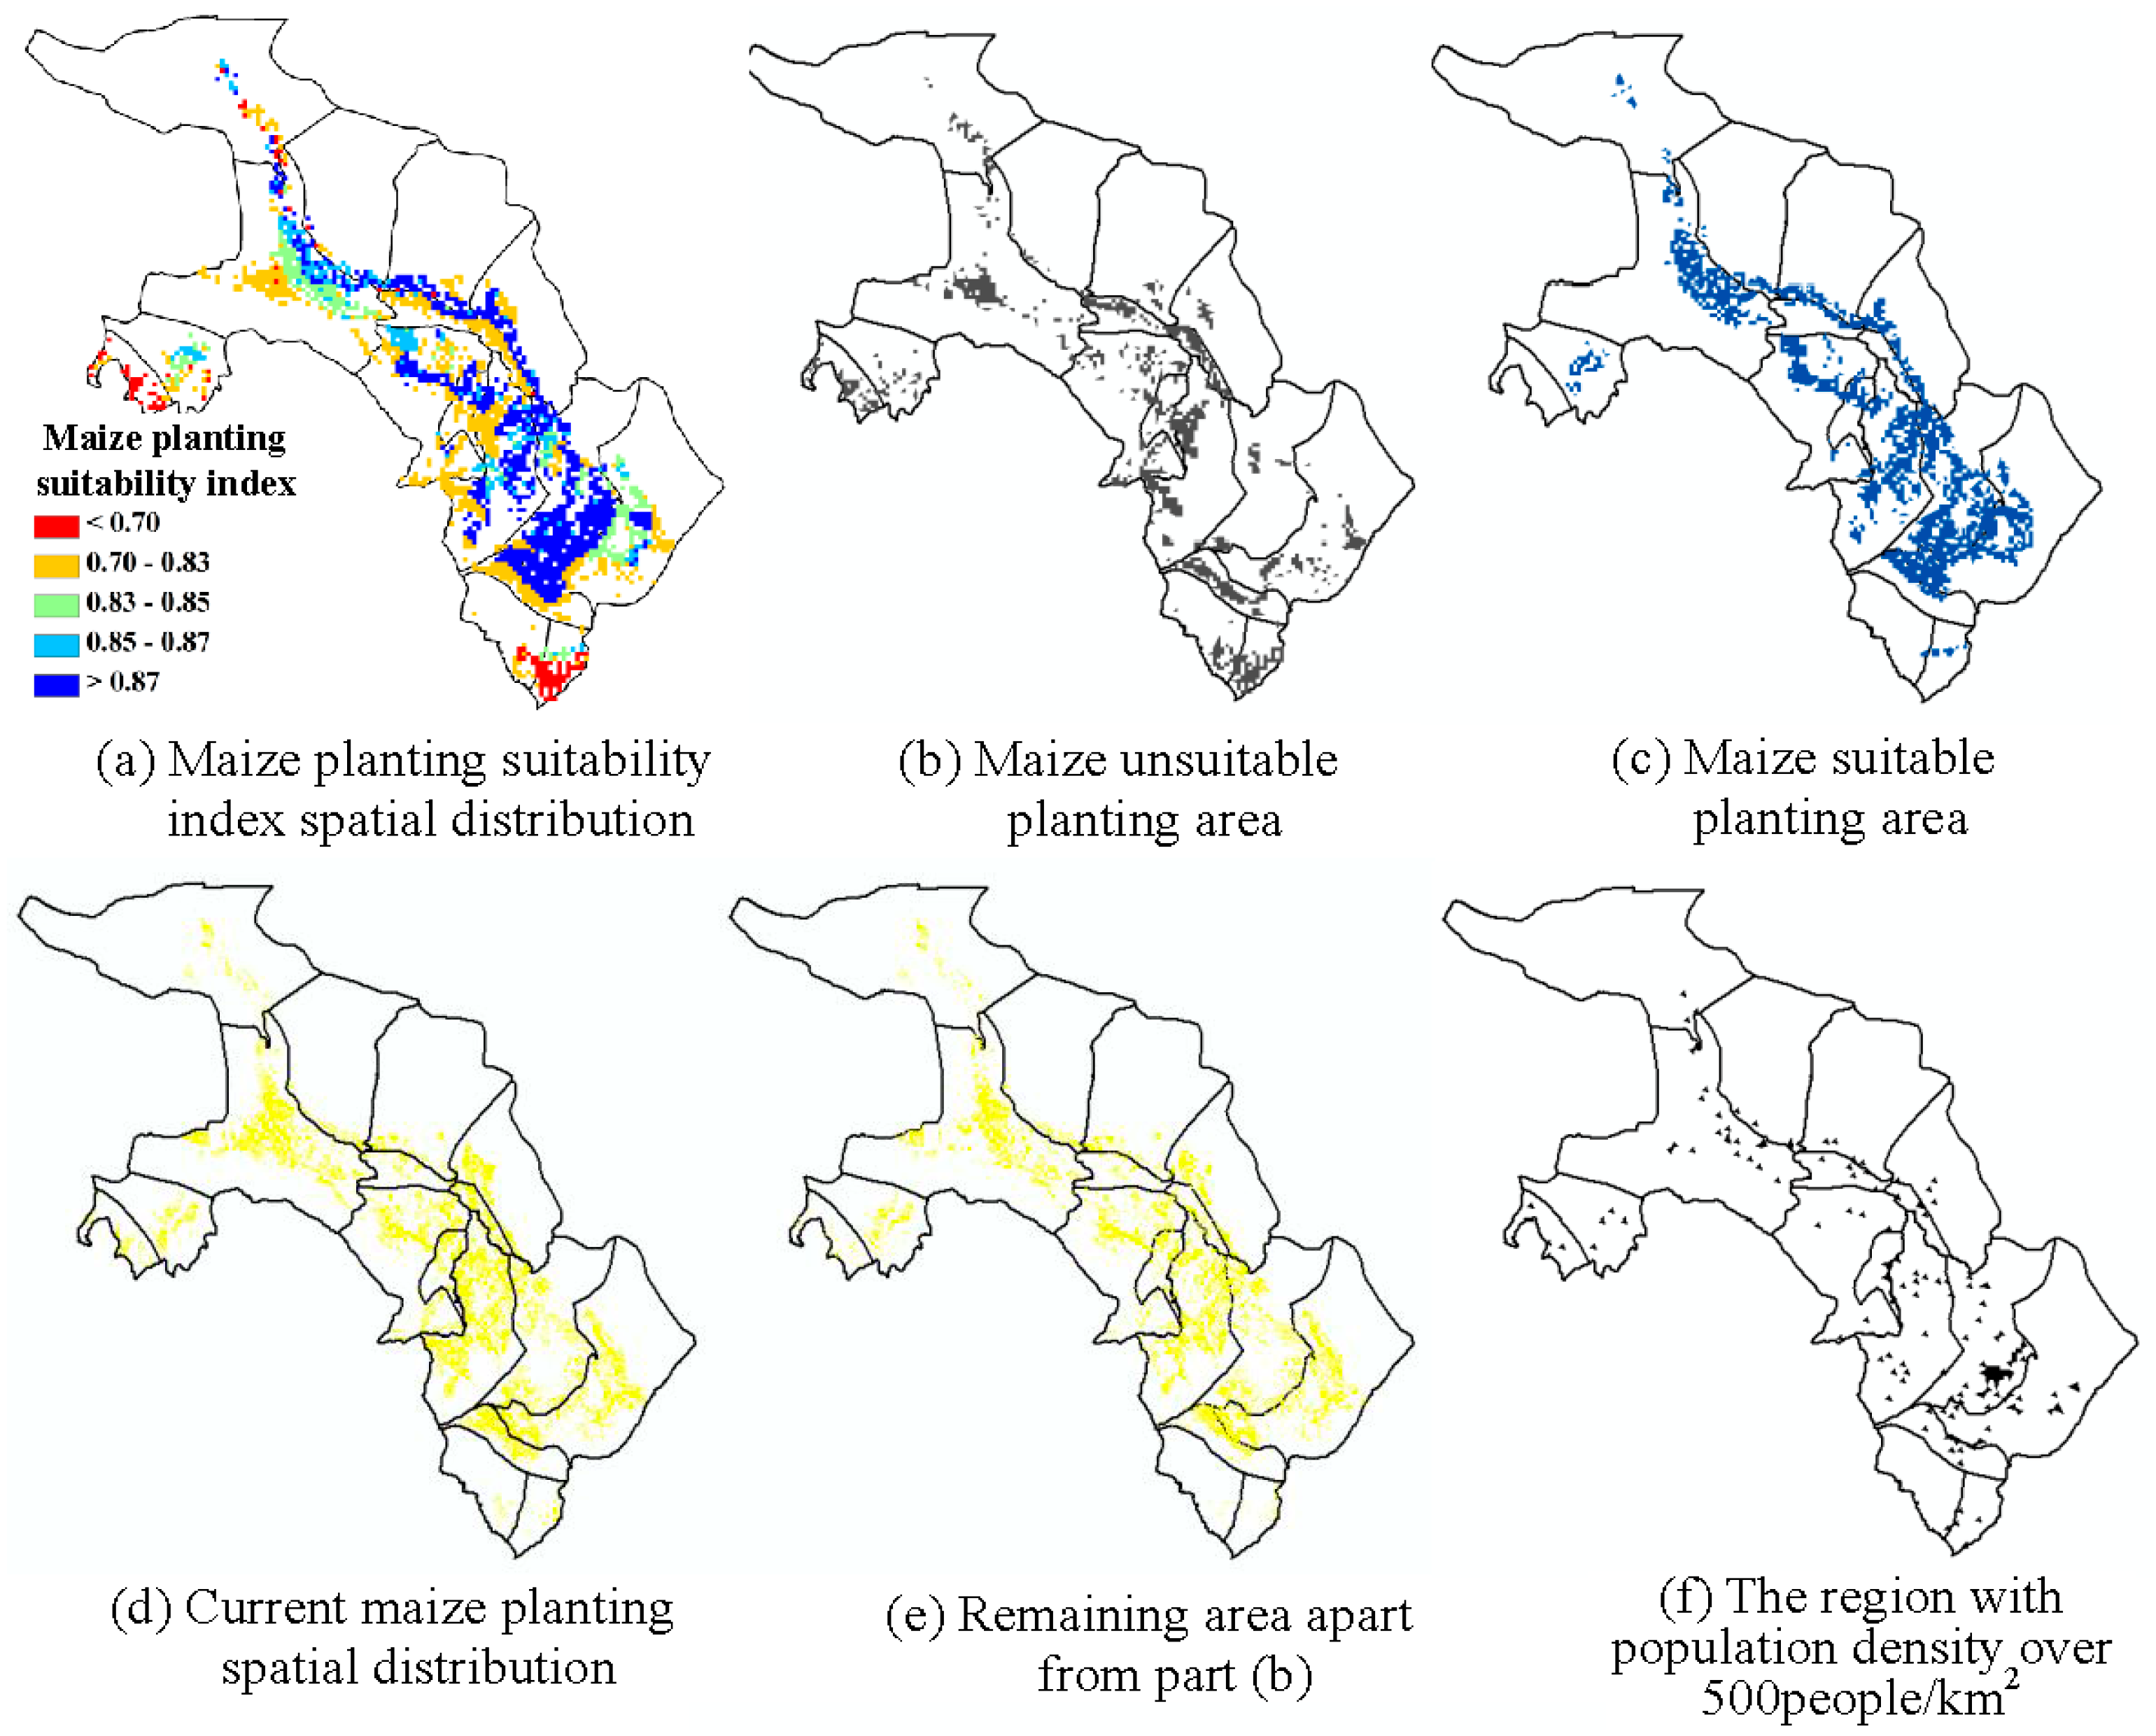

Figure 6.
Development of wheat comprehensive suitable planting spatial distribution.

Figure 7.
Comparison of maize area spatial distribution between present and optimal allocations.
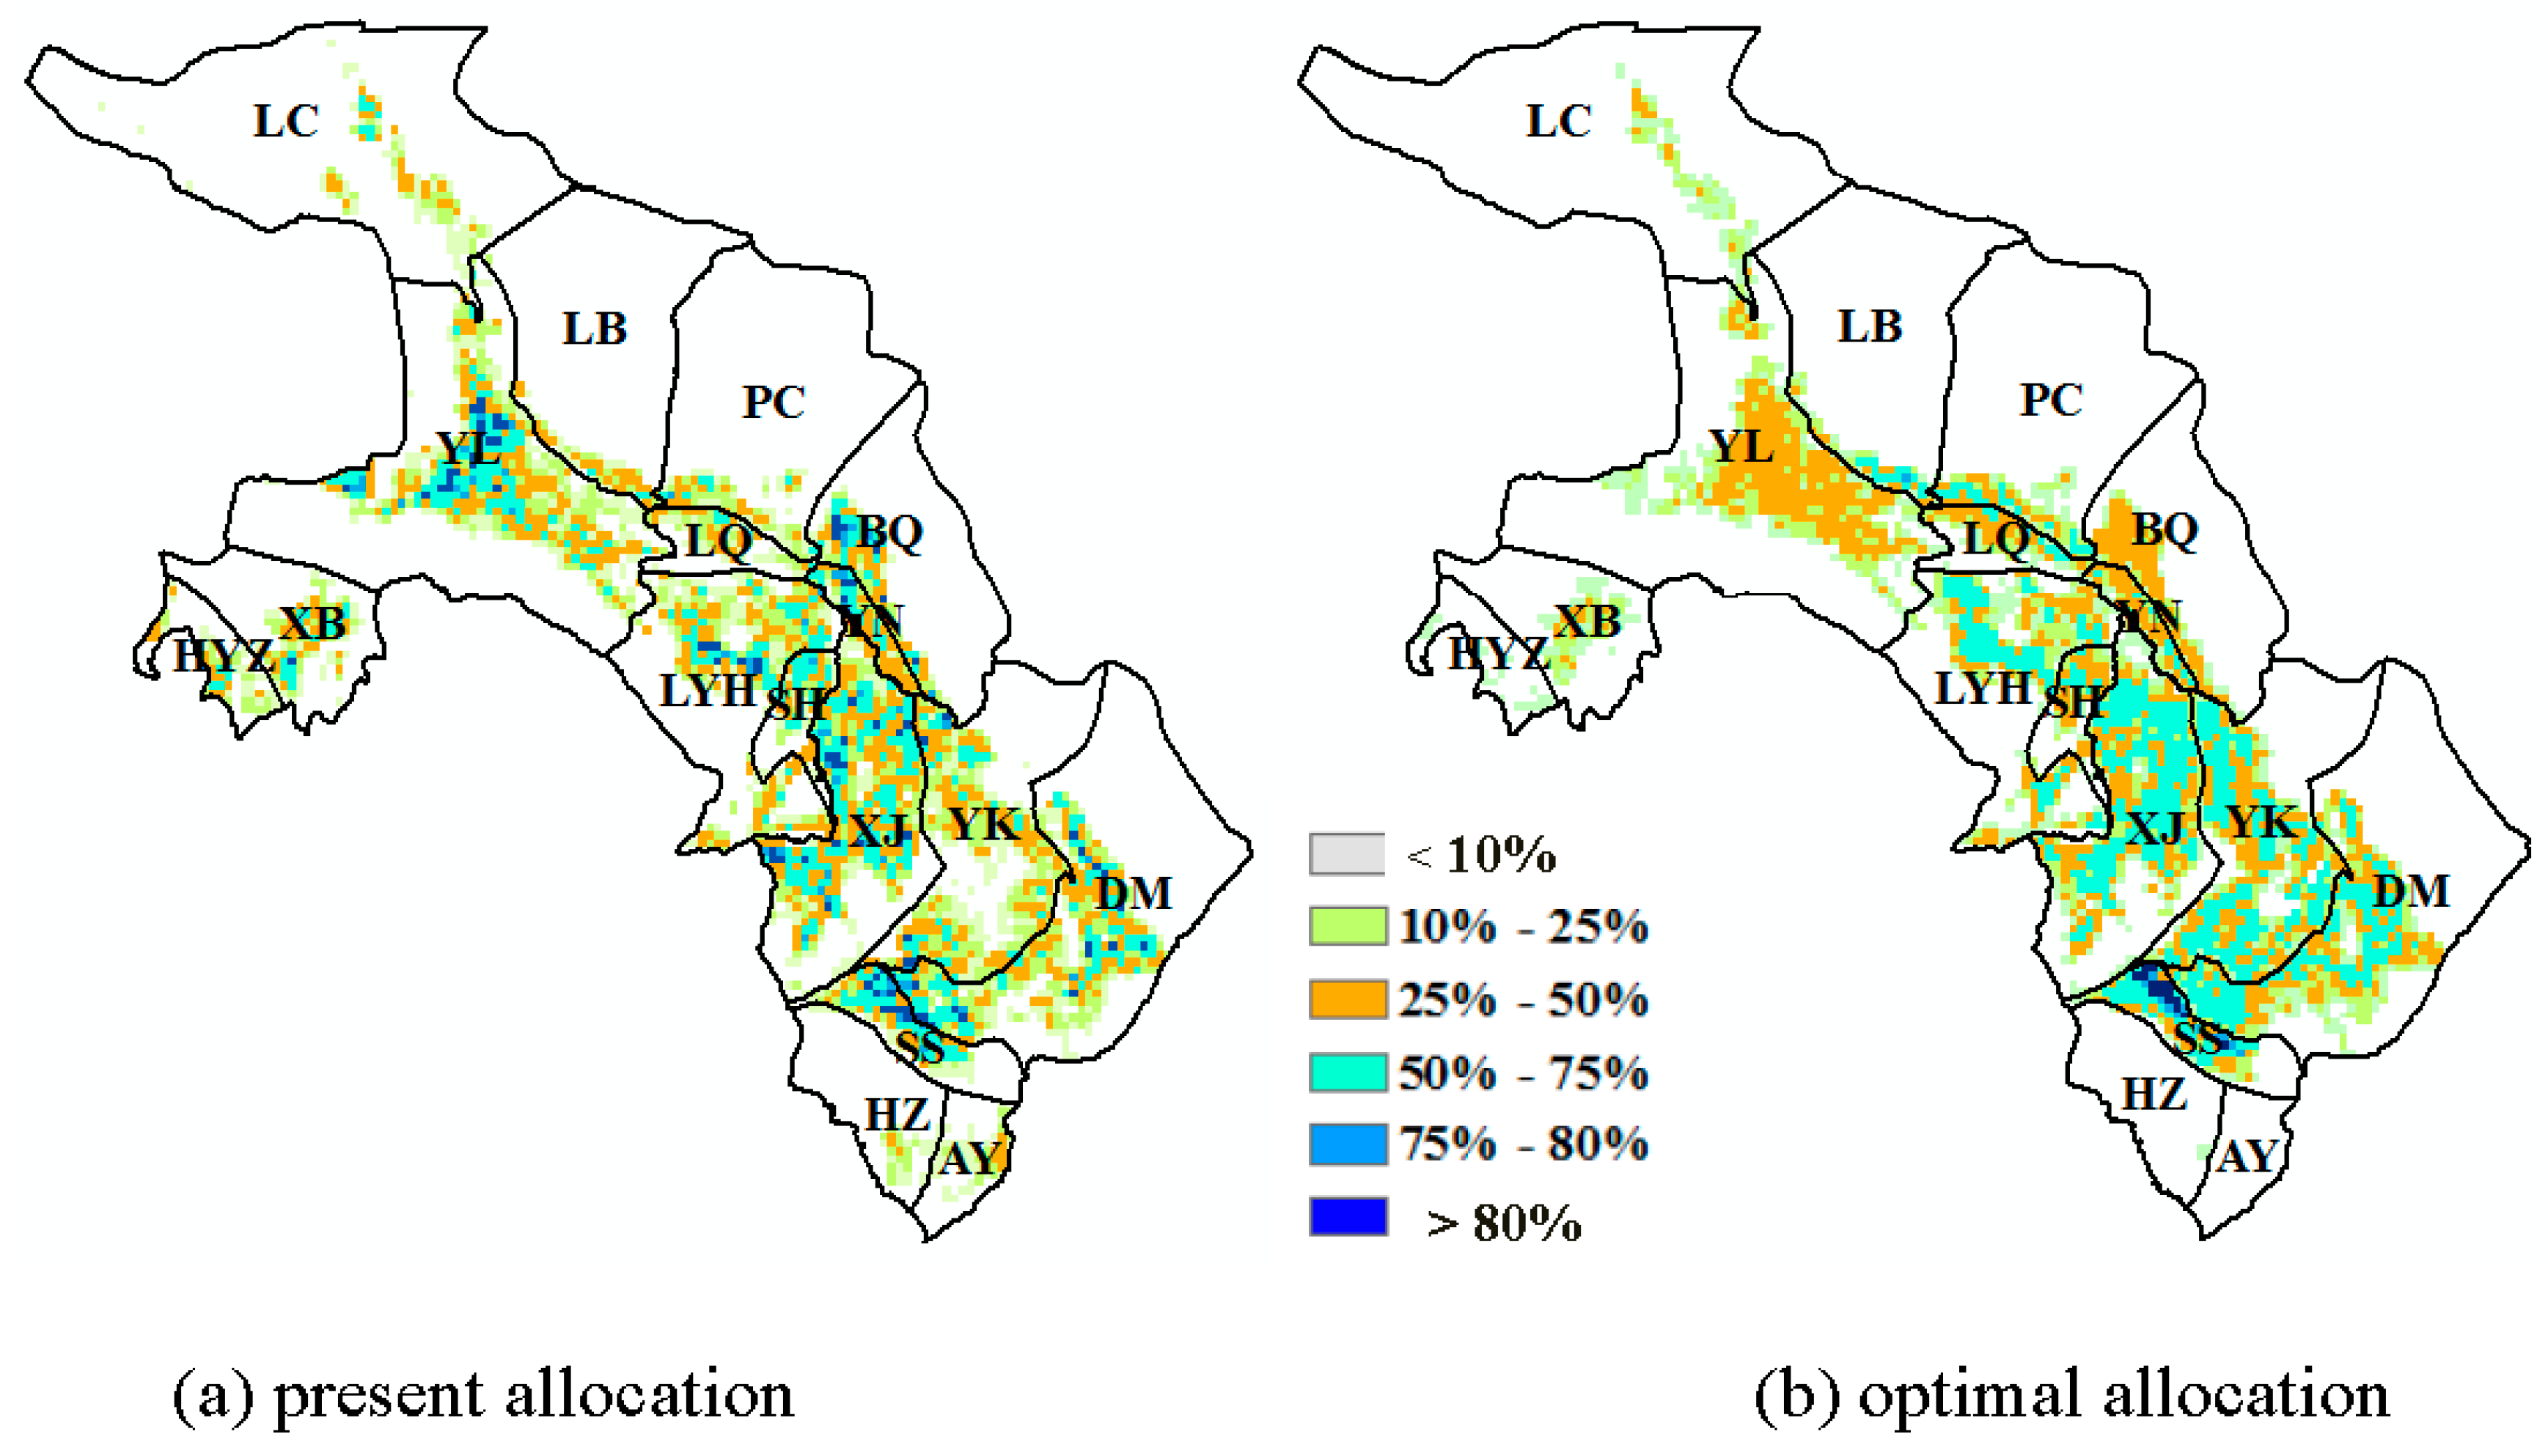
Figure 8.
Comparison of wheat area spatial distribution between present and optimal allocations.


Table 1.
Comparison of crop structure between present and optimal allocation (ha).
| Maize | Wheat | Potato | Seed Maize | Cotton | Oil Crops | Vegetable | Sum | |
|---|---|---|---|---|---|---|---|---|
| Actual situation | 19,680 | 14,241 | 794 | 75,252 | 3573 | 1116 | 11,258 | 125,915 |
| Optimization | 14,111 | 12,818 | 725 | 82,785 | 4174 | 990 | 10,375 | 125,977 |
Table 2.
Comparison of maize and wheat area between present and optimal allocations in different irrigation district (ha).
Table 2.
Comparison of maize and wheat area between present and optimal allocations in different irrigation district (ha).
| Irrigation Districts | Maize | Wheat | ||
|---|---|---|---|---|
| Actual Situation | Optimization | Actual Situation | Optimization | |
| DM | 11,805 | 14,614 | 160 | 167 |
| YK | 15,049 | 17,106 | 1053 | 1067 |
| XJ | 17,598 | 17,567 | 579 | 400 |
| SS | 6474 | 6421 | 87 | 78 |
| AY | 13 | 18 | 561 | 545 |
| HZ | 0 | 30 | 353 | 199 |
| PC | 3013 | 3000 | 1180 | 1268 |
| LQ | 2367 | 2433 | 1253 | 749 |
| BQ | 3900 | 3931 | 167 | 204 |
| YN | 2113 | 2331 | 947 | 679 |
| SH | 2873 | 2210 | 1007 | 924 |
| LYH | 10,220 | 10,433 | 3707 | 3850 |
| YL | 14,540 | 12,412 | 867 | 800 |
| LB | 1880 | 1882 | 56 | 52 |
| LC | 1400 | 1303 | 13 | 73 |
| XB | 1593 | 1080 | 640 | 585 |
| HYZ | 93 | 125 | 1613 | 1177 |
| Sum | 94,932 | 96,896 | 14,241 | 12,817 |
Table 3.
Area of maize planting suitability index.
| Maize Planting Suitability Index | 0.83–0.84 | 0.84–0.85 | 0.85–0.86 | 0.86–0.87 | 0.87–0.88 | 0.88–0.89 | 0.89–0.9 | 0.9–0.92 | Sum |
|---|---|---|---|---|---|---|---|---|---|
| Area (ha) | 11,295 | 8242 | 7006 | 11,579 | 30,977 | 22,851 | 8899 | 2486 | 103,337 |
Table 4.
Area of wheat planting suitability index.
| Wheat Planting Suitability Index | 0.88–0.89 | 0.89–0.90 | Sum |
|---|---|---|---|
| Area (ha) | 16,942 | 3373 | 20,315 |
© 2017 by the authors. Licensee MDPI, Basel, Switzerland. This article is an open access article distributed under the terms and conditions of the Creative Commons Attribution (CC BY) license (http://creativecommons.org/licenses/by/4.0/).
Share and Cite
MDPI and ACS Style
Hao, L.; Su, X.; Singh, V.P.; Ayantobo, O.O. Spatial Optimization of Agricultural Land Use Based on Cross-Entropy Method. Entropy 2017, 19, 592. https://doi.org/10.3390/e19110592
AMA Style
Hao L, Su X, Singh VP, Ayantobo OO. Spatial Optimization of Agricultural Land Use Based on Cross-Entropy Method. Entropy. 2017; 19(11):592. https://doi.org/10.3390/e19110592
Chicago/Turabian StyleHao, Lina, Xiaoling Su, Vijay P. Singh, and Olusola O. Ayantobo. 2017. "Spatial Optimization of Agricultural Land Use Based on Cross-Entropy Method" Entropy 19, no. 11: 592. https://doi.org/10.3390/e19110592
Note that from the first issue of 2016, this journal uses article numbers instead of page numbers. See further details here.