An Entropy Based Low-Cycle Fatigue Life Prediction Model for Solder Materials

School of Mechanics and Civil Engineering, Northwestern Polytechnical University, Xi’an 710072, China
*
Author to whom correspondence should be addressed.
Entropy 2017, 19(10), 503; https://doi.org/10.3390/e19100503
Submission received: 11 August 2017
/
Revised: 8 September 2017
/
Accepted: 14 September 2017
/
Published: 25 September 2017
(This article belongs to the Special Issue Thermodynamics in Material Science)
Abstract
:Fatigue damage is an irreversible progression which can be represented by the entropy increase, and it is well known that the second law of thermodynamics can describe an irreversible process. Based on the concept of entropy, the second law of thermodynamics can provide the changing direction of system. In the current study, a new entropy increment model is developed based on the frame work of continuum damage mechanics. The proposed model is applied to determine the entropy increment during the fatigue damage process. Based on the relationship between entropy and fatigue life, a new fatigue life prediction model is proposed with clear physical meaning. To verify the proposed model, eight groups of experiments were performed with different aging and experimental conditions. The theoretical predictions show good agreement with the experimental data. It is noted that with higher aging temperatures, the value of becomes larger and the residual fatigue life reduces. The value of goes larger and the residual fatigue life becomes shorter with higher strain amplitude.
1. Introduction
In the past decades, fatigue of materials has been studied extensively with respect to crack nucleation, propagation and fatigue life prediction under cycle loading [1,2,3,4,5]. Numerous of theoretical models have been proposed based on statistics or empirical methods [6,7,8,9] and the models adopted in industry are usually empirical. The physical mechanism of fatigue damage and life prediction models still requires further research.
The methods to predict fatigue life of materials can be generally divided into four types: stress-based, strain-based, energy-based and damage-based method. The stress-based method was initially proposed by Wöhler et al. [10] to investigate the strength of steel railway axles subjected to cyclic loads, they found that the fatigue life can be predicted by an exponential relation with the applied stress (S-N curve). This method was successfully applied in low amplitude cyclic stress and high-cycle fatigue. The strain-based method proposed by Coffin and Manson [10] also adopted an exponential relation (Coffin–Manson curve), plastic strain is considered and this method usually being applied to high stress amplitude or low-cycle fatigue with stress concentrations in structures. The energy-based method utilized the elastic energy, plastic strain energy or total absorbed energy as the parameters to develop the fatigue life prediction models [11], most of them are exponential type relations as well. For the damage-based method, the life prediction models were proposed according to the damage mechanics, such as Miner’s rule. Recently, Basaran et al. [12,13,14,15] proposed a thermodynamic framework based on damage mechanics to describe the mechanical behavior of microelectronics packaging.
Most of the current available fatigue life prediction models are based on empirical or semi-empirical methods, i.e., stress-based, strain-based and energy-based methods. By adding the frequency, waveform or temperature parameters, although the aforementioned models can fit experimental data better, the physical meaning of these practice still requires further study. The fatigue damage process has the property of randomness. The defects introduced during the manufacturing process, the difference in surface treatments and the random error introduced during experiments can cause error in fatigue life prediction. Development of new fatigue life prediction model with clearer physical essence is still required.
Recently, the applications of thermodynamic methodology to contact problems with friction [16,17,18] provided a method to introduce the entropy into solid mechanics. Researches have been performed on Mechanothermodynamics for the complex systems working under mechanical fatigue, thermal loading, friction and wear conditions [19,20,21,22]. In these works the specific entropy is assessed as the ratio between the effective energy components and limiting energy. The total entropy of system is assessed by determining the dangerous volumes when effective energy exceeds the threshold value.
Based on the concept of entropy in the second law of thermodynamics, the changing direction of system can be clarified. Fatigue damage is an irreversible progression which can be represented by the entropy increase in the entire fatigue life. In this work, an entropy-based fatigue life prediction method is proposed based on the framework of thermodynamic, damage mechanics and statistical physics. The developed model can be applied to determine the change of entropy during the fatigue damage process. The change of entropy during fatigue process for different materials is determined by experimental analysis. The results show that the increasing trend of entropy is material dependent. From the relation between fatigue life and entropy, a new fatigue life prediction model is developed. To verify the proposed method, a series of experiments were conducted under different aging (72 h at 77 K, 223 K, 293 K and 453 K) and experimental conditions (4%, 6%, 8% of strain and electrified condition). The results show that the theoretical predictions by the proposed model agree well with experimental results.
2. Fatigue Theory
For the irreversible thermodynamics processes, the elastic strain considering damage with the hypothesis of small displacement can be expressed as:
where is the Young’s modulus; is the effective stress and for isotropic damage , is the damage variable and is the stress tensor; is the trace of effective stress tensor; is the Poisson’s ratio; is the Kronecker delta when and when . The summation convention is applied to Equation (1).
Based on the continuum damage mechanics, the dissipation potential function describes the damage state of system. Following the hypothesis of Lemaitre [23] which assumes that there is no coupling between plasticity dissipation potentials and damage, can be defined by:
where and are the deviator of effective stress tensor and kinematic hardening tensor ; is defined as ; is the saturation value of ; is the isotropic hardening stress; is the initial uniaxial yield stress and is the dissipation potential associated to damage process, is the associated damage variable and is the cumulative plastic strain. The expression for which proposed by Bonora [24] is given as following:
where is a material constant; is the damage exponent; is the exponent of Ranberg-Osgood power law relationship; is the value of damage variable when final failure occurs. According to damage mechanics [23], represents the “damage strain energy”:
where is the equivalent von Mises stress, is the hydrostatic stress or mean stress (). For uniaxial loading, the factor .
According to the kinetic law of damage evolution, the damage rate can be obtained by the dissipation potential:
where is the plastic multiplier and associated with cumulative plastic strain rate as: .
For ductile materials, the effective equivalent von Mises stress with the relation of accumulated plastic strain can be obtained from the plastic part of the Ranberg–Osgood power law:
where is a material constant. By substituting Equation (3), (4) and (6) into Equation (5), the rate of damage variable can be obtained:
Recall the relation between plastic multiplier and cumulative plastic strain rate : , Equation (7) can be written in another form:
Or by chain rule:
The damage variable has two threshold values and . The threshold represents the initial value of damage variable presented in material microstructure or the value at the beginning of fatigue damage accumulation. The threshold is the critical value of damage variable when fatigue failure occurs. The corresponding cumulative plastic strain when and are and , respectively. For low-cycle fatigue, the plastic strain will accumulate cycle by cycle, and the cyclic numbers corresponding to and are and , respectively.
Integrating Equation (9) between and gives:
The above derivation is based on thermodynamics theory of damage mechanics for solid materials. The damage variable is related to the cumulative plastic strain and material properties. In Equation (10), is the triaxiality ratio which is an essential parameter to describe the fracture or damage of metallic materials. With the value of increases, the ductility will decrease when fracture occurs. Under the same applied load, different material configuration show an assignable influence on , thus represents the configuration effect on damage variable.
The material degeneration process is an irreversible process which can be predicted by the second law of thermodynamics. In general, the second law of thermodynamics gives the transition direction between different states, evolution forward in time is the direction of increasing entropy [25]. The damage variable has the same trend with entropy although it is an artificially defined quantity. Moreover, measurement of damage requires different physical quantities including the variation of elasticity modulus, micro-hardness, density and electrical resistance etc. Variation of these physical quantities represents the corresponding material microstructure change, and all the measurement can be regarded as the outward manifestation of microstructure change. According to Boltzmann [26], the entropy value represents the logarithm of the molecular configurations number in the state. Both quantities represent the microstructure change in different states, one for an outward manifestation and the other for the essential molecular configurations. In addition, the entropy and damage variable are monotonic changed during the degeneration process. Hence, there is a connection between the damage variable and entropy.
Boltzmann [26] employed statistical mechanics to define a precise meaning to the disorder and established a connection between the disorder and entropy for the whole system as:
where is the Boltzmann constant; is the disorder parameter, which represents the probability of the system to exist in the state relative to all the possible states. In general, is difficult to be determined. A relation between the entropy per unit mass and the disorder parameter was proposed by Basaran et al. [27]:
where is the Avogadro constant, is the specific mass. The disorder function is then given as:
From the definition of entropy, the damage law which connects the damage and entropy can be proposed [12,13,14,27]:
Equation (14) can be rewrote as the same form of Equation (10):
Combining Equation (15) and Equation (10) gives:
Making the logarithm of Equation (16) and take the derivation with time , the entropy change rate which reflects the relation between the entropy and cumulative plastic strain can be determined:
For the uniaxial loading case, and , then Equation (17) can be simplified as:
Integrating Equation (18) gives the increment of entropy during the damage process:
where is the increment of entropy, represents the entropy when plastic damage starts and the corresponding accumulation plastic strain is .
In the research by Naderi et al. [28,29,30,31], the entropy is connected to fatigue life by the following relation:
where is the entropy when fatigue failure occurs, and represent the current state of system between the initiation of fatigue plastic damage and the final failure, respectively.
The term and in Equation (20) can be divided into: and , which means the current entropy can be determined when plastic damage initiates and at the increment afterwards. Hence, Equation (20) has the following form:
In the low cycle fatigue process, and are much less than and , then Equation (21) can be simplified as:
From Equation (19) and Equation (22), an equation to describe the fatigue process can be developed:
In Equation (23), all the parameters have clear physical meaning, and are the physical constants. , , , and are the parameter related to the material properties and can be obtained from the experiments.
3. Experiments
To verify the developed model, the brass (cylindrical, Cu62Zn38)-solder (ball, Sn96.5Ag3.0Cu0.5)-brass (cylindrical, Cu62Zn38) samples were designed and fabricated. By using a V-groove (2 mm in width) quartz glass, two brass cylinders with a diameter of 2 mm were aligned concentrically during reflowing. Two Sn-3.0Ag-0.5Cu (SAC305) solder balls with a diameter of 2 mm were placed between the brass cylinders. The specimens were reflowed for 5 minutes in the lead-free hot air reflow machine.
The fatigue experiments were conducted by using BOSE ElectroForce 3330 test instrument (BOSE, Framingham, MA, USA). The experiments can be divided into three groups: one for the solder joints after aging at different aging temperatures (77 K, 223 K, 293 K and 453 K) for 72 h [5] and tested under the same strain amplitude (6%). Another group is the solder joint aging at cryogenic temperature (77 K) for 360 h and tested under different strain amplitudes (4%, 6% and 8%). The last group electrified the solder joints at room temperature for 72 h with a current density of and tested under a strain amplitude of 6%. All the experiments have the same frequency (1 Hz) and wave form (sine wave). The experimental data of the peak and trough values for each cycle and fifty force-displacement data points of every other cycle were recorded.
4. Results and Discussion
4.1. The Increment of Entropy for Different Materials
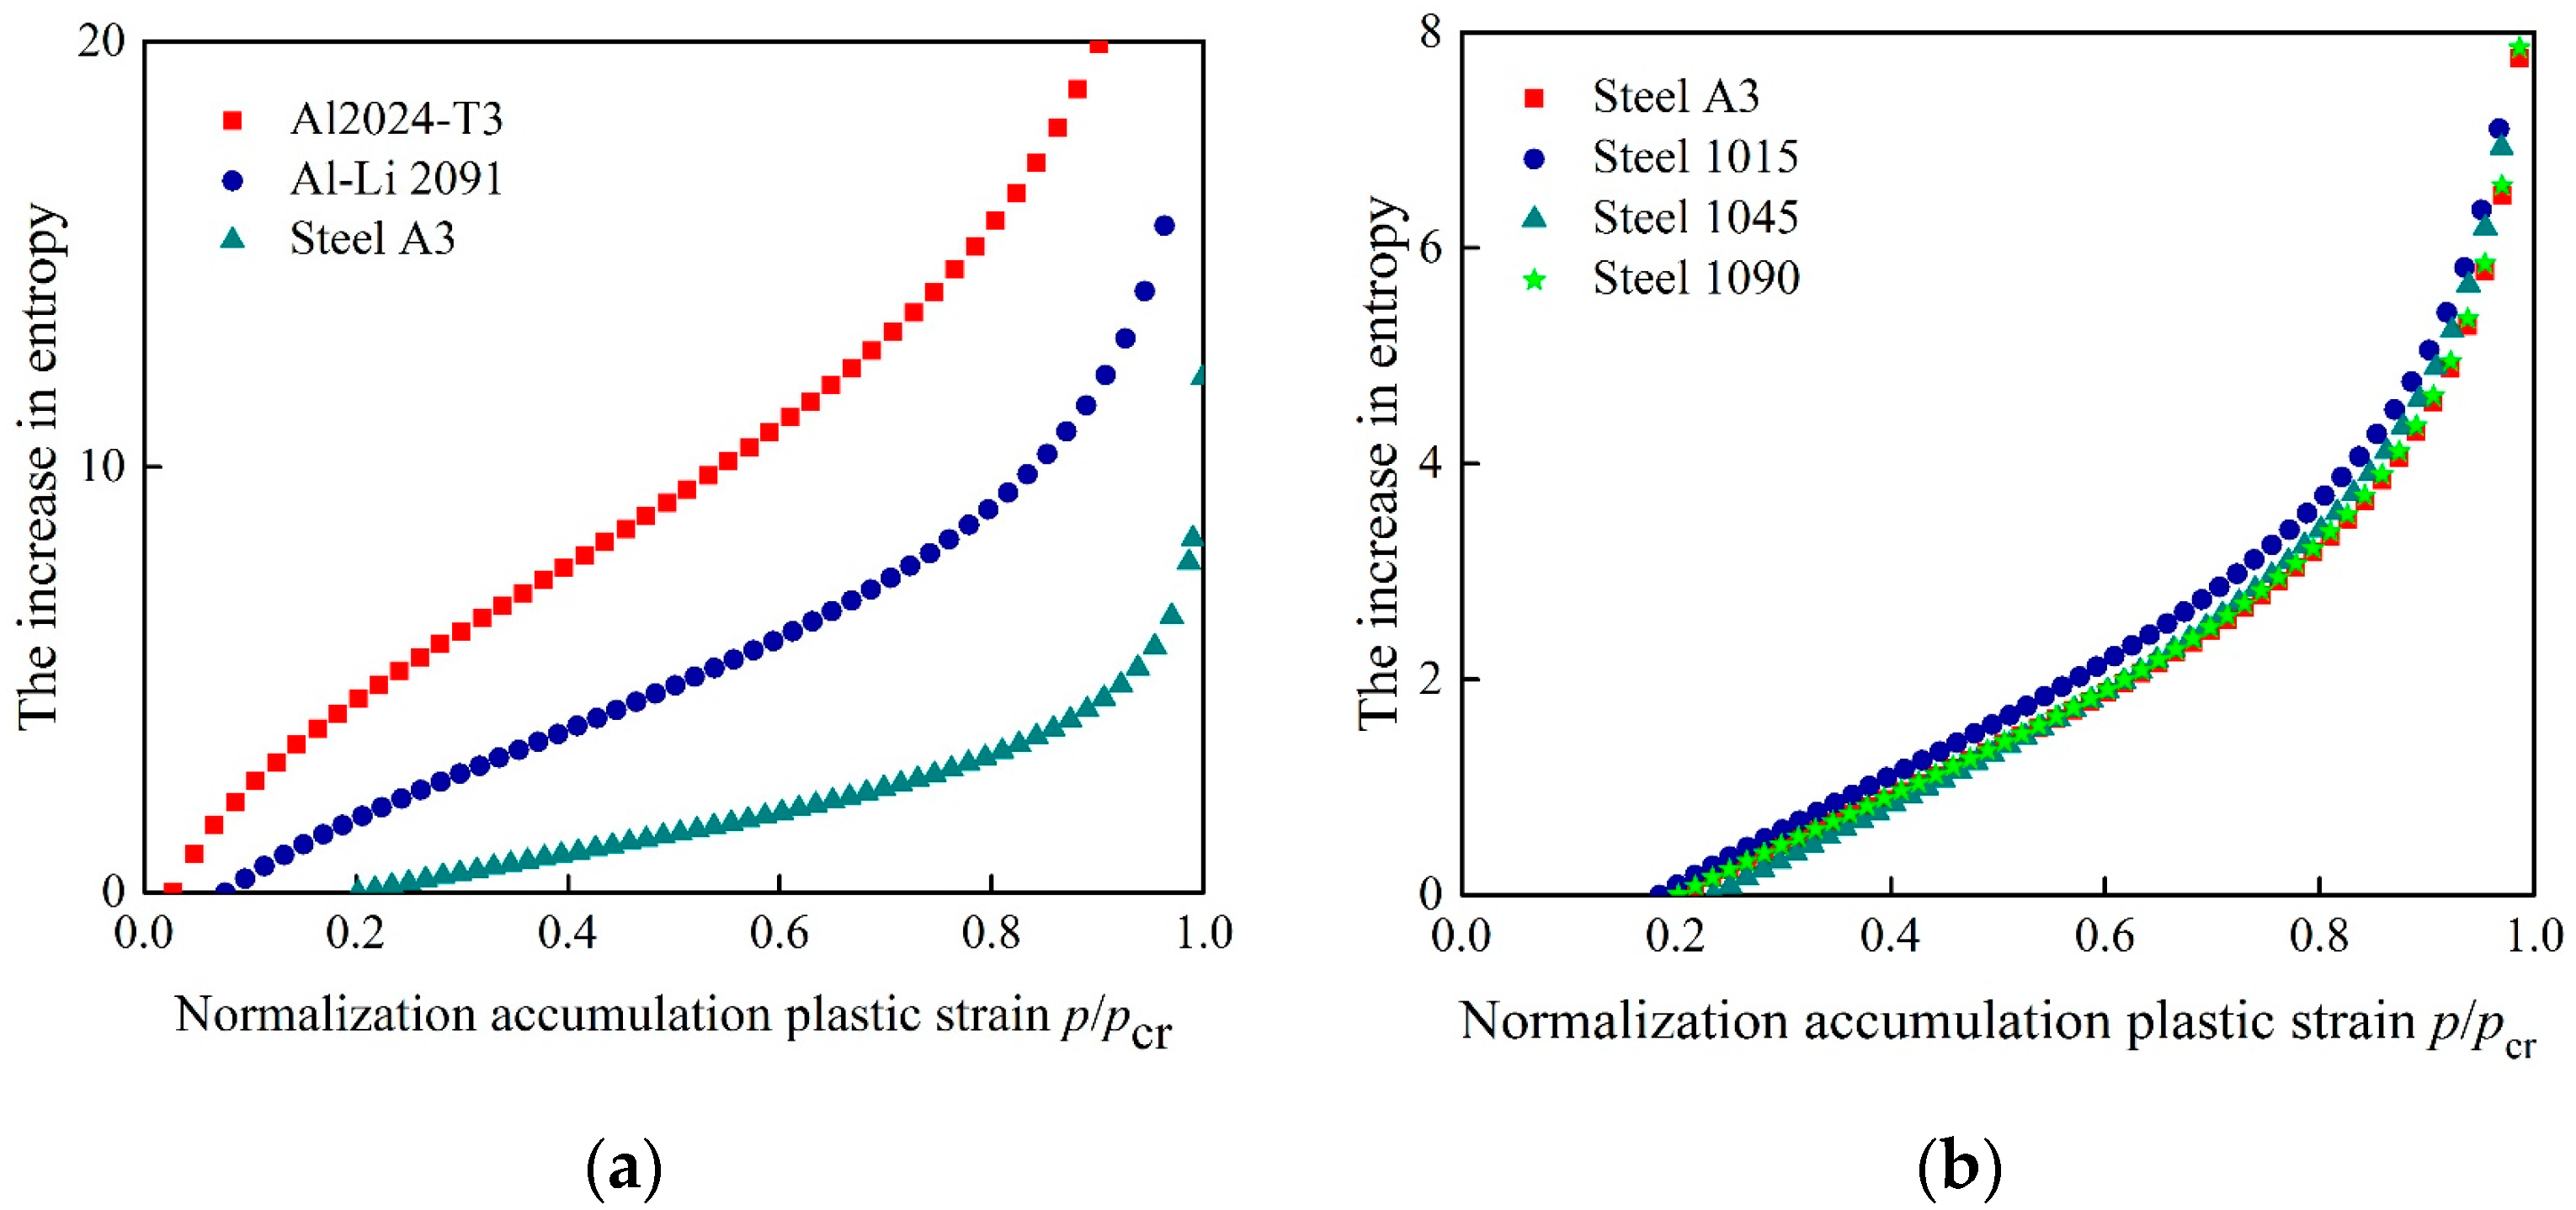
From Equation (19), the increment of entropy during the fatigue process after the initiating of plastic damage can be calculated. The material constant for different Al alloys and steel alloys [32] were adopted to calculate the change of entropy. The material parameters are summarized in Table 1:
Based on Equation (19), the increment of entropy after the plastic damage can be obtained, as shown in Figure 1a,b. It is noted that for different materials, the entropy increment process are quite different. For the same series of materials such as steels, the entropy increment process keeps similar trend, although the material parameters have relatively big difference.
The material parameters of SAC305 solder joints aging at different temperatures (at 77 K, 223 K, 293 K and 453 K) for 72 h and different experimental conditions (with strain amplitude of 4%, 6%, 8% and electrified condition) are summarized in Table 2.
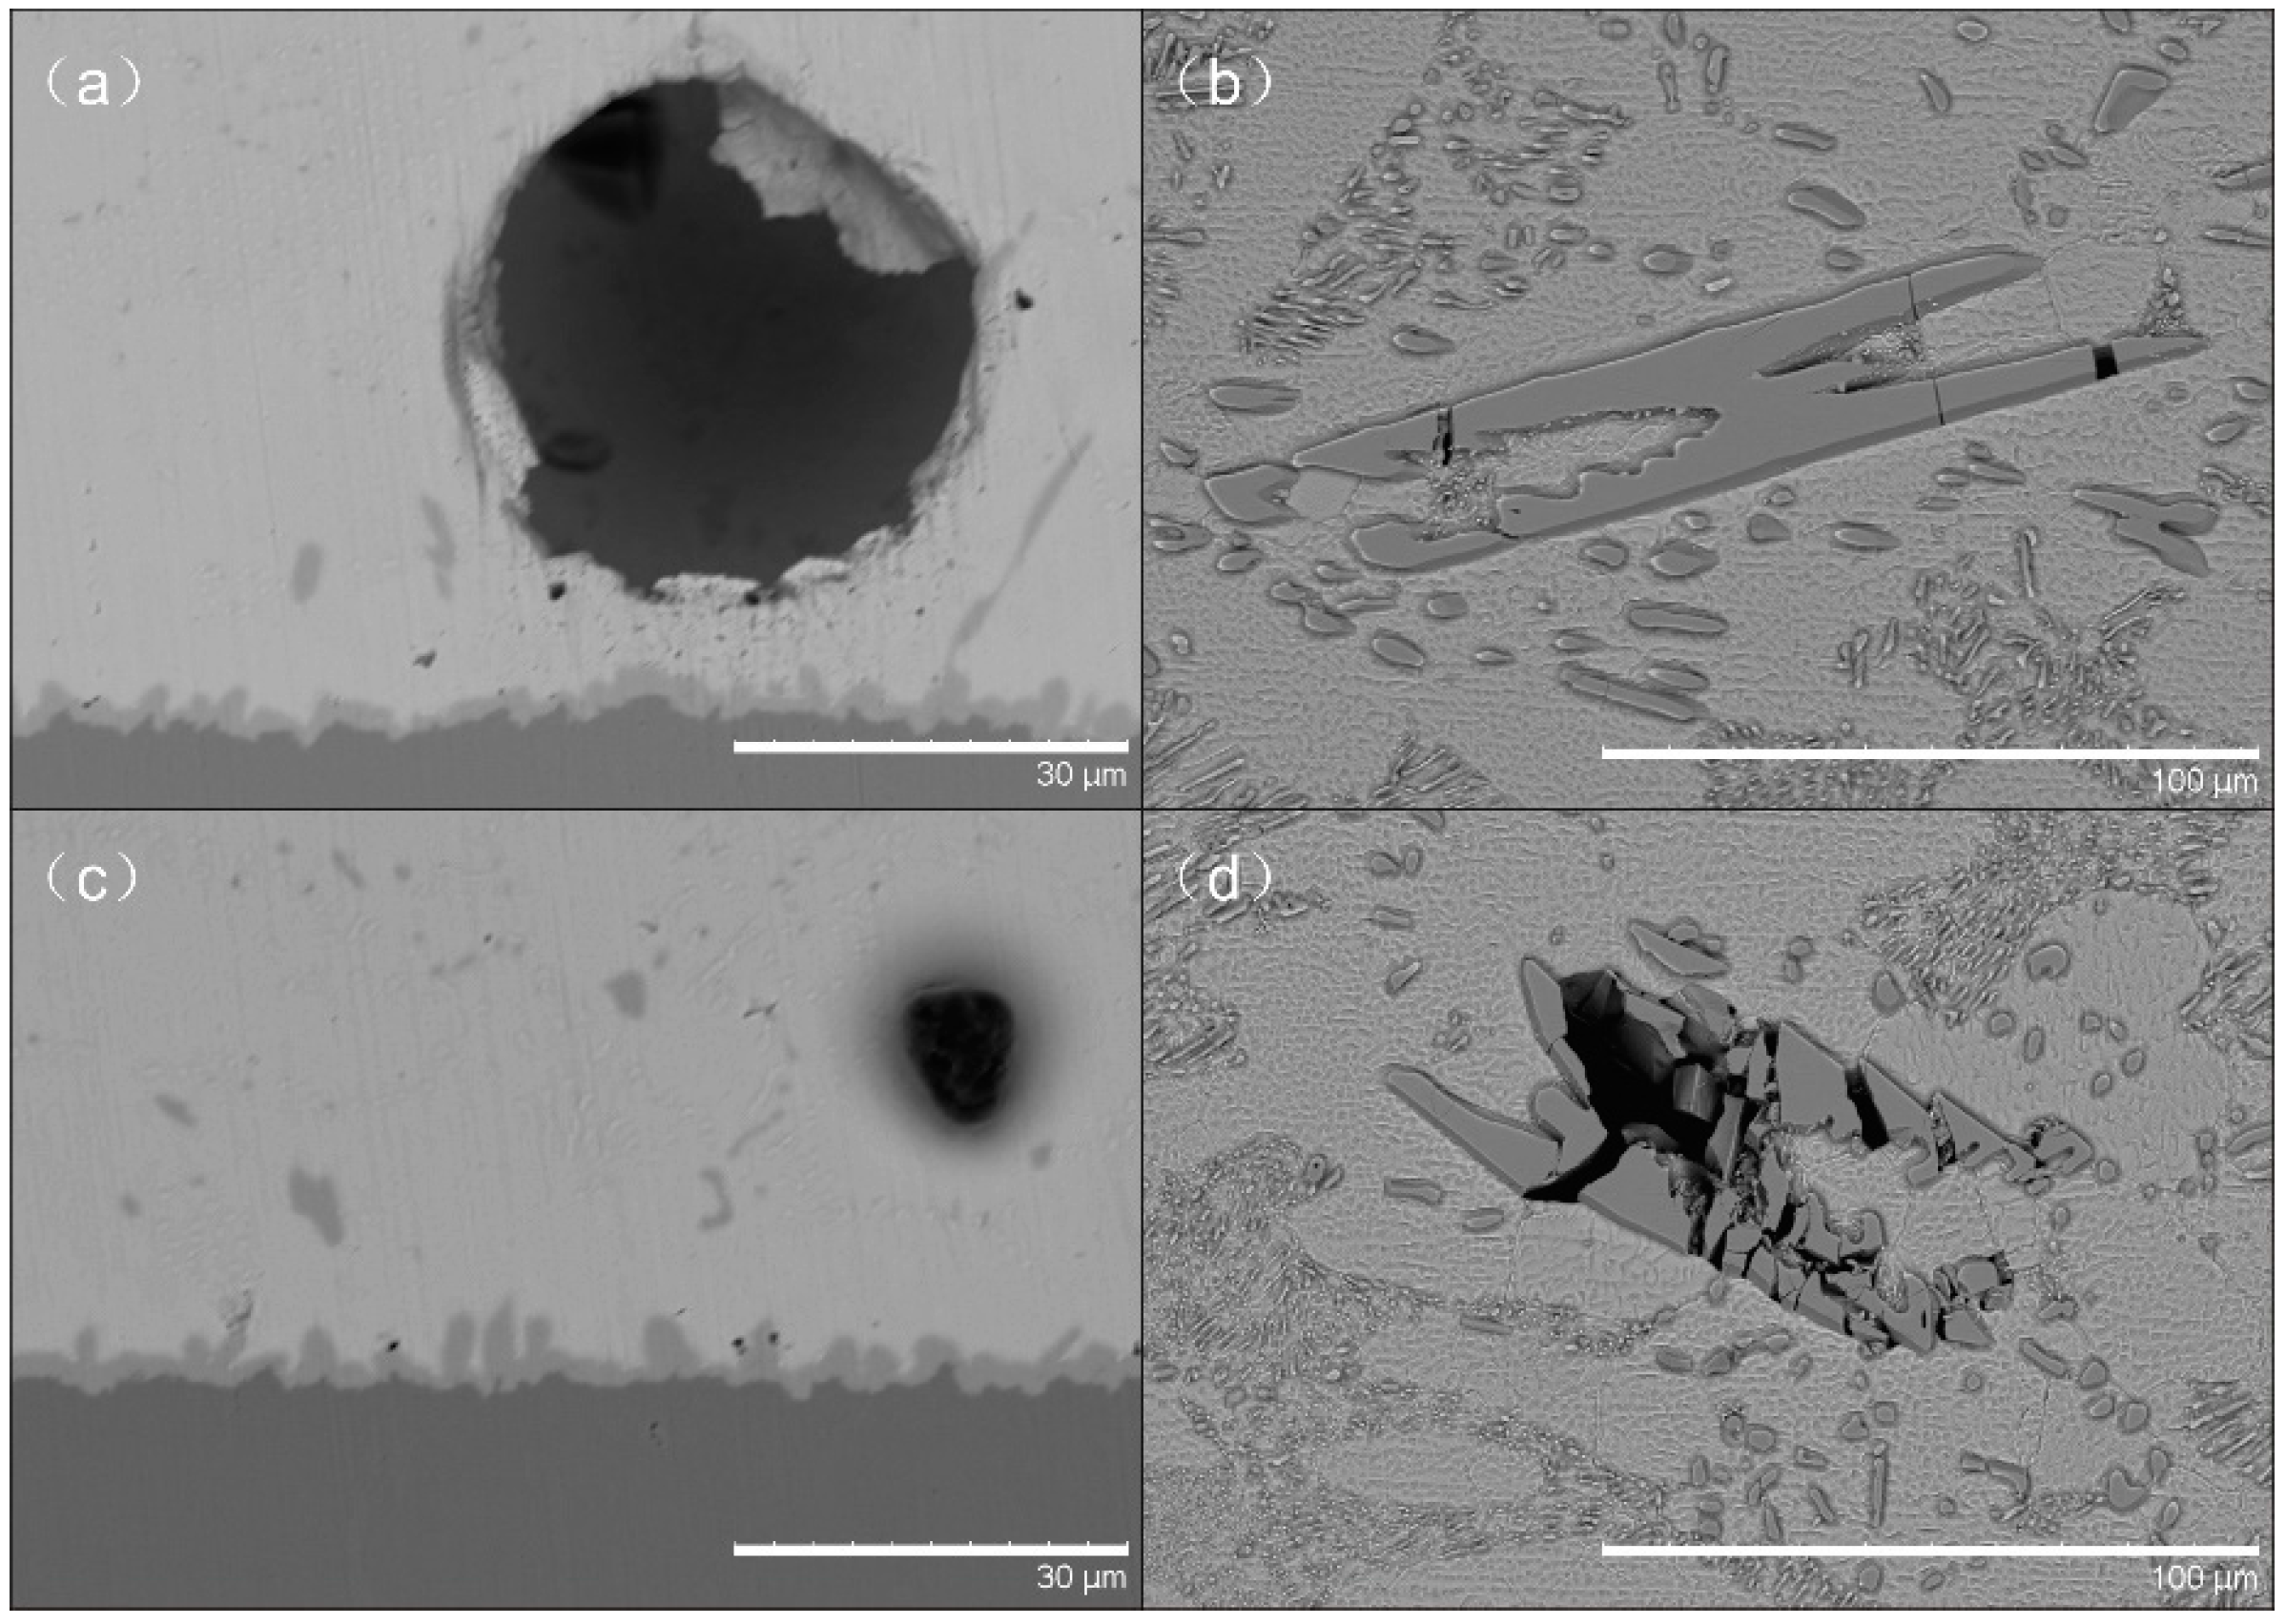
It should be noted that Equation (19) cannot be directly applied because the samples in the current experiments are not standard uniaxial specimen, thus the stress and strain cannot be directly used in the model. In additional, the defects introduced during the manufacturing process and microstructure distribution of intermetallic compound produced during the reflow process cannot be neglected. Figure 2 shows the typical defects and different microstructures of intermetallic compound observed in the experiments.
To take these matters into account, a strain state parameter is added in Equation (19) as following:
where and are the corresponding cumulative plastic strain when and , these two parameters are obtained directly from the experiments; is a dimensionless parameter which considers the defects introduced in the specimen during manufacturing process and different microstructures originated from the change of experimental conditions. By Equation (24), the increment of entropy during the fatigue process after the plastic damage initiation could be obtained, as shown in Figure 3a,b. For SAC305 solder joints, the entropy increment process has similar trend although the material properties and the microstructure have relatively larger difference.
4.2. Fatigue Behavior of Sn-3.0Ag-0.5Cu Solder Joints at Different Temperatures and Experimental Conditions
Based on Equation (23), the fatigue behavior of SAC305 solder joints at different temperatures and experimental conditions can be described. The parameter similar to Equation (24) is added in Equation (23) as following:
where , and are the cumulative plastic stain in experiments, During the verification process, the Avogadro constant , the specific mass , the Boltzmann constant , the damage exponent in the experiments can be determined by the method introduced by Bonora [32]. The parameter and can be obtained from Equation (25).
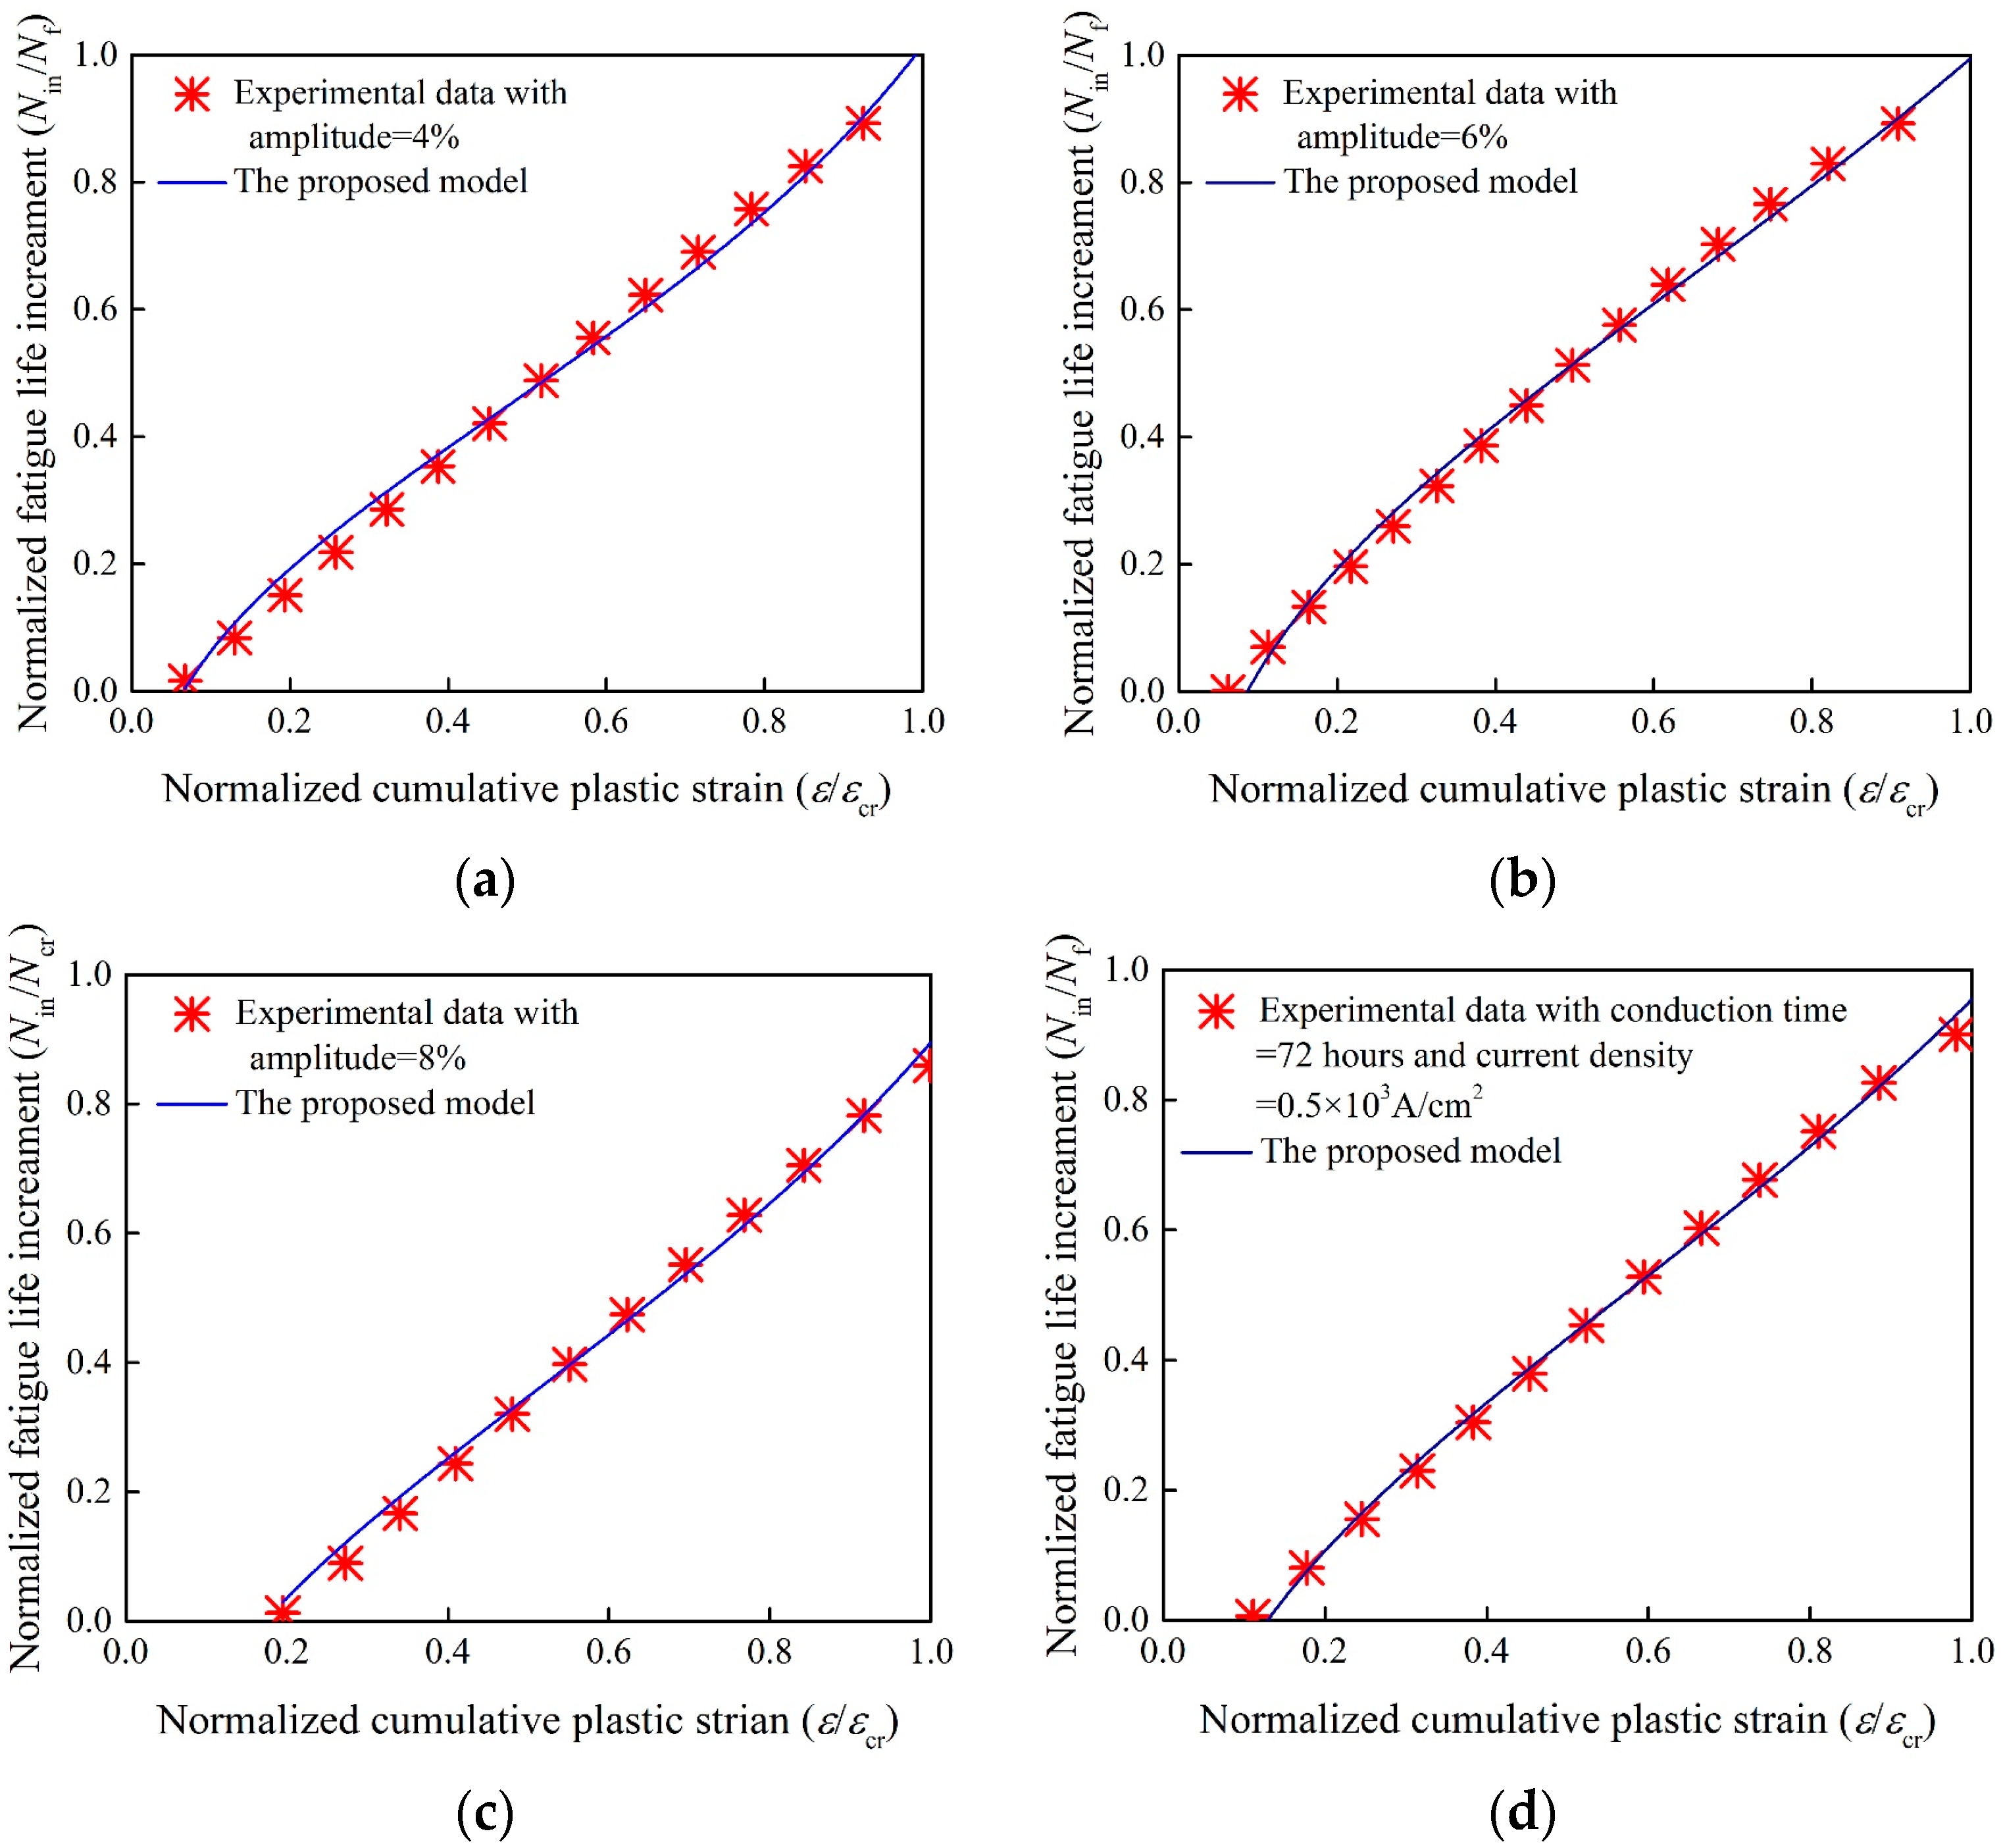
To verify Equation (25), eight set of experimental data were adopted and the results are shown in Figure 4, Figure 5, Figure 6 and Figure 7, respectively.
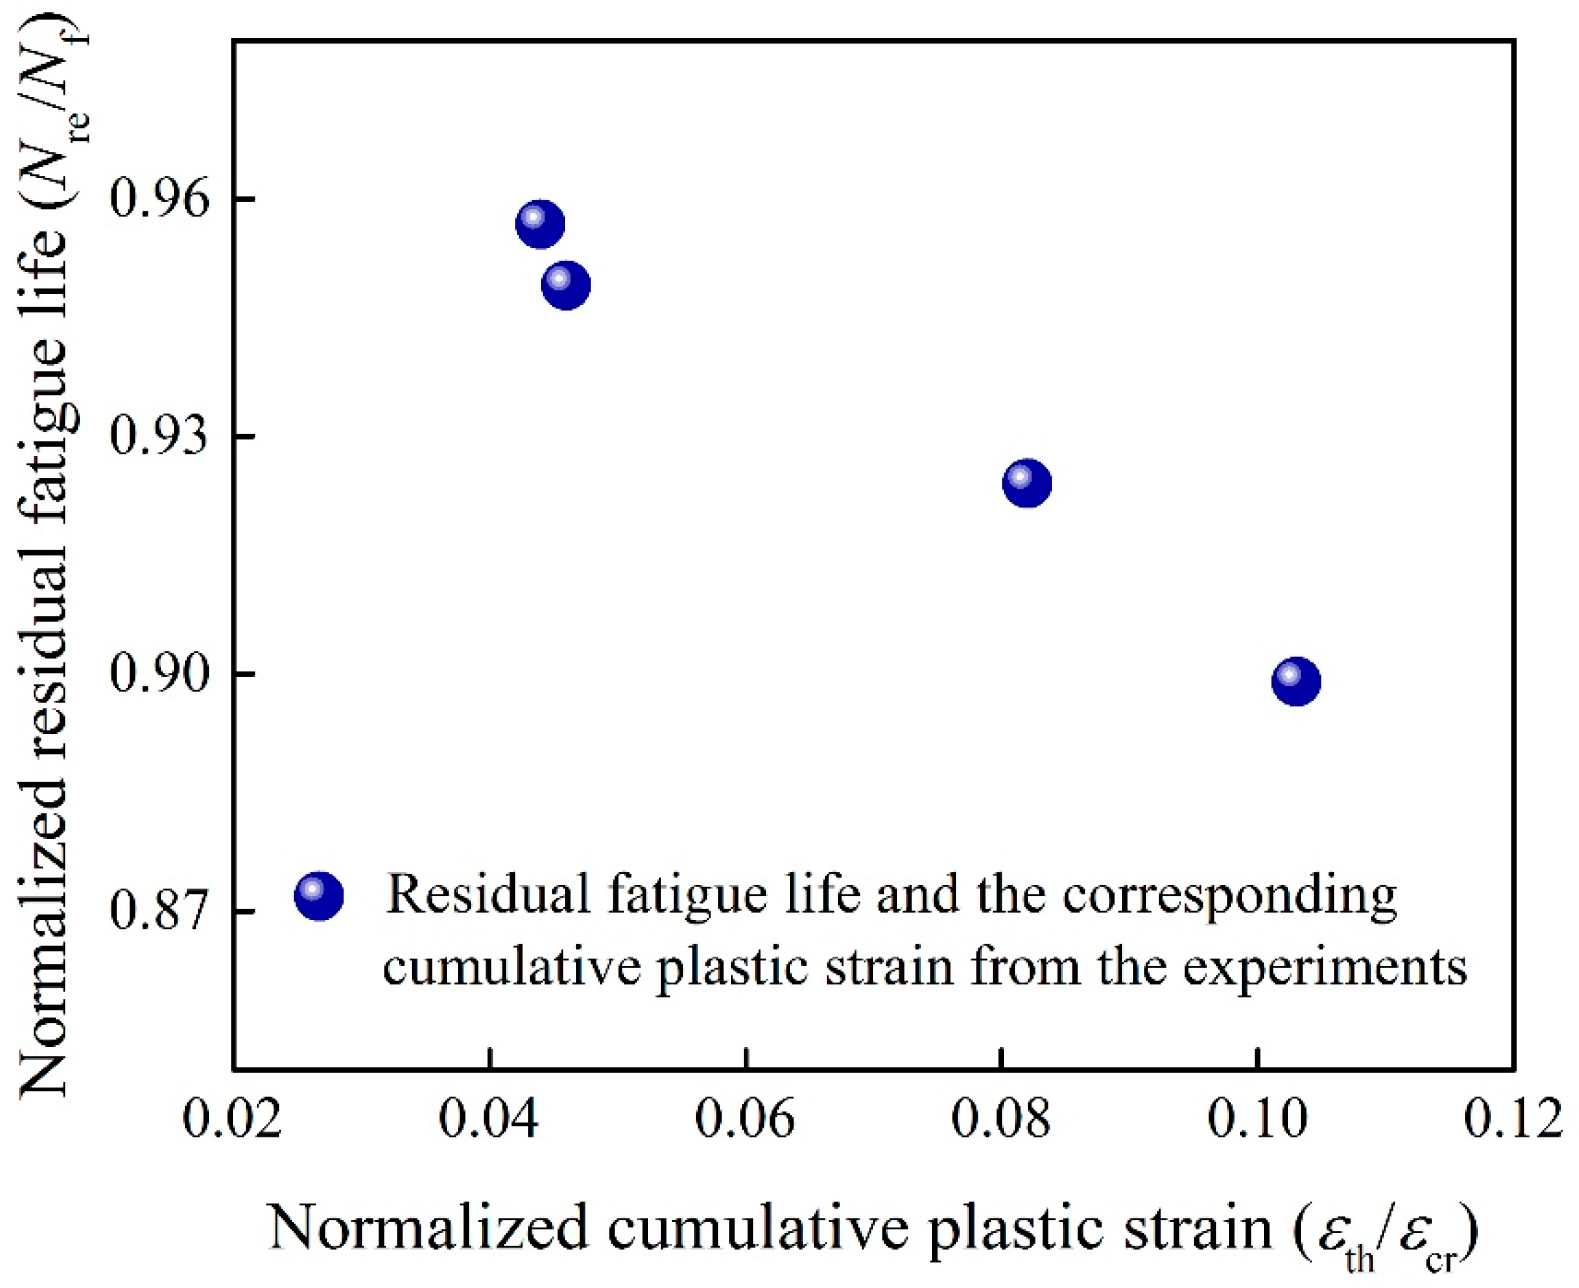
As shown in Figure 4, the proposed model is consistent with the experimental results for SAC305 solder joints aging at different temperatures. The difference between four groups of experiments are the normalized cumulative plastic strain , which relates to the microcrack nucleation of fatigue process. With elevated aging temperatures, the value of becomes larger, which represents shorter residual fatigue life. This phenomenon is consistent with the experiments as shown in Figure 5. The main reason is that for solder joints aging at different temperatures, lower temperature will promote the fatigue resistance especially for the cryogenic temperature (77 K) [5].
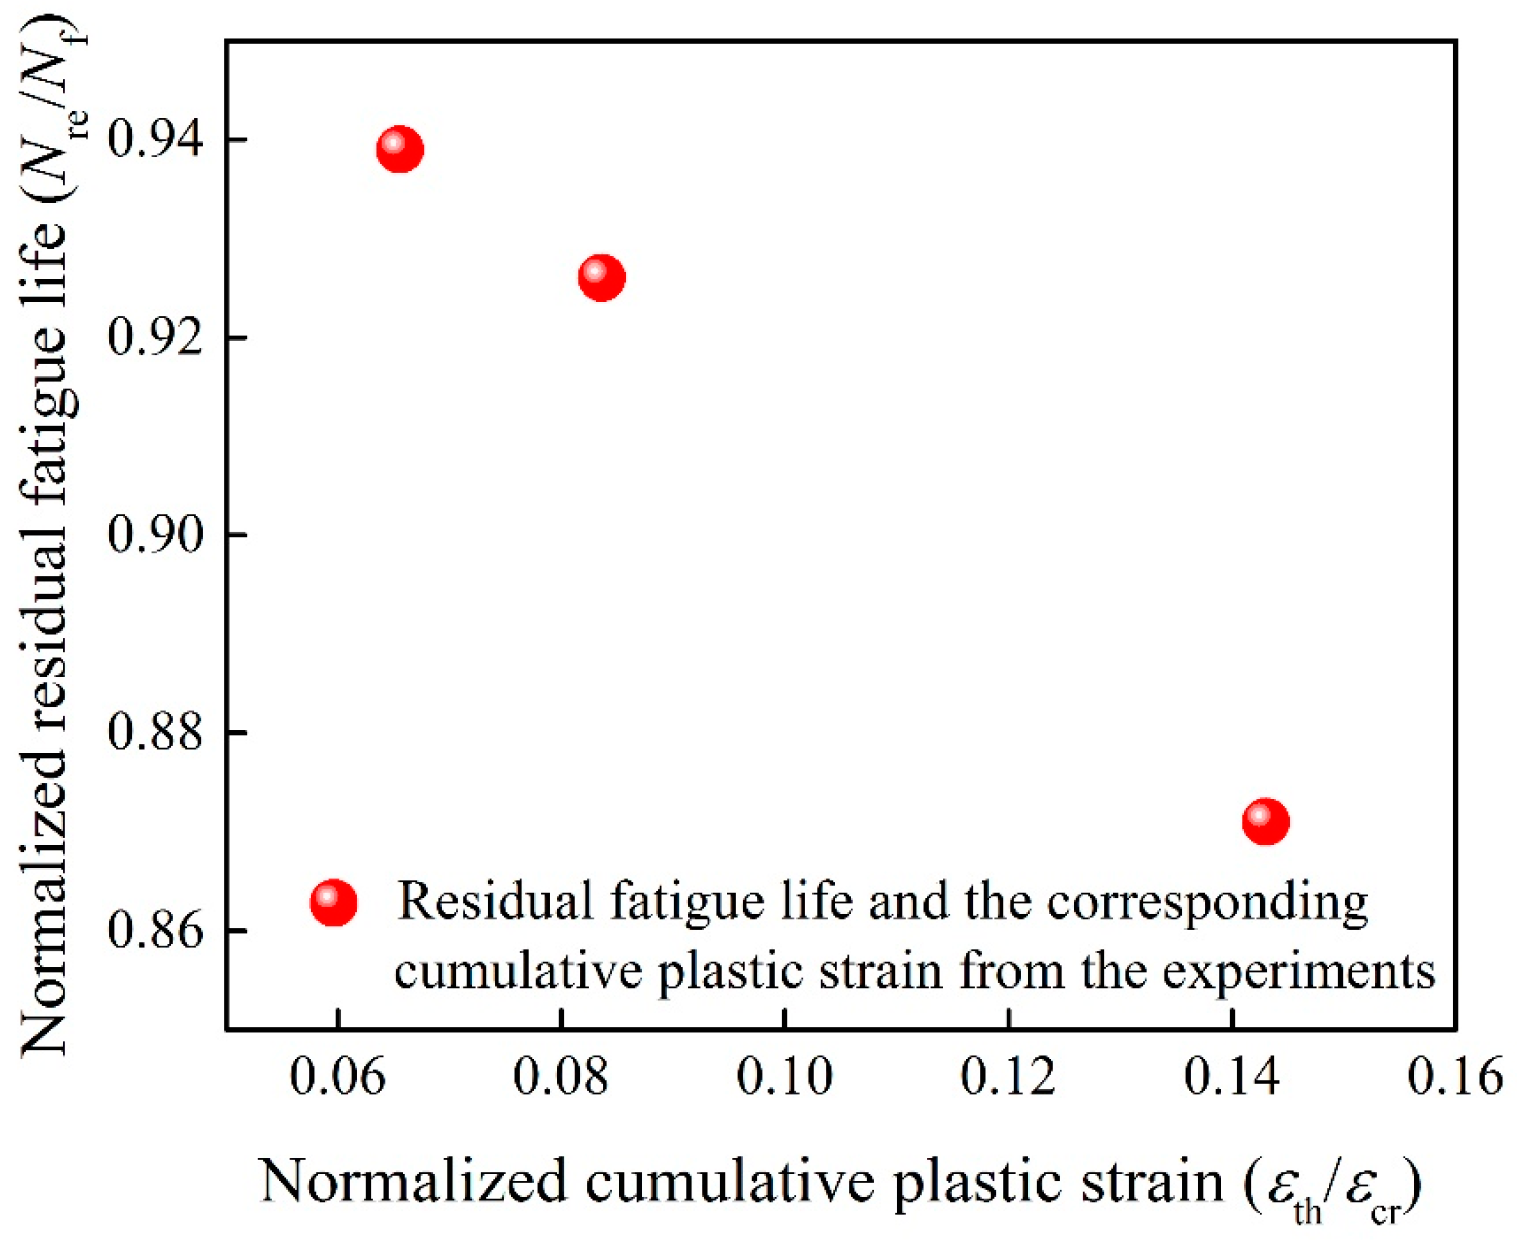
As shown in Figure 6, for solder joints aging at 77 K for 360 h, the proposed model is consistent with the experimental data under different experimental conditions (strain amplitude of 4%, 6% and 8%). For solder joints electrified at room temperature for 72 h with a current density of , the theoretical predictions match well with the fatigue test data. The experimental conditions are corresponding to different values of normalized cumulative plastic strain . With the strain amplitude increases, the value of becomes larger, which represents more plastic strain accumulated during microcrack nucleation and correspondingly shorter residual fatigue life. This phenomenon is consistent with the experimental observations as shown in Figure 7. The main reason is that for larger strain amplitude, the crack growth rate increases and the residual fatigue life decreases.
The experimental data further proves the applicability of Equation (25). For SAC305 solder joints under different aging and experimental conditions, the fatigue behavior can be described with reasonable accuracy compared with experiments. It should be noted that Equation (25) can also be applied in the accelerated fatigue test, the fatigue life of solder joints can be obtained by the same initial cycles of fatigue with a well determined parameter database.
5. Conclusions
In the current study, an entropy increment calculation method is developed based on the frame work of continuum damage mechanics and the statistical definition of entropy. The proposed approach can be applied to determine the entropy increment during the fatigue process. Based on the developed entropy increment equations, a new fatigue life prediction model is proposed. To verify the developed theoretical model, eight groups of experiments were performed under different aging treatment and experimental conditions. The predicted results agree well with the experimental data. It is found that with elevated aging temperatures or increasing of strain amplitude, the value of becomes larger and the residual fatigue life is shorter.
Acknowledgments
This work was supported by the National Natural Science Foundation of China (No.11572249, 11772257).
Author Contributions
Yao Yao performed the theoretical framework and modified the manuscript; Jundong Wang derived the equation; designed the experiments and completed the model validation. Both authors have read and approved the final manuscript.
Conflicts of Interest
The authors declare no conflict of interest.
References
- Yao, Y.; Fiedler, B.A.; Keer, L.M.; Fine, M.E. Fatigue crack propagation behavior of Sn–Ag–Cu solder interconnects. IEEE Trans. Compon. Packag. Technol. 2009, 32, 317–324. [Google Scholar] [CrossRef]
- Yao, Y.; Keer, L.M.; Fine, M.E. Modeling the failure of intermetallic/solder interfaces. Intermetallics 2010, 18, 1603–1611. [Google Scholar] [CrossRef]
- Yao, Y.; He, X.; Keer, L.M.; Fine, M.E. A continuum damage mechanics-based unified creep and plasticity model for solder materials. Acta Mater. 2015, 83, 160–168. [Google Scholar] [CrossRef]
- Yao, Y.; Wang, J.; Keer, L.M. A phase transformation based method to predict fatigue crack nucleation and propagation in metals and alloys. Acta Mater. 2017, 127, 244–251. [Google Scholar] [CrossRef]
- Wang, J.; Long, X.; Yao, Y. Effects of aging temperature on tensile and fatigue behavior of Sn-3.0Ag-0.5Cu solder joints. J. Mater. Sci. Mater. Electron. 2017, 28, 14884–14892. [Google Scholar] [CrossRef]
- Ihara, C.; Tanaka, T. A stochastic damage accumulation model for crack initiation in high-cycle fatigue. Fatigue Fract. Eng. Mater. Struct. 2000, 23, 375–380. [Google Scholar] [CrossRef]
- Pugno, N.; Ciavarella, M.; Cornetti, P.; Carpinteri, A. A generalized Paris’ law for fatigue crack growth. J. Mech. Phys. Solids 2006, 54, 1333–1349. [Google Scholar] [CrossRef]
- Khelif, R.; Chateauneuf, A.; Chaoui, K. Statistical analysis of HDPE fatigue lifetime. Meccanica 2008, 43, 567–576. [Google Scholar] [CrossRef]
- Carpinteri, A.; Paggi, M. The effect of crack size and specimen size on the relation between the Paris and Wöhler curves. Meccanica 2014, 49, 765–773. [Google Scholar] [CrossRef]
- Suresh, S. Fatigue of Materials; Cambridge University Press: Cambridge, UK, 1998. [Google Scholar]
- Ellyin, F. Fatigue Damage, Crack Growth and Life Prediction; Chapman & Hall: London, UK, 1997. [Google Scholar]
- Basaran, C.; Yan, C.-Y. A Thermodynamic Framework for Damage Mechanics of Solder Joints. J. Electron. Packag. 1998, 120, 379–384. [Google Scholar] [CrossRef]
- Basaran, C.; Tang, H. Implementation of a Thermodynamic Framework for Damage Mechanics of Solder Interconnects in Microelectronic Packaging. Int. J. Damage Mech. 2002, 11, 87–108. [Google Scholar] [CrossRef]
- Basaran, C.; Lin, M.; Ye, H. A thermodynamic model for electrical current induced damage. Int. J. Solids Struct. 2003, 40, 7315–7327. [Google Scholar] [CrossRef]
- Basaran, C.; Gomez, J.; Lin, M. Damage Mechanics Modeling of Concurrent Thermal and Vibration Loading on Electronics Packaging. Multidiscip. Model. Mater. Struct. 2013, 2, 309–326. [Google Scholar]
- Kozyrev, Y.P.; Sedakova, E.B. Application of a thermodynamic model for analysis of wear resistance of materials. J. Mach. Manuf. Reliab. 2008, 37, 60–62. [Google Scholar]
- Bryant, M.D. Entropy and Dissipative Processes of friction and Wear. FME Trans. 2009, 37, 55–60. [Google Scholar]
- Amiri, M.; Khonsari, M.M. On the Thermodynamics of Friction and Wear—A Review. Entropy 2010, 12, 1021–1049. [Google Scholar] [CrossRef]
- Sosnovskiy, L.A.; Sherbakov, S.S. A Model of Mechanothermodynamic Entropy in Tribology. Entropy 2016, 19, 115. [Google Scholar] [CrossRef]
- Sosnovskiy, L.A.; Sherbakov, S.S. Mechanothermodynamic Entropy and Analysis of Damage State of Complex Systems. Entropy 2016, 18, 268. [Google Scholar] [CrossRef]
- Sosnovskiy, L.A.; Sherbakov, S.S. Mechanothermodynamical system and its behavior. Contin. Mech. Thermodyn. 2012, 24, 239–256. [Google Scholar] [CrossRef]
- Sosnovskiy, L.A.; Sherbakov, S.S. Mechanothermodynamics; Springer: Berlin/Heidelberg, Germany, 2016. [Google Scholar]
- Lemaitre, J. A Course on Damage Mechanics; Springer: Berlin/Heidelberg, Germany, 1996. [Google Scholar]
- Bonora, N. A nonlinear CDM model for ductile failure. Eng. Fract. Mech. 1997, 58, 11–28. [Google Scholar] [CrossRef]
- Attard, P. Non-Equilibrium Thermodynamics and Statistical Mechanics; OUP Oxford: Oxford, UK, 2012. [Google Scholar]
- Boltzmann, L. Lectures on Gas Theory; University of California Press: Berkeley, CA, USA, 1964. [Google Scholar]
- Basaran, C.; Nie, S. An Irreversible Thermodynamics Theory for Damage Mechanics of Solids. Int. J. Damage Mech. 2004, 13, 205–223. [Google Scholar] [CrossRef]
- Naderi, M.; Amiri, M.; Khonsari, M.M. On the thermodynamic entropy of fatigue fracture. Proc. Math. Phys. Eng. Sci. 2010, 466, 423–438. [Google Scholar] [CrossRef]
- Naderi, M.; Khonsari, M.M. An experimental approach to low-cycle fatigue damage based on thermodynamic entropy. Int. J. Solids Struct. 2010, 47, 875–880. [Google Scholar] [CrossRef]
- Amiri, M.; Naderi, M.; Khonsari, M.M. An Experimental Approach to Evaluate the Critical Damage. Int. J. Damage Mech. 2011, 20, 89–112. [Google Scholar] [CrossRef]
- Lemaitre, J.; Chaboche, J.L. Mechanics of Solids Materials; Cambridge University Press: Cambridge, UK, 1985. [Google Scholar]
- Bonora, N.; Newaz, G.M. Low cycle fatigue life estimation for ductile metals using a nonlinear continuum damage mechanics model. Int. J. Solids Struct. 1998, 35, 1881–1894. [Google Scholar] [CrossRef]
Figure 1.
Increasing of entropy during the damage process. (a): Increasing of entropy during damage process for different materials. (b): Increasing of entropy during damage process for steel.
Figure 1.
Increasing of entropy during the damage process. (a): Increasing of entropy during damage process for different materials. (b): Increasing of entropy during damage process for steel.

Figure 2.
The typical defects and different microstructures of intermetallic compound observed in the experiments: (a) void in the solder joints; (b) butterfly shape intermetallic compound; (c) inclusion in the solder joints; (d) fracture of butterfly shape intermetallic compound and collapse into cavity in the fatigue damage process.

Figure 3.
Increase of entropy during damage process for SAC305 solder joints. (a): Increase of entropy during damage process for SAC305 solder joints aging at different temperatures. (b): Increase of entropy during fatigue process for SAC305 solder joints aging under different experimental conditions.
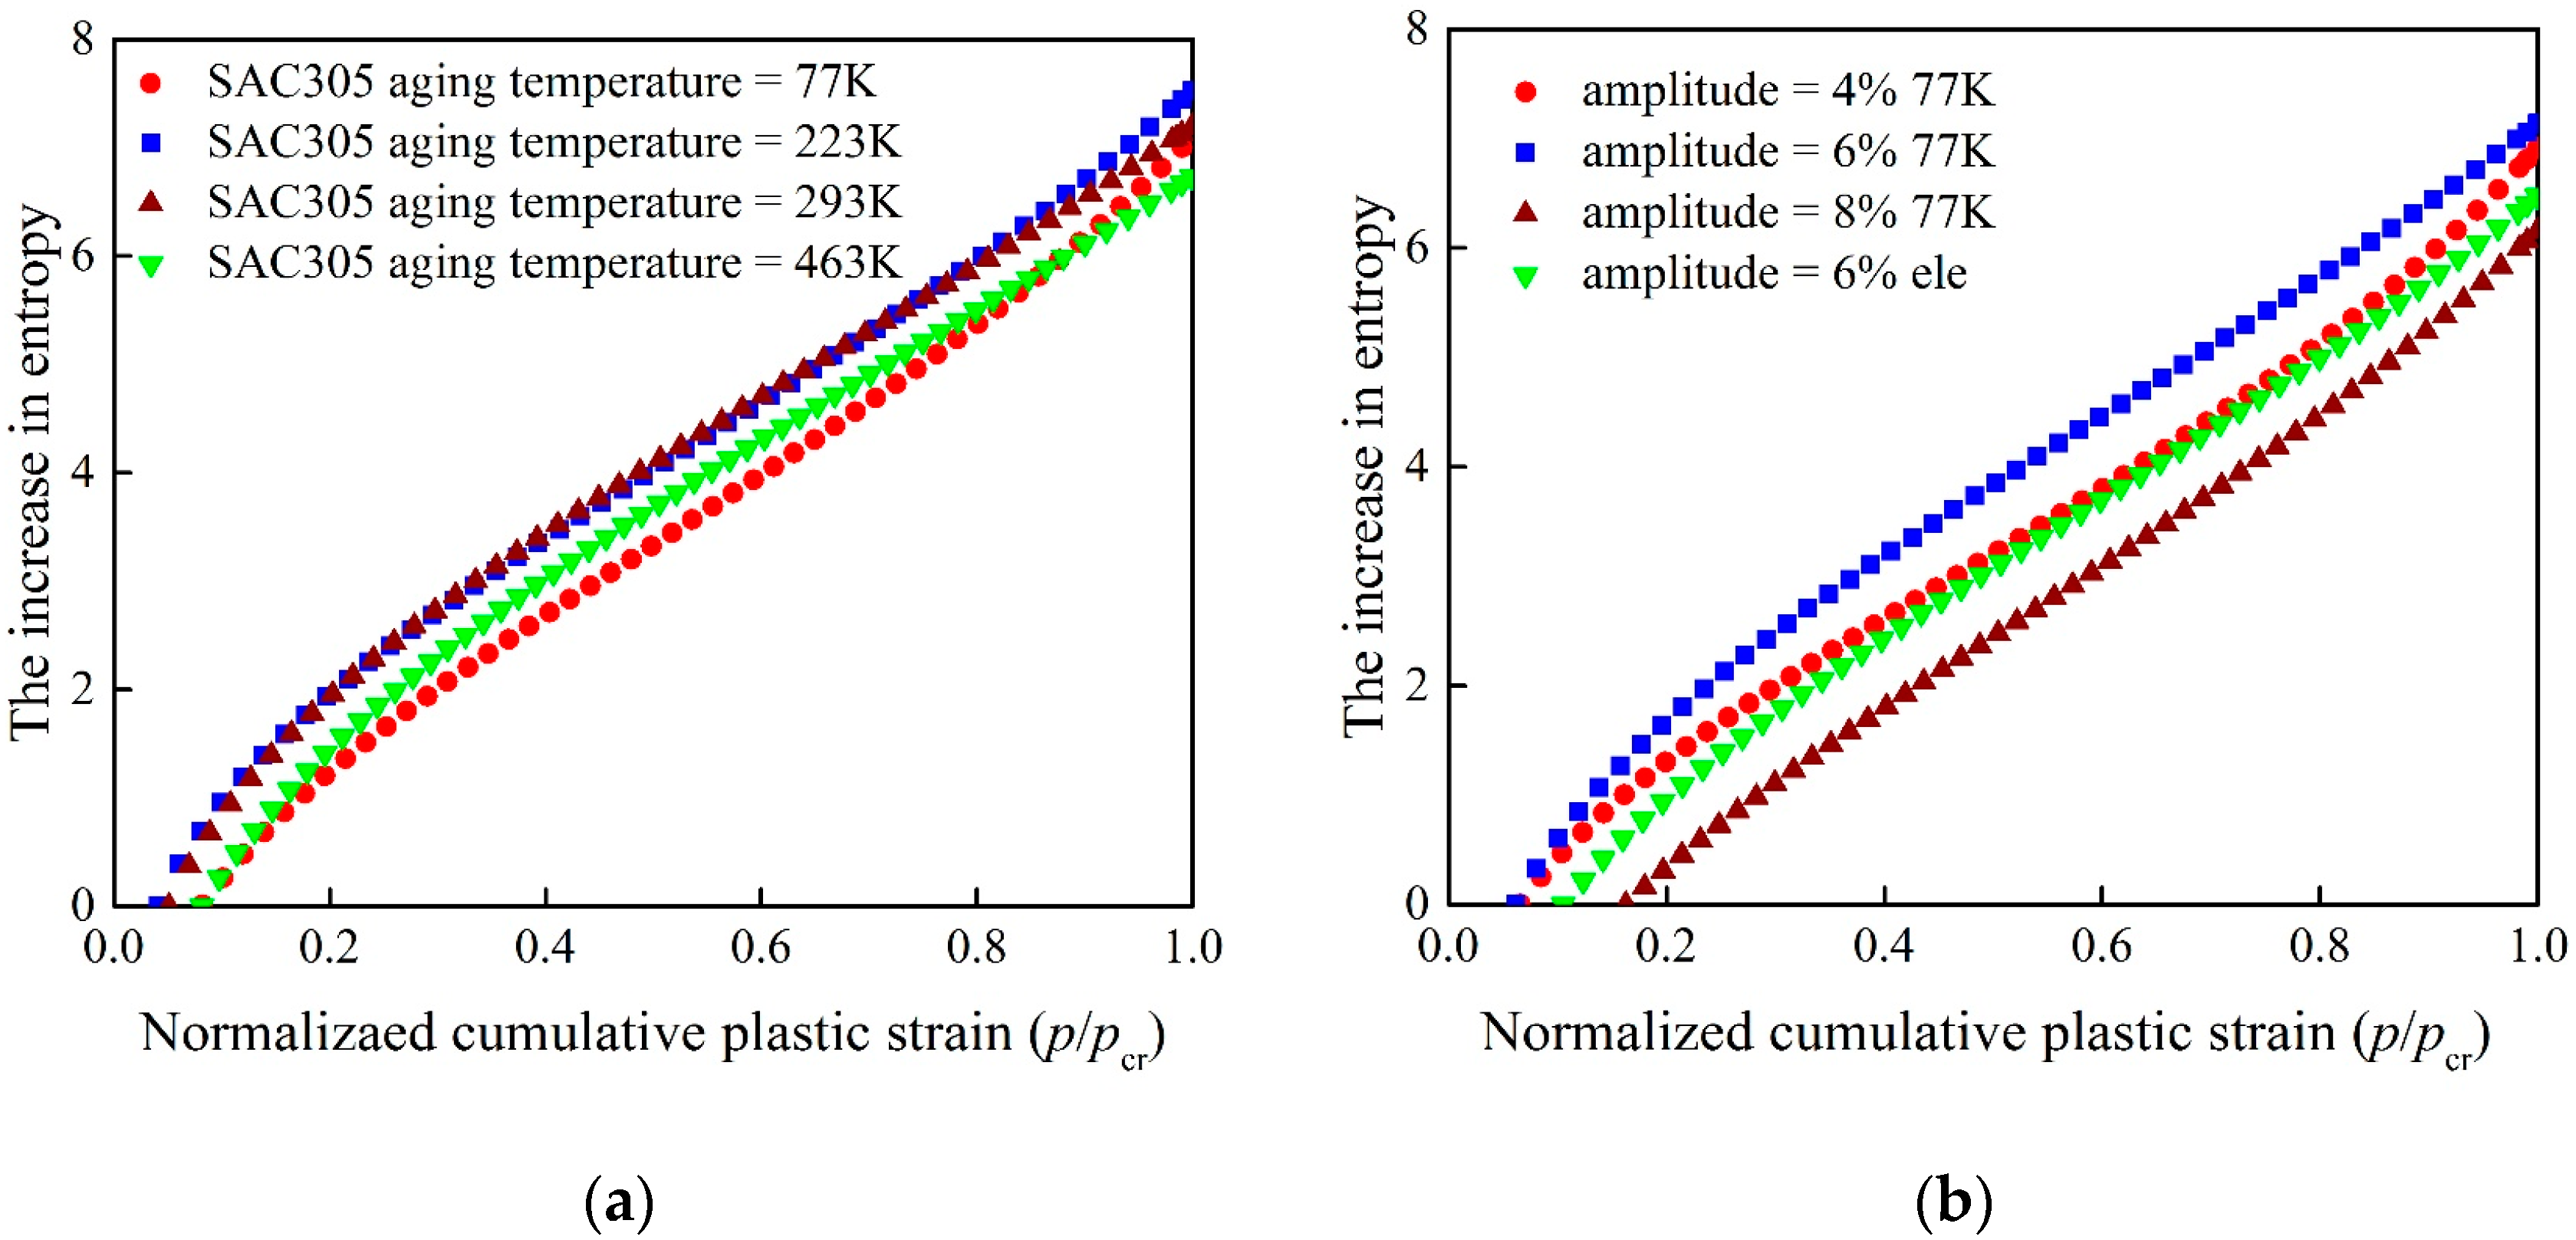
Figure 4.
Experimental data of SAC305 solder joints, (a) aging at 77K for 72 h ( = 0.058), (b) aging at 223K for 72 h ( = 0.093), (c) aging at 293K for 72 h ( = 0.143), (d) aging at 453K for 72 h ( = 0.327).
Figure 4.
Experimental data of SAC305 solder joints, (a) aging at 77K for 72 h ( = 0.058), (b) aging at 223K for 72 h ( = 0.093), (c) aging at 293K for 72 h ( = 0.143), (d) aging at 453K for 72 h ( = 0.327).
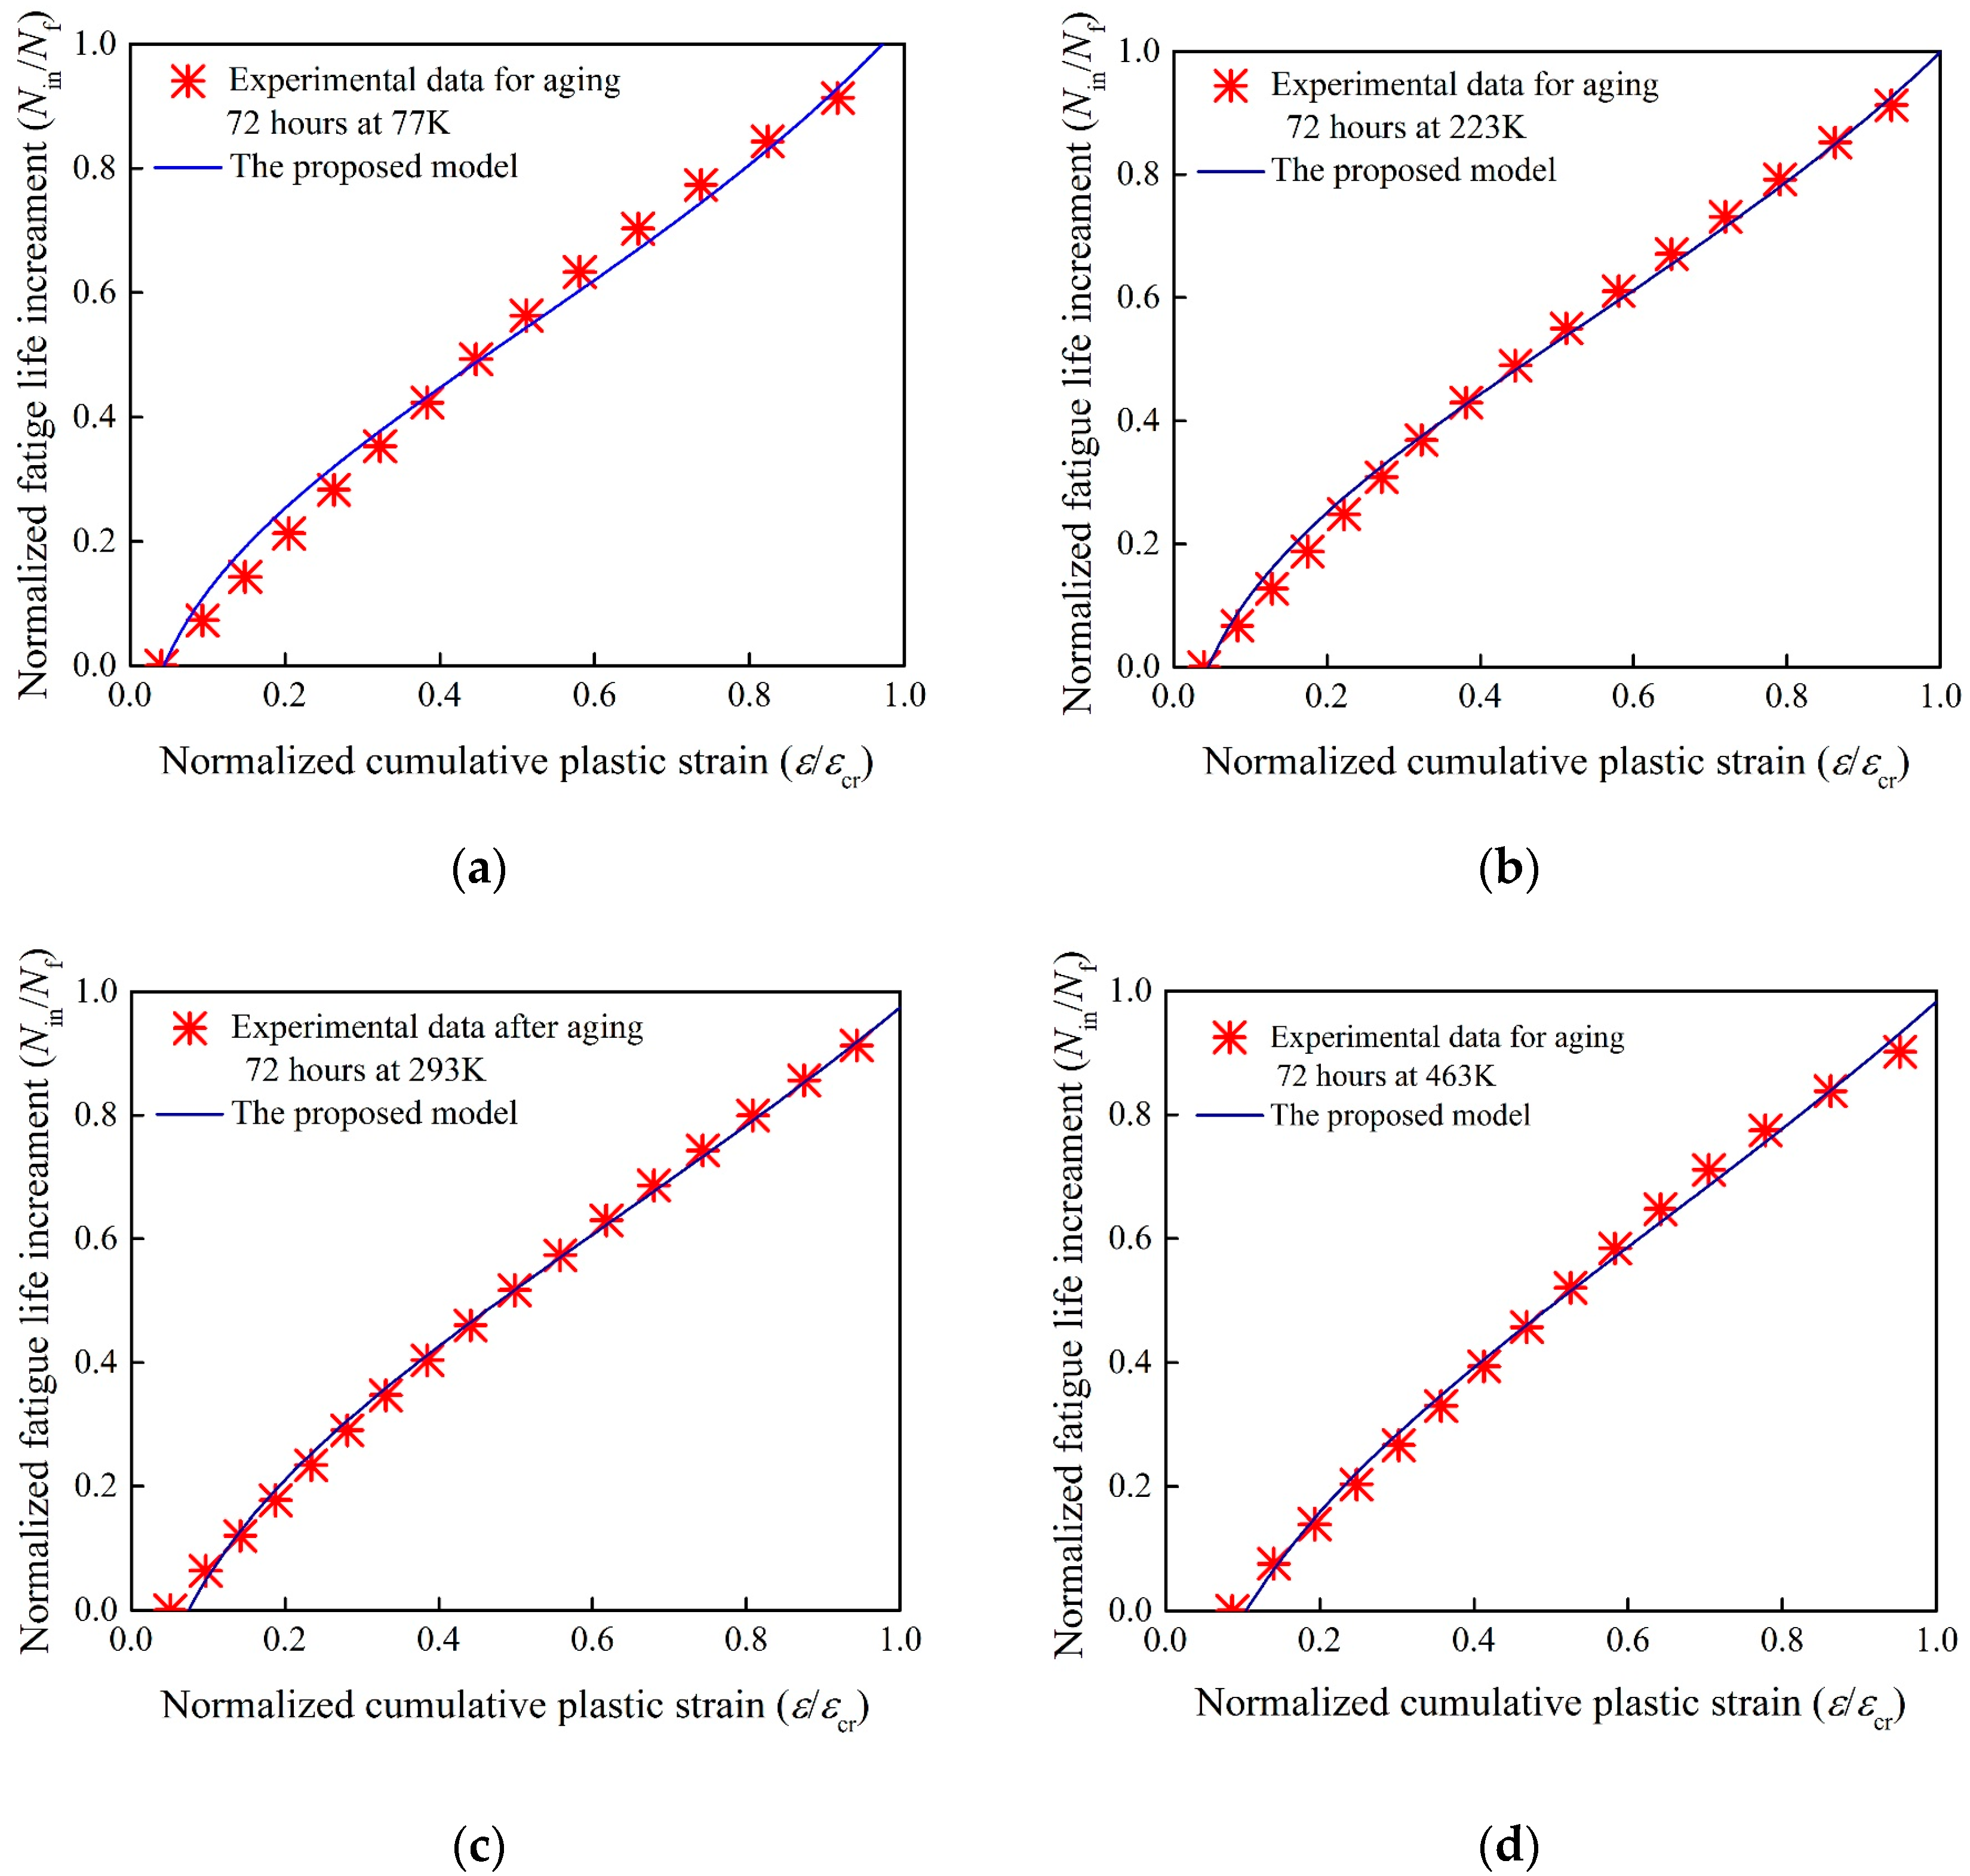
Figure 5.
The normalized residual fatigue life with the normalized cumulative plastic strain .

Figure 6.
Experimental results for SAC305 solder joints; (a) aging at 77 K for 360 h with 4% strain amplitude ( = 0.090); (b) aging at 77 K for 360 h with 6% strain amplitude ( = 0.176); (c) aging at 77 K for 360 h with 8% strain amplitude ( = 0.306); (d) electricity for 72 h with 6% strain amplitude ( = 0.268).

Figure 7.
The normalized residual fatigue life with the normalized cumulative plastic strain .


Table 1.
The material parameters for Al alloys and steel alloys.
| Material | |||
|---|---|---|---|
| Alloy Al2024-T3 | 0.0092 | 0.33 | 0.679 |
| Alloy Al-Li | 0.0077 | 0.1 | 0.446 |
| Steel A3 | 0.202 | 1.0 | 1.98 |
| Steel 1015 | 0.259 | 1.4 | 0.2175 |
| Steel 1045 | 0.223 | 0.95 | 0.2173 |
| Steel 1090 | 0.129 | 0.64 | 0.2 |
Table 2.
The material parameters for solder joints at different experimental conditions.
| Conditions | |||
|---|---|---|---|
| 77 K 72 h | 0.789 | 22.21 | 0.39 |
| 223 K 72 h | 0.705 | 15.625 | 0.40 |
| 293 K 72 h | 1.172 | 12.07 | 0.48 |
| 453 K 72 h | 0.702 | 6.12 | 0.4 |
| 77 K 4% strain | 0.9279 | 14.14 | 0.41 |
| 77 K 6% strain | 0.789 | 9.44 | 0.48 |
| 77 K 8% strain | 0.59 | 4.12 | 0.45 |
| 293 K ele | 0.53 | 5.07 | 0.37 |
© 2017 by the authors. Licensee MDPI, Basel, Switzerland. This article is an open access article distributed under the terms and conditions of the Creative Commons Attribution (CC BY) license (http://creativecommons.org/licenses/by/4.0/).
Share and Cite
MDPI and ACS Style
Wang, J.; Yao, Y. An Entropy Based Low-Cycle Fatigue Life Prediction Model for Solder Materials. Entropy 2017, 19, 503. https://doi.org/10.3390/e19100503
AMA Style
Wang J, Yao Y. An Entropy Based Low-Cycle Fatigue Life Prediction Model for Solder Materials. Entropy. 2017; 19(10):503. https://doi.org/10.3390/e19100503
Chicago/Turabian StyleWang, Jundong, and Yao Yao. 2017. "An Entropy Based Low-Cycle Fatigue Life Prediction Model for Solder Materials" Entropy 19, no. 10: 503. https://doi.org/10.3390/e19100503
Note that from the first issue of 2016, this journal uses article numbers instead of page numbers. See further details here.