Article

Effects of Fatty Infiltration of the Liver on the Shannon Entropy of Ultrasound Backscattered Signals

by
Po-Hsiang Tsui
1,2,3,* and
Yung-Liang Wan
1,2,3,*
1
Department of Medical Imaging and Radiological Sciences, College of Medicine, Chang Gung University, Taoyuan 33302, Taiwan
2
Medical Imaging Research Center, Institute for Radiological Research, Chang Gung University and Chang Gung Memorial Hospital at Linkou, Taoyuan 33302, Taiwan
3
Department of Medical Imaging and Intervention, Chang Gung Memorial Hospital at Linkou, Taoyuan 33305, Taiwan
*
Authors to whom correspondence should be addressed.
Entropy 2016, 18(9), 341; https://doi.org/10.3390/e18090341
Submission received: 20 June 2016 / Revised: 7 September 2016 / Accepted: 19 September 2016 / Published: 21 September 2016
(This article belongs to the Special Issue Symbolic Entropy Analysis and Its Applications)

Abstract

:
This study explored the effects of fatty infiltration on the signal uncertainty of ultrasound backscattered echoes from the liver. Standard ultrasound examinations were performed on 107 volunteers. For each participant, raw ultrasound image data of the right lobe of liver were acquired using a clinical scanner equipped with a 3.5-MHz convex transducer. An algorithmic scheme was proposed for ultrasound B-mode and entropy imaging. Fatty liver stage was evaluated using a sonographic scoring system. Entropy values constructed using the ultrasound radiofrequency (RF) and uncompressed envelope signals (denoted by HR and HE, respectively) as a function of fatty liver stage were analyzed using the Pearson correlation coefficient. Data were expressed as the median and interquartile range (IQR). Receiver operating characteristic (ROC) curve analysis with 95% confidence intervals (CIs) was performed to obtain the area under the ROC curve (AUC). The brightness of the entropy image typically increased as the fatty stage varied from mild to severe. The median value of HR monotonically increased from 4.69 (IQR: 4.60–4.79) to 4.90 (IQR: 4.87–4.92) as the severity of fatty liver increased (r = 0.63, p < 0.0001). Concurrently, the median value of HE increased from 4.80 (IQR: 4.69–4.89) to 5.05 (IQR: 5.02–5.07) (r = 0.69, p < 0.0001). In particular, the AUCs obtained using HE (95% CI) were 0.93 (0.87–0.99), 0.88 (0.82–0.94), and 0.76 (0.65–0.87) for fatty stages ≥mild, ≥moderate, and ≥severe, respectively. The sensitivity, specificity, and accuracy were 93.33%, 83.11%, and 86.00%, respectively (≥mild). Fatty infiltration increases the uncertainty of backscattered signals from livers. Ultrasound entropy imaging has potential for the routine examination of fatty liver disease.

1. Introduction

Hepatitis steatosis, which is the accumulation of fat in hepatocytes, may progress to nonalcoholic steatohepatitis, fibrosis, cirrhosis, and hepatocellular carcinoma [1]. Nonalcoholic fatty liver disease (NAFLD) is the type of hepatic steatosis that most commonly leads to chronic liver disease [2]. NAFLD is also related to metabolic risk factors, such as cardiovascular disease, obesity, diabetes mellitus, and dyslipidemia [3]. How to characterize fatty liver is attracting growing medical and health research interest.
Currently, biopsy is the gold standard for fatty liver assessment. However, biopsy examinations have several limitations. A biopsy sample is smaller than the total mass of the liver and thus provides insufficient information for effective diagnosis [4,5]. Moreover, histological evaluations are subjective and rely on the experience of pathologists. Furthermore, most patients with fatty liver do not have clinical symptoms; thus, performing liver biopsies for these patients is not ethical and difficult in routine examinations. Accordingly, noninvasive imaging techniques have gradually replaced liver biopsy for clinical assessment of fatty liver.
Imaging-based evaluation of fatty liver is required in current clinical diagnoses. Computed tomography (CT) is useful in assessing steatosis, with a sensitivity of 82%–95% and a specificity approaching 100% [6,7]. However, CT scans expose patients to ionizing radiation and yield less accurate results for patients with underlying liver disease [8]. Magnetic resonance spectroscopy (MRS) is the most sensitive and specific tool for detecting steatosis, with an accuracy of approximately 100% [9]. Using MRS, fat fraction can be calculated for quantifying fatty liver severity. However, the high cost of MRS reduces the clinical utility and availability of the technique. Compared with CT and MRS, ultrasound imaging is much cheaper, faster, and more widely available for evaluating the degree of fatty liver. According to a previous report [10], ultrasound has a sensitivity of 60%–94% and a specificity of 66%–95% for fatty liver staging. Probably because of the system-dependent image quality and interobserver variability of ultrasound screening, lower sensitivities are frequently observed when patients experience mild fatty changes [10]. Therefore, a more objective ultrasound evaluation method that is less affected by the imaging system and user experience is necessary.
When ultrasound scanning is performed, a liver parenchyma can be modeled as a scattering medium consisting of numerous acoustic scatterers. Different arrangements or structures of scatterers result in different acoustic interference effects that can be measured to characterize fatty liver. For example, the attenuation [11,12] and backscatter coefficient [12] can be used to quantify the degree of fatty liver. Previous studies have shown that changes in the microstructures of liver parenchyma alter the speckle pattern and image texture of a B-mode image [13,14]. Therefore, the texture analysis of the B-mode image has also been explored for fatty liver evaluations [15,16,17]. It should be noted that calculating the backscatter coefficient needs the compensation of attenuation effect along the acoustic path and a reference phantom for calibration. In particular, performing the texture analysis is typically based on the processed grayscale image (not the raw data), and, thus, the performance of characterizing tissues is system-dependent [18].
Notably, the speckle pattern is formed by ultrasound backscattered echoes, which are typically treated as random signals. Thus, analyzing the statistical distribution of the echo amplitude (i.e., the envelope signal) may provide useful clues associated with liver diseases. In general, the methods for analyzing the echo amplitude distribution can be divided into two types. The first method is to measure the degree of deviation from the Rayleigh distribution. The representative technique for analyzing the echo amplitude distribution is acoustic structure quantification (ASQ), which has already been commercialized through Toshiba ultrasound scanners. ASQ not only assesses liver fibrosis [19,20] but also stages the degree of fatty liver [21,22,23,24], although it may be imprecise [25] and is affected by fatty infiltration when characterizing liver fibrosis [23]. The second method uses statistical distributions to model the echo amplitude distribution for a more accurate statistical analysis. This concept has been realized using statistical models, such as K [26] and Nakagami distributions [27,28], indicating that the echo amplitude distribution varies from pre-Rayleigh to Rayleigh with the formation of fatty liver.
One requisite of using statistical models to fit echo amplitude distributions is that the ultrasound envelope data must conform to the used distribution [29,30,31,32]. This requirement may not always be satisfied in practice because different systems have different hardware and software designs for envelope detection. From this point of view, non-model-based parameters that can be calculated using any type of data irrespective of the data distribution are suggested as alternatives for characterizing tissues. Among non-model-based statistical parameters, entropy has been shown to correlate with the parameters of the statistical models and the envelope statistics [33], which is a useful clue for characterizing fatty liver [27,28]. Recall that Shannon established information theory and defined entropy as a measure of information uncertainty [34]. Hughes pioneered using Shannon entropy for analyzing ultrasound signals, indicating that entropy is able to quantitatively describe changes in the microstructures of scattering media [35,36,37,38,39]. According to the above literature review, we assume that entropy (the signal uncertainty) may be used as a non-model-based approach for visualizing changes in the statistical properties of ultrasound signals induced by fatty infiltration in the liver. To validate the proposed idea, the objectives of this study include (i) exploring the relationship between entropy and the stage of fatty liver and (ii) evaluating the performance of using entropy for the assessment of fatty liver.

2. Materials and Methods

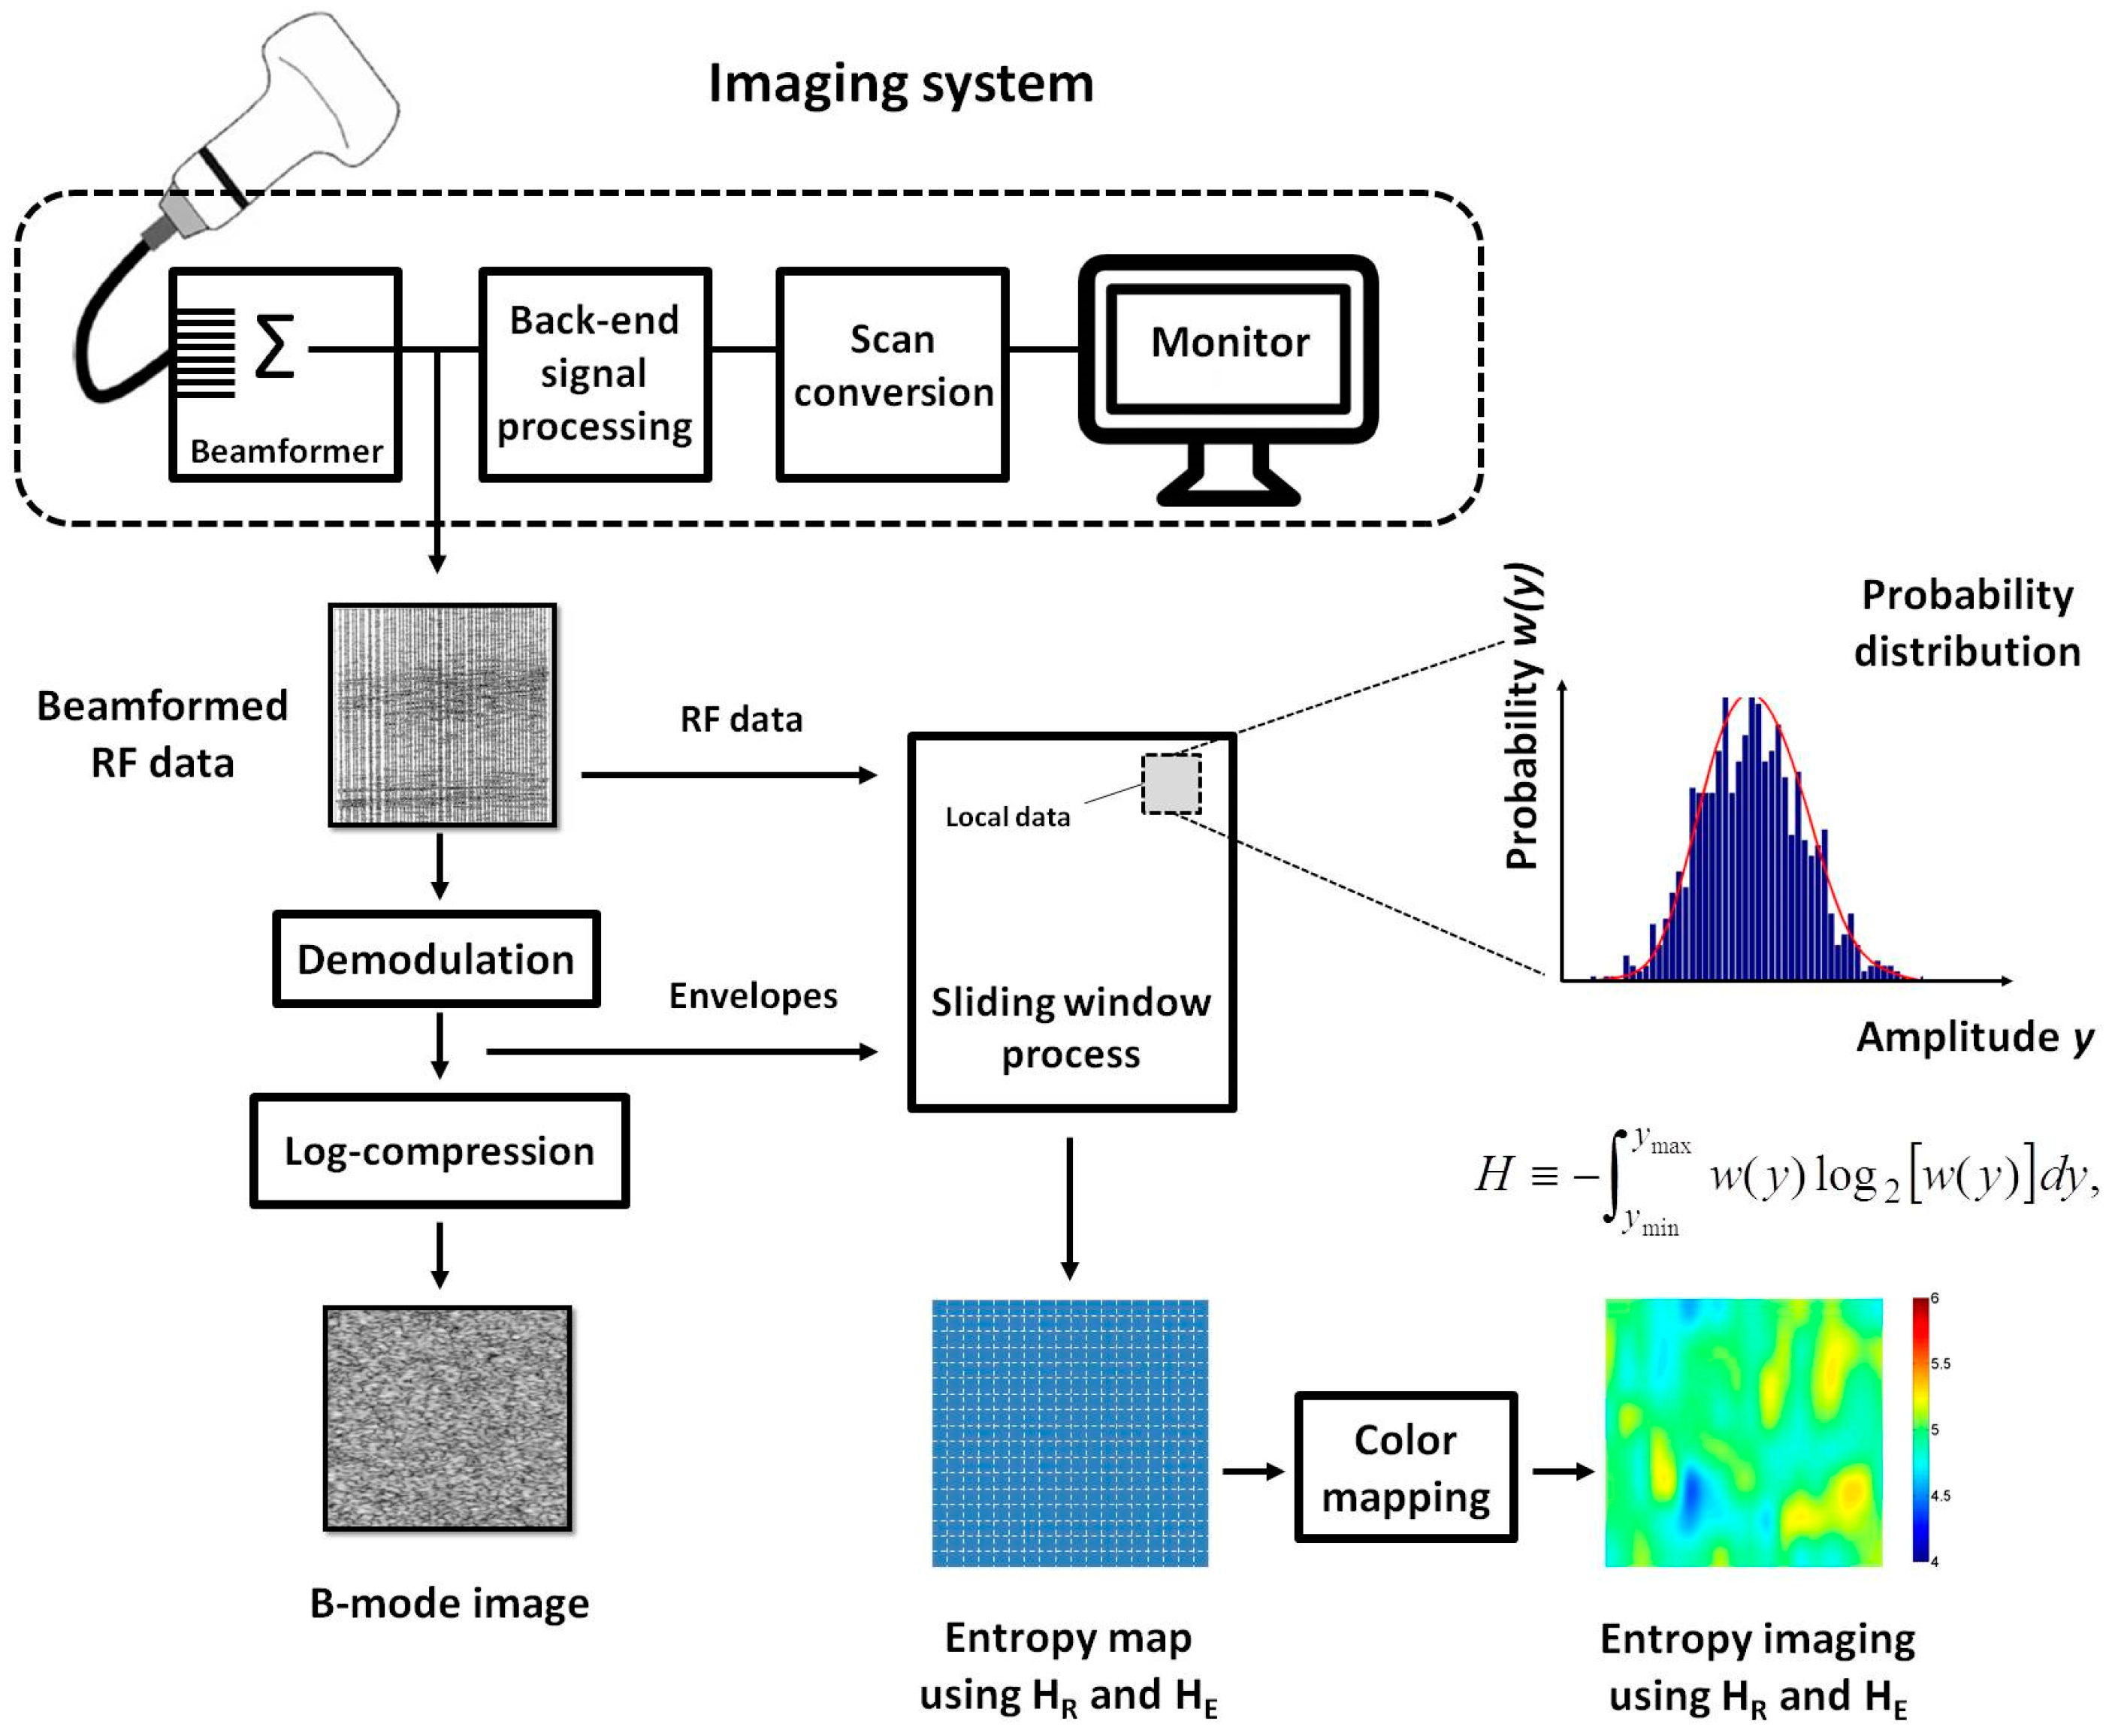
2.1. Entropy Estimation

Information is uncertain, not deterministic [40]; therefore, the concept of probability is employed to develop information theory. In proposing information theory, Shannon defined entropy as a measure of information [34]. For an ultrasound backscattered signal f(t), Shannon entropy is defined as the negative of the logarithm of the echo amplitude distribution w(y) [36]:
H y min y max w ( y ) log 2 [ w ( y ) ] d y ,
where ymin and ymax represent the minimal and maximal values of y = f(t), respectively.

2.2. Data Collection

The collection and use of data in this study was approved by the Institutional Review Board (IRB) of Chang Gung Memorial Hospital at Linkou, Taiwan. A total of 107 volunteers were recruited to participate in the study. Before ultrasound scanning, the participants fasted for 8 h and signed informed consent forms. A radiologist used a clinical ultrasound machine (Model 3000, Terason, Burlington, MA, USA) equipped with a 3.5-MHz curve probe (Model 5C2A, Terason, Burlington, MA, USA) to perform standard ultrasound examinations on right lobes of livers by using a subcostal approach. The transducer pulse length was approximately 2.3 mm. Five scans were performed on each patient to save the raw radiofrequency (RF) data of images for offline analysis using a personal computer. Each RF datum was a matrix with a size of 1811 × 256 (256 scan lines; 1811 sample points for each scan line under the sampling rate of 12 MHz). All image data were acquired using the same settings (depth: 14 cm; focus: 8 cm; time gain compensation: off; image postprocessing: off).

2.3. Scoring System of Fatty Liver

The participants did not have alcoholism or medical histories associated with liver diseases; thus, invasive biopsies were prohibited by the IRB. Four fatty liver stages (normal, mild, moderate, and severe) was assigned by the same gastroenterologist using a sonographic scoring system based on sonographic features (including echotexture, liver–diaphragm differentiation in the echo amplitude, ultrasound penetration, and hepatic vessel clarity), which is a widely accepted diagnostic method for clinical assessment of fatty liver, as shown in Table 1 [41]. In this study, a total of 107 participants were recruited (normal: 30; mild: 30; moderate: 30; severe: 17).

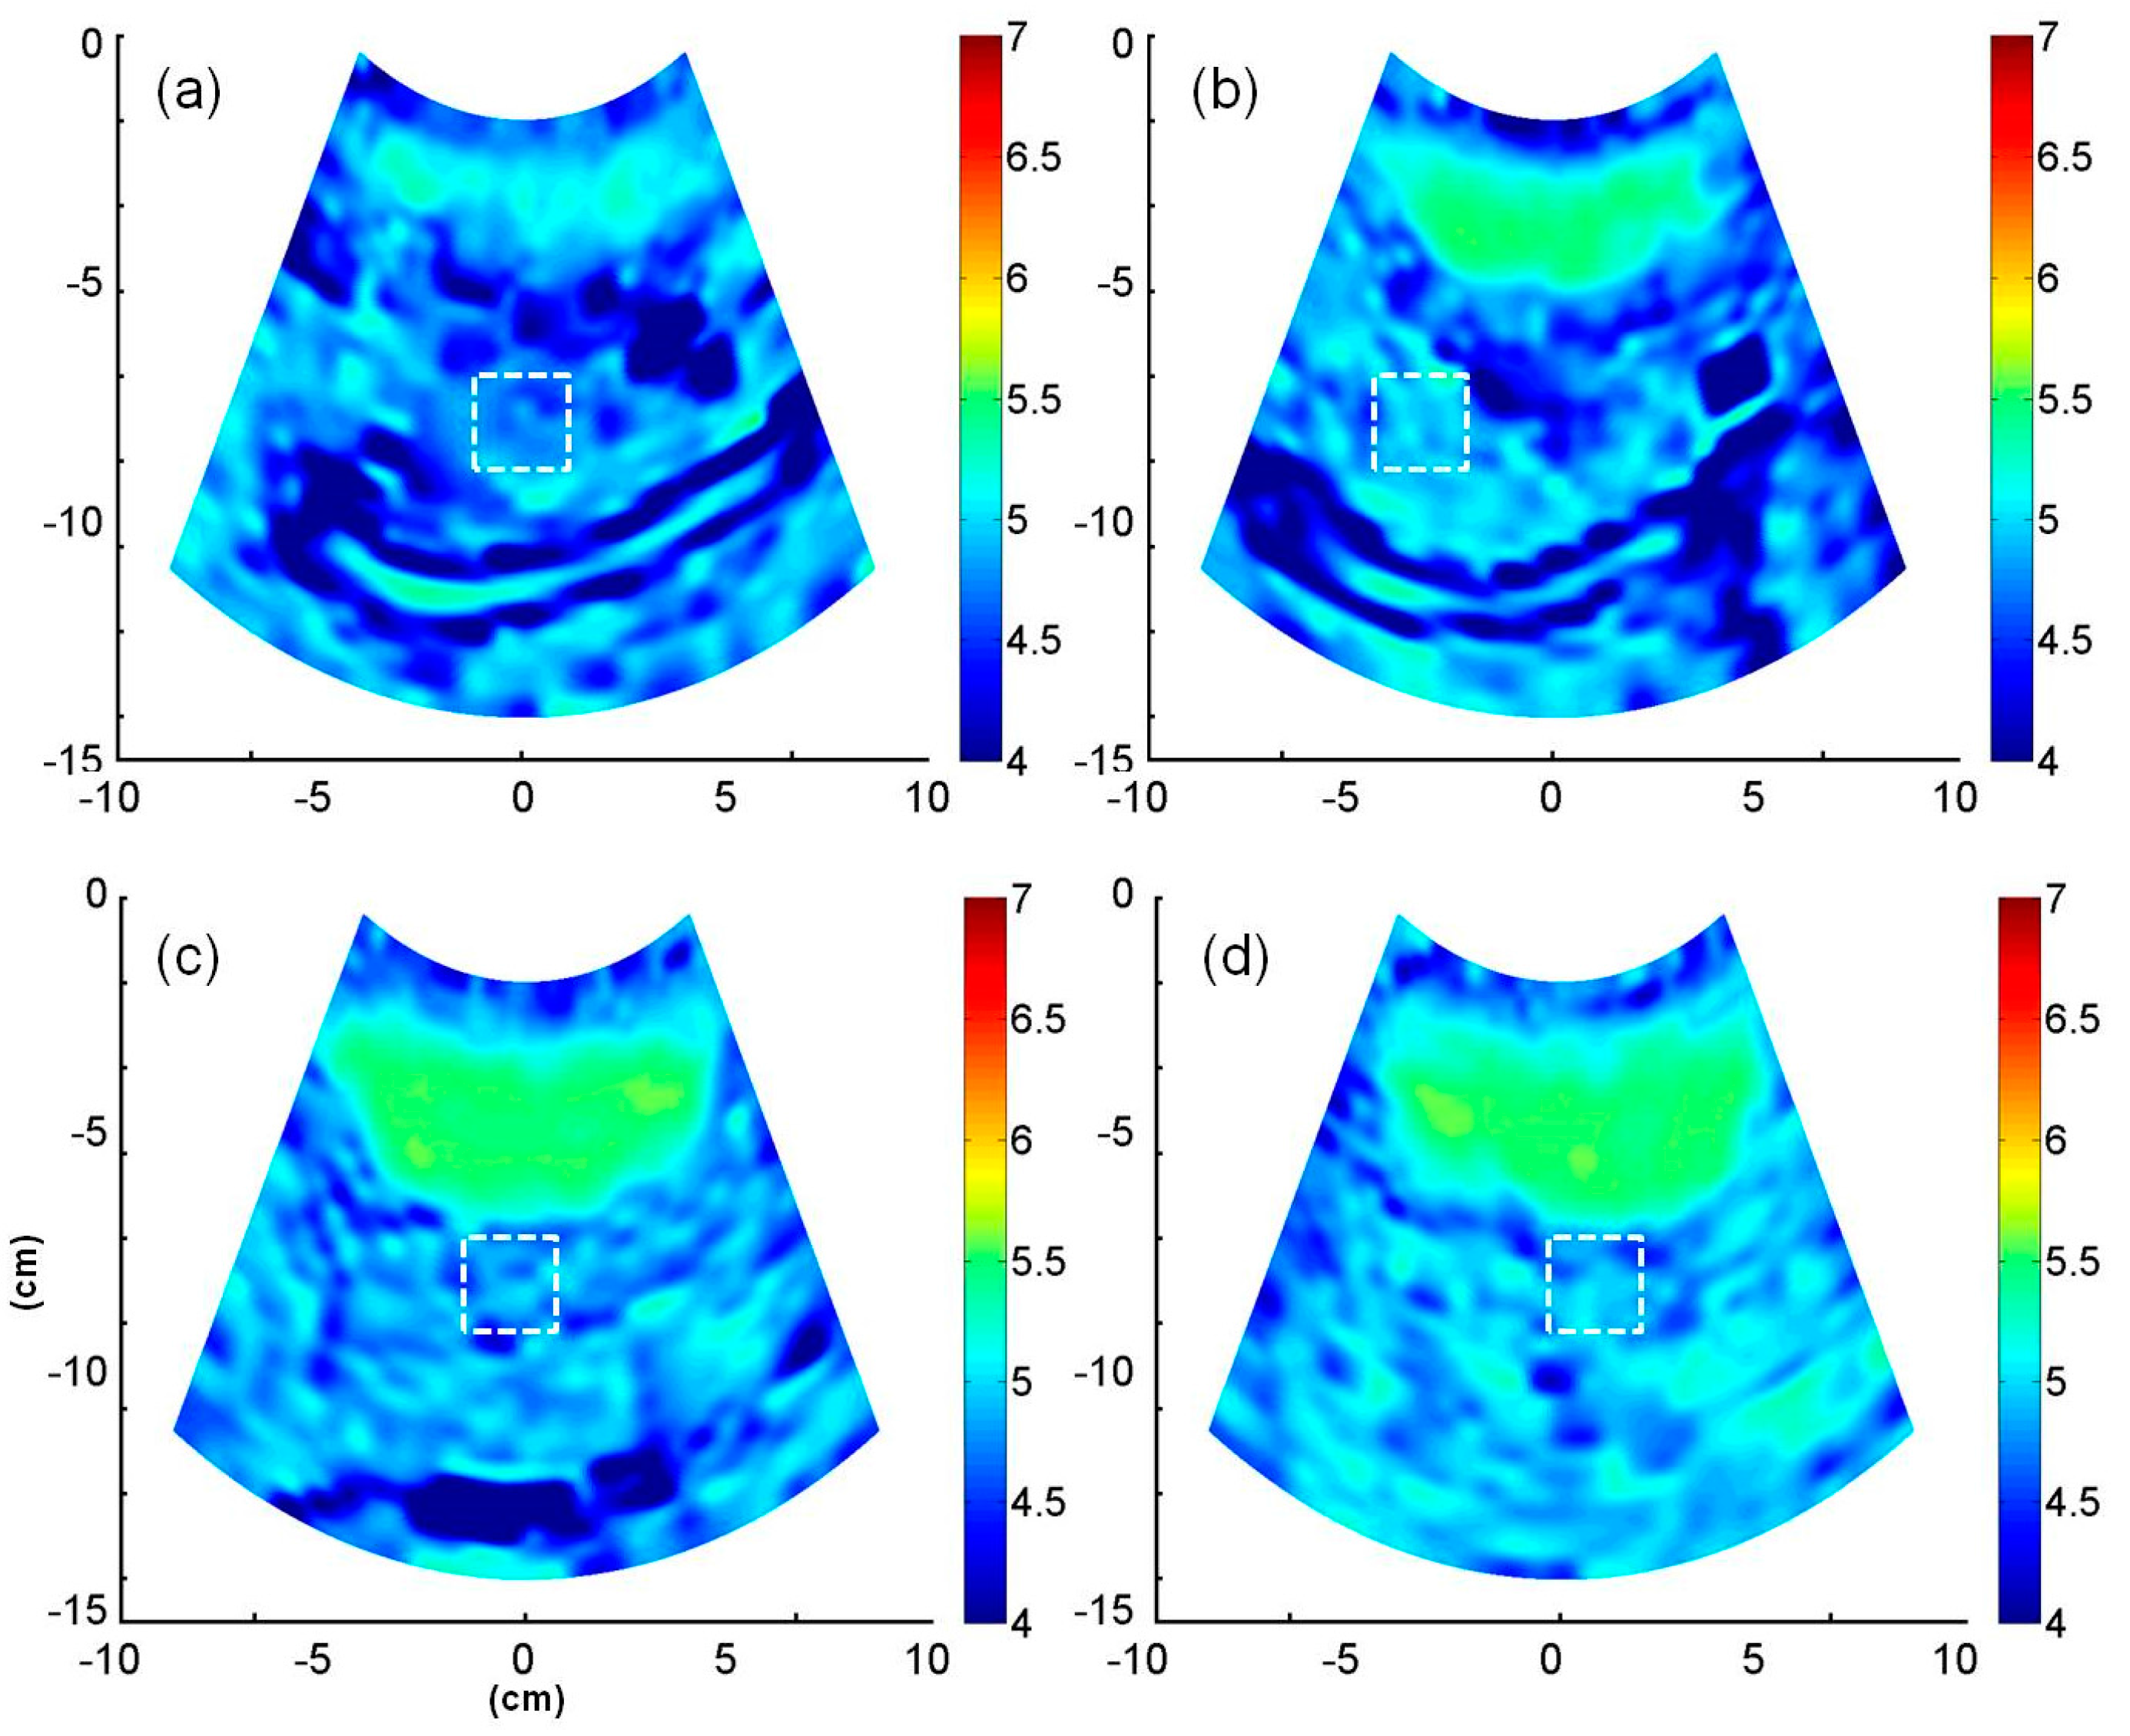
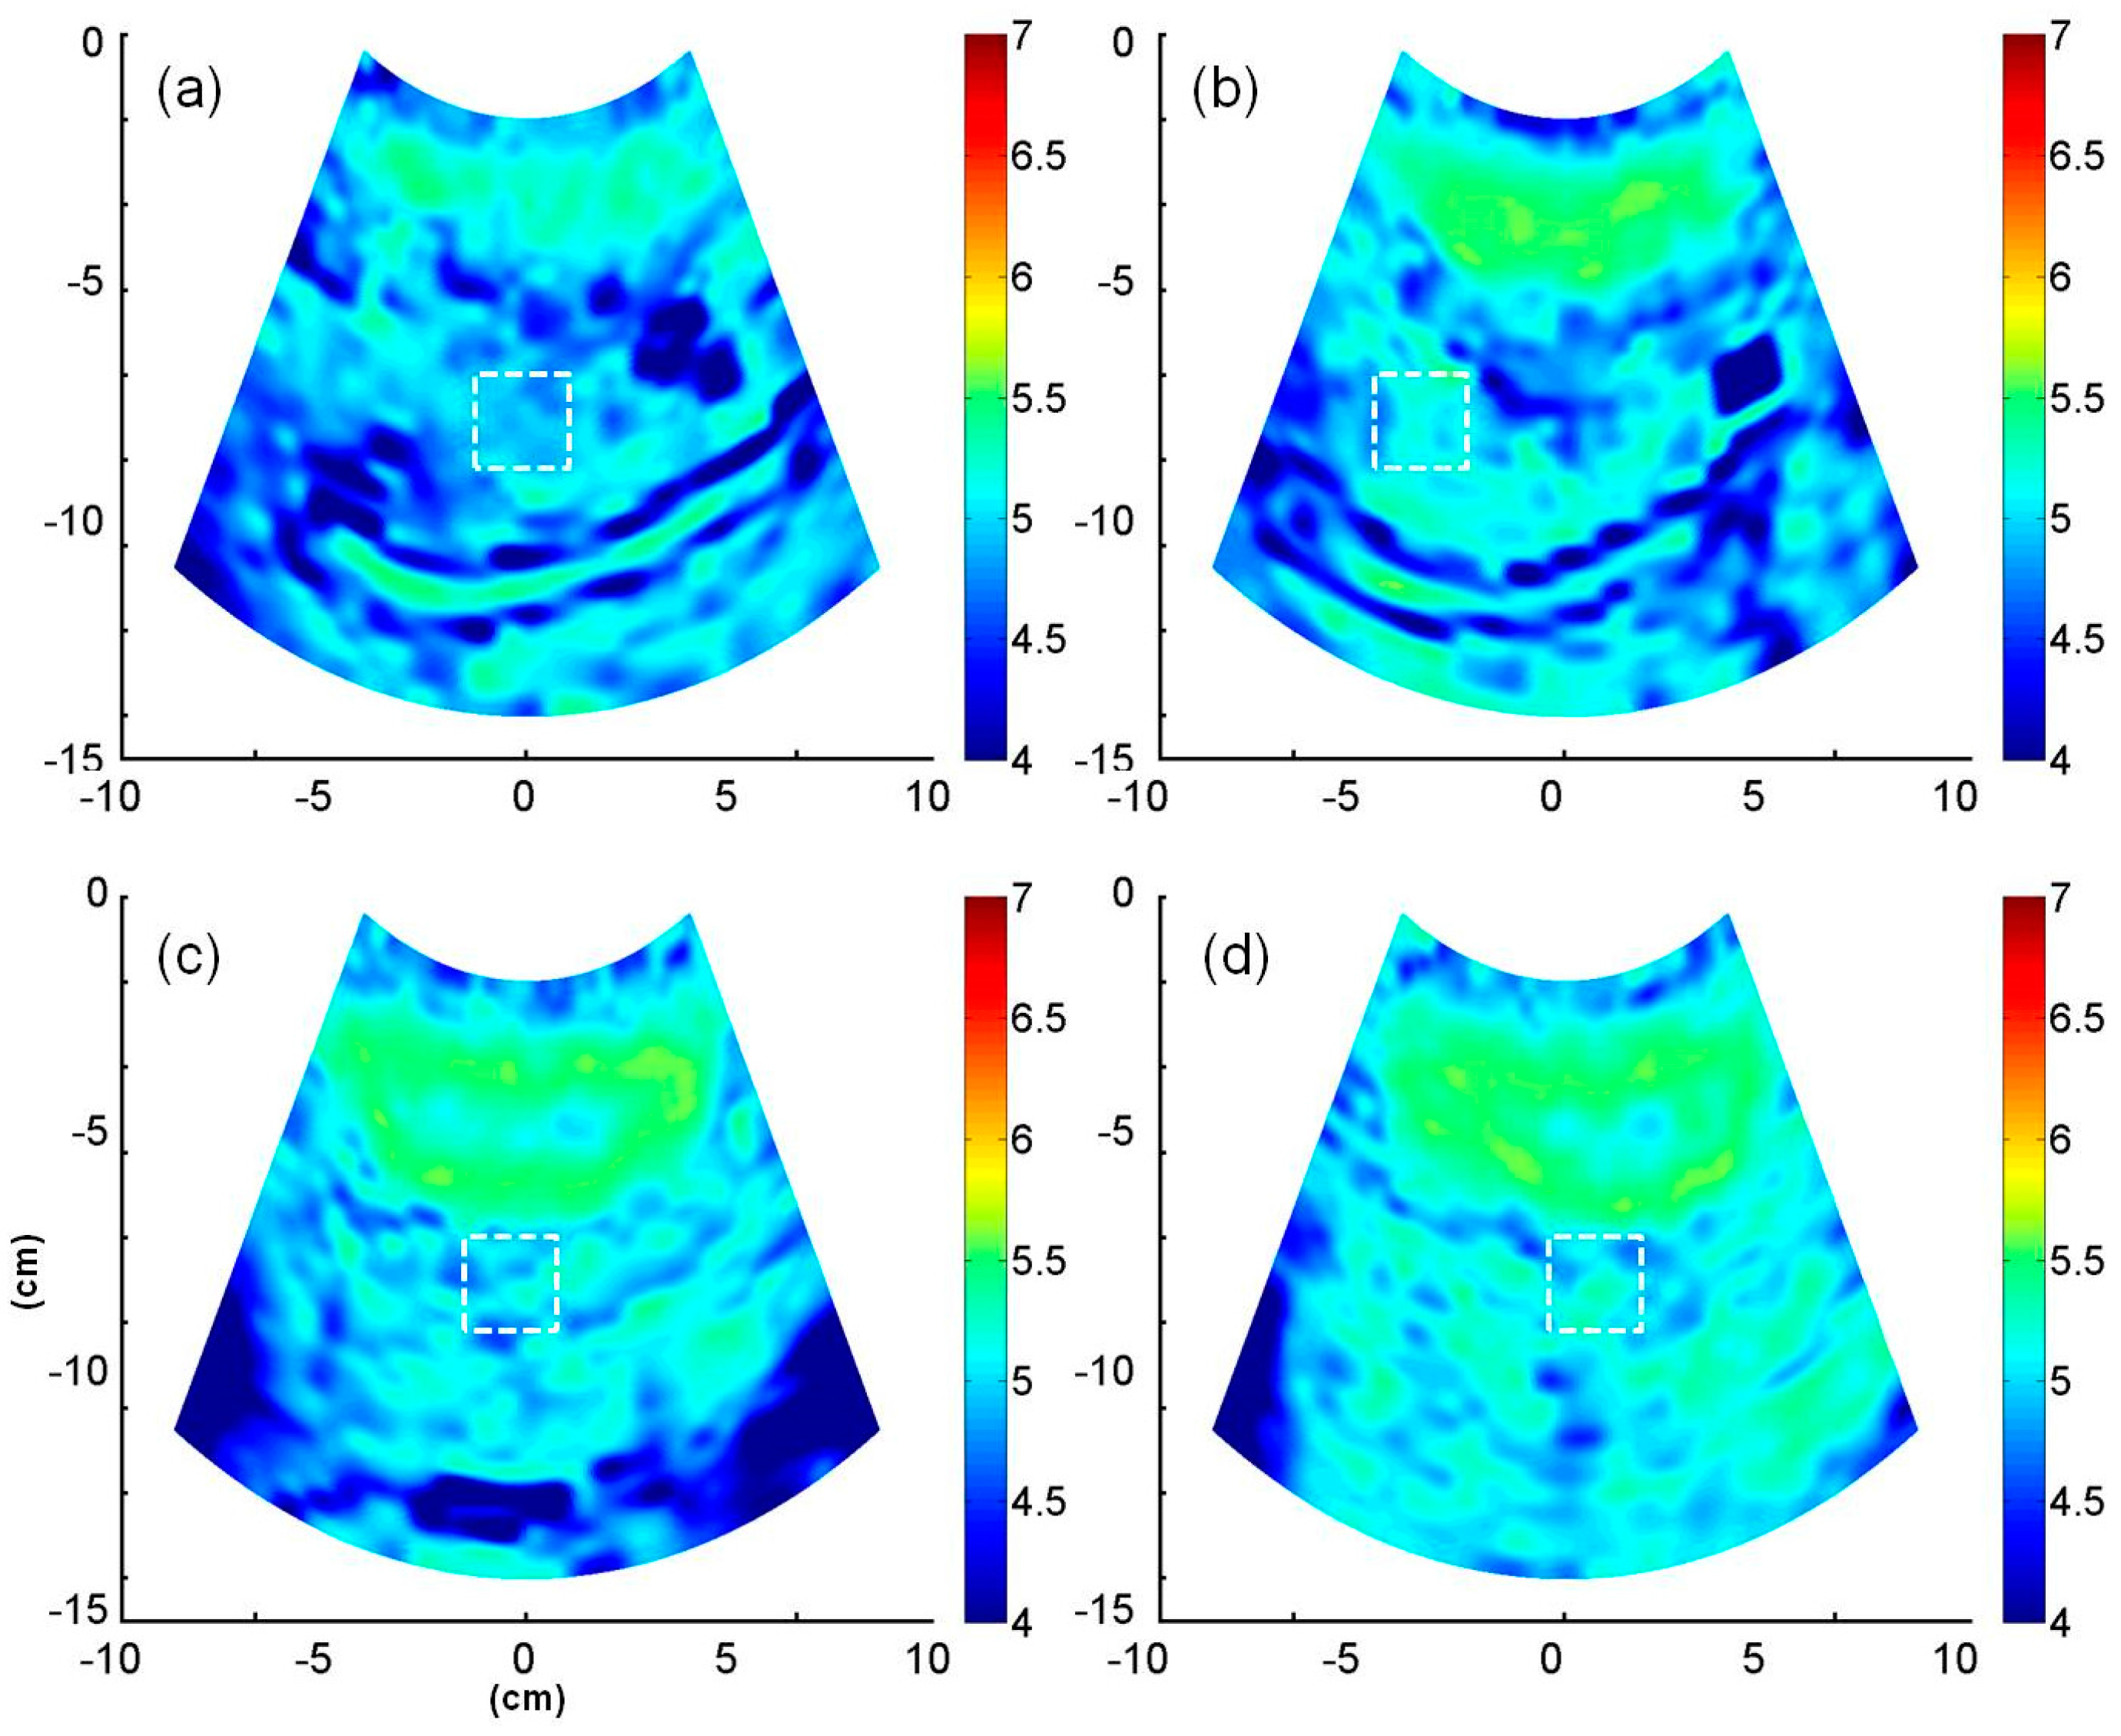
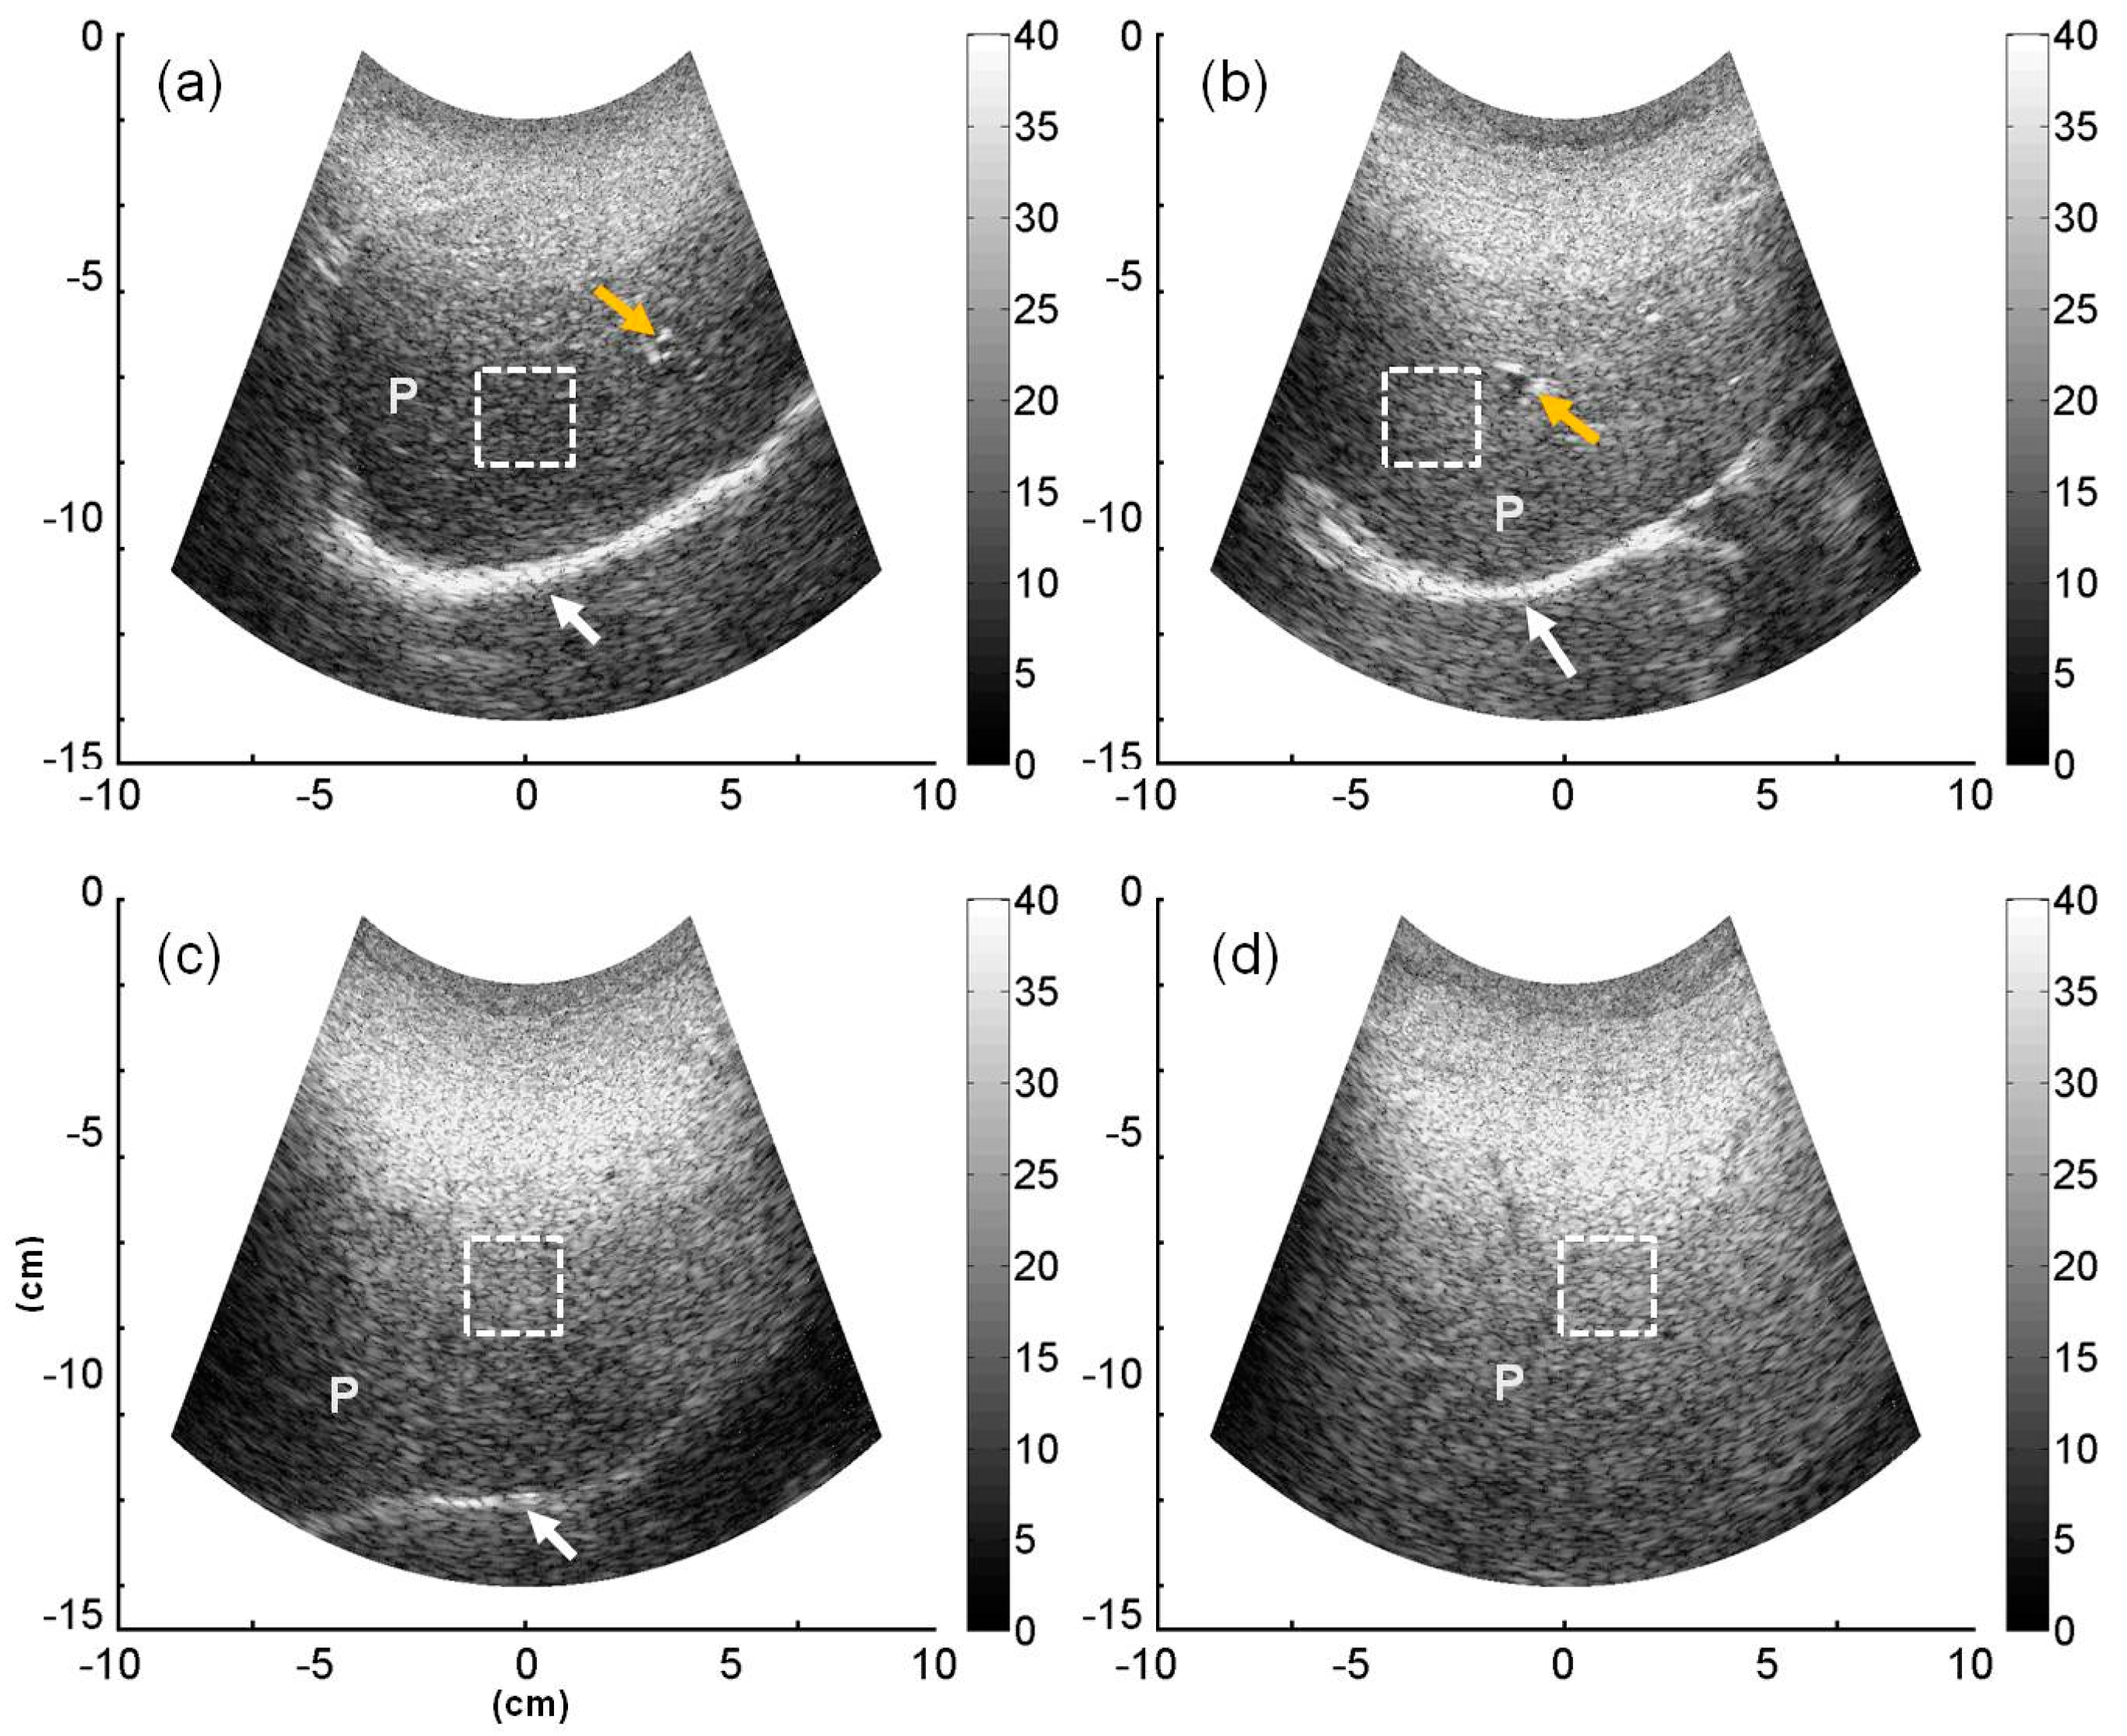
2.4. B-Mode and Entropy Imaging

For each RF datum, the envelope image was constructed using the absolute value of the Hilbert transform, and the B-mode image was formed using a logarithm-compressed envelope image at a dynamic range of 40 dB. The RF data were used for entropy imaging by using a standard sliding window algorithm [30,31] as follows: (i) A square window within the data was used to acquire local RF signals. Different ultrasound systems may produce different dynamic ranges of RF signals (i.e., ymaxymin); therefore, signal normalization was performed to limit the variance of signal amplitudes between −1 and 1; (ii) The normalized RF signals were used for establishing the probability density function w(y) (the statistical histogram using 200 bins was used; the width of a bin was 0.01) and calculating the RF data-based entropy value (denoted by HR) by using Equation (1), which was assigned as the new pixel located in the center of the window; (iii) The window was moved across the entire range of image data in steps of the number of pixels corresponding to a 50% window overlap ratio, and the first step was repeated to yield a HR parametric map. The uncompressed envelope images with normalized amplitude between 0 and 1 were also used for constructing the parametric images of entropy (denoted by HE) using the same algorithmic procedure, as shown in Figure 1. The side length of the square sliding window was determined as being three times the transducer pulse length (6.9 mm), as suggested for ensuring stable estimations for statistical parameters [30,31]. The programming was implemented using MATLAB software (Version R2012a, MathWorks, Inc., Natick, MA, USA).

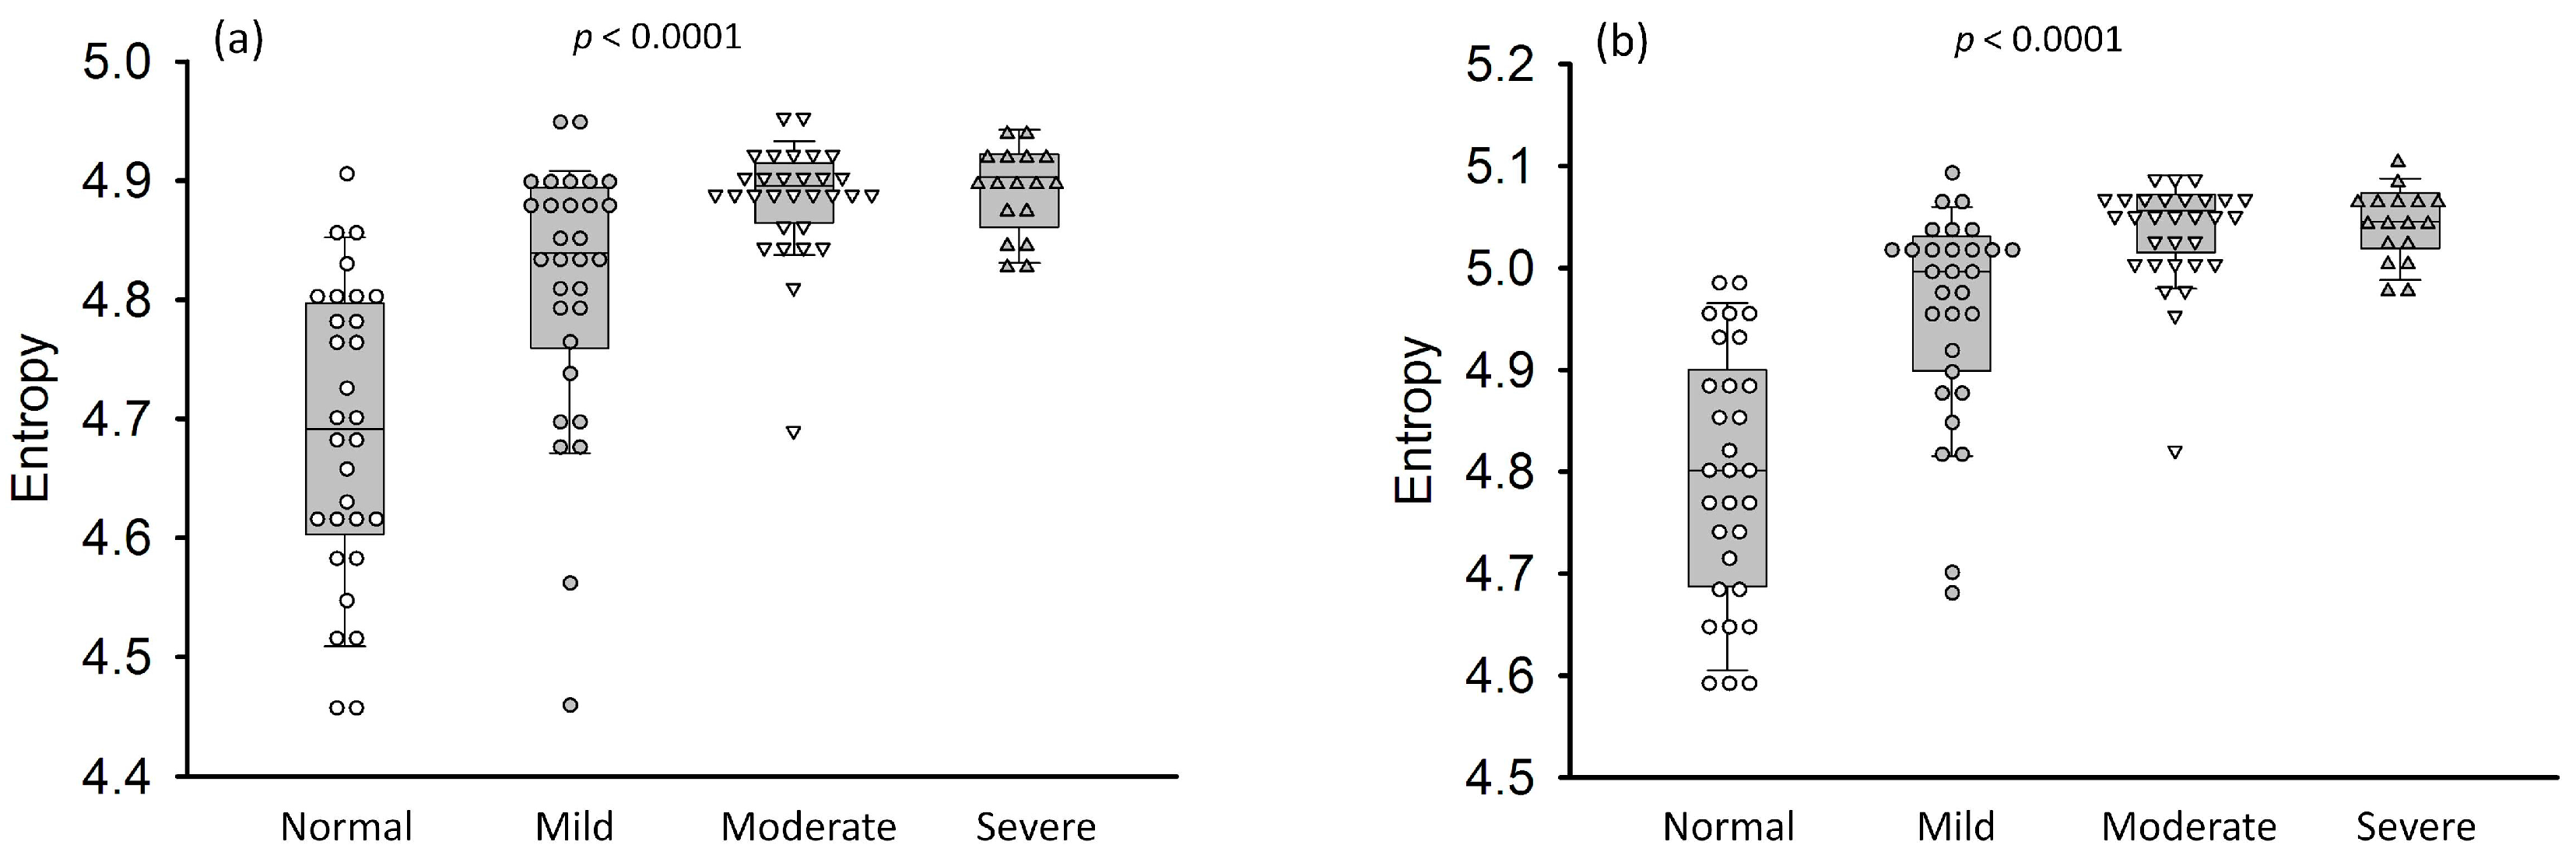
2.5. Statistical Analysis

In the previous study [28], some basic criteria were suggested to select the region of interest (ROI) for liver image analysis: (i) using a relatively small ROI to locate on the liver parenchyma. A small ROI easily excludes blood vessels (e.g., portal venous branches or hepatic veins) to reduce the bias of analyzing liver parenchyma; (ii) the location of the ROI should be at the focal zone, reducing the effects of attenuation and diffraction on the image analysis; (iii) selecting one ROI in individual images obtained from multiple scans of liver for averaging the results. According to the above suggestions, a ROI with a size of 2 × 2 cm2 located at the focal depth in the B-mode image was manually selected by the other radiologist (blinded to the diagnosis of fatty liver) and applied to the corresponding entropy image to collect pixel values (17,746 samples) for averaging. Entropy values estimated using the RF and uncompressed envelope data (HR and HE) as a function of sonographic fatty stage was expressed as the median and the interquartile range (IQR). The Pearson correlation coefficient r and the probability value p were calculated for evaluating the correlation between the entropy and the fatty stage (p < 0.05 means a significant correlation). Then, the normality test was performed to examine whether the entropy values obtained from normal and fatty stages follow the normal distribution (p > 0.05 means a normal distribution). Receiver operating characteristic (ROC) curve analysis with 95% confidence intervals (CIs) was performed to obtain the area under the ROC curve (AUC). The predictive entropy values for diagnosing (i) normal versus fatty livers (≥mild); (ii) normal—mild stages versus moderate—severe stages (≥moderate), and normal—moderate stages versus severe stages (≥severe) were determined by the closest point to (0, 1) on the ROC curve. Under this condition, sensitivity, specificity, and accuracy were reported. All statistical analyses were performed using SigmaPlot software (Version 12.0, Systat Software, Inc., Chicago, IL, USA).

3. Results

Figure 2 shows the grayscale B-mode images obtained from participants with mild, moderate, and severe fatty livers, respectively. For a normal liver, the diaphragm can be clearly visualized in a B-mode image. With increasing degree of fatty liver, a slight increase in the echo brightness can be observed. The acoustic attenuation became significant in severe fatty liver, rendering the diaphragm unable to be visualized. Figure 3 and Figure 4 show the entropy images corresponding to different stages of fatty liver. The brightness of the entropy image typically increased as the fatty stages varied from mild to severe. The entropy values corresponding to each fatty liver stage are presented in Figure 5. The entropy values monotonically increased with fatty liver severity (HR: r = 0.63, p < 0.0001; HE: r = 0.69, p < 0.0001). The median value of HR was 4.69 (IQR: 4.60–4.79) for normal, 4.83 (IQR: 4.77–4.89) for mild, 4.89 (IQR: 4.86–4.91) for moderate, and 4.90 (IQR: 4.87–4.92) for severe fatty livers. The median HE was 4.80 (IQR: 4.69–4.89) for normal, 4.99 (IQR: 4.90–5.02) for mild, 5.05 (IQR: 5.01–5.07) for moderate, and 5.05 (IQR: 5.02–5.07) for severe fatty livers. The ranges (i.e., the difference between the maximum and minimum values) of (HR, HE) were (4.45–4.91, 4.58–4.99) for normal, (4.46–4.96, 4.68–5.09) for mild, (4.69–4.96, 4.82–5.09) for moderate, and (4.83–4.94, 4.97–5.10) for severe fatty livers. The normality test showed that the HR and HE values of normal cases obeyed a normal distribution (p > 0.05), but those of fatty subjects followed a left-skewed distribution (p < 0.05), implying that patients with fatty livers tend to have a higher entropy values. The ROC curves for diagnosing different fatty liver stages are presented in Figure 6. The AUCs of (HR, HE) were (0.88, 0.93), (0.85, 0.88), and (0.74, 0.76) for fatty stages ≥mild, ≥moderate, and ≥severe, respectively. The performance profile for ultrasound entropy imaging is presented in Table 2 and Table 3.

4. Discussion

4.1. Significance of the Study

This study examined ultrasound entropy imaging, an ultrasound parametric imaging technique for signal uncertainty analysis, and explored the effects of fatty infiltration on the entropy value measured from the liver. The experimental results obtained from clinical data showed that fatty infiltration in the liver results in an increase in entropy value corresponding to the increase in signal uncertainty. The current findings indicate that fatty liver severity correlates to the uncertainty of ultrasound backscattered signals.

4.2. Effects of Fatty Infiltration on Ultrasound Entropy

The liver is an organ involved in lipogenesis, gluconeogenesis, and cholesterol metabolism [42]. Insulin and other metabolic hormones control the metabolic function of the liver [43]. In the prandial state, fatty acids are synthesized from glycolytic products through de novo lipogenesis for incorporation into triacylglycerol, phospholipids, and cholesterol esters in hepatocytes. In the postprandial state, the liver secretes glucose through both glycogenolysis and hepatic gluconeogenesis, which is the primary source for endogenous glucose production [43,44]. However, a problematic metabolism in the liver promotes insulin resistance, diabetes, and nonalcoholic fatty liver diseases [43]. Excess dietary fat, increased delivery of free fatty acids to the liver, inadequate fatty acid oxidation, and increased de novo lipogenesis cause the accumulation of fat in the liver [44].
In general, hepatic steatosis is usually seen as macrovesicular steatosis (large droplet steatosis) in which a single large vacuole of fat fills the hepatocyte and displaces the nucleus to the periphery [45]. Therefore, an acoustic model for a fatty liver may be simply simulated using a scattering medium with numerous randomly distributed acoustic scatterers (liver cells) in addition to scatterers with different echogenicities and sizes (fatty vesicles). The aforementioned assumption implies that the formation of fatty liver is a process involving the increasing number density of fatty vesicles in the liver parenchyma. Increasing the scatterer concentration, not only generates a stronger effect of constructive wave interference to cause the echo amplitude distribution to vary toward the Rayleigh distribution [46], but also leads to a larger backscattered amplitude [47,48]. In this condition, various echo amplitudes exist, and the signal uncertainty and unpredictability (entropy) increase [33].

4.3. Potential of Entropy Imaging in Evaluating Fatty Liver

The superiorities of entropy imaging in the assessment of fatty liver are discussed below. Previously, the same clinical database was established to explore the performances of Nakagami [28] and kurtosis [49] parametric imaging in staging fatty liver. The Nakagami parameter correlated with the degree of fatty liver (r obtained from curve fitting = 0.84). The best performance of kurtosis imaging was found when discriminating between normal and fatty livers (≥mild): the AUC was 0.92 (diagnostic accuracy: 86.9%, sensitivity: 86.7%, and specificity: 87.0%). In the present work, entropy imaging constructed using the uncompressed envelope signals provided an improved sensitivity in identifying fatty livers (≥mild), as supported by the results in Table 3 (the AUC of HE: 0.93, sensitivity: 93.33%). As mentioned in Introduction, the sensitivity of conventional ultrasound for staging fatty liver varies between 60% and 94% and is frequently lower when patients with mild fatty changes are examined [10]. A recently published report revealed that the sensitivity of using ASQ for the assessment of hepatic steatosis was 86.2% [24]. The sensitivities of clinically used blood test and biomarkers also vary between 33% and 89% [8]. Compared with the B-scan, quantitative ASQ, blood analysis, Nakagami, and kurtosis imaging, entropy imaging efficiently discriminates between normal and fatty stages of liver tissue with a high diagnostic sensitivity. This finding implies that entropy imaging has potential in identifying the early stage of fatty liver. In particular, the proposed algorithmic scheme of entropy imaging is compatible with standard B-mode scanners, making routine fatty liver evaluations possible.

5. Conclusions

In this study, clinical ultrasound image data were used for constructing entropy parametric images, which were compared with sonographic fatty scores to explore the effects of fatty liver on the signal uncertainty of ultrasound signals. The experimental results demonstrated that fatty infiltration increases the uncertainty of backscattered signals from the liver, which can be visualized using ultrasound entropy imaging. This is due to a process of increasing the number density of fatty vesicles in the liver parenchyma, resulting in various echo amplitude values to increase the entropy. The ROC curve analysis further indicated that entropy imaging constructed using uncompressed envelope signals provided an improved sensitivity (93.33%) in identifying fatty liver. Information entropy is suggested to be combined with standard ultrasound B-mode scanners for the routine examination of fatty liver diseases.

Acknowledgments

This work was supported by the Ministry of Science and Technology (Taiwan) under Grant No. MOST 103-2221-E-182-001-MY3. This work was also supported by the Chang Gung Memorial Hospital (Linkou, Taiwan) under Grant No. CIRPD1E0022, CMRPD1F0311, and CMRPD1C0711.

Author Contributions

Po-Hsiang Tsui: Idea proposal, data analysis, paper writing; Yung-Liang Wan: Experimental design and clinical discussion. Both authors have read and approved the final manuscript.

Conflicts of Interest

The authors declared no conflict of interest.

References

  1. Raff, E.J.; Kakati, D.; Bloomer, J.R.; Shoreibah, M.; Rasheed, K.; Singal, A.K. Diabetes mellitus predicts occurrence of cirrhosis and hepatocellular cancer in alcoholic liver and non-alcoholic fatty liver diseases. J. Clin. Transl. Hepatol. 2015, 3, 9–16. [Google Scholar] [PubMed]
  2. Loomba, R.; Abraham, M.; Unalp, A.; Wilson, L.; Lavine, J.; Doo, E.; Bass, N.M. Association between diabetes, family history of diabetes, and risk of nonalcoholic steatohepatitis and fibrosis. Hepatology 2012, 56, 943–951. [Google Scholar] [CrossRef] [PubMed]
  3. Lin, S.C.; Heba, E.; Wolfson, T.; Ang, B.; Gamst, A.; Han, A.; Erdman, J.W., Jr.; O’Brien, W.D., Jr.; Andre, M.P.; Sirlin, C.B.; et al. Noninvasive Diagnosis of Nonalcoholic Fatty Liver Disease and Quantification of Liver Fat Using a New Quantitative Ultrasound Technique. Clin. Gastroenterol. Hepatol. 2015, 13, 1337–1345. [Google Scholar] [CrossRef] [PubMed]
  4. Sumida, Y.; Nakajima, A.; Itoh, Y. Limitations of liver biopsy and non-invasive diagnostic tests for the diagnosis of nonalcoholic fatty liver disease/nonalcoholic steatohepatitis. World J. Gastroenterol. 2014, 20, 475–485. [Google Scholar] [CrossRef] [PubMed]
  5. Nalbantoglu, I.; Brunt, E.M. Role of liver biopsy in nonalcoholic fatty liver disease. World J. Gastroenterol. 2014, 20, 9026–9037. [Google Scholar] [PubMed]
  6. Wilkins, T.; Tadkod, A.; Hepburn, I.; Schade, R.R. Nonalcoholic fatty liver disease: Diagnosis and management. Am. Fam. Physician 2013, 88, 35–42. [Google Scholar] [PubMed]
  7. Hui, J.M.; Farrell, G.C.; Kench, J.G.; George, J. High sensitivity C-reactive protein values do not reliably predict the severity of histological changes in NAFLD. Hepatology 2004, 39, 1458–1459. [Google Scholar] [CrossRef] [PubMed]
  8. Hassan, K.; Bhalla, V.; Regal, M.E.E.; A-Kader, H.H. Nonalcoholic fatty liver disease: A comprehensive review of a growing epidemic. World J. Gastroenterol. 2014, 20, 12082–12101. [Google Scholar] [CrossRef] [PubMed]
  9. Meisamy, S.; Hines, C.D.G.; Hamilton, G.; Sirlin, C.B.; McKenzie, C.A.; Yu, H.; Brittain, J.H.; Reeder, S.B. Quantification of hepatic steatosis with T1-independent, T2-corrected MR imaging with spectral modeling of fat: Blinded comparison with MR spectroscopy. Radiology 2011, 258, 767–775. [Google Scholar] [CrossRef] [PubMed]
  10. Schwenzer, N.F.; Springer, F.; Schraml, C.; Stefan, N.; Machann, J.; Schick, F. Non-invasive assessment and quantification of liver steatosis by ultrasound, computed tomography and magnetic resonance. J. Hepatol. 2009, 51, 433–445. [Google Scholar] [CrossRef] [PubMed]
  11. Kanayama, Y.; Kamiyama, N.; Maruyama, K.; Sumino, Y. Real-time ultrasound attenuation imaging of diffuse fatty liver disease. Ultrasound Med. Biol. 2013, 39, 692–705. [Google Scholar] [CrossRef] [PubMed]
  12. Lu, Z.F.; Zagzebski, J.A.; Lee, F.T. Ultrasound backscatter and attenuation in human liver with diffuse disease. Ultrasound Med. Biol. 1999, 25, 1047–1054. [Google Scholar] [CrossRef]
  13. Berzigotti, A.; Castera, L. Update on ultrasound imaging of liver fibrosis. J. Hepatol. 2013, 58, 180–182. [Google Scholar] [CrossRef] [PubMed]
  14. Toyoda, H.; Kumada, T.; Kamiyama, N.; Shiraki, K.; Takase, K.; Yamaguchi, T.; Hachiya, H. B-mode ultrasound with algorithm based on statistical analysis of signals: Evaluation of liver fibrosis in patients with chronic hepatitis C. AJR Am. J. Roentgenol. 2009, 193, 1037–1043. [Google Scholar] [CrossRef] [PubMed]
  15. Layer, G.; Zuna, I.; Lorenz, A.; Zerban, H.; Haberkorn, U.; Bannasch, P.; van Kaick, G.; Rath, U. Computerized ultrasound B-scan texture analysis of experimental diffuse parenchymal liver disease: Correlation with histopathology and tissue composition. J. Clin. Ultrasound 1991, 19, 193–201. [Google Scholar] [CrossRef] [PubMed]
  16. Gaitini, D.; Baruch, Y.; Ghersin, E.; Veitsman, E.; Kerner, H.; Shalem, B.; Yaniv, G.; Sarfaty, C.; Azhari, H. Feasibility study of ultrasonic fatty liver biopsy: Texture vs. attenuation and backscatter. Ultrasound Med. Biol. 2004, 30, 1321–1327. [Google Scholar] [CrossRef] [PubMed]
  17. Acharya, U.R.; Faust, O.; Molinari, F.; Sree, S.V.; Junnarkar, S.P.; Sudarshan, V. Ultrasound-based tissue characterization and classification of fatty liver disease: A screening and diagnostic paradigm. Knowl. Based Syst. 2015, 75, 66–77. [Google Scholar] [CrossRef]
  18. Chang, R.F.; Wu, W.J.; Moon, W.K.; Chen, D.R. Automatic ultrasound segmentation and morphology based diagnosis of solid breast tumors. Breast Cancer Res. Treat. 2005, 89, 179–185. [Google Scholar] [CrossRef] [PubMed]
  19. Huang, Y.; Liu, G.J.; Liao, B.; Huang, G.L.; Liang, J.Y.; Zhou, L.Y.; Wang, F.; Li, W.; Xie, X.Y.; Wang, W.; et al. Impact Factors and the Optimal Parameter of Acoustic Structure Quantification in the Assessment of Liver Fibrosis. Ultrasound Med. Biol. 2015, 41, 2360–2367. [Google Scholar] [CrossRef] [PubMed]
  20. Huang, Y.; Wang, Z.; Liao, B.; Liang, J.Y.; Zhou, L.Y.; Wang, F.; Li, W.; Liu, J.Y.; Xie, X.Y.; Lu, M.D.; et al. Assessment of liver fibrosis in chronic hepatitis B using acoustic structure quantification: Quantitative morphological ultrasound. Eur. Radiol. 2016, 26, 2344–2351. [Google Scholar] [CrossRef] [PubMed]
  21. Kuroda, H.; Kakisaka, K.; Kamiyama, N.; Oikawa, T.; Onodera, M.; Sawara, K.; Oikawa, K.; Endo, R.; Takikawa, Y.; Suzuki, K. Non-invasive determination of hepatic steatosis by acoustic structure quantification from ultrasound echo amplitude. World J. Gastroenterol. 2012, 18, 3889–3895. [Google Scholar] [CrossRef] [PubMed]
  22. Onodera, M. The new non-invasive quantification of hepatic steatosis with morbid obesity by acoustic structure quantification (ASQ) from ultrasound echo amplitude. Ultrasound Med. Biol. 2013, 39. [Google Scholar] [CrossRef]
  23. Karlas, T.; Berger, J.; Garnov, N.; Lindner, F.; Busse, H.; Linder, N.; Schaudinn, A.; Relke, B.; Chakaroun, R.; Troltzsch, M.; et al. Estimating steatosis and fibrosis: Comparison of acoustic structure quantification with established techniques. World J. Gastroenterol. 2015, 21, 4894–4902. [Google Scholar] [CrossRef] [PubMed]
  24. Son, J.Y.; Lee, J.Y.; Yi, N.J.; Lee, K.W.; Suh, K.S.; Kim, K.G.; Lee, J.M.; Han, J.K.; Choi, B.I. Hepatic Steatosis: Assessment with Acoustic Structure Quantification of US Imaging. Radiology 2016, 278, 257–264. [Google Scholar] [CrossRef] [PubMed]
  25. Kramer, C.; Jaspers, N.; Nierhoff, D.; Kuhr, K.; Bowe, A.; Goeser, T.; Michels, G. Acoustic structure quantification ultrasound software proves imprecise in assessing liver fibrosis or cirrhosis in parenchymal liver diseases. Ultrasound Med. Biol. 2014, 40, 2811–2818. [Google Scholar] [CrossRef] [PubMed]
  26. Ghoshal, G.; Lavarello, R.J.; Kemmerer, J.P.; Miller, R.J.; Oelze, M.L. Ex vivo study of quantitative ultrasound parameters in fatty rabbit livers. Ultrasound Med. Biol. 2012, 38, 2238–2248. [Google Scholar] [CrossRef] [PubMed]
  27. Ho, M.C.; Lee, Y.H.; Jeng, Y.M.; Chen, C.N.; Chang, K.J.; Tsui, P.H. Relationship between ultrasound backscattered statistics and the concentration of fatty droplets in livers: An animal study. PLoS ONE 2013, 8, e63543. [Google Scholar] [CrossRef] [PubMed]
  28. Wan, Y.L.; Tai, D.I.; Ma, H.Y.; Chiang, B.H.; Chen, C.K.; Tsui, P.H. Effects of fatty infiltration in human livers on the backscattered statistics of ultrasound imaging. Proc. Inst. Mech. Eng. H 2015, 229, 419–428. [Google Scholar] [CrossRef] [PubMed]
  29. Smolikova, R.; Wachowiak, M.P.; Zurada, J.M. An information-theoretic approach to estimating ultrasound backscatter characteristics. Comput. Biol. Med. 2004, 34, 355–370. [Google Scholar] [CrossRef]
  30. Tsui, P.H.; Huang, C.C.; Sun, L.; Dailey, S.H.; Shung, K.K. Characterization of lamina propria and vocal muscle in human vocal fold tissue by ultrasound Nakagami imaging. Med. Phys. 2011, 38, 2019–2026. [Google Scholar] [CrossRef] [PubMed]
  31. Zhou, Z.; Huang, C.C.; Shung, K.K.; Tsui, P.H.; Fang, J.; Ma, H.Y.; Wu, S.; Lin, C.C. Entropic imaging of cataract lens: An in vitro study. PLoS ONE 2014, 9, e96195. [Google Scholar] [CrossRef] [PubMed]
  32. Shankar, P.M. Comments on ‘The effect of logarithmic compression on the estimation of the Nakagami parameter for ultrasonic tissue characterization’. Phys. Med. Biol. 2006, 51, L23–L26. [Google Scholar] [CrossRef] [PubMed]
  33. Tsui, P.H. Ultrasound detection of scatterer concentration by weighted entropy. Entropy 2015, 17, 6598–6616. [Google Scholar] [CrossRef]
  34. Shannon, C.E. A Mathematical Theory of Communication. Bell Syst. Tech. J. 1948, 27, 379–423. [Google Scholar] [CrossRef]
  35. Hughes, M.S. Analysis of ultrasonic waveforms using Shannon entropy. IEEE Ultrason. Symp. Proc. 1992, 1, 1205–1209. [Google Scholar]
  36. Hughes, M.S. Analysis of digitized waveforms using Shannon entropy. J. Acoust. Soc. Am. 1993, 93, 892–906. [Google Scholar] [CrossRef]
  37. Hughes, M.S. Analysis of digitized waveforms using Shannon entropy. II. High speed algorithms based on Green’s functions. J. Acoust. Soc. Am. 1994, 95, 2582–2588. [Google Scholar] [CrossRef]
  38. Hughes, M.S.; McCarthy, J.E.; Marsh, J.N.; Arbeit, J.M.; Neumann, R.G.; Fuhrhop, R.W.; Wallace, K.D.; Znidersic, D.R.; Maurizi, B.N.; Baldwin, S.L.; et al. Properties of an entropy-based signal receiver with an application to ultrasonic molecular imaging. J. Acoust. Soc. Am. 2007, 121, 3542–3557. [Google Scholar] [CrossRef] [PubMed]
  39. Hughes, M.S.; McCarthy, J.E.; Marsh, J.N.; Wickline, S.A. Joint entropy of continuously differentiable ultrasonic waveforms. J. Acoust. Soc. Am. 2013, 133, 283–300. [Google Scholar] [CrossRef] [PubMed]
  40. Yeung, R.W. A First Course in Information Theory; Kluwer Academic/Plenum Publishers: New York, NY, USA, 2002. [Google Scholar]
  41. Chan, D.F.Y.; Li, A.M.; Chu, W.C.W.; Chan, M.H.M.; Wong, E.M.C.; Liu, E.K.H.; Chan, I.H.S.; Yin, J.; Lam, C.W.K.; Fok, T.F.; et al. Hepatic steatosis in obese Chinese children. Int. J. Obes. Relat. Metab. Disord. 2004, 28, 1257–1263. [Google Scholar] [CrossRef] [PubMed]
  42. Bechmann, L.P.; Hannivoort, R.A.; Gerken, G.; Hotamisligil, G.S.; Trauner, M.; Canbay, A. The interaction of hepatic lipid and glucose metabolism in liver diseases. J. Hepatol. 2012, 56, 952–964. [Google Scholar] [CrossRef] [PubMed]
  43. Rui, L. Energy metabolism in the liver. Compr. Physiol. 2014, 4, 177–197. [Google Scholar] [PubMed]
  44. Bugianesi, E.; Moscatiello, S.; Ciaravella, M.F.; Marchesini, G. Insulin resistance in nonalcoholic fatty liver disease. Curr. Pharm. Des. 2010, 16, 1941–1951. [Google Scholar] [CrossRef] [PubMed]
  45. Tandra, S.; Yeh, M.M.; Brunt, E.M.; Vuppalanchi, R.; Cummings, O.W.; Unalp-Arida, A.; Wilson, L.A.; Chalasani, N. Presence and significance of microvesicular steatosis in nonalcoholic fatty liver disease. J. Hepatol. 2011, 55, 654–659. [Google Scholar] [CrossRef] [PubMed]
  46. Shankar, P.M. A general statistical model for ultrasonic backscattering from tissues. IEEE Trans. Ultrason. Ferroelectr. Freq. Control 2000, 47, 727–736. [Google Scholar] [CrossRef] [PubMed]
  47. Tsui, P.H.; Chang, C.C.; Ho, M.C.; Lee, Y.H.; Chen, Y.S.; Chang, C.C.; Huang, N.E.; Wu, Z.H.; Chang, K.J. Use of Nakagami statistics and empirical mode decomposition for ultrasound tissue characterization by a nonfocused transducer. Ultrasound Med. Biol. 2009, 35, 2055–2068. [Google Scholar] [CrossRef] [PubMed]
  48. Shung, K.K.; Thieme, G.A. Ultrasonic Scattering in Biological Tissues; CRC Press: Boca Raton, FL, USA, 1993. [Google Scholar]
  49. Ma, H.Y.; Zhou, Z.; Wu, S.; Wan, Y.L.; Tsui, P.H. A Computer-aided diagnosis scheme for detection of fatty liver in vivo based on ultrasound kurtosis imaging. J. Med. Syst. 2016, 40. [Google Scholar] [CrossRef] [PubMed]
Figure 1. Algorithmic scheme designed for constructing the B-mode and information entropy images by using the backscattered signals. The B-mode image was formed using a logarithm-compressed envelope image. The image RF and uncompressed envelope data were used for entropy estimation (HR and HE) and imaging by using a standard sliding window algorithm.
Entropy 18 00341 g001
Figure 2. Grayscale B-mode images obtained from the participants with (a) normal; (b) mild; (c) moderate; and (d) severe fatty livers. The square windows with white dotted lines represent ROIs. The text “P” means the liver parenchyma. The white and orange arrows indicate the diaphragm and vessels (portal vein), respectively.
Entropy 18 00341 g002
Figure 3. Entropy images (based on HR, constructed using the RF data) corresponding to (a) normal; (b) mild; (c) moderate; and (d) severe fatty livers. The square windows with white dotted lines represent ROIs.
Entropy 18 00341 g003
Figure 4. Entropy images (based on HE, constructed using the uncompressed envelope data) corresponding to (a) normal; (b) mild; (c) moderate; and (d) severe fatty livers. The square windows with white dotted lines represent ROIs.
Entropy 18 00341 g004
Figure 5. Entropy values corresponding to each fatty liver stage (a) HR value; (b) HE value. Entropy as a function of sonographic fatty stage is expressed as the median and IQR. The median HR value increased from 4.69 (IQR: 4.60–4.79) to 4.90 (IQR: 4.87–4.92) with fatty liver severity (r = 0.63, p < 0.0001). Concurrently, the median HE value increased from 4.80 (IQR: 4.69–4.89) to 5.05 (IQR: 5.02–5.07), corresponding to a larger range and a higher correlation coefficient (r = 0.69, p < 0.0001).
Entropy 18 00341 g005
Figure 6. ROC curves for diagnosing different fatty liver stages using entropy imaging based on (a) HR and (b) HE. The AUCs obtained using HR (95% CIs) were 0.88 (0.81–0.95), 0.85 (0.78–0.92), and 0.74 (0.64–0.85) for fatty stages ≥mild, ≥moderate, and ≥severe, respectively. The AUCs of HE (95% CIs) were 0.93 (0.87–0.99), 0.88 (0.82–0.94), and 0.76 (0.65–0.87) for fatty stages ≥mild, ≥moderate, and ≥severe, respectively. Compared with HR, using HE for ultrasound entropy imaging provided an improved performance in detecting fatty liver.
Entropy 18 00341 g006
Table 1. Ultrasound scoring system of fatty liver. Overall scores of 1–3, 4–6, and 7–9 indicate mild, moderate, and severe fatty liver changes, respectively [41]. The score of 0 means a normal liver.
US FeaturesScoreDefinition
Liver echotexture0Echo level of the liver parenchyma is homogeneous and no difference in contrast between liver parenchyma and kidney parenchyma
1Slightly increase in echo pattern of the liver
2Intermediate between score 1 and 3
3Gross discrepancy of the increased hepatic to renal cortical echogenicity
Echo penetration and visibility of diaphragm0Liver structure is clearly defined from the surface to the diaphragm. The outline of the diaphragm is clearly visualized
1Mild attenuation of sound beam through the liver
2Intermediate between score 1 and 3
3Marked attenuation of sound beam through the liver. The diaphragm is not visualized
Clarity of liver vessel structures (portal vein)0Vessel wall and lumen of the vessel can be clearly visualized
1Slight decreased definition of portal venule walls
2Intermediate between score 1 and 3
3Only the main portal walls can be visualized with absence of all smaller portal venule walls
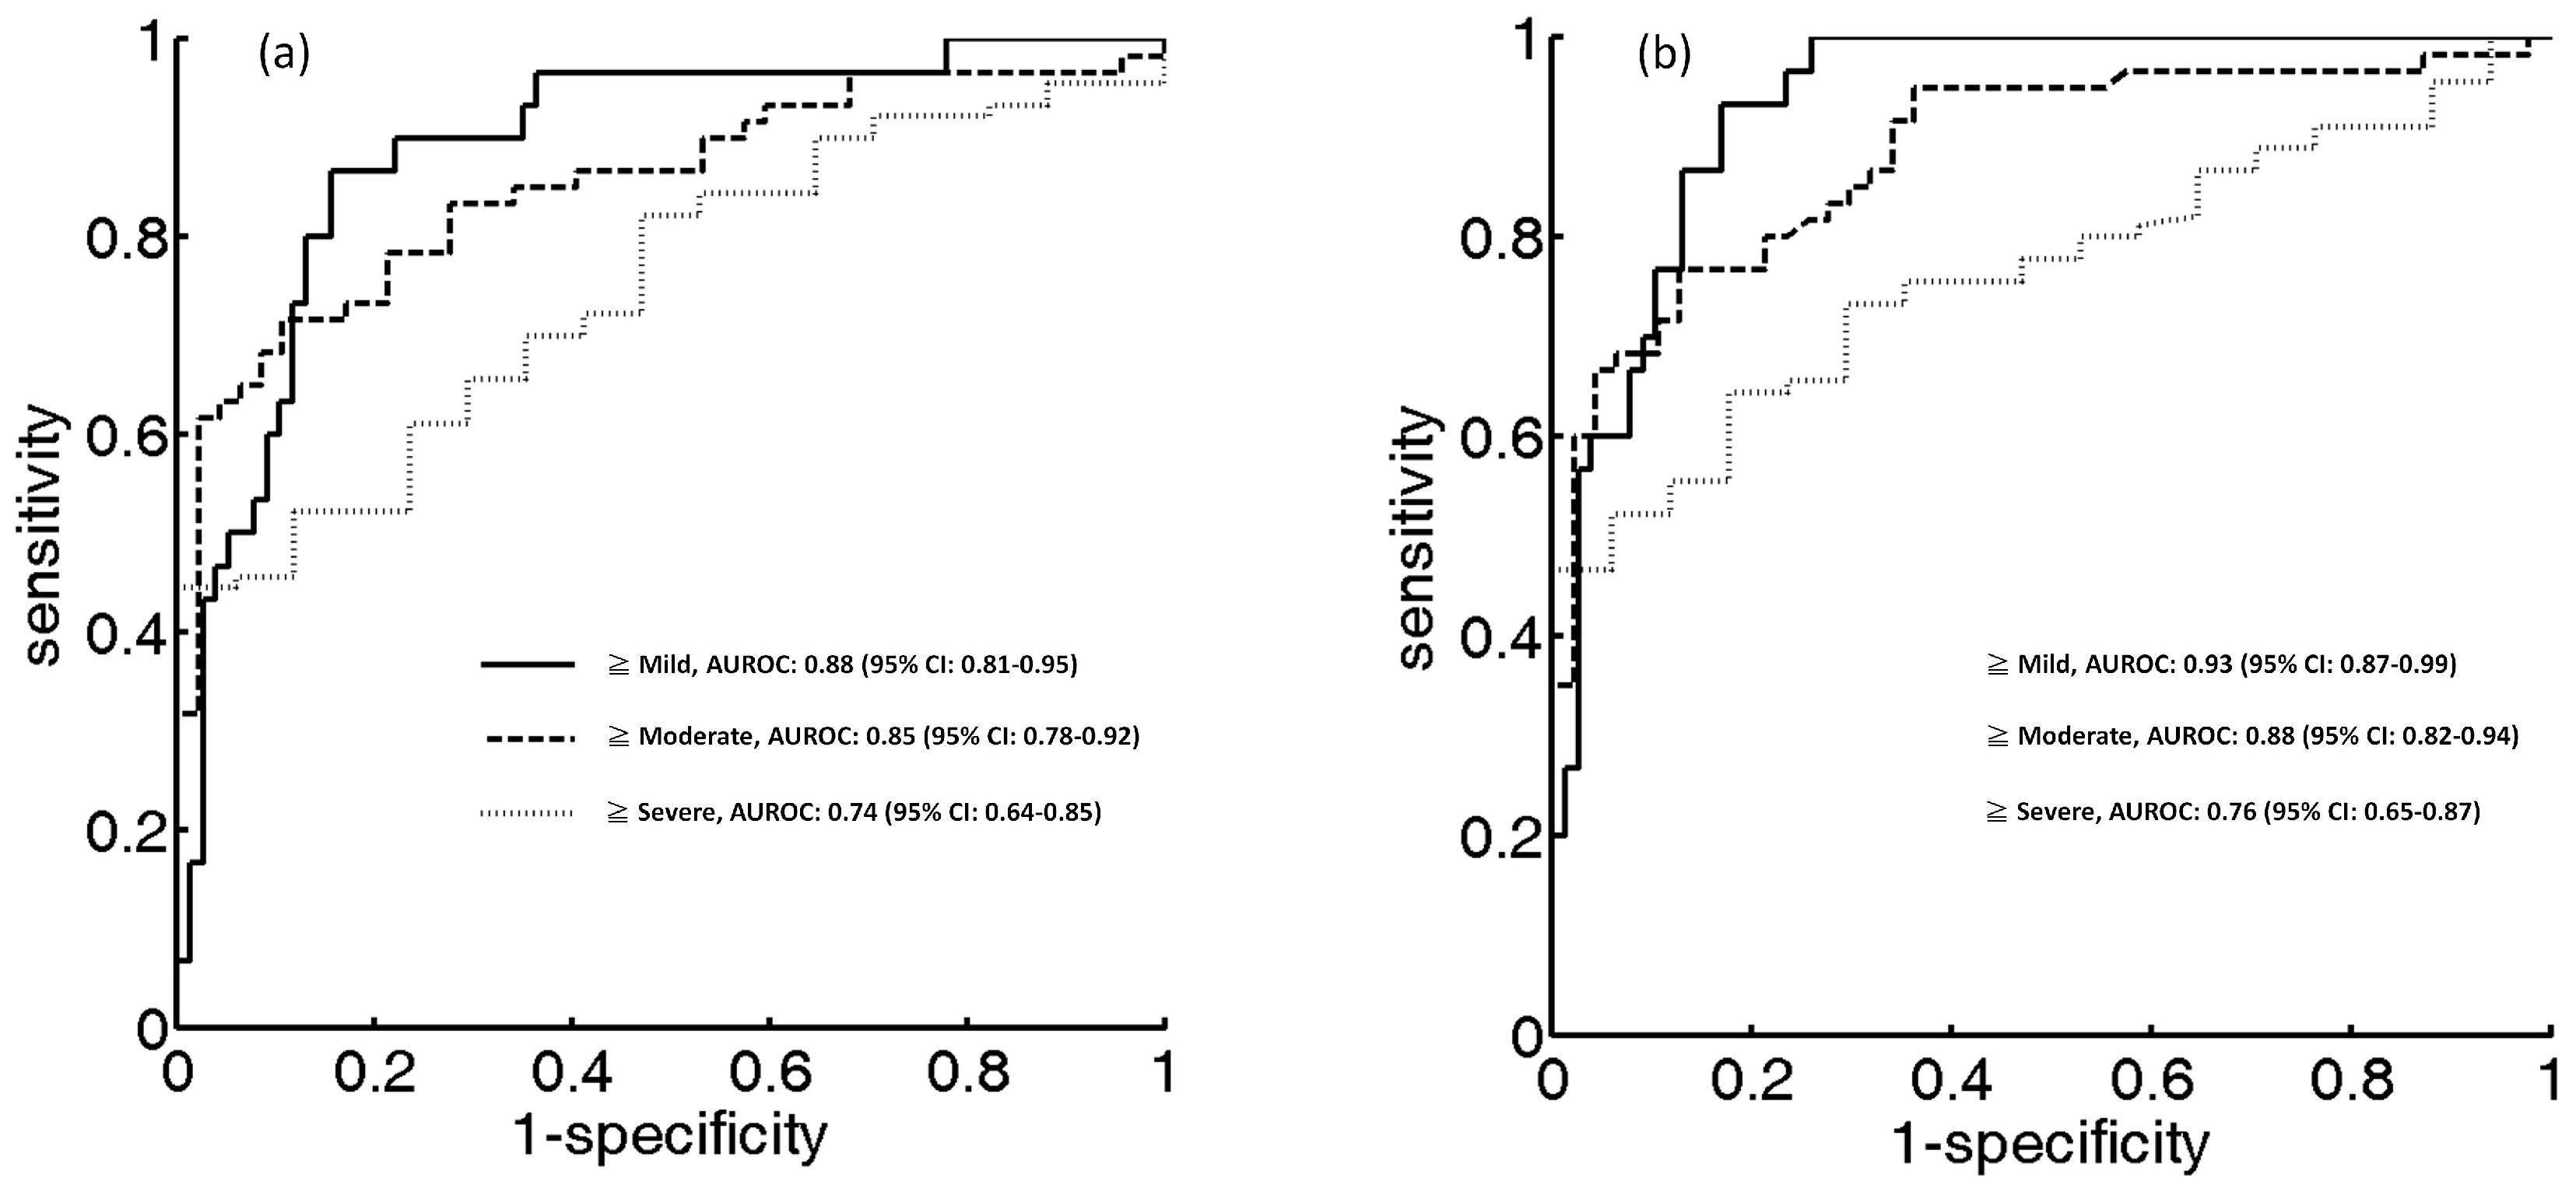
Table 2. Clinical performance of ultrasound entropy imaging in the assessment of fatty liver (obtained using the RF signals).
Parameter≥Mild≥Moderate≥Severe
Cutoff value of HR4.814.834.88
Sensitivity, %84.4289.3670.59
Specificity, %86.6770.0064.44
Accuracy, %85.0479.4366.35
LR+6.332.971.98
LR−0.170.150.45
PPV, %68.4289.5892.18
NPV, %94.2071.1827.90
AUC (95% CI)0.88 (0.81–0.95)0.85 (0.78–0.92)0.74 (0.64–0.85)
LR+: positive likelihood ratio; LR−: negative likelihood ratio; PPV: positive predictive value; NPV: negative predictive value, AUC: area under the receiver operating characteristics curve.
Table 3. Clinical performance of ultrasound entropy imaging in the assessment of fatty liver (obtained using the uncompressed envelope signals).
Parameter≥Mild≥Moderate≥Severe
Cutoff value of HE4.964.995.01
Sensitivity, %93.3376.6664.44
Specificity, %83.1187.2382.35
Accuracy, %86.0081.3067.28
LR+5.526.003.65
LR−0.080.260.43
PPV, %68.2988.4695.08
NPV, %96.9674.5430.43
AUC (95% CI)0.93 (0.87–0.99)0.88 (0.82–0.94)0.76 (0.65–0.87)

