
Network Entropies of the Chinese Financial Market


School of Economics and Management, Southeast University, Nanjing 211189, China
*
Author to whom correspondence should be addressed.
Entropy 2016, 18(9), 331; https://doi.org/10.3390/e18090331
Submission received: 23 July 2016
/
Revised: 22 August 2016
/
Accepted: 3 September 2016
/
Published: 8 September 2016
Abstract
:Based on the data from the Chinese financial market, this paper focuses on analyzing three types of network entropies of the financial market, namely, Shannon, Renyi and Tsallis entropies. The findings suggest that Shannon entropy can reflect the volatility of the financial market, that Renyi and Tsallis entropies also have this function when their parameter has a positive value, and that Renyi and Tsallis entropies can reflect the extreme case of the financial market when their parameter has a negative value.
1. Introduction
Before the recent financial crisis, the economic/financial network was mentioned only infrequently. However, it has now caught the attention of both academics and policy makers [1,2]. The importance of studying the financial connectivity from the network perspective stems from the fact that it can serve as a channel for propagation and amplification of shocks, and has been directly linked to the stability of economic/financial systems [3]. The financial market is an example of a complex system, and can be represented as a network. This allows for the analysis of the financial market based on methods and tools of the complex network theory. Mantegna [4] first represents the financial market as a network, and observes the hierarchical structure in the US stock market based on the correlation matrix of asset returns, where a minimum spanning tree is generated in order to select the most important connections. After that, many researchers constructed financial market networks and analyzed their properties, for example [5,6,7,8,9,10,11,12,13,14].
Many different entropy measures have been developed in the context of complex networks [15,16,17,18,19,20,21,22,23]. For example, Bianconi [17] proposes entropy as an indicator to assess the role of each structural feature in a given real network, and observes that the ensembles with fixed scale-free degree distribution have smaller entropy than the ensembles with homogeneous degree distribution, indicating a higher level of order in scale-free networks. Anand and Bianconi [20] present how to define the Shannon entropy of a network ensemble and how it relates to the Gibbs and von Neumann entropies of network ensembles. Zhang et al. [22] give a new information dimension based on Tsallis entropy to show the influence of different parts in the complex networks to the information dimension. Nie et al. [23] propose a new concept called mapping entropy to identify the importance of a node in the complex network.
Many different entropies have been adopted to study financial markets [24,25,26,27], but there is limited research on the network entropy of financial markets. The rare instances are Peron et al. [10] who adopt a Shannon entropy-related measurement to quantify the robustness of the evolving financial market organization, and propose a statistical robust regression model to quantify the relationship between the network structure and resilience. Lee [28] proposes network entropy as a tool for measuring diversity of highly connected financial networks, where the computation of network entropy hinges on eigenvector centrality and Shannon entropy.
In this paper, we focus on analyzing the properties of the three types of network entropies of the financial market, namely, Shannon, Renyi and Tsallis entropies. Closest to our work are Peron et al. [10] and Lee [28]. However, our paper is different from theirs in terms of network entropies. The network entropies analyzed in this paper include Renyi and Tsallis entropies besides Shannon entropy. In this paper, based on the data from the Chinese financial market, we find that it is suitable to employ network entropies to investigate the volatility and extreme case of the financial market.
2. Methodology
2.1. Network Construction
Let be the time span for stocks. Following the study of Peron et al. [10], we construct dynamic financial networks by setting a time window of length days at -day intervals. Let be the log-return series of stock i in the th window. Moreover, we can obtain the correlation coefficient and the distance between two stocks i and j in the th window, which are given as follows.
where denotes the statistical mean of . The distances among stocks in the th window form a distance matrix. We can construct a financial network based on this matrix, where every stock denotes a network node, and nodes i and j are connected by an edge with the weight . The weights range from 1 to exp(−2). The measure () allows us to consider the traditional representation of weighted networks, in which the strongest edges connect the stocks with most similar time series. Moreover, the th financial network is constructed by the log-return series starting at day and ending at day , and the number of financial networks constructed is equal to INT(), where INT() denotes the integral part of .
2.2. Network Entropy
In order to define network entropies of the financial market, we need to transform adjacency matrices into stochastic matrices to apply the concept of entropy. In this paper, we adopt the method proposed by Demetrius and Manke [29]. According to the adjacency matrix of the th financial network , we can obtain a stochastic matrix from the following formula [28].
Therefore, the th row of the stochastic matrix can be regarded as a transition probability distribution. Moreover, according to the formulas of Shannon, Renyi and Tsallis entropies [30,31,32], we can obtain Shannon entropy (), Renyi entropy () and Tsallis entropy () of node i of the th financial network, which are given as follows, respectively.
Compared with the Shannon entropy, the Renyi and Tsallis entropies have the parameter α. However, they reduce to the Shannon entropy for α = 1. The additional parameter α can be used to make them more or less sensitive to the shape of probability distributions. Therefore, the parameter α in the Renyi and Tsallis entropies places a weight on the center or the tails of the frequency distributions of the log-returns, and affects the results of the Renyi and Tsallis entropies. Shannon entropy (), Renyi entropy () and Tsallis entropy () of the th financial network are defined as the weighted sum of entropies of nodes, which are given, respectively, as
where is the th component of the unique invariant distribution of the corresponding stochastic matrix .
3. Results
3.1. Data
During the last decade, the Shanghai Stock Exchange has exhibited higher P/E (Price-to-Earnings) ratios and investment performance criteria than the most developed and emerging markets [33]. It is now an important emerging market in the world, which attracts much attention [33,34,35]. In this paper, we adopt the data from the A-share market of the Shanghai Stock Exchange to conduct empirical analysis. We focus on identifying the recent financial crises, and thus we select 262 stocks from this set, where there are historical data from 1 June 2006 to 31 May 2011 and the time of continuous suspension is no longer than 28 days. The following analysis is performed with . If the window size is not very large compared to the number of stocks, one should expect that the determination of the covariance is noisy, and therefore that the correlation matrix is to a large extent random, i.e., the structure of the matrix is dominated by measurement noise [36]. In general, in order to obtain stable covariance matrices, the window size should exceed the number of market variables [37]. Besides, in the study of Borysov et al. [38], ω ≥ N is also assumed for the covariance matrix to be positive definite. Therefore, in this paper, we assume that ω is equal to 262. If ω is set to be other values, we can obtain similar results.
3.2. Empirical Results
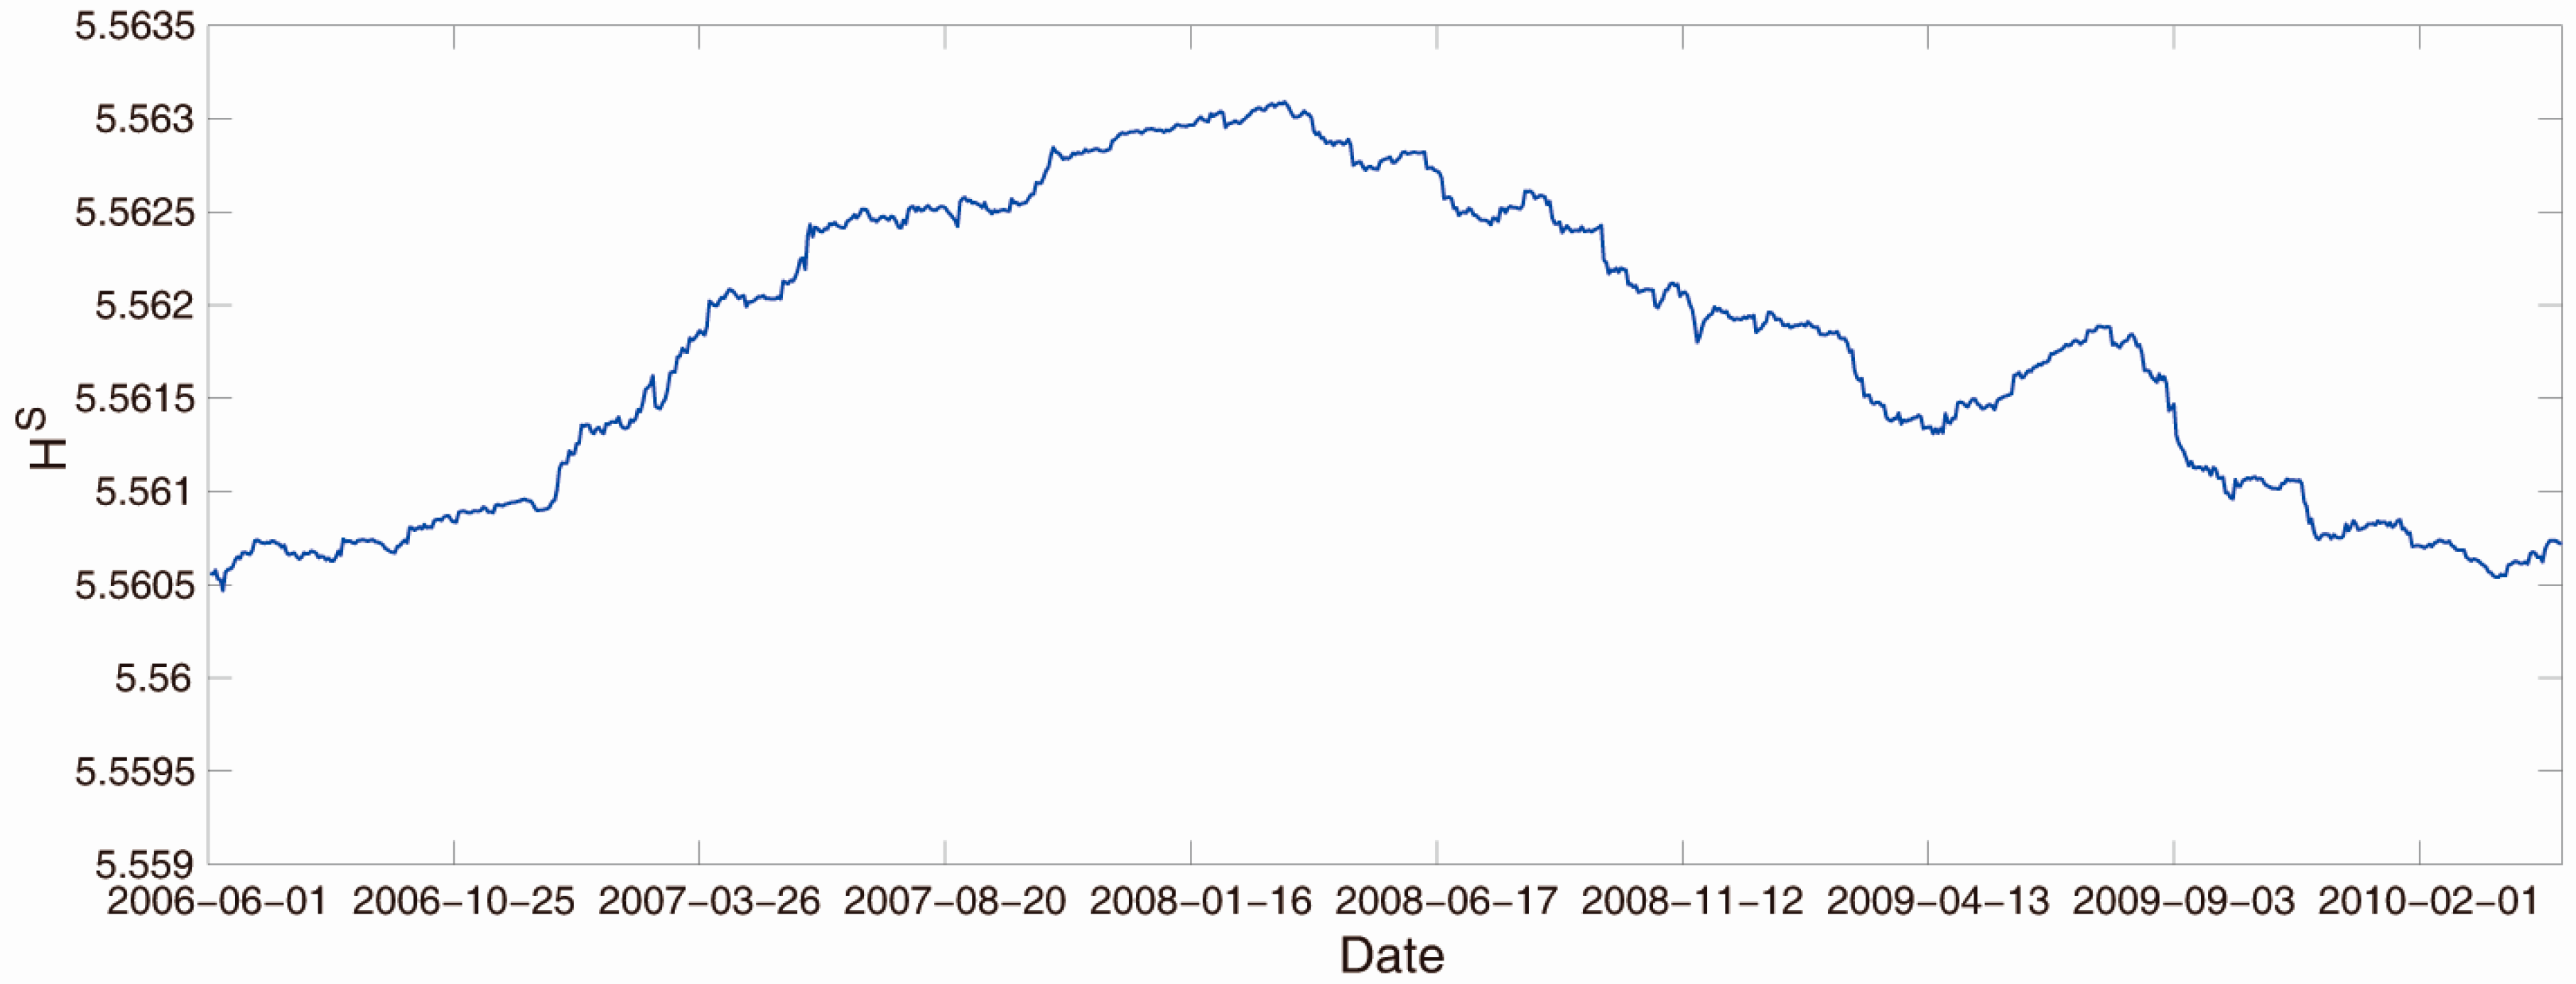
Figure 1 shows the daily closing prices of the A-share index of the Shanghai Stock Exchange from 1 June 2006 to 31 May 2011 [39]. Figure 2 reports the return volatilities of the A-share market, where stock return volatility is the average of standard deviations of stock returns and stock index return volatility is the standard deviation of stock index returns. The total period is subdivided into three subperiods: the period from June 2006 to June 2007 as the period of the normal stock market states, the period from July 2007 to December 2008 as the period of the financial crisis, and the period from January 2009 to May 2011 as the period of the stock market recovery. We can see from Figure 1 that the prices of the market during the financial crisis decrease, whereas they increase after the financial crisis. From Figure 2, it can be seen that the stock market has a high volatility during the financial crisis.
We first analyze the relationship between network entropies and volatilities of the stock market. Figure 3 presents the evolution of the Shannon entropy of the financial network. Figure 4 shows the evolution of the Renyi and Tsallis entropies of the financial network in the case . Comparing Figure 3 and Figure 4 with Figure 2, we can see that the evolution characteristics of the three kinds of entropies are the same as those of return volatilities. This means that the network entropy of the financial market is an alternative to the standard deviation. Compared to the standard deviation, the major advantage of network entropies is that it can capture the uncertainty and disorder in a time series without imposing any constraints on the theoretical probability distribution. In other words, network entropies are distribution free, and then they can avoid the introduction of errors through the fitting of the distribution of returns to a normal-like distribution when dealing with non-symmetric distributions [26].
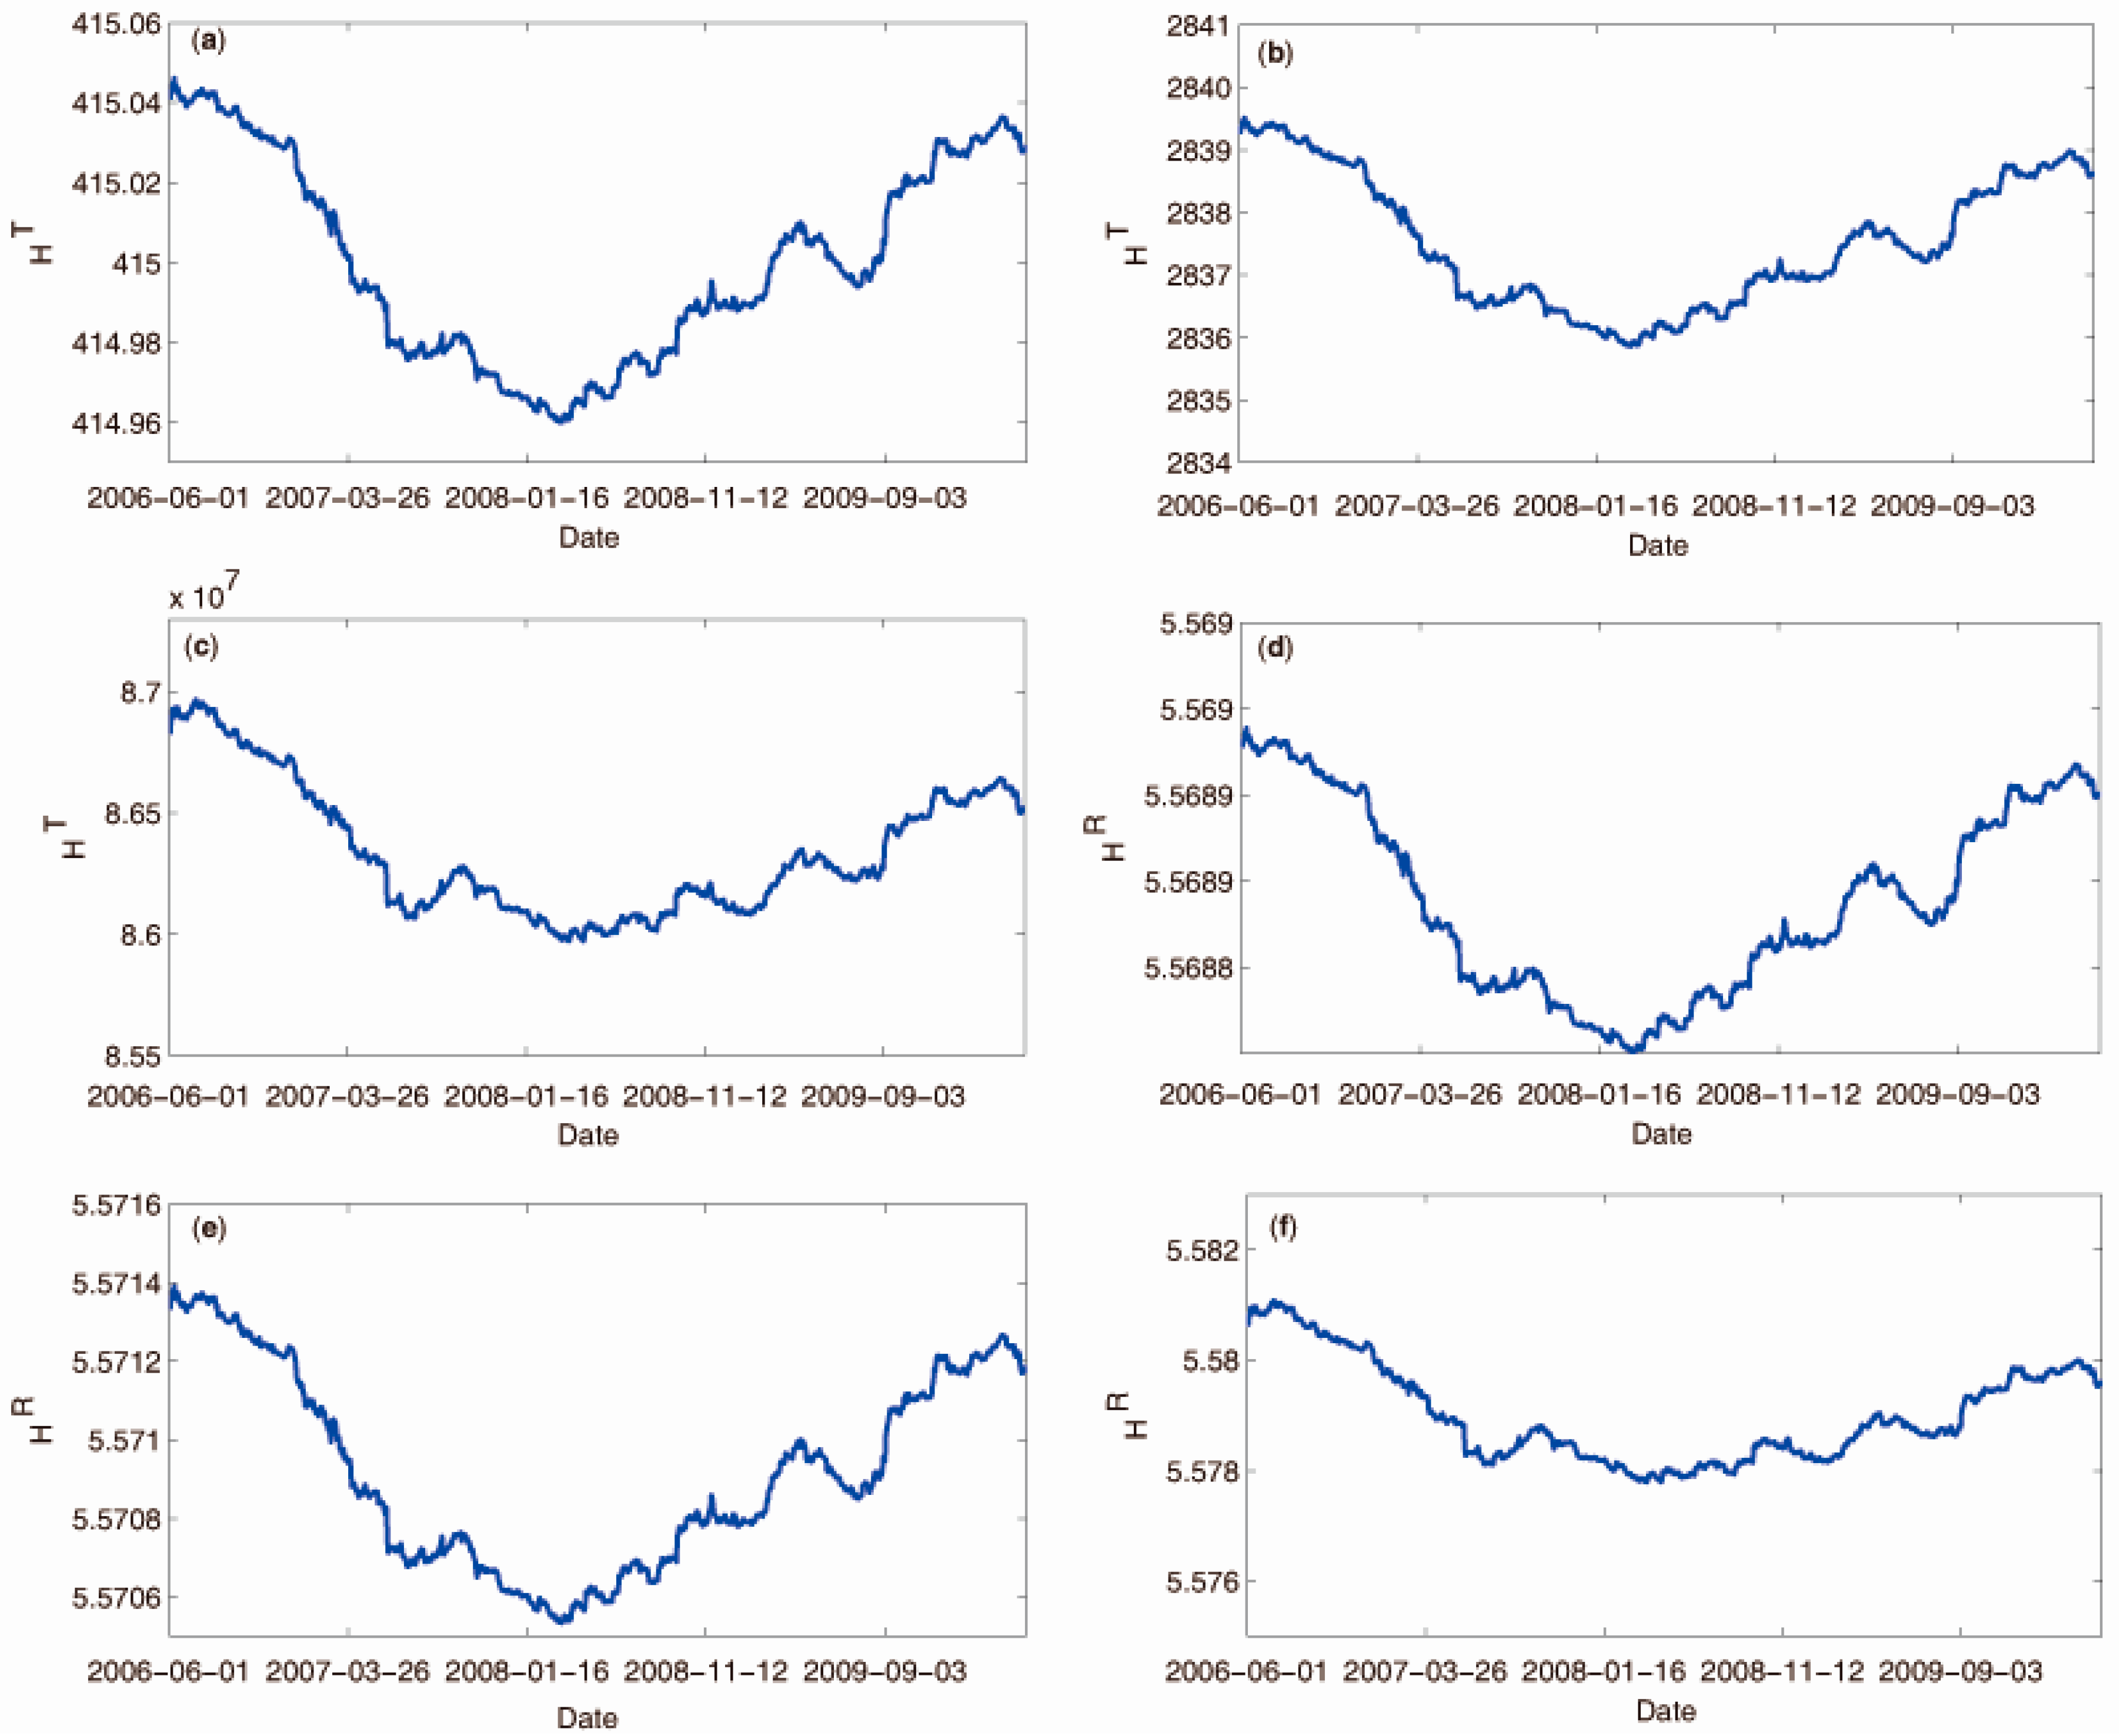
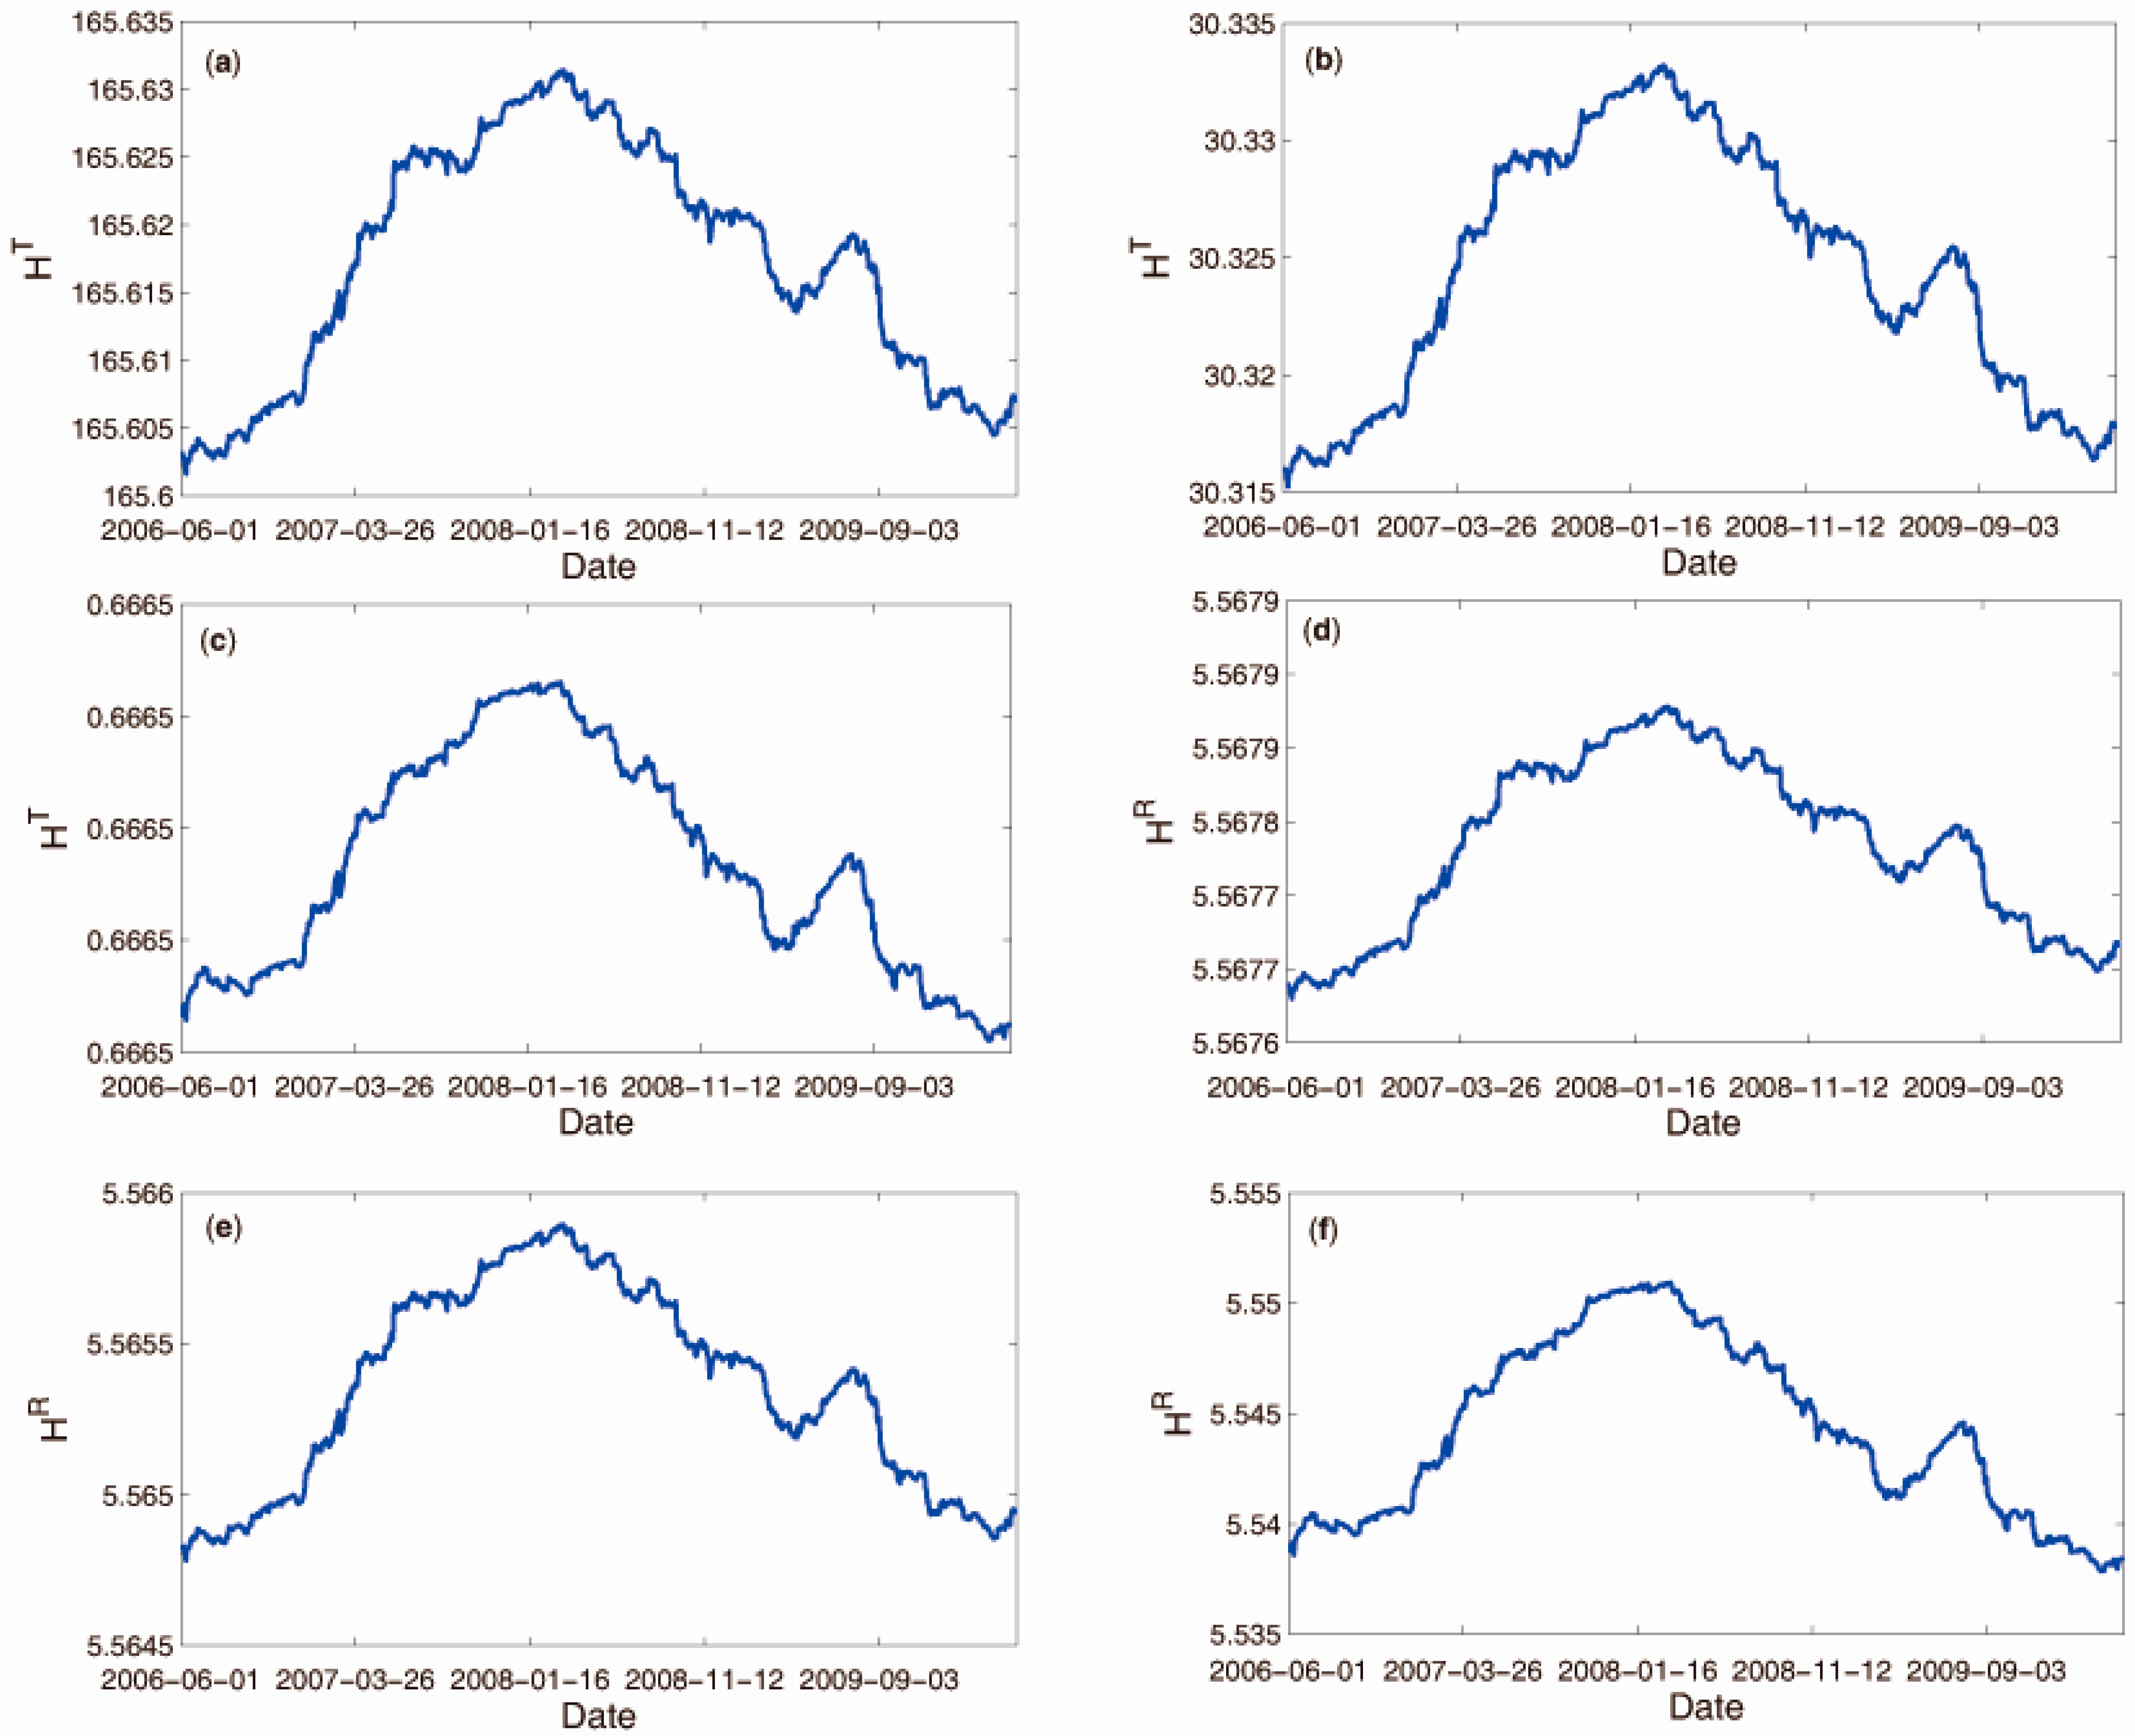
According to the above definitions of network entropies, the parameter α in the Renyi and Tsallis entropies affects the results of the Renyi and Tsallis entropies. Therefore, we investigate the evolution of the Renyi and Tsallis entropies of the financial network in the case , which is shown in Figure 5. From Figure 5, we can find that the change trend of Renyi and Tsallis entropies in the case of is different from that in the case of . We can observe that there exists a minimum value for the Renyi and Tsallis entropies. For example, in the case , the minimum value of the Tsallis entropy arrives on 28 February 2008. Therefore, the Tsallis entropy reaches its minimum value during the financial crisis. From Figure 5, we can obtain the same results in other cases. According to the above analysis, we can see that the Renyi and Tsallis entropies of the financial network can reflect the extreme case of the financial market in the case of .
From Figure 4 and Figure 5, it can be seen that there are high values for the Renyi and Tsallis entropies during the crisis for α > 0, and low values for the same entropies during the crisis when α < 0. Note that the stock prices tend to exhibit a similar evolution during the crisis. This makes the values of elements of the matrix (pij(m)) high during the crisis. Moreover, according to the definition of the Tsallis entropy, we can establish that there are low values for the Tsallis entropy during the crisis when α < 0. In the case of α > 0, the Tsallis entropy is concave [40]. Therefore, there are high values for the Tsallis entropy during the crisis when α > 0. Besides, the Renyi entropy is a monotonous function of the Tsallis entropy based on the relation between them [40]. Thus, values for the Renyi entropy have the same property as that for the Tsallis entropy during the crisis.
According to the above results, we can know that Renyi and Tsallis entropies of the financial network have the same property of Shannon entropy in analyzing the volatility of the financial market. However, compared with the Shannon entropy, the Renyi and Tsallis entropies have an additional parameter , which enables them to reflect the extreme cases of the financial market in the case of . Therefore, Renyi and Tsallis entropies can be adopted to conduct more comprehensive analysis of the evolving financial market organization. The above results are obtained through directly comparing the time series of network entropies. Now we adopt a measure to analyze the difference between time series of network entropies. Following the study of Pratt and Fink [41], we use the root mean square difference to measure the difference between time series. The root mean square difference (RD) between {a1, ..., an} and {b1, ..., bn} is given as follows:
After normalizing each time series in the interval [0, 1], we obtain the results of the difference between time series of network entropies, which is shown in Table 1. The higher the value of RD is, the bigger the difference between time series is. From Table 1, we can see that the difference between the Shannon entropy and the Renyi (Tsallis) entropy is small when α > 0, and that it is big when α < 0. Besides, the difference between the Renyi entropy and the Tsallis entropy is small.
Demetrius and Manke [29] introduce the concept of network entropy, and find that it can predict the direction of changes in network structures over evolutionary time. Therefore, we adopt the Pearson’s correlation () to investigate the correlation between network entropies and network structures, where network structures analyzed include the clustering coefficient (C) and the average shortest path length (L) and they are calculated based on the formulas in the study of Peron et al. [7]. Table 2 shows the Pearson’s correlation coefficients between network entropies and network structures. We can observe that the Shannon entropy is positively correlated with network structures, that the Renyi and Tsallis entropies also have this property in the case of α > 0, and that the Renyi and Tsallis entropies are negatively correlated with network structures in the case of α < 0.
4. Conclusions
Financial markets are complex systems, and can be represented as complex networks. In this paper, we construct financial networks based on the data from the Chinese financial market, and then analyze the three types of network entropies of the financial market, namely, Shannon, Renyi and Tsallis entropies. First, empirical results show that Shannon entropy of the financial market network is an alternative to the standard deviation. In the case , Renyi and Tsallis entropies can also reflect the volatility of the financial market. Compared with the standard deviation, the major advantage of network entropies is that it does not impose any constraints on the theoretical probability distribution. Besides, we find that the change trend of Renyi and Tsallis entropies in the case of is different from that in the case of . Renyi and Tsallis entropies of the financial network can reflect the extreme cases of the financial market in the case of . Our results suggest that network entropies can be adopted as tools to quantify the evolving financial market organization.
Acknowledgments
This research was supported by NSFC (No. 71201023, No. 71371051, No. 71301078, No. 71671037), Teaching and Research Program for Excellent Young Teachers of Southeast University (No. 2242015R30021), Social Science Fund Project of Jiangsu Province (No. 15GLC003), the Fundamental Research Funds for the Central Universities (No. 2242016K40118), and Humanities and Social Science Planning Foundation of the Ministry of Education of China (No. 16YJA630026).
Author Contributions
Shouwei Li and Jianmin He designed the model and carried out the research; Kai Song analyzed the data; Shouwei Li wrote the paper. All authors have read and approved the final manuscript.
Conflicts of Interest
The authors declare no conflict of interest.
References
- Tirole, J. Illiquidity and all its friends. J. Econ. Lit. 2011, 49, 287–325. [Google Scholar] [CrossRef]
- Yellen, J. Interconnectedness and Systemic Risk: Lessons from the Financial Crisis and Policy Implications. In Proceedings of the American Economic Association/American Finance Association Joint Luncheon, San Diego, CA, USA, 4 January 2013.
- Gençay, R.; Signori, D.; Xue, Y.; Yu, C.; Zhang, K. Economic links and credit spreads. J. Bank. Financ. 2015, 55, 157–169. [Google Scholar] [CrossRef]
- Mantegna, R.N. Hierarchical structure in financial markets. Eur. Phys. J. B 1999, 11, 193–197. [Google Scholar] [CrossRef]
- Vandewalle, N.; Brisbois, F.; Tordoir, X. Non-random topology of stock markets. Quant. Financ. 2001, 1, 372–374. [Google Scholar] [CrossRef]
- Jung, W.S.; Chae, S.; Yang, J.S.; Hie-Tae, M. Characteristics of the Korean stock market correlations. Physica A 2006, 361, 263–271. [Google Scholar] [CrossRef]
- Eom, C.; Oh, G.; Kim, S. Deterministic factors of stock networks based on cross-correlation in financial market. Physica A 2007, 383, 139–146. [Google Scholar] [CrossRef]
- Chi, K.T.; Liu, J.; Lau, F.C.M. A network perspective of the stock market. J. Empir. Financ. 2010, 17, 659–667. [Google Scholar]
- Dal’Maso Peron, T.K.; Rodrigues, F.A. Collective behavior in financial markets. Europhys. Lett. 2011, 96. [Google Scholar] [CrossRef]
- Dal’Maso Peron, T.K.; da Fontoura Costa, L.; Rodrigues, F.A. The structure and resilience of financial market networks. Chaos 2012, 22, 013117. [Google Scholar] [CrossRef] [PubMed]
- Liu, X.F.; Tse, C.K. A complex network perspective of world stock markets: Synchronization and volatility. Int. J. Bifurc. Chaos 2012, 22, 1250142. [Google Scholar] [CrossRef]
- Nobi, A.; Maeng, S.E.; Ha, G.G.; Lee, J.W. Structural changes in the minimal spanning tree and the hierarchical network in the Korean stock market around the global financial crisis. J. Korean Phys. Soc. 2015, 66, 1153–1159. [Google Scholar] [CrossRef]
- Majapa, M.; Gossel, S.J. Topology of the South African stock market network across the 2008 financial crisis. Physica A 2016, 445, 35–47. [Google Scholar] [CrossRef]
- Bian, Y.; Xu, L.; Li, J. Evolving dynamics of trading behavior based on coordination game in complex networks. Physica A 2016, 449, 281–290. [Google Scholar] [CrossRef]
- Gfeller, D.; Chappelier, J.C.; de Los Rios, P. Finding instabilities in the community structure of complex networks. Phys. Rev. E 2005, 72, 056135. [Google Scholar] [CrossRef] [PubMed]
- Bogacz, L.; Burda, Z.; Wacław, B. Homogeneous complex networks. Physica A 2006, 366, 587–607. [Google Scholar] [CrossRef]
- Bianconi, G. The entropy of randomized network ensembles. Europhys. Lett. 2007, 81, 28005. [Google Scholar] [CrossRef]
- Bianconi, G.; Coolen, A.C.C.; Vicente, C.J.P. Entropies of complex networks with hierarchically constrained topologies. Phys. Rev. E 2008, 78, 016114. [Google Scholar] [CrossRef] [PubMed]
- Gómez-Gardeñes, J.; Latora, V. Entropy rate of diffusion processes on complex networks. Phys. Rev. E 2008, 78, 065102. [Google Scholar] [CrossRef] [PubMed]
- Anand, K.; Bianconi, G. Entropy measures for networks: Toward an information theory of complex topologies. Phys. Rev. E 2009, 80, 045102. [Google Scholar]
- Rovelli, C.; Vidotto, F. Single particle in quantum gravity and Braunstein-Ghosh-Severini entropy of a spin network. Phys. Rev. D 2010, 81, 044038. [Google Scholar] [CrossRef]
- Zhang, Q.; Luo, C.; Li, M.; Mahadevan, S. Tsallis information dimension of complex networks. Physica A 2015, 419, 707–717. [Google Scholar] [CrossRef]
- Nie, T.; Guo, Z.; Zhao, K.; Lu, Z.M. Using mapping entropy to identify node centrality in complex networks. Physica A 2016, 453, 290–297. [Google Scholar] [CrossRef]
- Gençay, R.; Gradojevic, N. Overnight interest rates and aggregate market expectations. Econ. Lett. 2008, 100, 27–30. [Google Scholar]
- Gençay, R.; Gradojevic, N. Crash of ′87—Was it expected?: Aggregate market fears and long range dependence. J. Empir. Financ. 2010, 17, 270–282. [Google Scholar] [CrossRef]
- Bentes, S.R.; Menezes, R. Entropy: A new measure of stock market volatility? J. Phys. 2012, 394, 012033. [Google Scholar] [CrossRef]
- Zhou, R.; Cai, R.; Tong, G. Applications of entropy in finance: A review. Entropy 2013, 15, 4909–4931. [Google Scholar] [CrossRef]
- Lee, D. Entropy of Global Financial Linkages. Available online: http://papers.ssrn.com/sol3/papers.cfm?abstract_id=2580650 (accessed on 6 September 2016).
- Demetrius, L.; Manke, T. Robustness and network evolution—An entropic principle. Physica A 2005, 346, 682–696. [Google Scholar] [CrossRef]
- Shannon, C.E.; Weaver, W. The Mathematical Theory of Communication; University of Illinois Press: Urbana, IL, USA, 1949. [Google Scholar]
- Renyi, A. Probability Theory; Dover: New York, NY, USA, 1970. [Google Scholar]
- Tsallis, C.; Mendes, R.S.; Plastino, A.R. The role of constraints within generalized nonextensive statistics. Physica A 1998, 261, 534–554. [Google Scholar] [CrossRef]
- Hsieh, C.S.; Chou, J.H.; Liao, T.L. Monthly Effect in Shanghai Stock Exchange. Available online: http://www.kyu.edu.tw/teacpage/teacpage97/97%E8%AB%96%E6%96%87%E6%88%90%E6%9E%9C%E5%BD%99%E7%B7%A8/207.pdf (accessed on 6 September 2016).
- Jiang, X.F.; Zheng, B. Anti-correlation and subsector structure in financial systems. Europhys. Lett. 2012, 97. [Google Scholar] [CrossRef]
- Shen, J.; Zheng, B. Cross-correlation in financial dynamics. Europhys. Lett. 2009, 86. [Google Scholar] [CrossRef]
- Laloux, L.; Cizeau, P.; Bouchaud, J.P.; Potters, M. Noise dressing of financial correlation matrices. Phys. Rev. Lett. 1999, 83. [Google Scholar] [CrossRef]
- Ingber, L. Trading in Risk Dimensions (TRD). Available online: http://papers.ssrn.com/sol3/papers.cfm?abstract_id=1075430 (accessed on 6 September 2016).
- Borysov, S.S.; Roudi, Y.; Balatsky, A.V. US stock market interaction network as learned by the Boltzmann machine. Eur. Phys. J. B 2015, 88. [Google Scholar] [CrossRef]
- Date of Daily Closing Prices of the A-Share Index of the Shanghai Stock Exchange. Available online: http://2016.sse.com.cn/aboutus/publication/yearly (accessed on 7 September 2016).
- Beck, C. Generalised information and entropy measures in physics. Contermp. Phys. 2009, 50, 495–510. [Google Scholar] [CrossRef]
- Pratt, K.B.; Fink, E. Search for patterns in compressed time series. Int. J. Image Graph. 2002, 2, 89–106. [Google Scholar] [CrossRef]
Figure 1.
Daily closing prices of the A-share index of the Shanghai Stock Exchange from 1 June 2006 to 31 May 2011 [39].
Figure 1.
Daily closing prices of the A-share index of the Shanghai Stock Exchange from 1 June 2006 to 31 May 2011 [39].
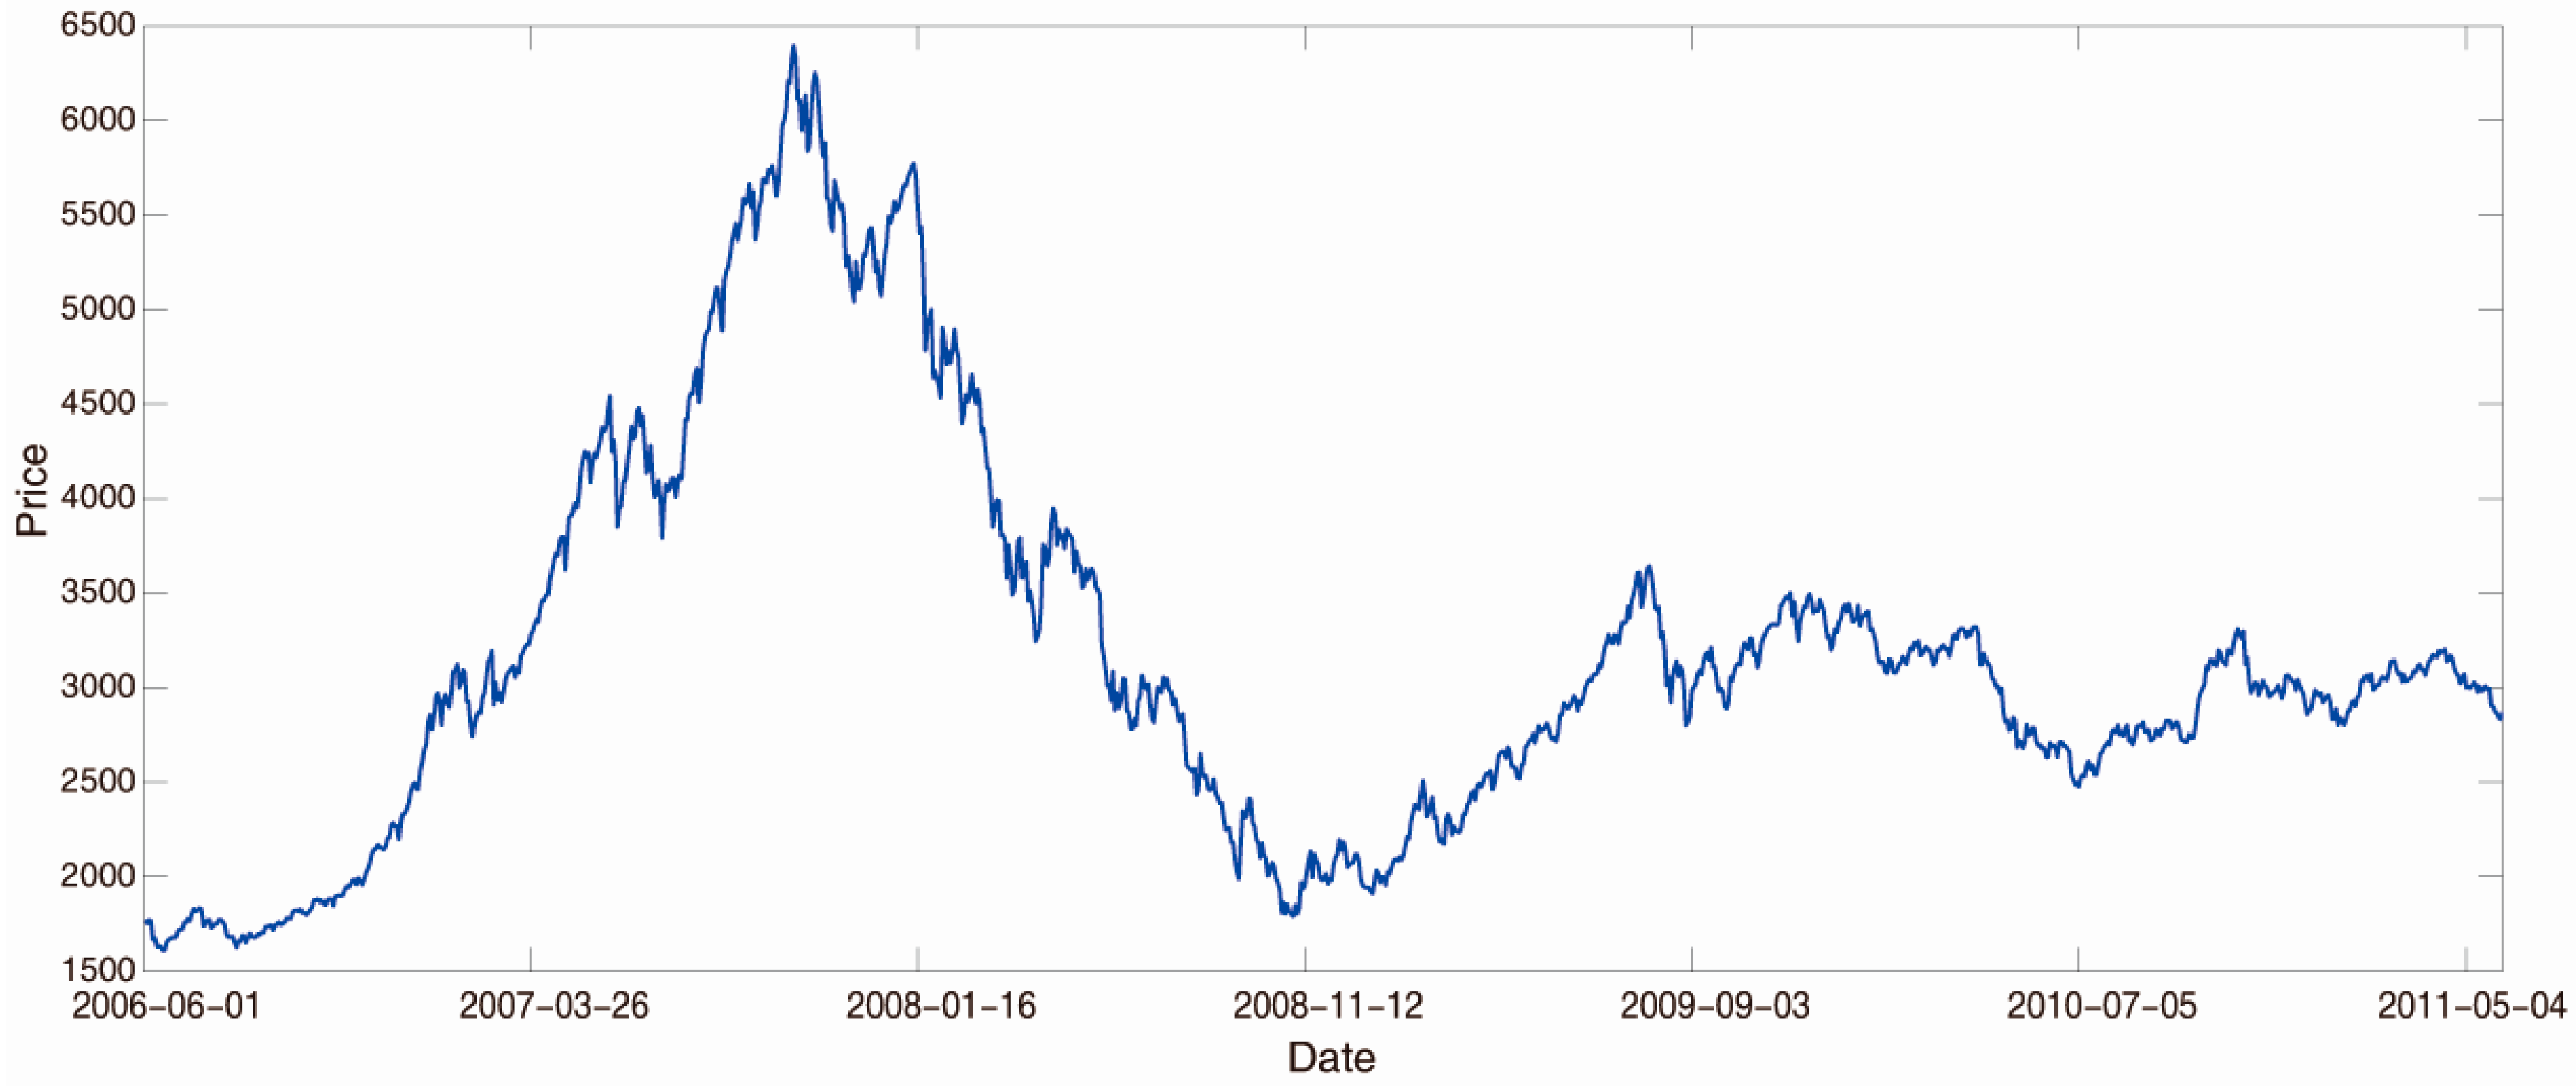
Figure 2.
Return volatilities of the A-share market of the Shanghai Stock Exchange.
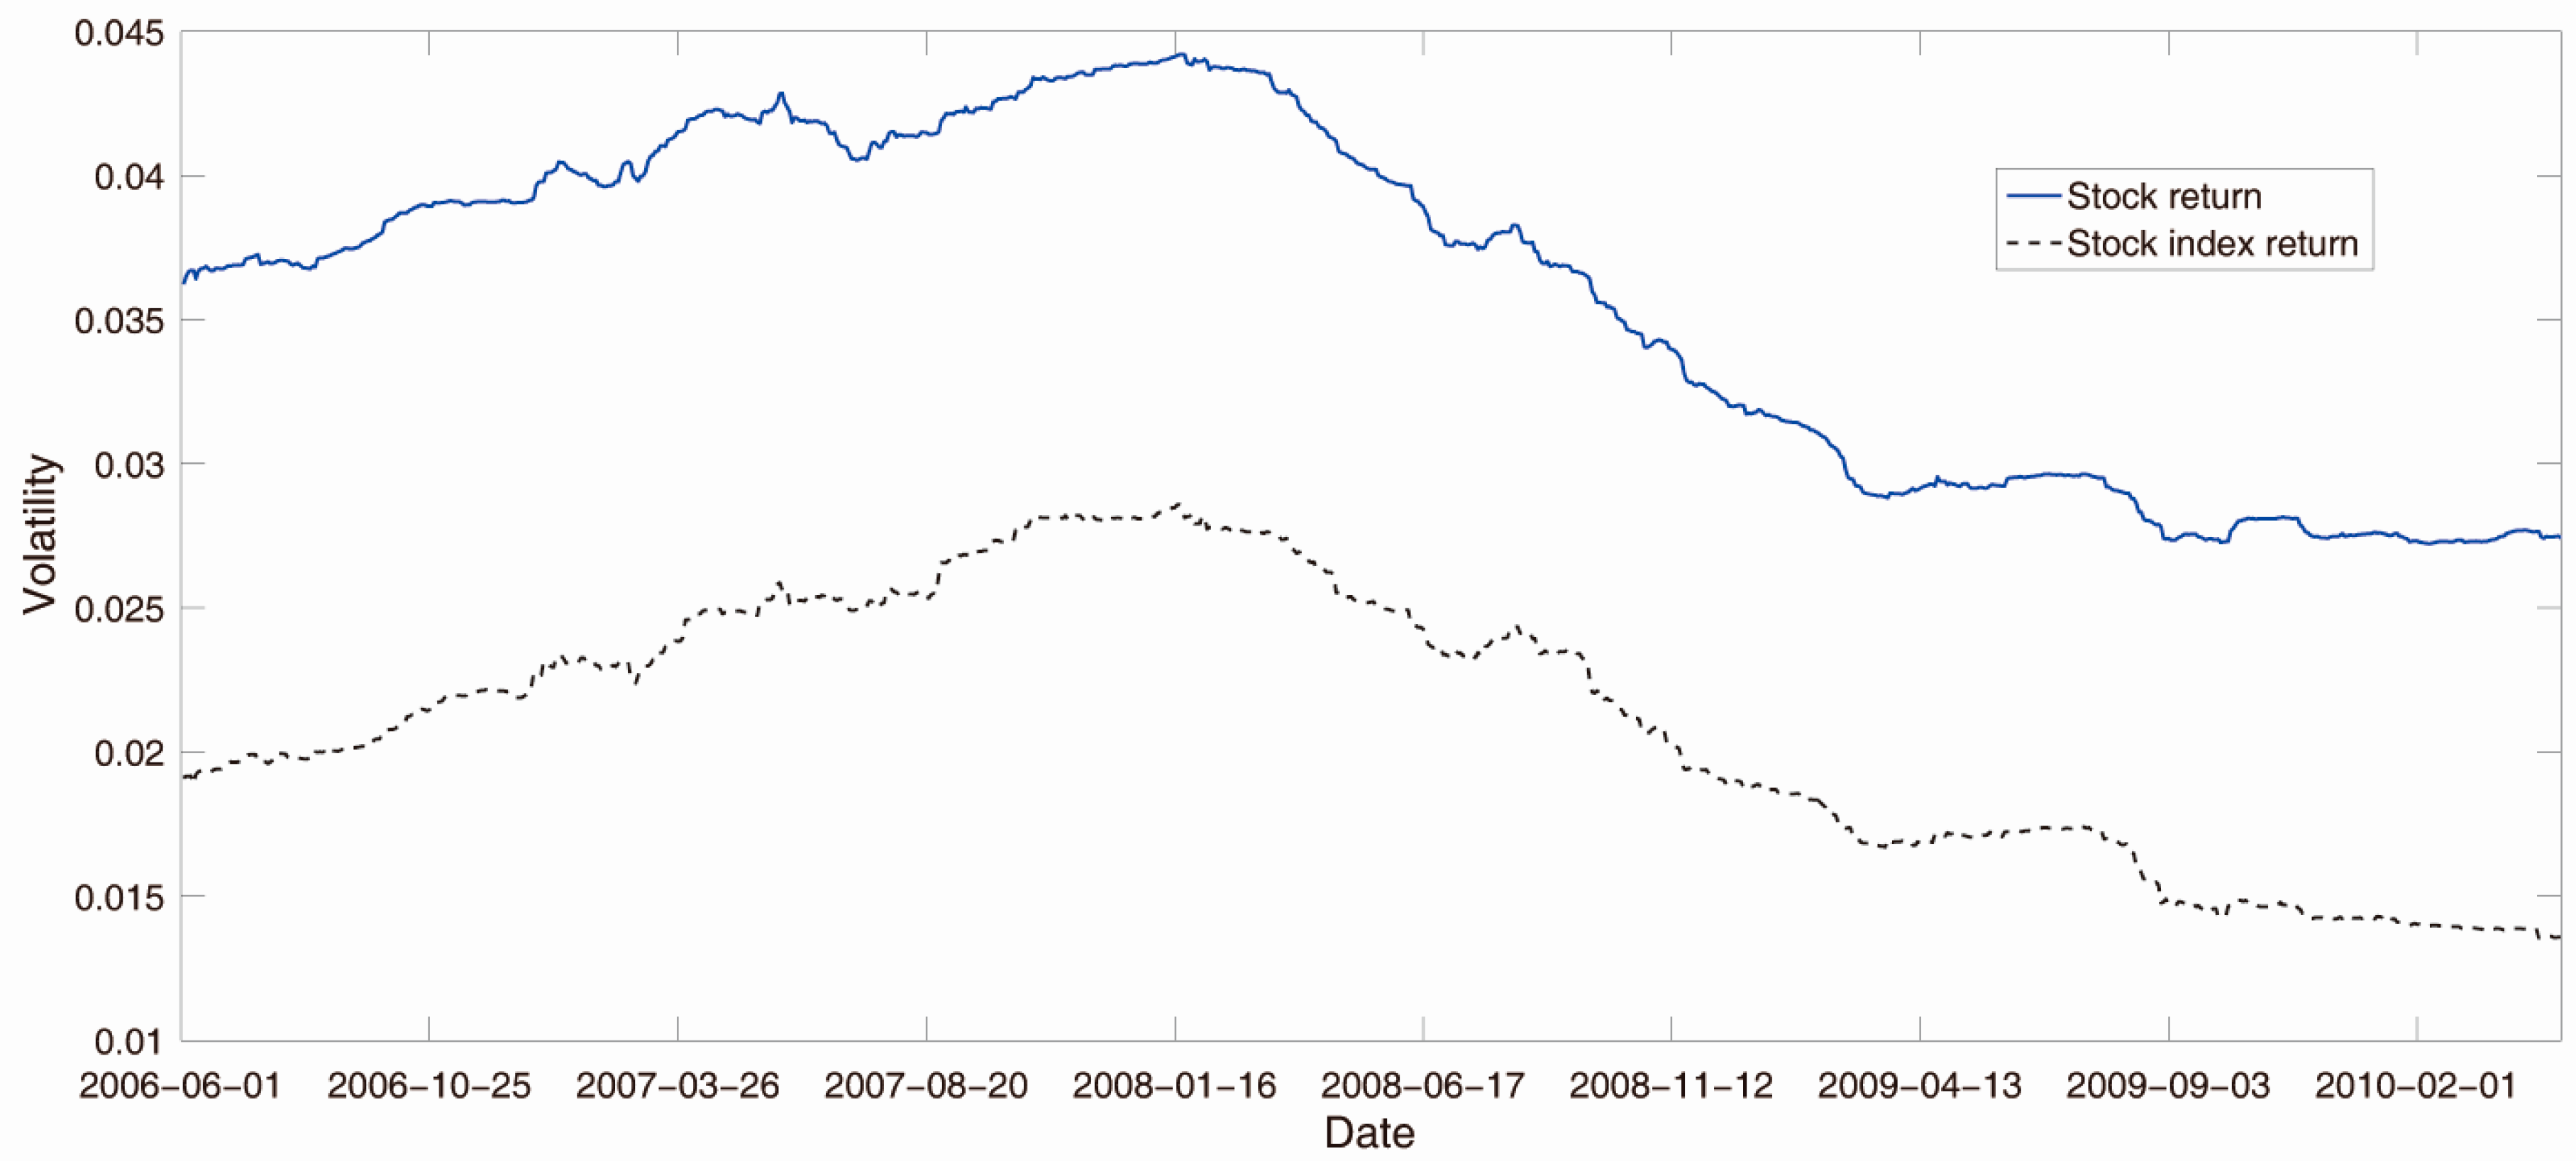
Figure 3.
Evolution of the Shannon entropy of the financial network.
Figure 4.
Evolution of the Renyi and Tsallis entropies of the financial network in the case . (a,d) are the corresponding results when ; (b,e) ; (c,f) .
Figure 4.
Evolution of the Renyi and Tsallis entropies of the financial network in the case . (a,d) are the corresponding results when ; (b,e) ; (c,f) .
Figure 5.
Evolution of the Renyi and Tsallis entropies of the financial network in the case . (a,d) are the corresponding results when ; (b,e) ; (c,f) .
Figure 5.
Evolution of the Renyi and Tsallis entropies of the financial network in the case . (a,d) are the corresponding results when ; (b,e) ; (c,f) .

| RD | α = 0.1 | α = 0.5 | α = 2.5 | α = −0.1 | α = −0.5 | α = −2.5 |
|---|---|---|---|---|---|---|
| 0.0205 | 0.0113 | 0.0275 | 0.9038 | 0.8948 | 0.8234 | |
| 0.0205 | 0.0112 | 0.0289 | 0.9038 | 0.8947 | 0.8222 | |
| 0.0000 | 0.0000 | 0.0015 | 0.0000 | 0.0000 | 0.0012 |
| α = 0.1 | α = 0.5 | α = 2.5 | α = −0.1 | α = −0.5 | α = −2.5 | |
|---|---|---|---|---|---|---|
| 0.9409 | ||||||
| 0.8978 | 0.9193 | 0.9750 | −0.8857 | −0.8591 | −0.7009 | |
| 0.8978 | 0.9193 | 0.9745 | −0.8857 | −0.8591 | −0.7012 | |
| 0.9478 | ||||||
| 0.9060 | 0.9269 | 0.9804 | −0.8941 | −0.8681 | −0.7120 | |
| 0.9060 | 0.9269 | 0.9800 | −0.8941 | −0.8681 | −0.7124 | |
© 2016 by the authors; licensee MDPI, Basel, Switzerland. This article is an open access article distributed under the terms and conditions of the Creative Commons Attribution (CC-BY) license (http://creativecommons.org/licenses/by/4.0/).
Share and Cite
MDPI and ACS Style
Li, S.; He, J.; Song, K. Network Entropies of the Chinese Financial Market. Entropy 2016, 18, 331. https://doi.org/10.3390/e18090331
AMA Style
Li S, He J, Song K. Network Entropies of the Chinese Financial Market. Entropy. 2016; 18(9):331. https://doi.org/10.3390/e18090331
Chicago/Turabian StyleLi, Shouwei, Jianmin He, and Kai Song. 2016. "Network Entropies of the Chinese Financial Market" Entropy 18, no. 9: 331. https://doi.org/10.3390/e18090331
Note that from the first issue of 2016, this journal uses article numbers instead of page numbers. See further details here.