Article

Contact-Free Detection of Obstructive Sleep Apnea Based on Wavelet Information Entropy Spectrum Using Bio-Radar

1
Department of Medical Electronics, School of Biomedical Engineering, Fourth Military Medical University, Xi’an 710032, China
2
Laboratory of Aviation Medicine, Naval Medical Research Institute, Shanghai 200433, China
*
Authors to whom correspondence should be addressed.
Chuantao Li and Fugui Qi contributed equally to this work and should be regarded as co-first author.
Entropy 2016, 18(8), 306; https://doi.org/10.3390/e18080306
Submission received: 14 June 2016 / Revised: 6 August 2016 / Accepted: 15 August 2016 / Published: 18 August 2016
(This article belongs to the Special Issue Entropy on Biosignals and Intelligent Systems)

Abstract

:
Judgment and early danger warning of obstructive sleep apnea (OSA) is meaningful to the diagnosis of sleep illness. This paper proposed a novel method based on wavelet information entropy spectrum to make an apnea judgment of the OSA respiratory signal detected by bio-radar in wavelet domain. It makes full use of the features of strong irregularity and disorder of respiratory signal resulting from the brain stimulation by real, low airflow during apnea. The experimental results demonstrated that the proposed method is effective for detecting the occurrence of sleep apnea and is also able to detect some apnea cases that the energy spectrum method cannot. Ultimately, the comprehensive judgment accuracy resulting from 10 groups of OSA data is 93.1%, which is promising for the non-contact aided-diagnosis of the OSA.

1. Introduction

Obstructive sleep apnea (OSA) is the most common type of sleep apnea and caused by complete or partial obstructions of the upper airway [1,2],which has become a kind of respiratory illness with a high incidence and potential danger in the modern society [3,4], featuring repetitive episodes of shallow or paused breathing during sleep despite the effort to breathe [5]. Diagnosis of OSA syndrome is accepted when the episodes times of decreased breathing, called “apneas” (literally, “without breath”), is over 30 times in 7 h during night’s sleep [6,7]. In addition to causing or aggravating respiratory failure, OSA is the risk factor of cerebrovascular accident, or myocardial infarction. Therefore, detection, judgment and early risk warning of OSA become crucial for the diagnosis and treatment of the OSA [8].
Research has proved that detection of respiratory signal is helpful for diagnosis of OSA [9,10]. Conventional methods used sensors or electrodes directly touching the surface of human subjects, such as the polysomnography (PSG) [11], wrist actigraphy [12], respiration belts [13] and so on, which would make the human subject feel uncomfortable during long term recording and consequently disturb sleep. To overcome the faults of the traditional methods for detection of respiratory signals above, contact-free methods were studied using infrared and bio-radar to detect the motion of the chest induced by respiratory activity. The infrared detectors [14] require strict positional constraints (the mouth/nose region must be targeted) and the region of interest should not be occluded. These restrictions are not easily be fulfilled when monitoring humans during sleep. The bio-radar is a novel kind of radar combining the technology of biomedical engineering and radar, which aims to non-contact detect the vital signs through non-metallic obstacles such as clothes and walls by transmitting a special electromagnetic wave [15]. Therefore, the bio-radar can detect contact-free, the human respiratory with low mental and physical burden without any electrodes or sensors directly touching the human body, which could detect the OSA and enable early danger warning using different signal processing methods in the time and frequency domain.
Lee [16] thinks that the breathing rate resulting from the radar Doppler shit of human breathing could be used to distinguish various types of respiratory scenarios. Masayuki Kagawa [17] chooses the variation of respiratory amplitudes to identify three types of sleep apnea. Besides, the characteristics of energy between the normal respiratory and apnea [18,19,20] and series of absolute values of wavelet decomposition detail coefficients of signal quadrature components [21] were also selected to make a sleep apnea judgment. However, these methods have some limitations for complex application environments and changing breathing characteristics. The most representative and remarkable breathing rate from fast Fourier transformation (FFT) is hard to find when the respiratory rate keeps changing during the apnea. The classification results based on the wavelet decomposition coefficients were greatly influenced by the selection of the mother wavelet. The energy or amplitude of the Doppler radar is likely to be influenced by the body position and posture in bed. Besides, there is also a non-linear relationship between radar amplitudes and tidal volumes [17]. This means that the radar respiratory amplitude does not represent real ventilation and it tends to be an apparently slightly bigger radar amplitude but there are few actual respiratory ventilation situations during some apnea cases. Therefore, if we just focus on the external waveform characteristics of the radar signal without excavating the internal relationship between apnea radar signal and actual human physiological characteristics, it is easy to cause misjudgments for these apnea cases. None of the methods above work efficiently and accurately because they have not excavated the stable and effective internal characteristics as the basis for analysis and judgment.
To improve the detection accuracy of OSA, a novel method based on wavelet information entropy spectrum was discussed in this paper. The paper was organized as follows: The bio-radar experiment system, the apnea detection and early warning methods were described in Section 2. The experiment results were presented in Section 3, including simulation results and actual OSA radar experiment results. Section 4 discussed the experiment results and concludes this paper.

2. Materials and Methods

This section mainly introduces the complete detection and judgment approach of OSA, including description of bio-radar system for detection of OSA, apnea judgment algorithm based on wavelet information entropy and OSA syndrome judgment and danger warning.

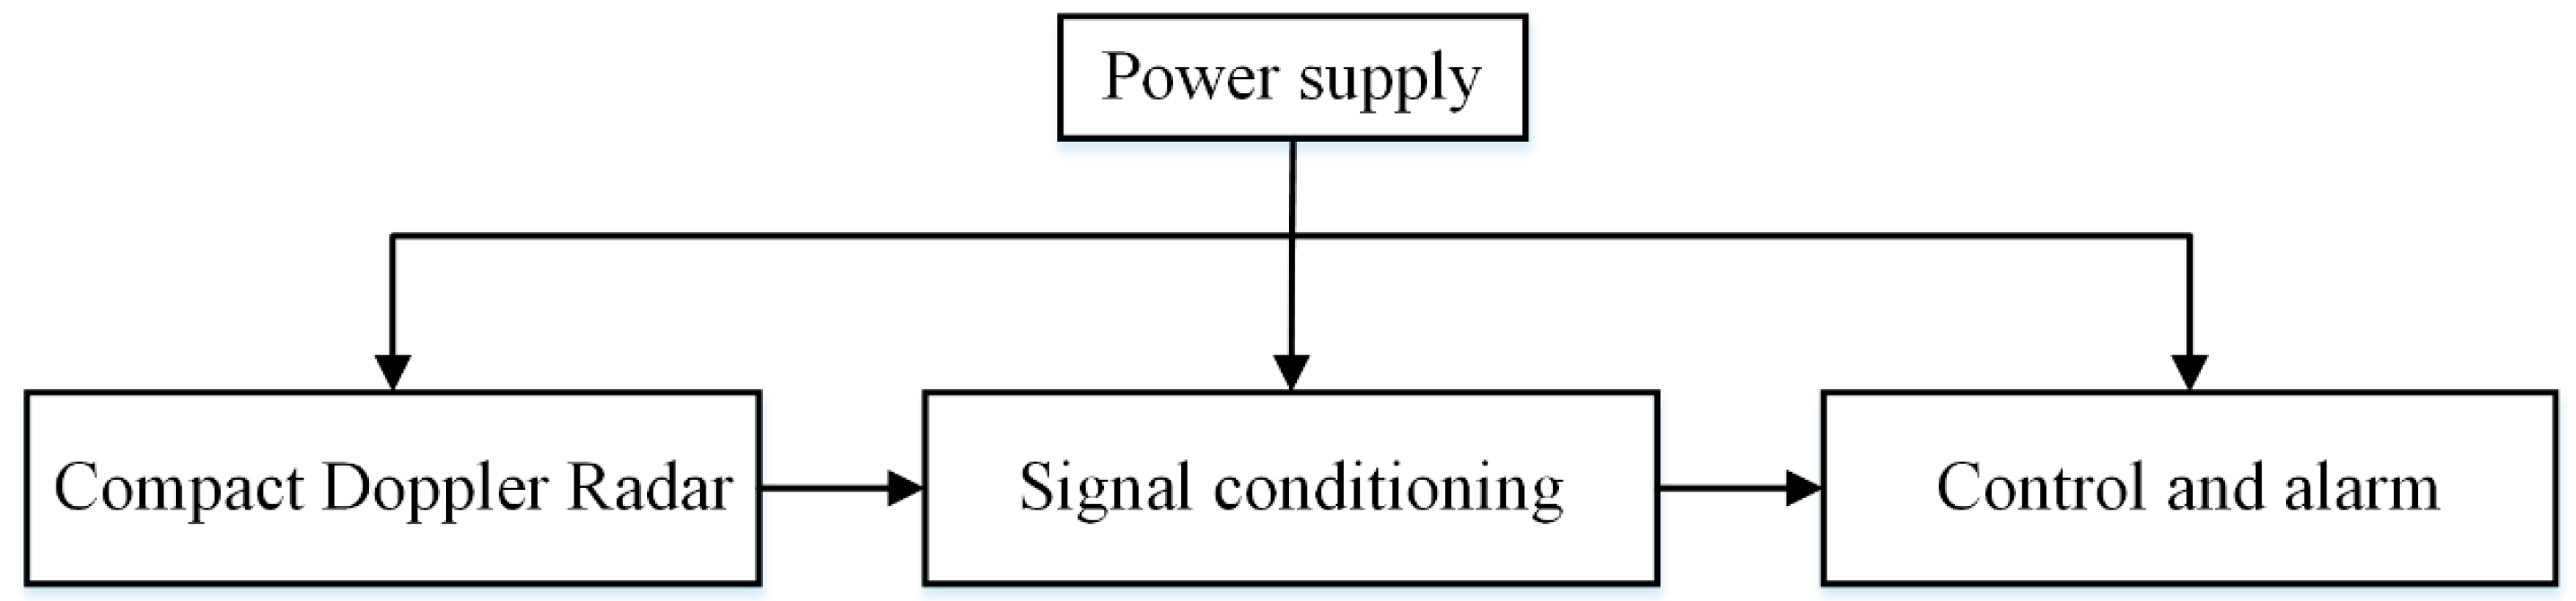
2.1. Description of Bio-Radar System for Detection of OSA

The diagram of the custom-developed bio-radar for detection of OSA was showed in Figure 1. The system was divided into four modules: compact Doppler radar, signal conditioning, power supply, control and alarm.
The compact bio-radar operates at 24 GHz with the maximum radiated power of 200 mW, which uses CMOS integrated circuits technology and micro-strip antenna arrays. The gain of the antenna is 20 dB. During the experiment, the distance between the antenna and the human subject is about 2.5 m. According to the discussion and argumentation of the safety power density level for human exposure, the maximum is 5.1 × 10⁻⁴ mW/cm2, which is much lower than the accepted safe power density level of 10 mW/cm2 [22]. Therefore, the electromagnetic radiation from the microwave sensor poses no safety threat. The output of the compact bio-radar ranges from 1 mV to 10 mV for a person sitting facing the radar.
The output of the radar was fed into the signal conditioning module including amplifiers and analogue filters. The gain of the module is from 500 to 5000, thus the output of the radar can be amplified to the level of 5 V for further digital processing. The bandwidth of the analogue filters is from 0.05 Hz to 1.0 Hz according the breathing signal of the normal human subject. The amplified and filtered respiration signal was connected with the control and alarm module for comprehensive process and alarms while the apnea occurred. The core component of the module is a microcontroller unit (MCU), in which the algorithm was embedded for judging and setting off an alarm. Then, the output of bio-radar was fixed on the ceiling directly connected with the PowerLab system (ADinstrument, Bella Vista, Austrilia). The PowerLab system uses its own LabChart 7 software to acquire and process data.
The module of power supply used the rechargeable lithium batteries to provide voltage and current to the compact Doppler radar, signal conditioning, control and alarm modules. After the batteries were completely recharged, the bio-radar for detection of OSA can continuously work for 20 h.

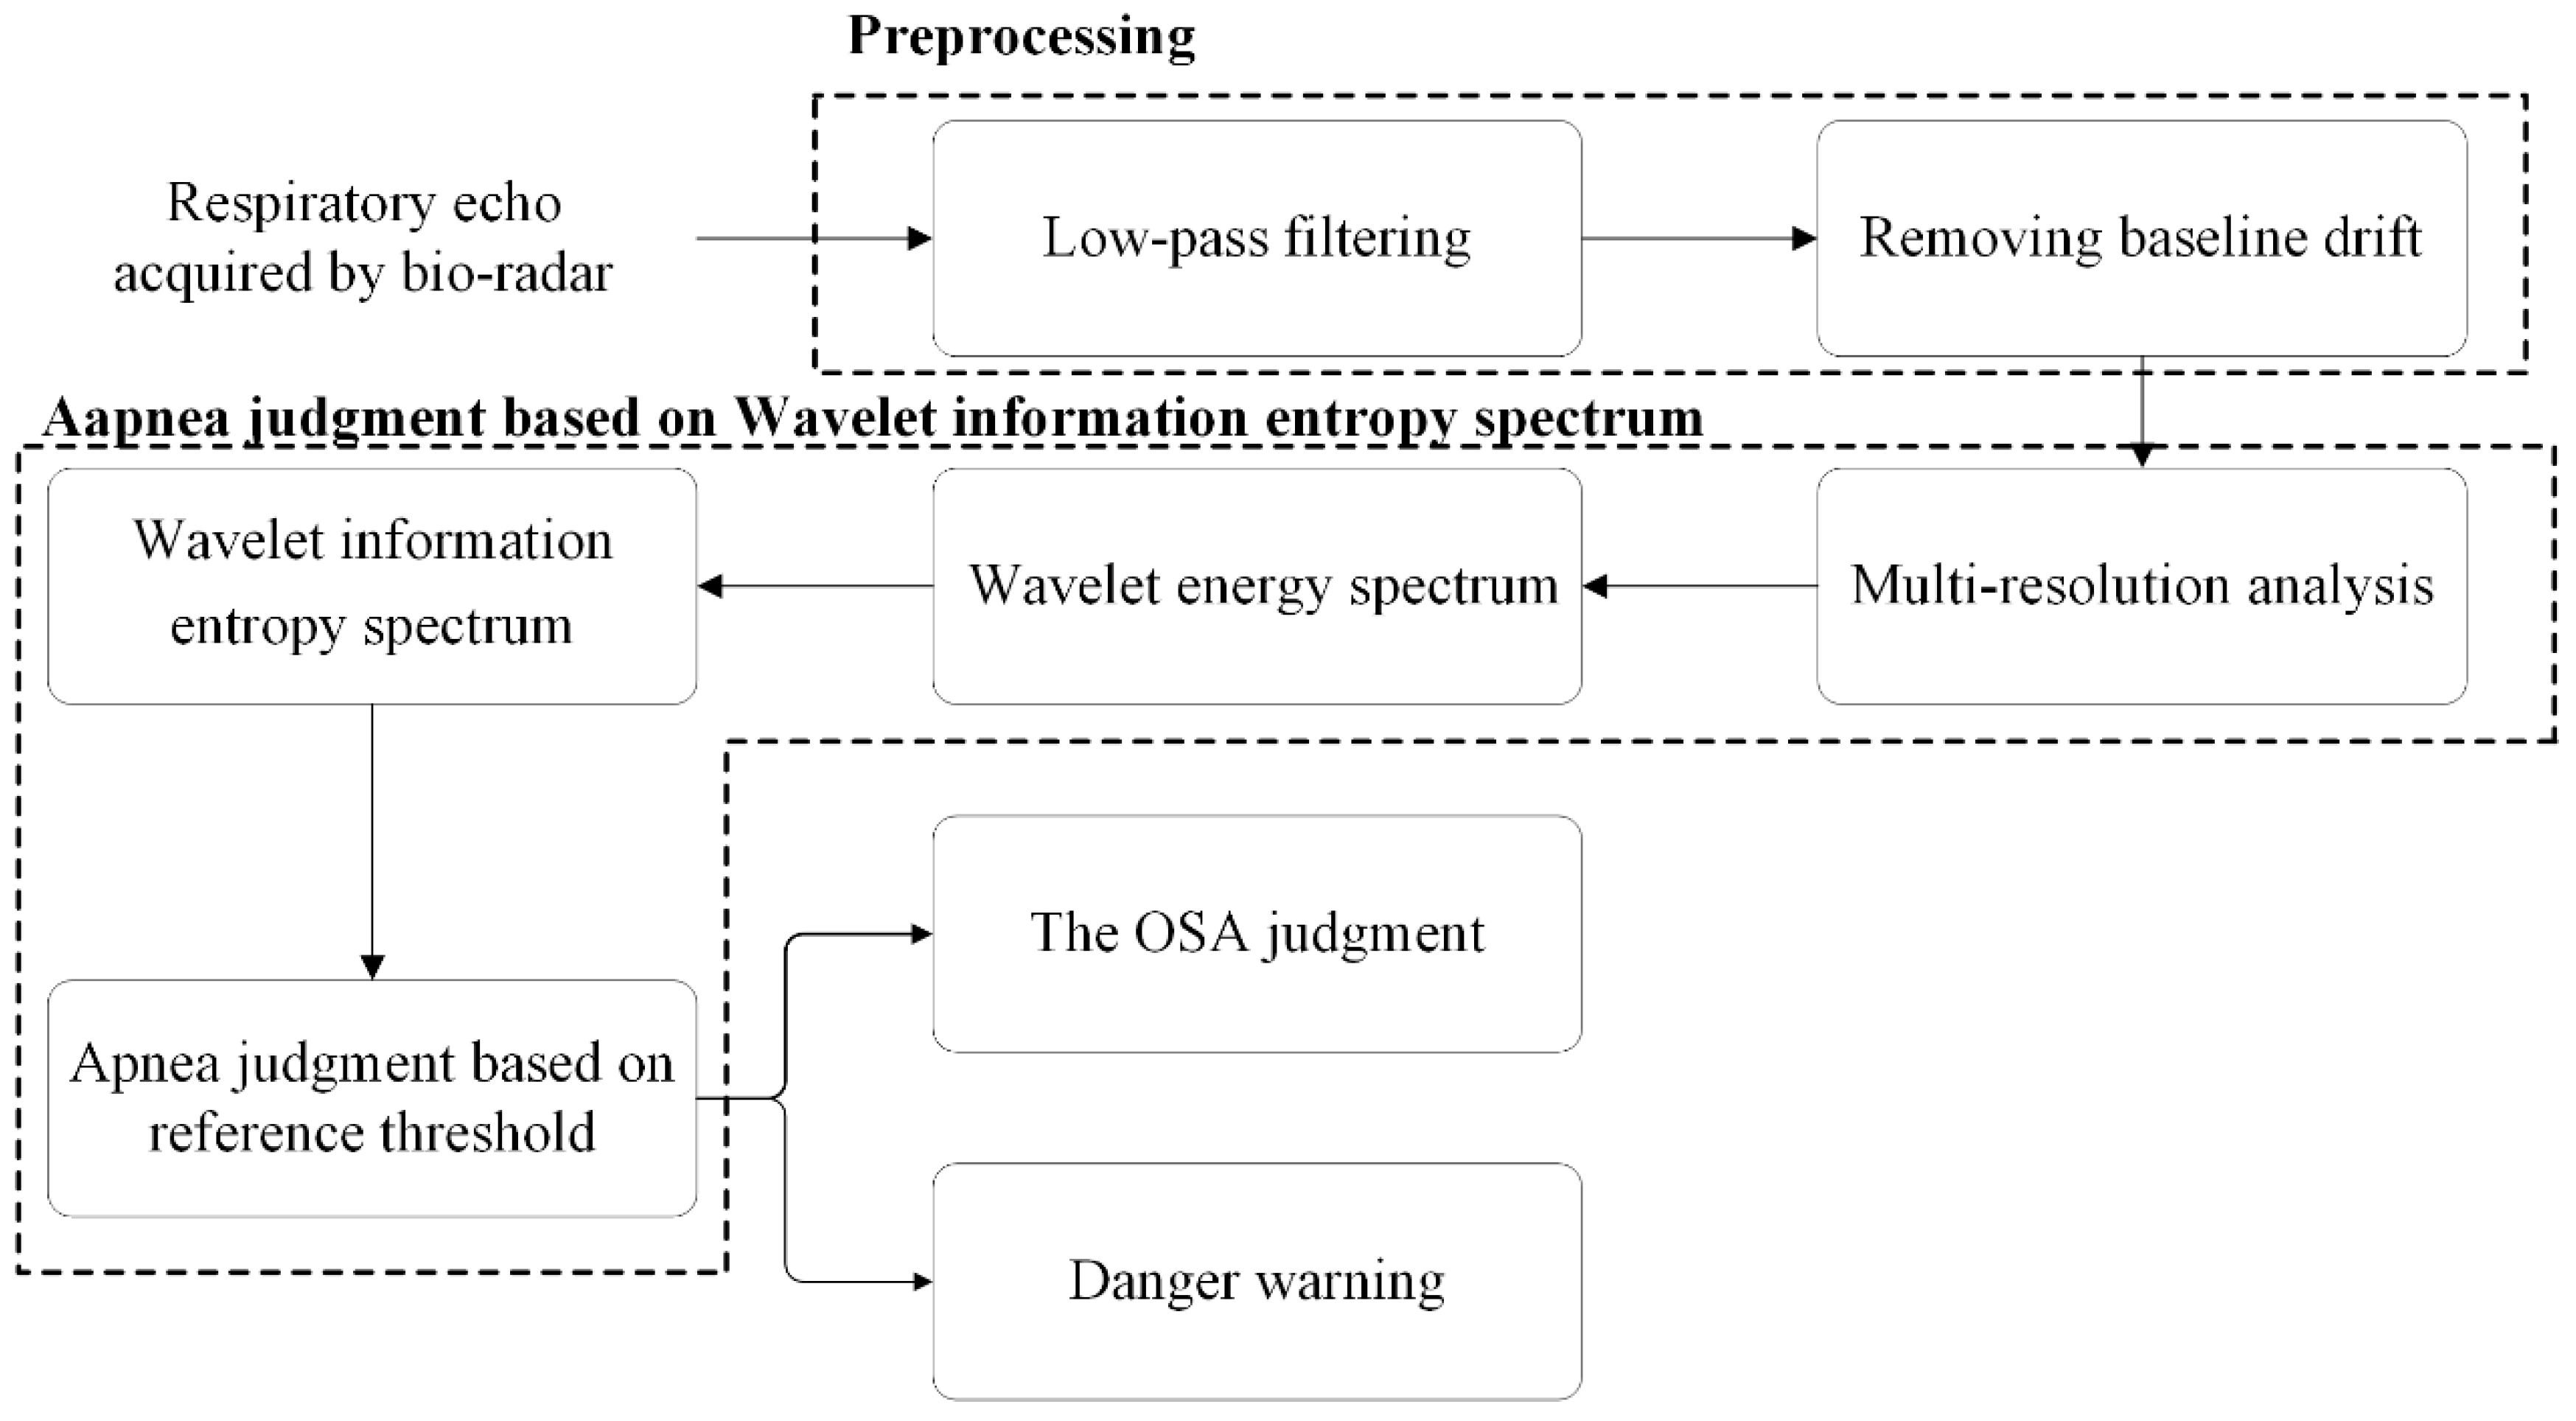
2.2. Apnea Detection Method

To automatically detect the occurrence of the apnea and make OSA judgment and danger warning, the algorithm was developed as shown in Figure 2.

2.2.1. Signal Preprocessing

The preprocessing should be performed on the respirational signal before further signal analyzing, including a digital FIR filter with the cutoff frequency of 0.9 Hz to eliminate high-frequency noise and a slide sliding window with the width of 1024 point to remove the baseline drift. Then the apnea judgment algorithm based on wavelet information entropy spectrum will be conducted on the preprocessed signal.

2.2.2. Wavelet Information Entropy

Since the wavelet information entropy is the combined product of information entropy and wavelet analysis, it can manifest the nonlinear partial change of non-stationary signals more precisely and have a better low frequency resolution [23]. Due to the respiratory signal being the low-frequency and non-stationary signal and the nonlinearity and complexity of apnea signal being stronger than the normal, so the value of wavelet information entropy is also bigger [24], which is valuable for distinguishing the apnea from the normal respiratory pattern. Now, the key parameters—mother wavelet selection and the implementation process of wavelet information entropy—are introduced as follows:
(a)
Selection of Mother Wavelet
The wavelet transform is the process of inner product between the original signal and the wavelet function and scaling function, and therefore the quality of the signal analysis is largely dependent on the selection of the wavelet base function— ψ ( t ) .
When a base function— ψ ( t ) is defined, so that ψ a , b ( t ) = 1 a ψ ( t b a ) , where a is a scale variable and b is the displacement variable and a > 0 . ψ a , b ( t ) is obtained from the base function ψ ( t ) by further telescopic displacement. If “ a ” and “ b ” are constantly changing, we can get a wavelet basis function family. Given a square integrable signal X ( t ) , i.e., X ( t ) L 2 ( R ) . Then the wavelet transform (Wavelet Transform, WT) of X ( t ) is defined as:
WT X ( a , b ) = 1 a X ( t ) ψ ( t b a ) d t = X ( t ) ψ a , b ( t ) d t = X ( t ) | ψ a , b ( t )
Currently, there are six common used wavelets and they all features distinct characteristics, including haar, daubachies, biorthgonal, coiflets, symlets and meyr wavelet. Wavelet choices mainly follow these five main principles: orthogonality and compact support and decay, regularity, symmetry and vanishing moments. Orthogonality describes the redundancy of data represented by the wavelet; strict orthogonality is in favor of exact reconstruction of wavelet coefficients. If the broadband of the wavelet compactly supported is narrower or decaying faster, this shows that the wavelet has better local properties and it will be more conducive to the detection of local mutation. The symmetry mainly influences the phase of the signal and good symmetry can guarantee the integrity of the reconstructed signal. Regularity is the description of function smoothness, represented as the differentiability of wavelet basis, playing a particularly important role in the wavelet transform to find the singularity. Vanishing moments is the most important parameter when choosing the wavelet base function and it determines the convergence rate while wavelet approximating the smooth function and indicates the concentration of energy after the wavelet transform.
According to current research on the wavelet section [25,26], all six wavelets could be guaranteed in orthogonality, compactly supported and decay, regularity and symmetry.
In terms of the support length and vanishing moments: the definition of wavelet vanishing moments is as follows:
+ t k ψ ( t ) d t = 0 , k = 0 ,   1 ,   2 , , n 1
This means that the ψ ( t ) has n consecutive zeros, then the range of vanishing moments is n.
The larger the vanishing moment is, the fewer coefficients there will be making the inner product with the signal, which makes the high-frequency coefficients smaller and the energy more centralized. Besides, it will also cause the wider support length and the increase of computation amount. Therefore, the wavelet with high-order vanishing moments should not be adopted when measuring the signal singularity.
According to the analysis above, the Daubechies 1 wavelet was adopted in this study as the mother wavelet because it has excellent performance in detecting the mutation and separating the high-frequency and low-frequency coefficients due to its narrow support length and small vanishing moments.
(b)
Wavelet Information Entropy Spectrum
The process of apnea judgment algorithm based wavelet information entropy spectrum is as follows:
(i) Multi-resolution analysis based on the Mallat algorithm. At the beginning, the high-frequency coefficients d j ( k ) and the low-frequency coefficients a j ( k ) under the j-th decomposition scale and at the k time were generated after performing a J-level wavelet decomposition on the time series X . Then, the wavelet reconstruction coefficients D j ( k ) and A j ( k ) would be obtained by single band reconstruction. In this case, the original signal sequence X n can be expressed as the sum of all reconstructed coefficients, namely:
X = A 1 + D 1 = A 2 + D 1 + D 2 = j = 1 J D j + A J = j = 1 J + 1 D j
where, A J can be represented as: D J + 1 . In this paper, the 3-level wavelet decomposition based on the special wavelet was applied to the Multi-resolution analysis.
(ii) The wavelet energy spectrum in every time widow. After wavelet transform, the energy of signal in every window under one scale is calculated according to the formula (4):
E j = k = 1 L [ D j ( k ) ] 2 , j = 1 ,   2 , , J ,   J + 1
where D j ( k ) is the wavelet reconstruction coefficient under the j-th scale. L = 2048 is the length of the Window and it superimposes 50% in this algorithm. Then, the wavelet energy spectrum of respiratory signal in the J scales was acquired, represented as: E = [ E 1 , E 2 , , E J , E J + 1 ] .
(iii) The wavelet information entropy spectrum. The wavelet entropy of respiratory in every time window was generated according the definition of Shannon information entropy, and shown as the following:
S WT = j = 1 J + 1 p j l o g 2 p j = j = 1 J + 1 ( E j E sum ) l o g 2 ( E j E sum )
where p j indicates the energy distribution of the signal at different scales. E sum denotes the sum of the energy in the widow. Ultimately, the variety of wavelet information entropy can be observed with the time widow sliding.
(iv) Apnea judgment based on reference threshold. In the event of apnea, the wavelet entropy values of respiratory signal are greater than normal, due to the increasing respiratory rate and the disorder degree. Thus, the occurrence of apnea will be judged based on the reasonable wavelet entropy threshold for every time window, which was set as follows:
S WT threshold ( i ) = S average ( i ) × q
where the S average ( i ) = s u m ( m = 1 4 S WT minor ( m ) ) / 4 , the four S WT minor values are the four smaller values of the eight values surrounding the S W T ( i ) and q represents the weight parameter.
So far, there is no professional definition for wavelet information entropy of normal apnea, so its threshold was generated based on experience and the principle of improving the accuracy of judgment. Ultimately, the wavelet information entropy threshold is set as the 1.45 times the normal level, i.e., q = 1.45, according to analyzing numerous respiratory signals of the OSA patients collected by bio-radar and comparing the wavelet information entropy of apnea signals with that of the normal respiratory signals.

2.2.3. OSA Syndrome Judgment and Danger Warning

Finally, the functions of making OSA judgment and danger warning that were realized after the apnea times were acquired by the apnea judgment algorithm. The two functions are described as follows:
(a)
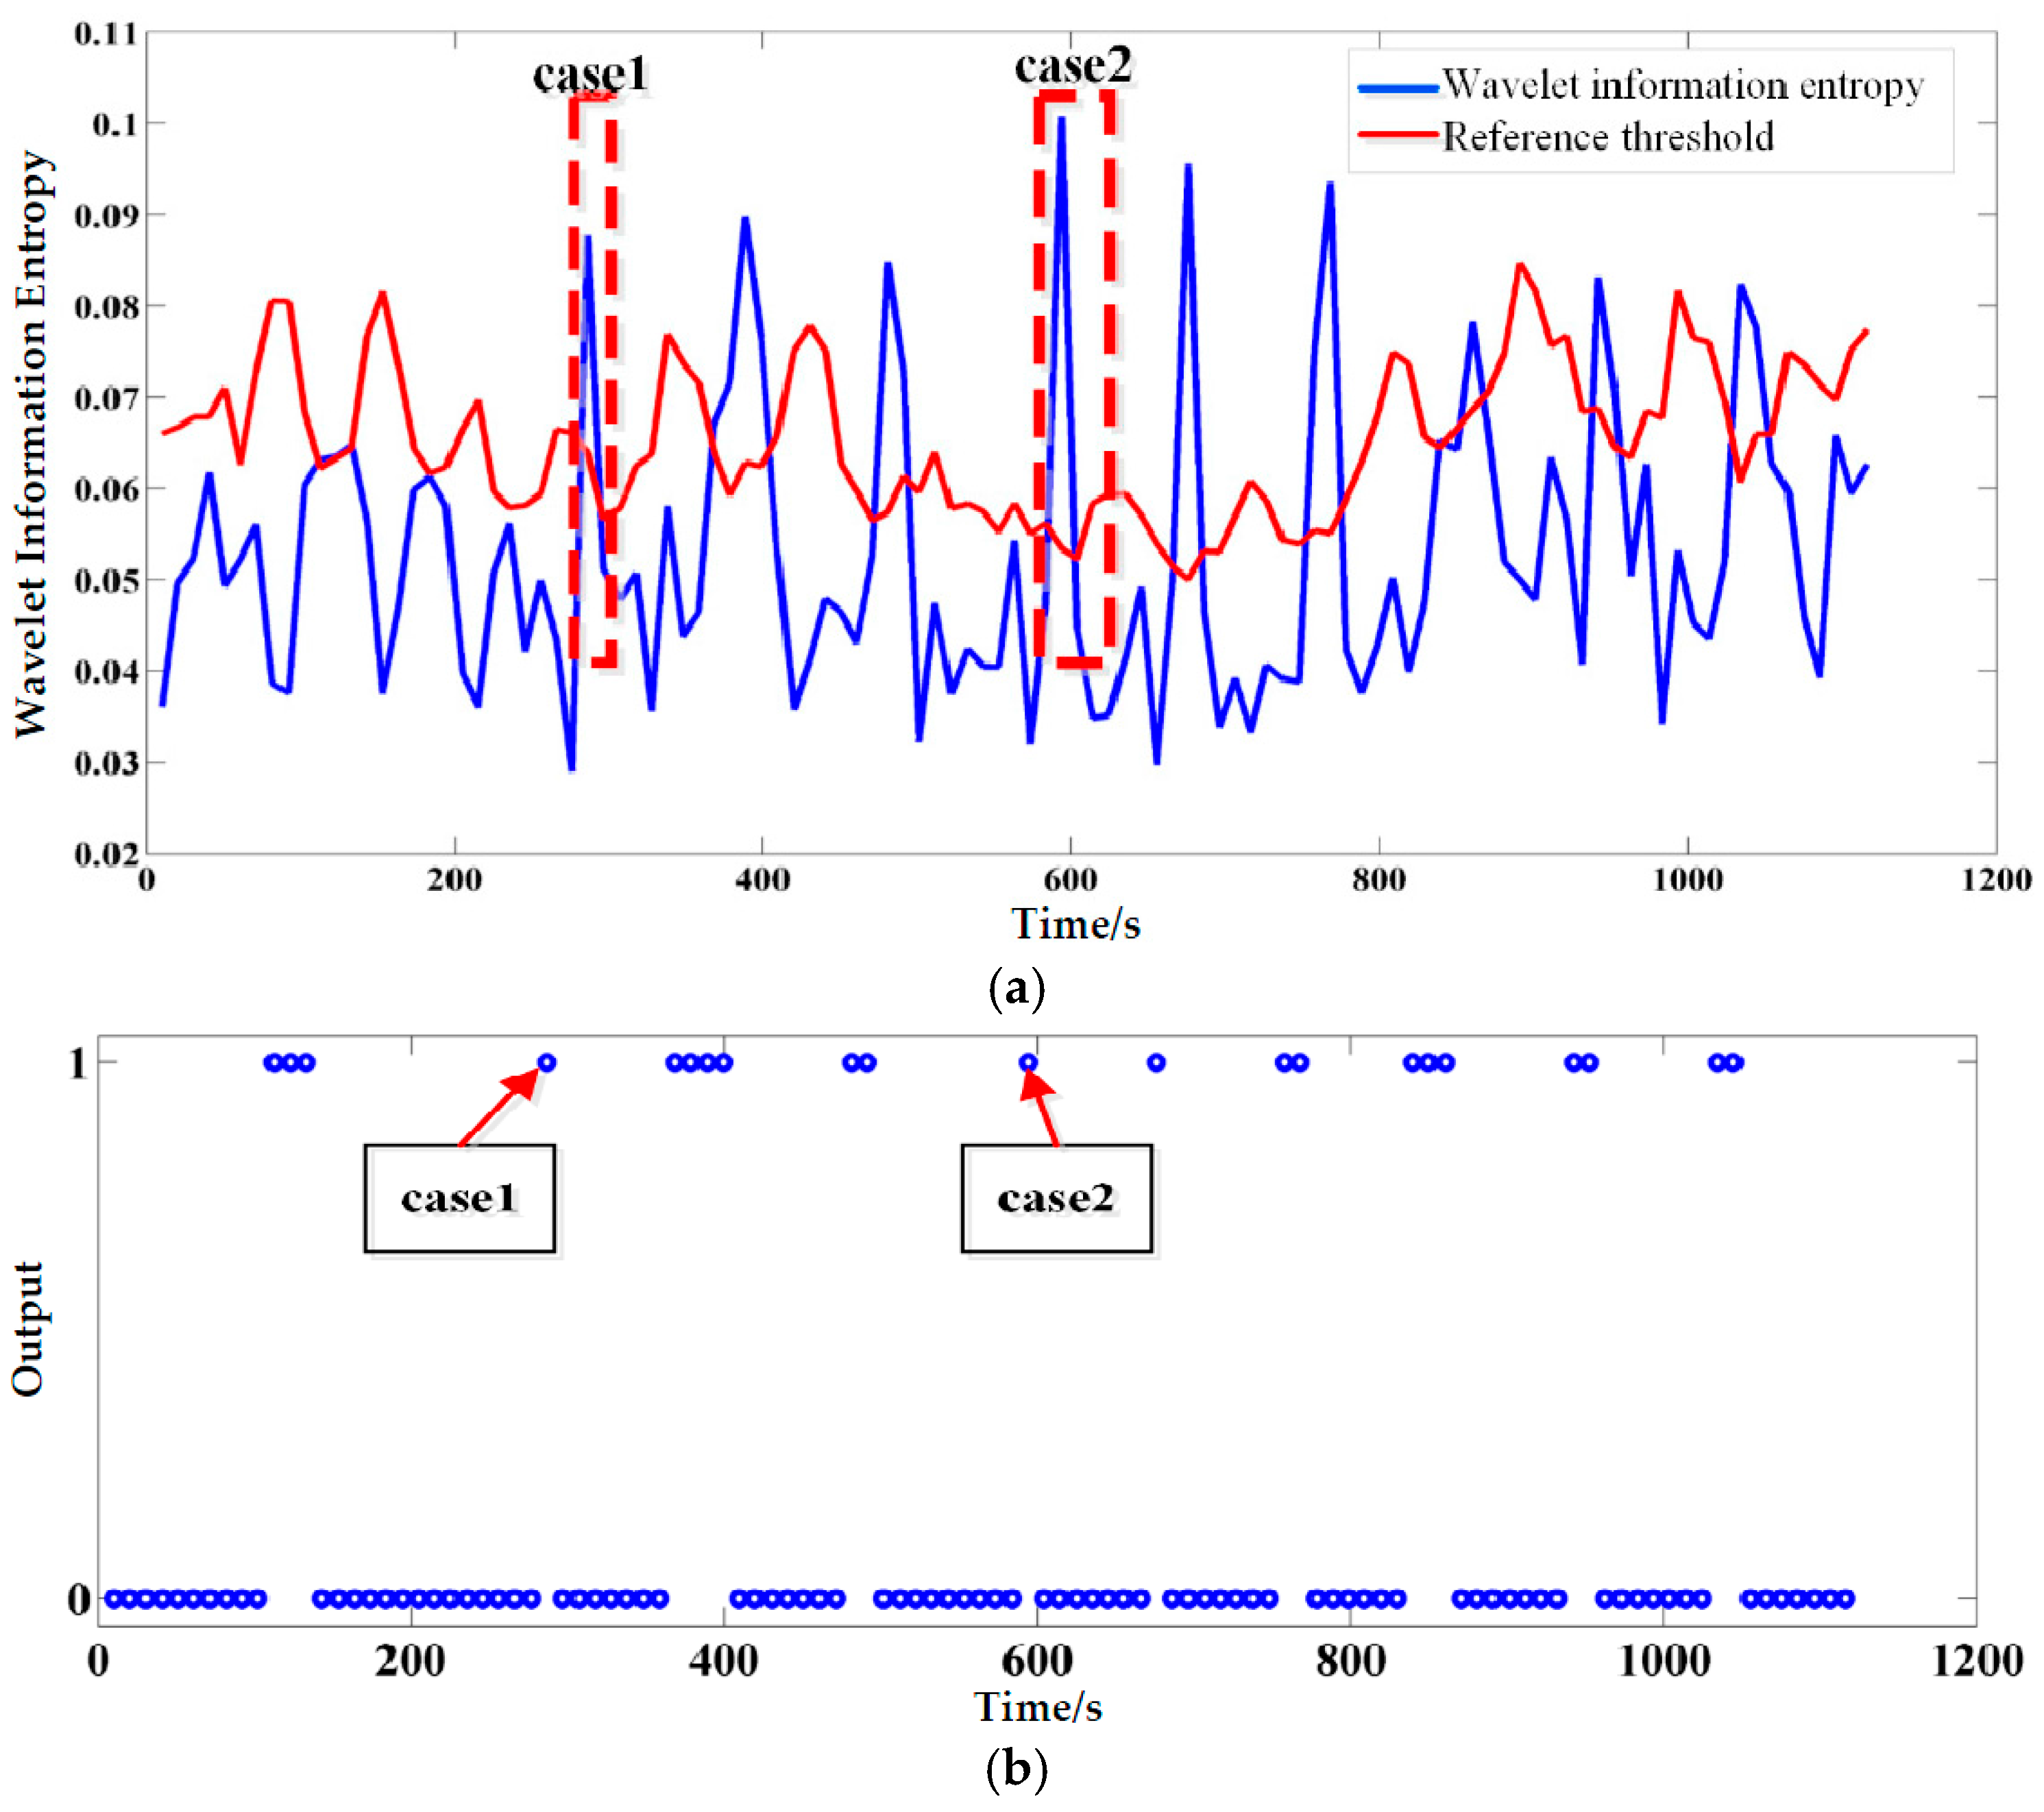
The OSA Syndrome Judgment
The sleep apnea signals were processed by the proposed algorithm to judge the apnea and its judging results are defined as H s . Supposed that the judging accuracy using the proposed apnea judgment algorithm is P s , the final number of apnea after comprehensively judging by weight is:
H = H s × P s
Based on the above results, the actual occurrence times of apnea for an OSA patient was presented as the H . Combined with clinical symptom standard of the OSA, the H can make some accessorial diagnosis on the OSA.
(b)
Danger Warning
The respiratory signal is being processed to make apnea judgment with a little time delay while it is being adopted. For a section of signal, the successive time windows of apnea judged by the proposed algorithm every time is accumulated by a counter and the continuous apnea time is obtained by conversion. Then the alarm will be triggered if the continuous apnea time exceeds the risky time threshold.
Numerous surveys showed that if one continuous apnea time is over 120 s during the night, the patient is prone to sudden death in the early morning, so the risky time threshold is set to 120 s in this experiment. However, according to the principle of the proposed algorithm, four more entropy values from four time windows were required to get a corresponding reference threshold when the last apnea occurred in a danger condition. Due to the sampling rate being f s = 100  Hz , the length of the Window is L = 2048 and it superimposes 50% in this algorithm, its latency is T L =   4 × L × 0.5 / f s = 40.96  s , which is likely to cause damage to the patient due to the alarm working with longer latency after the danger condition has occurred. Therefore, based on the principle of improving the ability to protect the patient and decreasing the potential danger caused by the algorithmic delay, we subtracted half of the algorithmic delay from the risky time threshold. So, the final reasonable risky time threshold is set to 99.52 s. This improvement will not only decrease the potential danger caused by the algorithmic delay to some extent but also will not lead to high false alarm rate. Moreover, it will not have any influence on the conditions of normal respiratory or respiratory with short time of apnea.
The time windows determined to be successive apnea is defined as n . Then, the actually continuous apnea time is:
t = n × L 100 × 0.5
If one single time of successive apnea time derived from the proposed method t   99.52 s, then the alarm will be triggered to wake the patient; t <   99.52 s, then continuing testing. Once the alarm is triggered, this means that the patient is in danger and needs to be awakened. So, the alarm will keep sounding until it is artificially reset.

3. Results

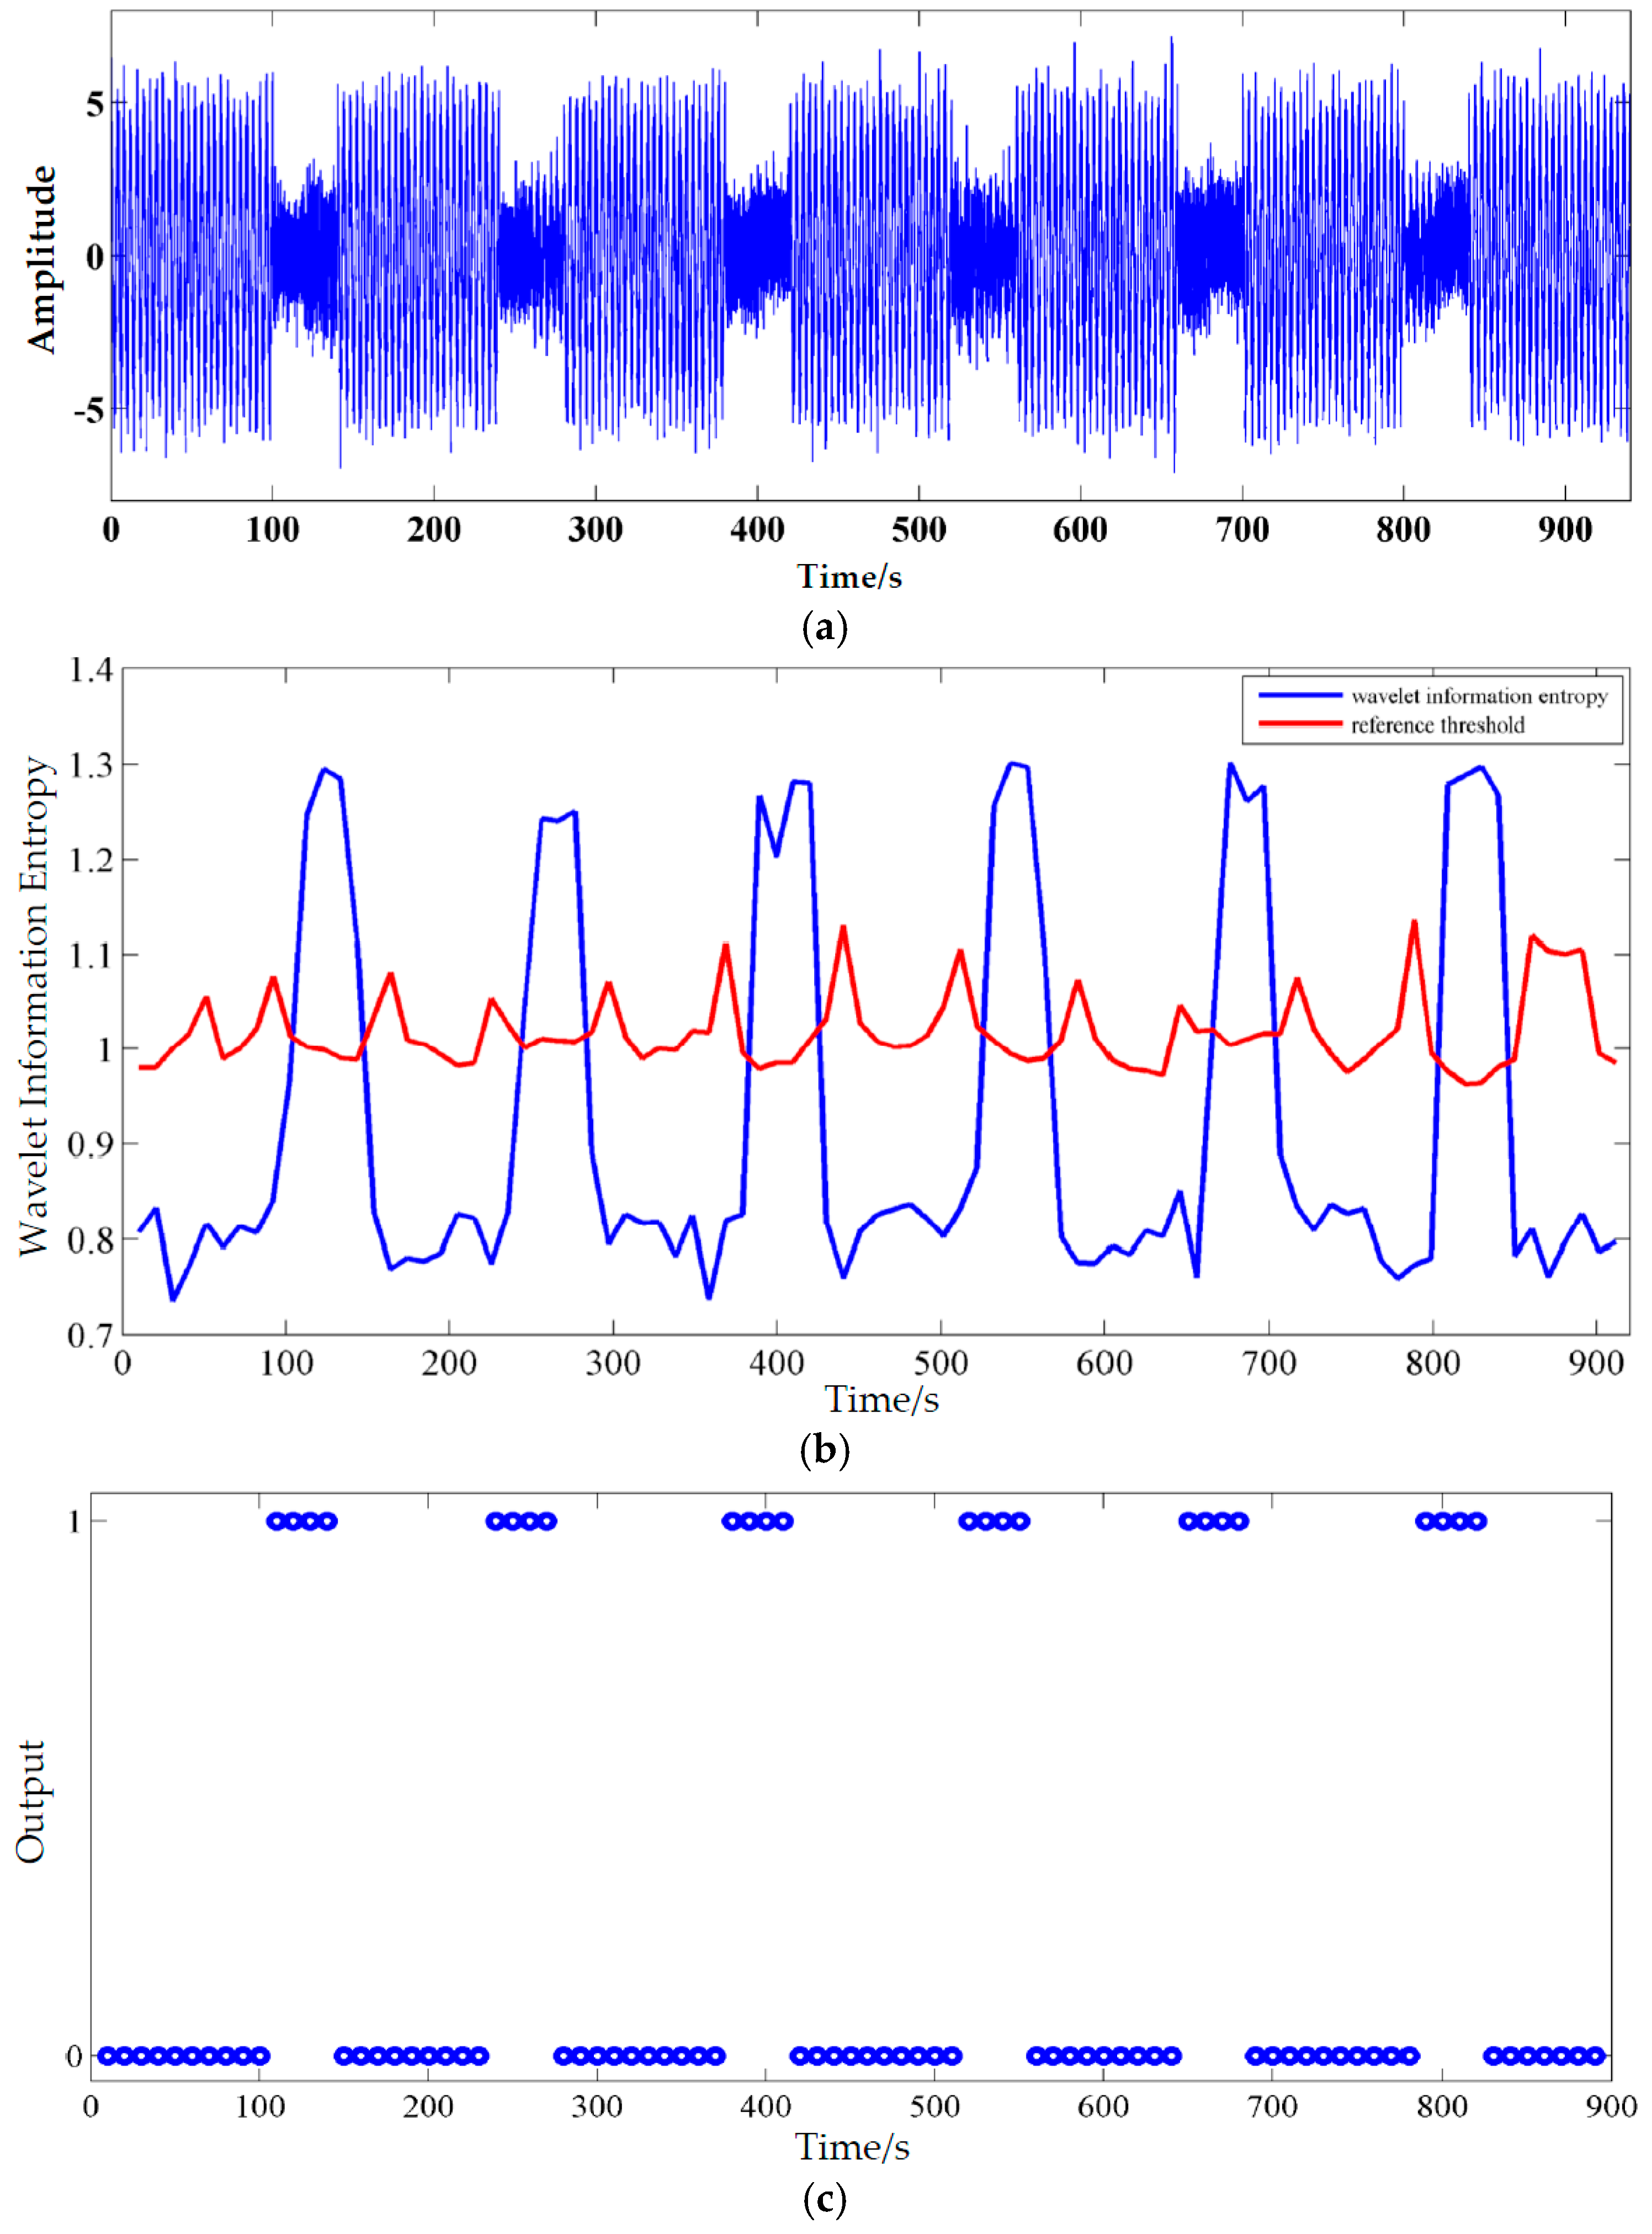
3.1. Simulation Results

Firstly, the simulated OSA signals in this paper were generated by embedding various combinations of the simulation functions representing four different OSA conditions into the normally simulated respiratory signal and the four conditions are: (a) amplitude and frequency of respiratory motion are zero; (b) amplitude values of respiratory motion decreasing and the respiratory frequency accelerating; (c) the frequency of respiratory motion are invariant, but the amplitude reduced by more than 50%; (d) the amplitude and frequency of respiratory motion fluctuate. The simulated OSA signals is added to the Gaussian white noise signal, and signal-to-noise ratio(SNR) is set to −5 dB. Then, the simulated OSA signals were processed according to the flowchart as shown in Figure 2 and the processed results were showed in Figure 3:
The waveform of the simulated OSA signal is as shown in Figure 3a, and there are six different kinds of apnea in the signal. Results of the simulated OSA signal processed by the wavelet information entropy were shown in the Figure 3b, the wavelet information entropy in the apnea state is distinct from the normal situation. In the figure, the blue line represents the wavelet information entropy curve and the red line represents the reference threshold curve. Finally, all the six times of apnea were detected by the proposed method and the judgment outputs were as shown in the Figure 3c, where represents the occurrence of apnea and"0" represents normal breathing.

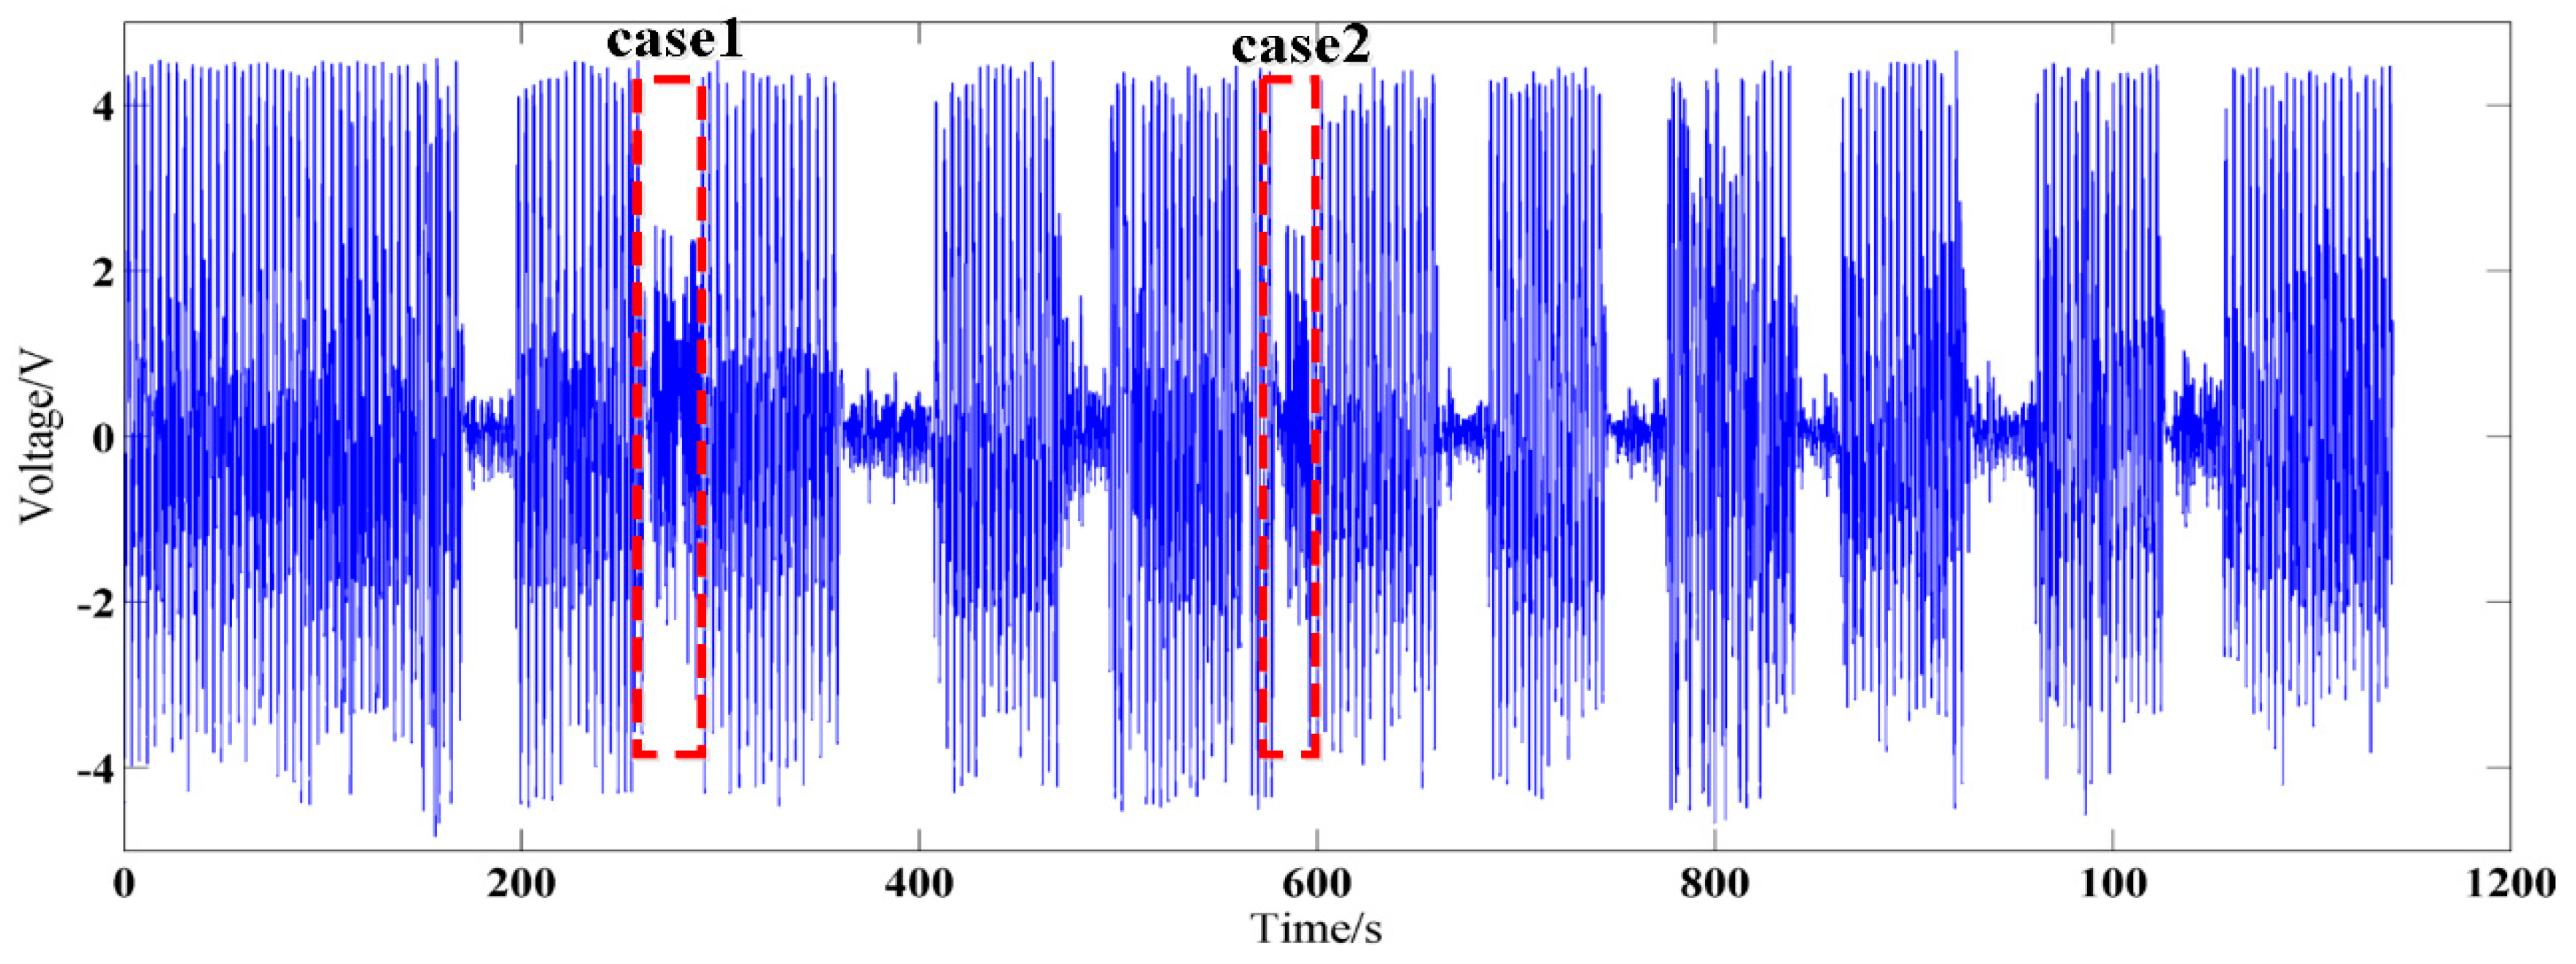
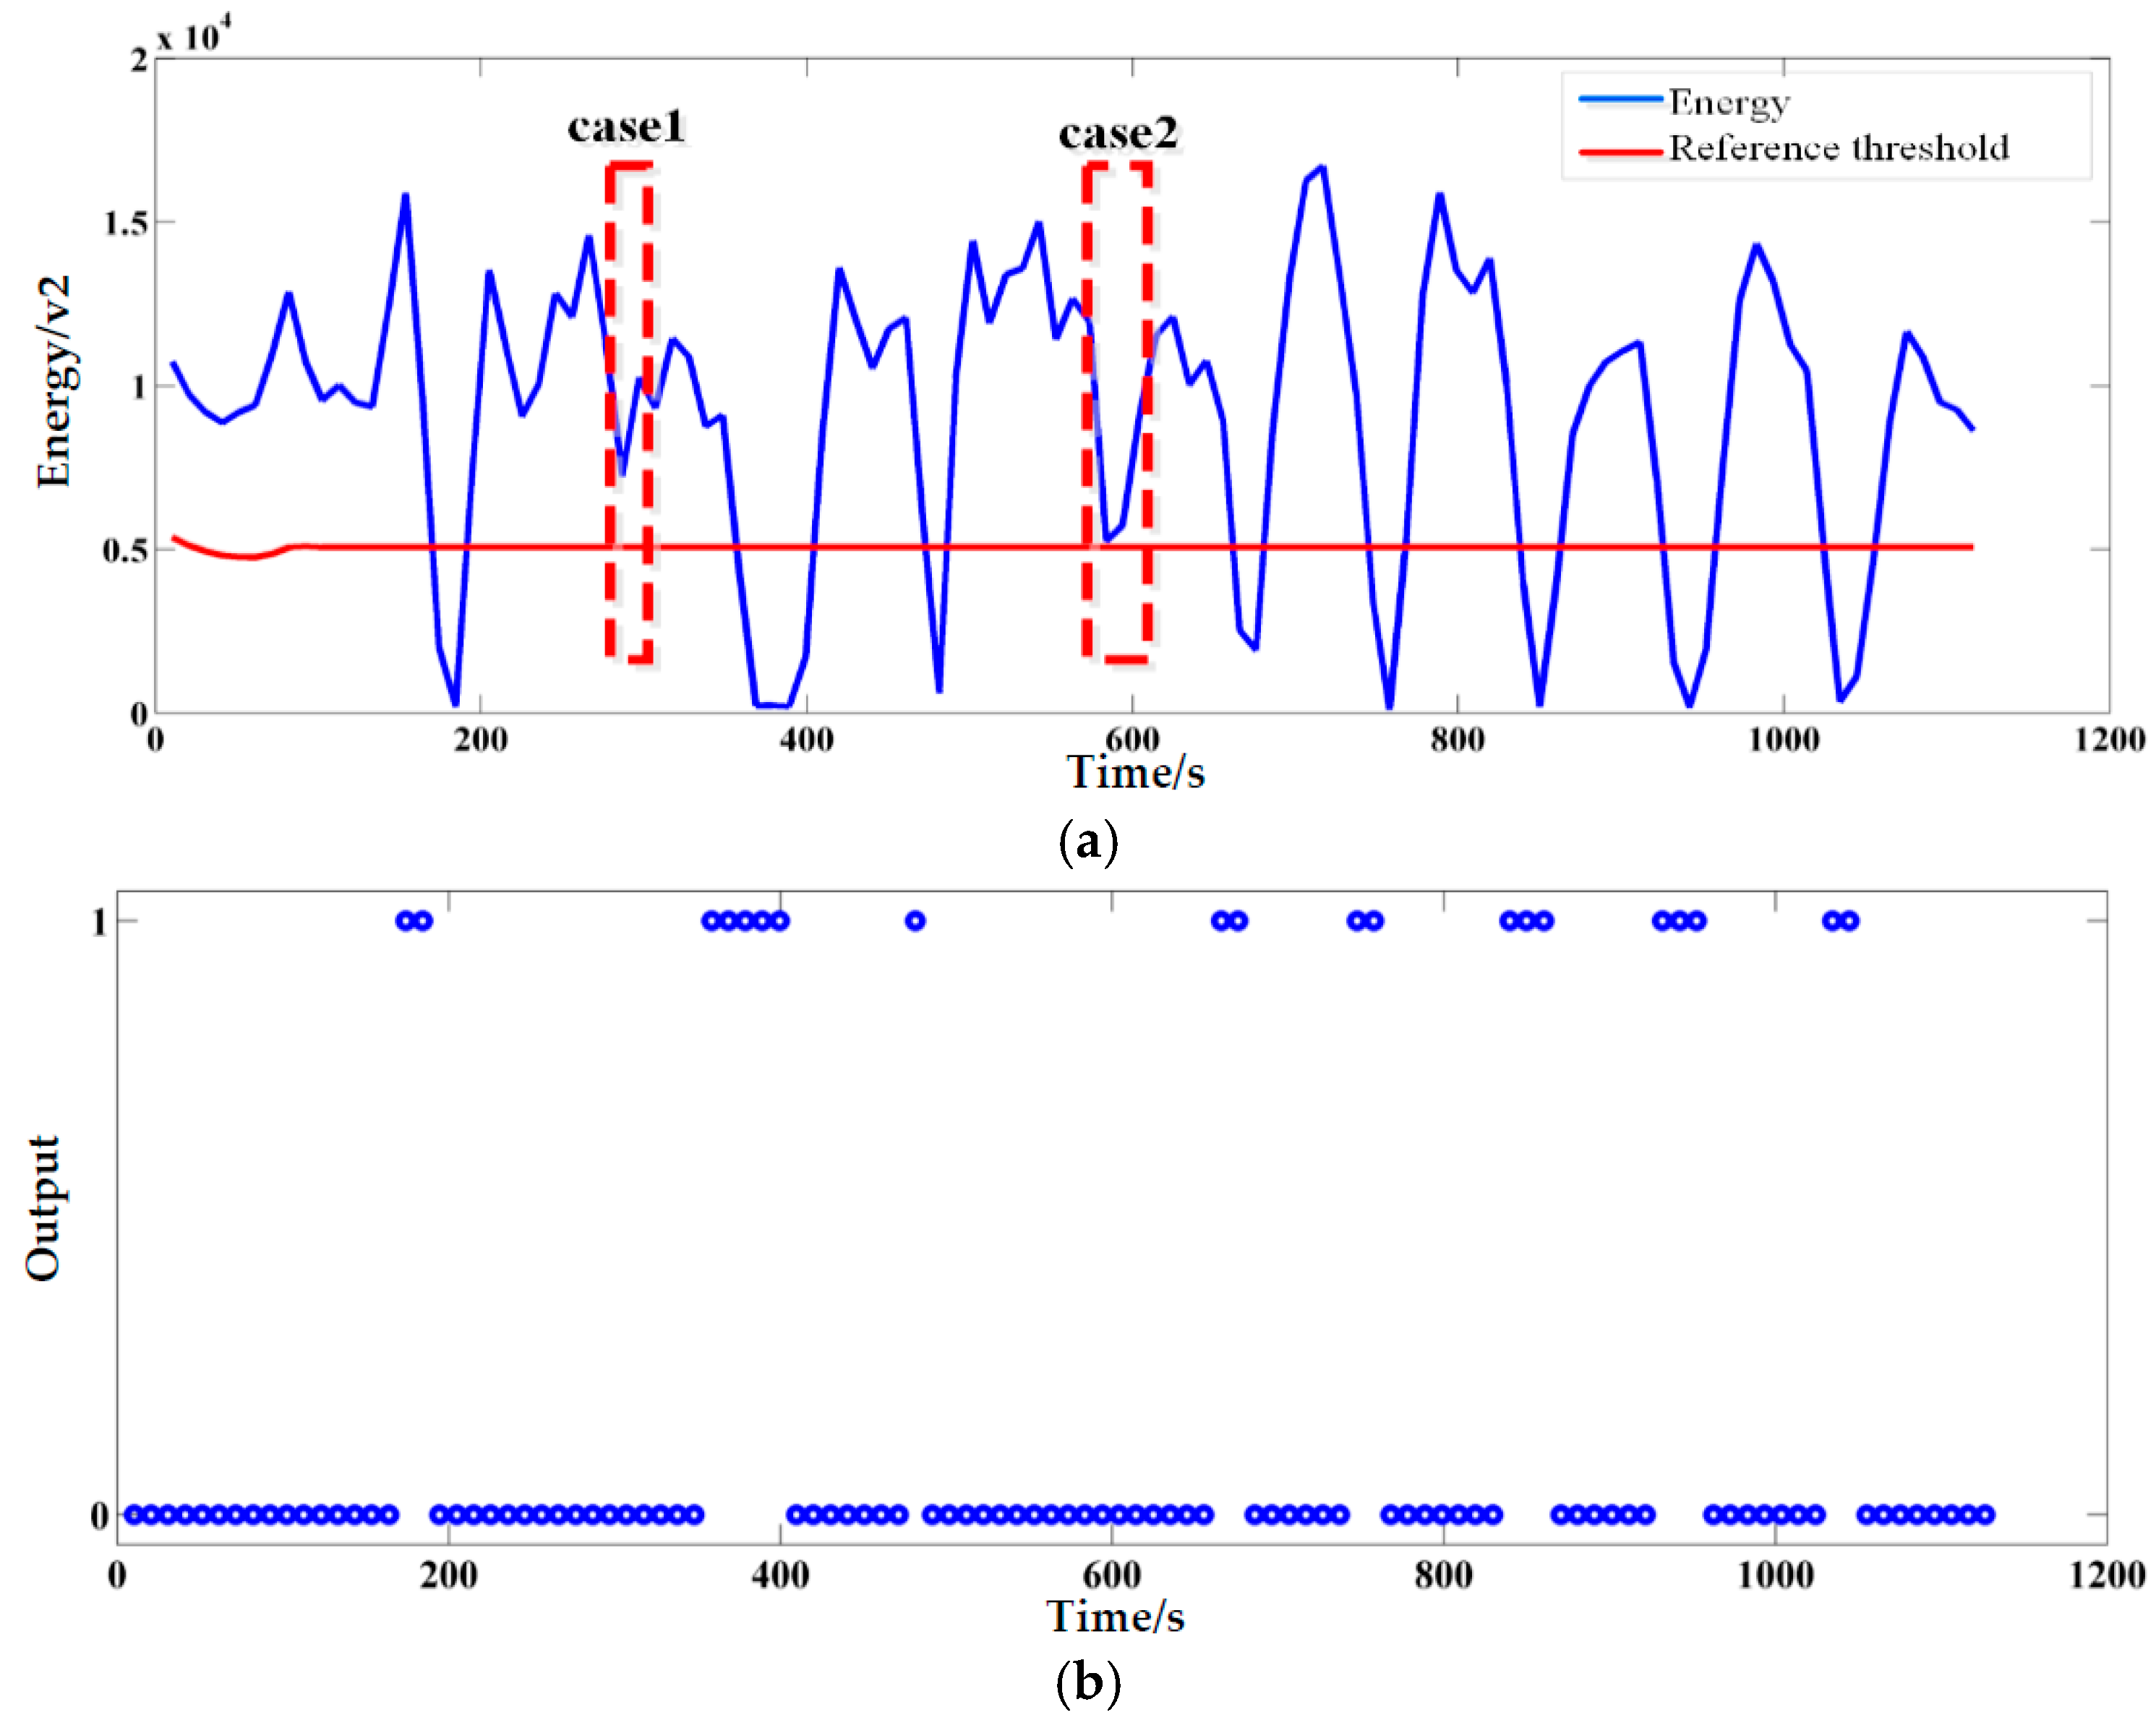
3.2. The Processing Results of Actual OSA Signals Acquired by Radar

Ten OSA patients (10 males; 45.0 ± 6.0 years (mean ± S.D.)) participated in this study. Except for the OSA symptoms, the ten subjects do not suffer from any other health problems. The subject was lying on the sickbed and faced a radar fixed on the ceiling with a distance of 2.5 m during the data collection process. Before data generating, about 20–30 min were left for all the subjects to restore calm and to approach the sleep state gradually. Then, the recording time for each subject lasted for about one hour. Commonly, the patients were in a relatively quiet state without body movement in this period of time just going to sleep. Besides, the subject was also monitored by the PSG system simultaneously to make professional apnea judgment. Just as the “American Sleep Disorders Association Standards of Practice Committee Practice parameters for the indications for polysomnography and related procedures” said [27], we use the polysomnography to monitor and judge the apnea occurrence of the subjects simultaneously based on some parameters of EEG, EOG, chin EMG, etc. Then, the PSG judgment results would provide the reference standard for the Doppler radar system. The Ethic Committee of the Fourth Military Medical University approved the study. The informed consent of all subjects were obtained prior to their participation.
The actual OSA signals of patients acquired by radar were processed by the wavelet information entropy method to make apnea judgment. The processing procedure was as shown in the flow diagram of the Figure 2 and the length of time window is set as 2048 points, stacking 50%. Simultaneously, the conventional apnea judgment algorithm based on energy spectrum [19,20] is taken as the reference method to make a comparison. To facilitate observing detailed information, 20-min data of one subject is applied to test the algorithm and the processed results are as follows:
Just as shown in Figure 4, Cases 1 and 2 represent the two different apneas from the other eight common apneas, which shows that the respiratory signal amplitude is slightly less than 50% of the normal situation, while the breathing rhythm is very disordered and the airflow is much lower than 50% of the normal situation.
As shown in Figure 5a, the wavelet information entropy increased sharply when the apnea occurred. Besides, all the 10 times apnea occurred in the OSA signal were also detected by the proposed algorithm with ease, just as shown in Figure 5a,b, while the reference method only detected 8 times, as shown in Figure 6a,b. Moreover, the proposed method also can detect Cases 1 and 2 easily while the reference method cannot.

3.3. The Judging Accuracy of the Proposed Method

Just as illustrated in Figure 3c, the occurrence times of apnea in the respiratory signals is the jumping times in the judgment output, changing from “0” to “1”.The jumping times were accumulated by processing algorithm and defined as N, while, the actual apnea times judged by the PSG system were defined as NA. Therefore, the judging accuracy of proposed judging algorithm for one group of signals is P s :
P s = | ( 1 | ( N A N ) N A | ) | × 100 %
Then, the 10 groups of OSA signals from 10 subjects that were all processed by the proposed judging algorithm and the results were shown in Table 1.
According to above 10 experiments, the overall judgment accuracy of wavelet information entropy method is:
P s = i = 1 10 P s ( i ) / 10 = 93.1 %
Obviously, our results showed the accuracy is almost as the same as that from the PSG. This means that the OSA judgment system based on the bio-radar can realize its prospected function with satisfactory performance. However, some influencing factors of the judging accuracy of the wavelet information entropy were not considered in this study, such as the breathing amplitude, the breathing frequency, sleeping posture, the distance between the bio-radar and human body. Therefore, it is necessary to explore the adaptability to these different situations. Afterwards, more clinical OSA signals of patients should be used to test and modify the algorithm and the function of classifying the severity of sleep apnea should be added into the algorithm.

4. Discussion and Conclusions

The paper proposed a novel method based on wavelet information entropy spectrum to make apnea judgment in a wavelet domain. It grasped the internal characteristics and explored the principle that the wavelet information entropy is sensitive to the disorder of signal to detect the disorganized apnea during sleep. Besides, this paper determined the mother wavelet and decomposition level according the features of various types of wavelet combined with the respiratory signal characteristics. The simulation experiment results verify the validity of the proposed method theoretically. For the OSA signals acquired by the bio-radar, the proposed method gets a better performance than the energy method in detecting apnea with judgment accuracy—93.1% and it can find the duration of apnea accurately, which is meaningful for the diagnosis of OSA and early danger warning under low physical and psychological pressure.
For the non-stationary OSA respiratory radar signal, the traditional signal processing method in time domain used the amplitude variations [17] or energy variations [18,19,20] of breathing signals. These methods were easily realized, but the detection accuracy could be affected by the changes of human subjects’ posture and the distance of bio-radar. Using the methods in the frequency domain it is hard to find the remarkable frequency for the random changing apnea signal [16]. The wavelet information entropy spectrum method makes full use of the features of strong irregularity and disorder of respiratory signal resulting from the brain stimulation by real low airflow. Including the apnea condition featuring small radar amplitude and strong disorder, there are some cases in which apneas that apparently have slightly bigger radar amplitude, low airflow actually but featuring a strong disorder would also be detected by the proposed method. Therefore, the proposed method will improve the apnea judgment accuracy effectively and find the real apnea duration, which is meaningful for the diagnosis of OSA syndrome and the dangerous time calculation for early warning.
However, some influencing factors on the judging accuracy of the proposed method have not be considered in this study, such as the distance between radar and human body sleeping posture. Therefore, it is necessary to explore the adaptability to these different situations. Afterwards, more clinical OSA signals of patients should be used to test and modify the algorithm and the function of classifying the severity of sleep apnea should be added into the algorithm.

Acknowledgments

This work was supported by National Natural Science Foundation of China (No. 61721102), Scientific technological project in Shaanxi Province, China (No. 2014JM2-6087) and National Science & Technology Pillar Program (No. 2014BAK12B02).

Author Contributions

The authors acknowledge the participants for helping with data acquisition. Thanks are given to Chuantao Li, Shuaijie Wang, Hua Zhang, Jianqi Wang for the suggested corrections. All authors have read and approved the final manuscript.

Conflicts of Interest

The authors declare no conflict of interest.

References

  1. Mannarino, M.R.; di Filippo, F.; Pirro, M. Obstructive sleep apnea syndrome. Eur. J. Int. Med. 2012, 23, 586–593. [Google Scholar] [CrossRef] [PubMed]
  2. Guilleminault, C. Obstructive sleep apnea syndrome. In Sleep Disorders Medicine: Basic Science, Technical Considerations, and Clinical Aspects; Chokroverty, S., Ed.; Butterworth-Heinemann: Oxford, UK, 1994; pp. 199–217. [Google Scholar]
  3. Young, T.; Evans, L.; Finn, L.; Palta, M. Estimation of the clinically diagnosed proportion of sleep apnea syndrome in middle-aged men and women. Sleep 1997, 20, 705–706. [Google Scholar] [PubMed]
  4. Marshall, N.S.; Wong, K.K.; Liu, P.Y.; Cullen, S.R.; Knuiman, M.W.; Grunstein, R.R. Sleep Apnea as an Independent Risk Factor for All-Cause Mortality: The Busselton Health Study. Sleep 2008, 31, 1079–1085. [Google Scholar] [PubMed]
  5. Burwell, C.S.; Robin, E.D.; Whaley, R.D.; Bickelmann, A.G. Extreme obesity associated with alveolar hypoventilation—A Pickwickian syndrome. Am. J. Med. 1956, 21, 811–818. [Google Scholar] [CrossRef]
  6. Quan, S.; Gillin, J.C.; Littner, M.; Shepard, J. Sleep-related breathing disorders in adults: Recommendations for syndrome definition and measurement techniques in clinical research. editorials. Sleep 1999, 22, 662–689. [Google Scholar] [PubMed]
  7. Stradling, J.R.; Davies, R.J.O. Sleep 1: Obstructive sleep apnoea/hypopnoea syndrome: Definitions, epidemiology, and natural history. Thorax 2004, 59, 73–78. [Google Scholar] [CrossRef] [PubMed]
  8. Lettieri, C.J.; Eliasson, A.H.; Andrada, T.; Khramtsov, A.; Raphaelson, M.; Kristo, D.A. Obstructive sleep apnea syndrome: Are we missing an at-risk population? CHEST J. 2005, 128. [Google Scholar] [CrossRef]
  9. Várady, P.; Micsik, T.; Benedek, S.; Benyó, Z. A novel method for the detection of apnea and hypopnea events in respiration signals. IEEE Trans. Biomed. Eng. 2002, 49, 936–942. [Google Scholar] [CrossRef] [PubMed]
  10. Yuan, G.; Drost, N.A.; McIvor, R.A. Respiratory rate and breathing pattern. McMaster Univ. Med. J. 2013, 10, 23–25. [Google Scholar]
  11. Sanders, M.; Costantino, J.; Strollo, P.; Studnicki, K.; Atwood, C. The impact of split-night polysomnography for diagnosis and positive pressure therapy titration on treatment acceptance and adherence in sleep apnea/hypopnea. Sleep 2000, 23, 17–24. [Google Scholar]
  12. Hedner, J.; Pillar, G.; Pittman, S.D.; Zou, D.; Grote, L.; White, D.P. A novel adaptive wrist actigraphy algorithm for sleep-wake assessment in sleep apnea patients. Sleep 2004, 27, 1560–1566. [Google Scholar] [PubMed]
  13. Vaughn, C.M.; Clemmons, P. Piezoelectric belts as a method for measuring chest and abdominal movement for obstructive sleep apnea diagnosis. Neurodiagn. J. 2012, 52, 275–280. [Google Scholar] [PubMed]
  14. Pereira, C.B.; Yu, X.; Czaplik, M.; Rossaint, R.; Blazek, V.; Leonhardt, S. Remote monitoring of breathing dynamics using infrared thermography. Biomed. Opt. Express 2015, 6, 4378–4394. [Google Scholar] [CrossRef] [PubMed]
  15. Zhang, Y.; Jing, X.; Jiao, T.; Zhang, Z.; Lv, H.; Wang, J. Detecting and identifying two stationary-human-targets: A technique based on bioradar. In Proceedings of the First International Conference on Pervasive Computing Signal Processing and Applications (PCSPA), Harbin, China, 17–19 September 2010; pp. 981–985.
  16. Lee, Y.S.; Pathirana, P.N.; Caelli, T.; Evans, R. Doppler radar in respiratory monitoring: Detection and analysis. In Proceedings of the International Conference on Control, Automation and Information Sciences (ICCAIS), Nha Trang, Vietnam, 25–28 November 2013; pp. 224–228.
  17. Kagawa, M.; Tojima, H.; Matsui, T. Non-contact screening system for sleep apnea-hypopnea syndrome using the time-varying baseline of radar amplitudes. In Proceedings of the IEEE Healthcare Innovation Conference (HIC), Seattle, WA, USA, 8–10 October 2014; pp. 99–102.
  18. Zhang, P.-F.; Jing, X.-J.; Zhang, H.; Lu, G.-H.; Wang, J.-Q. Study on Technique for Non-contact Apnea Detection Based on Energy Spectrum. Chin. Med. Equip. J. 2012, 33, 13–15. [Google Scholar]
  19. Tagluk, M.E.; Sezgin, N. Classification of sleep apnea through sub-band energy of abdominal effort signal using wavelets + neural networks. J. Med. Syst. 2010, 34, 1111–1119. [Google Scholar] [CrossRef] [PubMed]
  20. Sezgin, N.; Tagluk, M.E. Energy based feature extraction for classification of sleep apnea syndrome. Comput. Biol. Med. 2009, 39, 1043–1050. [Google Scholar] [CrossRef] [PubMed]
  21. Alekhin, M.; Anishchenko, L.; Zhuravlev, A. Artificial neural networks and wavelet analysis in bio-radiolocation signal breathing patterns classification. In Proceedings of the 7th Russian Bavarian Conference, Erlangen, Germany, 10–14 October 2011.
  22. Lu, G.; Yang, F.; Tian, Y.; Jing, X.; Wang, J. Contact-free measurement of heart rate variability via a microwave sensor. Sensors 2009, 9, 9572–9581. [Google Scholar] [CrossRef] [PubMed]
  23. Zhang, J.C.; Zeng, Z.; Lai, P.; Feng, H.; Jin, S.-J. A recognition method with wavelet energy spectrum and wavelet information entropy for abnormal vibration events of a petroleum pipeline. J. Vib. Shock 2010, 29, 1–5. (In Chinese) [Google Scholar]
  24. Al-Nashash, H.; Thakor, N.V. Monitoring of global cerebral ischemia using wavelet entropy rate of change. IEEE Trans. Biomed. Eng. 2005, 52, 2119–2122. [Google Scholar] [CrossRef] [PubMed]
  25. Sheng, Y.; Roberge, D.; Szu, H.H. Optical wavelet transform. Opt. Eng. 1992, 31, 1840–1845. [Google Scholar] [CrossRef]
  26. Jawerth, B.; Sweldens, W. An overview of wavelet based multiresolution analyses. SIAM Rev. 1994, 36, 377–412. [Google Scholar] [CrossRef]
  27. Chesson, A.; Ferber, R.A.; Fry, J.M.; Grigg-Damberger, M.; Hartse, K.; Hurwitz, T.; Johnson, S.; Littner, M.; Kader, G.; Rosen, G. Practice parameters for the indications for polysomnography and related procedures. Sleep 1997, 20, 406–422. [Google Scholar]
Figure 1. The diagram of the systematic design.
Entropy 18 00306 g001
Figure 2. The flowchart of the apnea judgment algorithm.
Entropy 18 00306 g002
Figure 3. Results of the simulated obstructive sleep apnea (OSA) signal: (a) The simulated OSA signal; (b) Results from the wavelet information entropy method, the blue line represents the wavelet information entropy curve and the red line represents the reference threshold curve; (c) The judgment output, the “1” represents the occurrence of apnea and “0” represents normal breathing.
Entropy 18 00306 g003
Figure 4. The OSA respiratory signal acquired by bio-radar.
Entropy 18 00306 g004
Figure 5. (a) The processing results of the proposed method; (b) Judgment output of the proposed method.
Entropy 18 00306 g005
Figure 6. (a) The processing results of the reference method; (b) Judgment output of the reference method.
Entropy 18 00306 g006
Table 1. Results of the OSA signals processed by wavelet entropy method.
Result NumberPSG System (time)Bio-Radar System (time)Accuracy (%)
1201995.0%
2232191.3%
31010100%
4262492.3%
5202290.0%
6192094.7%
7131584.6%
8171894.1%
9232295.7%
10292793.1%

