Article

Voice Activity Detection Using Fuzzy Entropy and Support Vector Machine

1
Department of Electronics and Communication Engineering, K.L.N. College of Information Technology, Madurai 630612, India
2
Department of Electrical and Electronics Engineering, College of Engineering Pathanapuram, Kerala 689696, India
*
Author to whom correspondence should be addressed.
Entropy 2016, 18(8), 298; https://doi.org/10.3390/e18080298
Submission received: 27 April 2016 / Revised: 27 July 2016 / Accepted: 8 August 2016 / Published: 12 August 2016

Abstract

:
This paper proposes support vector machine (SVM) based voice activity detection using FuzzyEn to improve detection performance under noisy conditions. The proposed voice activity detection (VAD) uses fuzzy entropy (FuzzyEn) as a feature extracted from noise-reduced speech signals to train an SVM model for speech/non-speech classification. The proposed VAD method was tested by conducting various experiments by adding real background noises of different signal-to-noise ratios (SNR) ranging from −10 dB to 10 dB to actual speech signals collected from the TIMIT database. The analysis proves that FuzzyEn feature shows better results in discriminating noise and corrupted noisy speech. The efficacy of the SVM classifier was validated using 10-fold cross validation. Furthermore, the results obtained by the proposed method was compared with those of previous standardized VAD algorithms as well as recently developed methods. Performance comparison suggests that the proposed method is proven to be more efficient in detecting speech under various noisy environments with an accuracy of 93.29%, and the FuzzyEn feature detects speech efficiently even at low SNR levels.

Graphical Abstract

1. Introduction

Voice activity detection (VAD) is a speech-processing technique which discriminates speech from non-speech regions. Silence, noise, or other unrelated acoustic information can be treated as non-speech regions. But the challenge to VAD is to detect speech under low signal-to-noise ratio (SNR) scenarios and also under the influence of nonstationary noises which cause significant errors. The main applications related to VAD are speech coding [1] and speech recognition [2]. VAD stands as a preprocessing stage for major speech processing applications. The applications of VAD extend to mobile communications [3], transmitting speech signals over internet [4], and suppressing noises in digital hearing aids [5].
Being a predominant stage in many speech processing applications, the basic design of a VAD can be summarized by the following steps: a noise reduction step, feature extraction step, and, finally, a classification step in order to distinguish speech and non-speech regions. The noise reduction step plays a crucial role in VAD, because it detects speech pauses in the process of estimating noises present in the speech signal. The well-known noise reduction algorithms proposed by [6,7] are widely used in robust speech recognition tasks, which eventually helps VAD in attaining high performance.
In the feature extraction step, acoustic features are usually considered in order to distinguish speech and noise. Traditional VADs rely on energy [8] and some other VADs include zero crossing rate (ZCR) and energy difference between speech and non-speech proposed by [9]. Some algorithms use correlation coefficients [10], others wavelet coefficients [11] and cepstral distance features [12]. Ramirez et al. [13] proposed long-term spectral divergence, speech periodicity [14], and speech periodic component to aperiodic component ratio [15]. But these traditional features lack robustness under noisy conditions. So various algorithms include multiple features to detect speech under various noisy conditions. All-band spectra and sub-band spectra of Wiener filter are used in [16], and higher order statistics in [17]. These features, however, improve the accuracy of the VAD in some conditions, but are still lacking for low SNR conditions. VAD accuracy and performance rely on the final classification phase.
Finally, with the classification step, VAD results mainly rely on decision rule or by a threshold on the features extracted from the speech signal. The decision rule is either a simple threshold-based approach or some statistical models. Different classifiers based on machine learning algorithms (MLA) are also invoked for VAD results. One way is with the use of neural networks. Supervised neural networks have been widely used in classification, but the disadvantage with neural networks is its cost expensive training procedures. Other frequently used classifiers are k-nearest neighbor (k-NN) and support vector machine (SVM) classifiers [18,19,20]. k-NN algorithm is a nonparametric MLA used in classification, where the classification takes place using the majority votes of its neighbors. Another nonparametric MLA proposed by [21] is the SVM classifier, which is one of the powerful tools used to classify speech and non-speech signals, because of its convergence speed in the training phase, which is faster when compared to other classifiers. In our proposed method, SVM classifier is used for VAD under various noisy conditions. Irrespective of decision rules or any other classifier, selection of appropriate features will always impact the performance of VAD, because there are no unique features or multiple features considered with regard to improving the performance of VAD under various noisy conditions. So the problem regarding VAD is extremely challenging to the researchers. In our proposed method, fuzzy entropy is introduced as the feature extracted over the speech signal. Since entropy-based feature extraction is solid to discriminate speech and noise, it fails to discard cough and excessive breath from speech signals, which are treated as non-speech. Based on fuzzy set theory, to measure the complexity of the time series data, fuzzy entropy (FuzzyEn) [22] was introduced. FuzzyEn is a modified algorithm of sample entropy (SampEn) [23,24,25,26,27]. Since then, FuzzyEn has been successful in feature extraction. Similar to SampEn-based algorithms, FuzzyEn retains certain characteristics like excluding self-matches. Additionally, by inheriting the similarity measurement using fuzzy sets, the limitations cited by SampEn—which uses the Heaviside function as the tolerance to select or discard the similarities between the two vectors—was overcome by FuzzyEn, as FuzzyEn transits smoothly through varying parameters with the use of the exponential function.
In this study, FuzzyEn was used as a feature to provide the input into the SVM for VAD, and its performance was investigated under various noisy conditions (airport, babble, car, and train) at different SNR levels (−10 dB, −5 dB, 0 dB, 5 dB, and 10 dB). Also, the significance of the FuzzyEn feature was tested using k-NN classifier and the results were compared against the different algorithms and the algorithm proposed. This article follows with Section 2, which describes the proposed methodology, and Section 3, the result analysis, and finally concluding with Section 4.

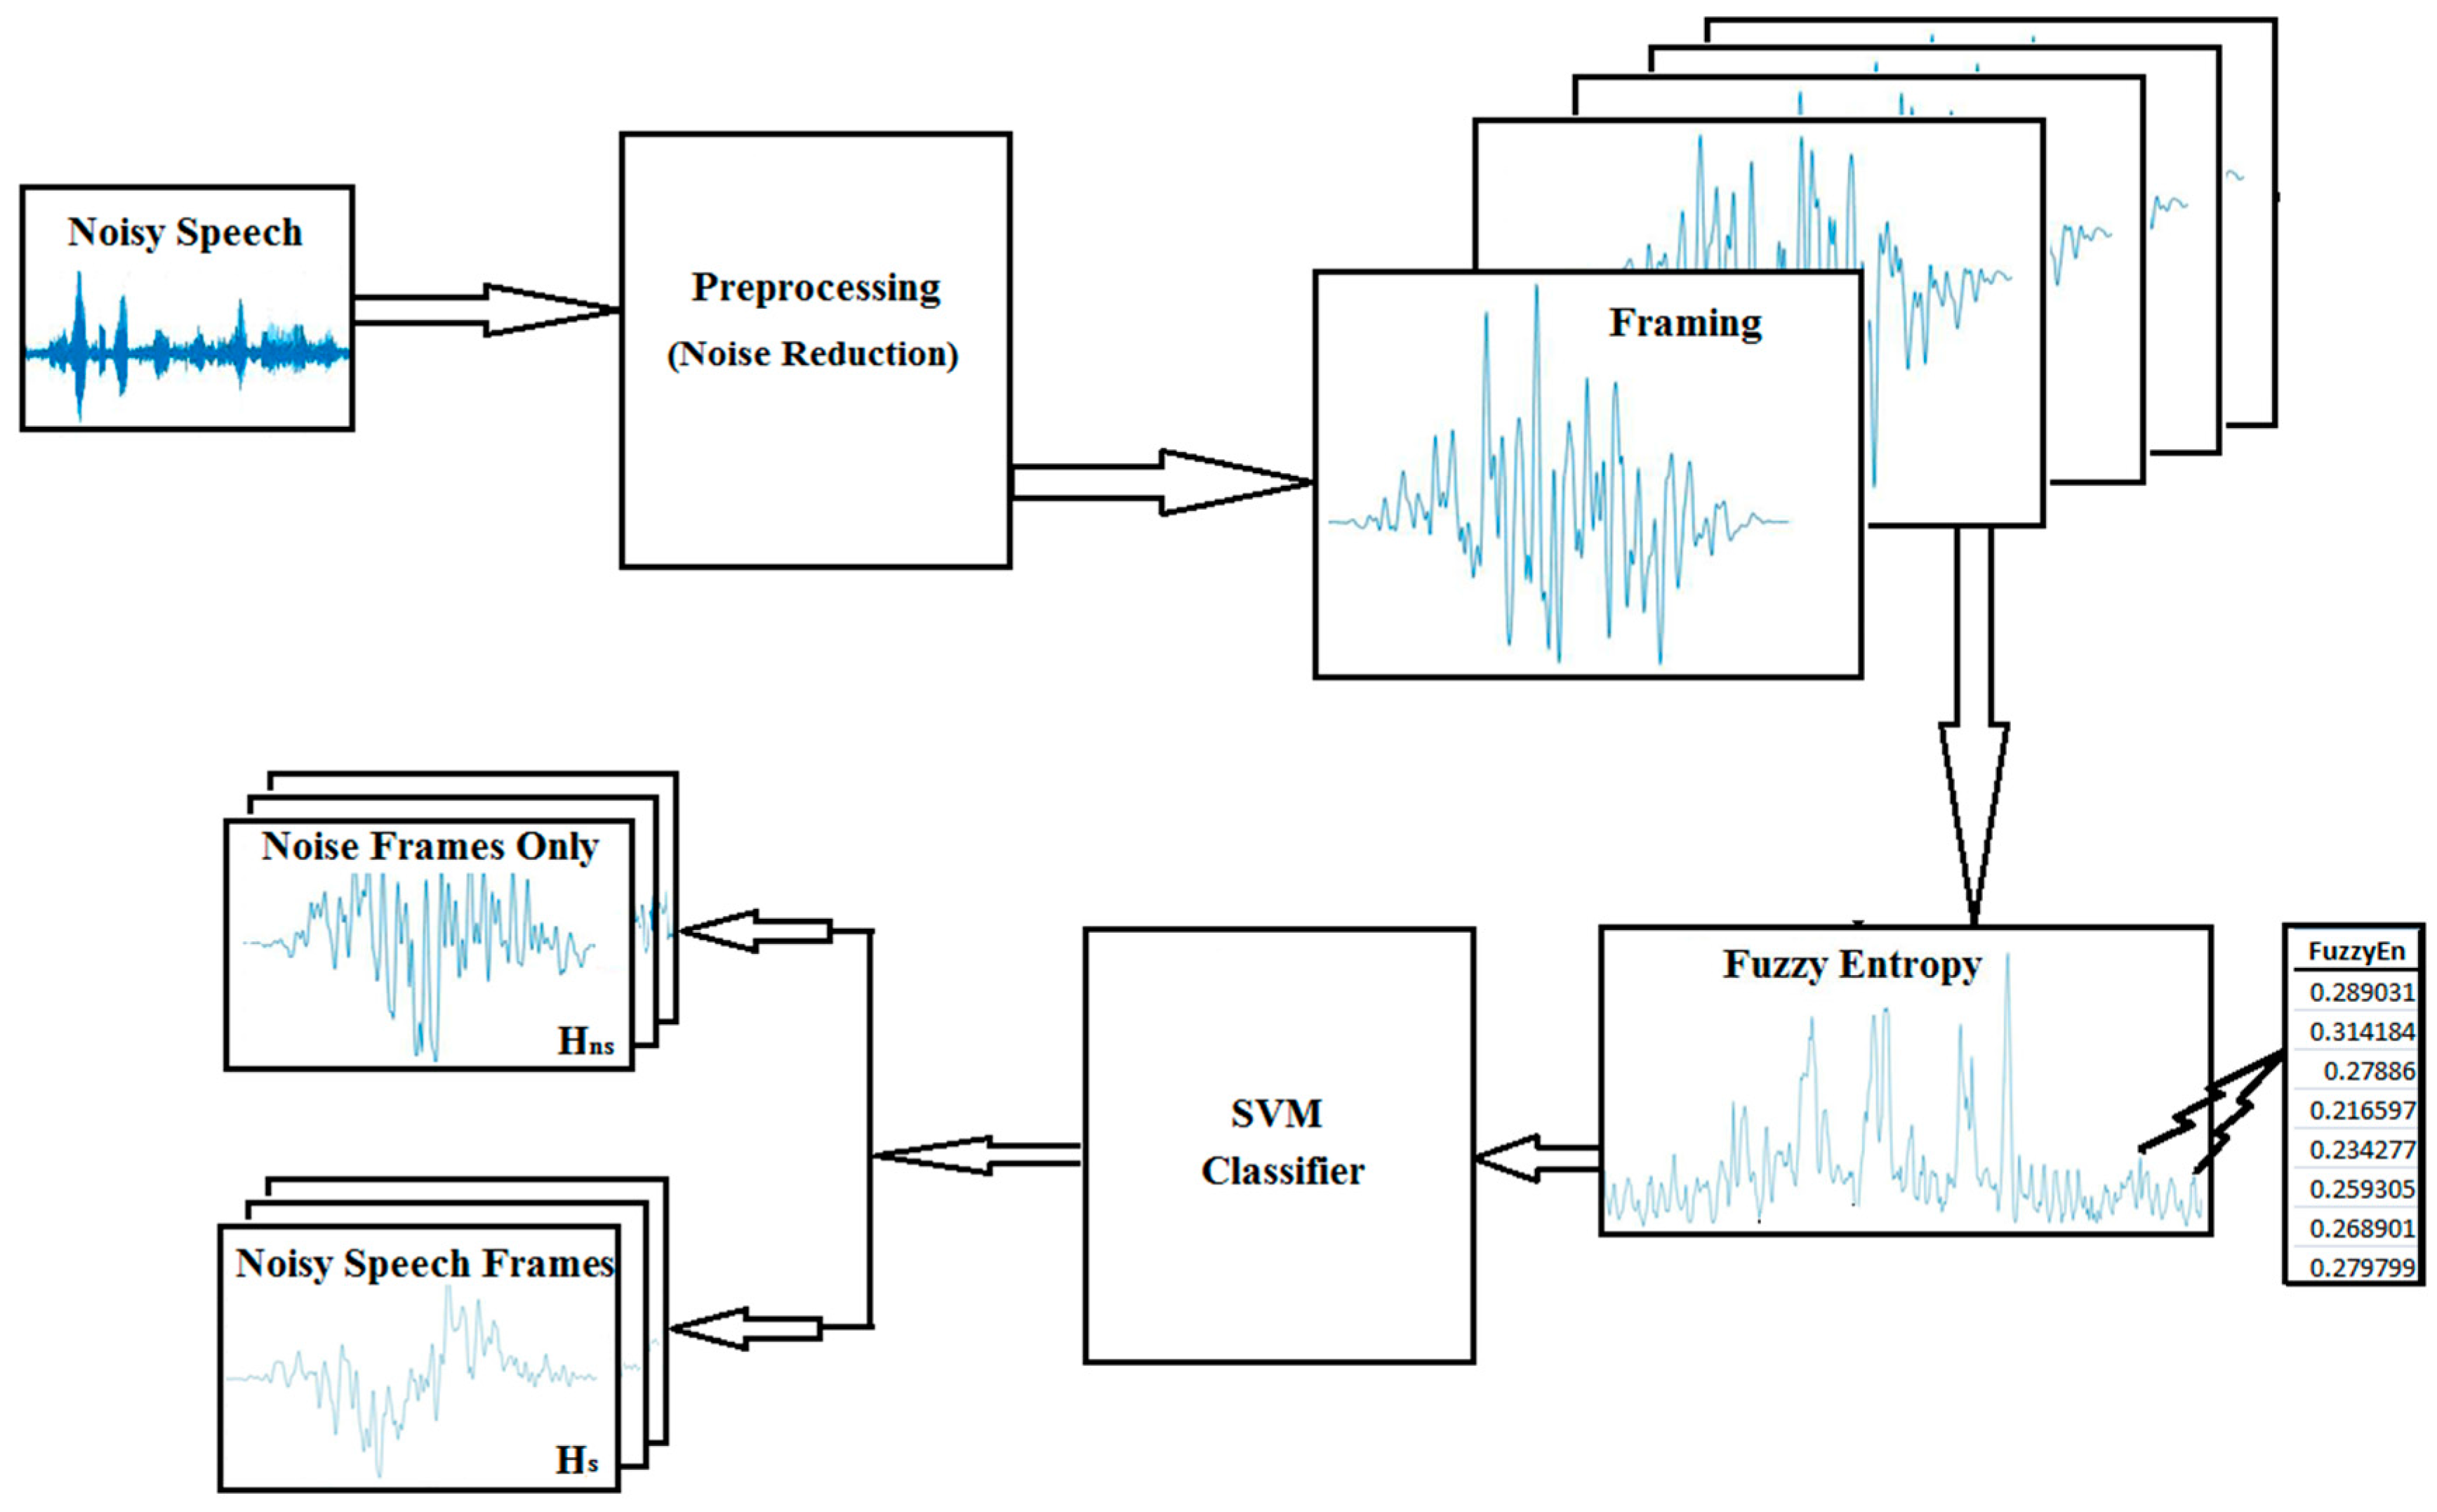
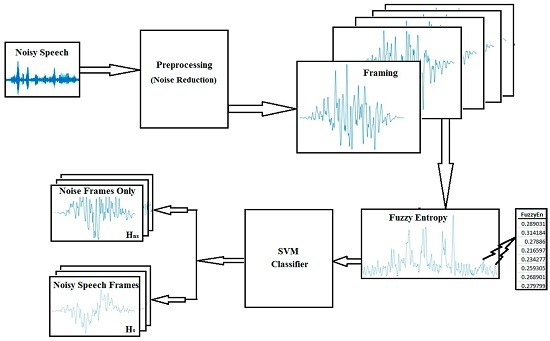
2. Proposed Methodology
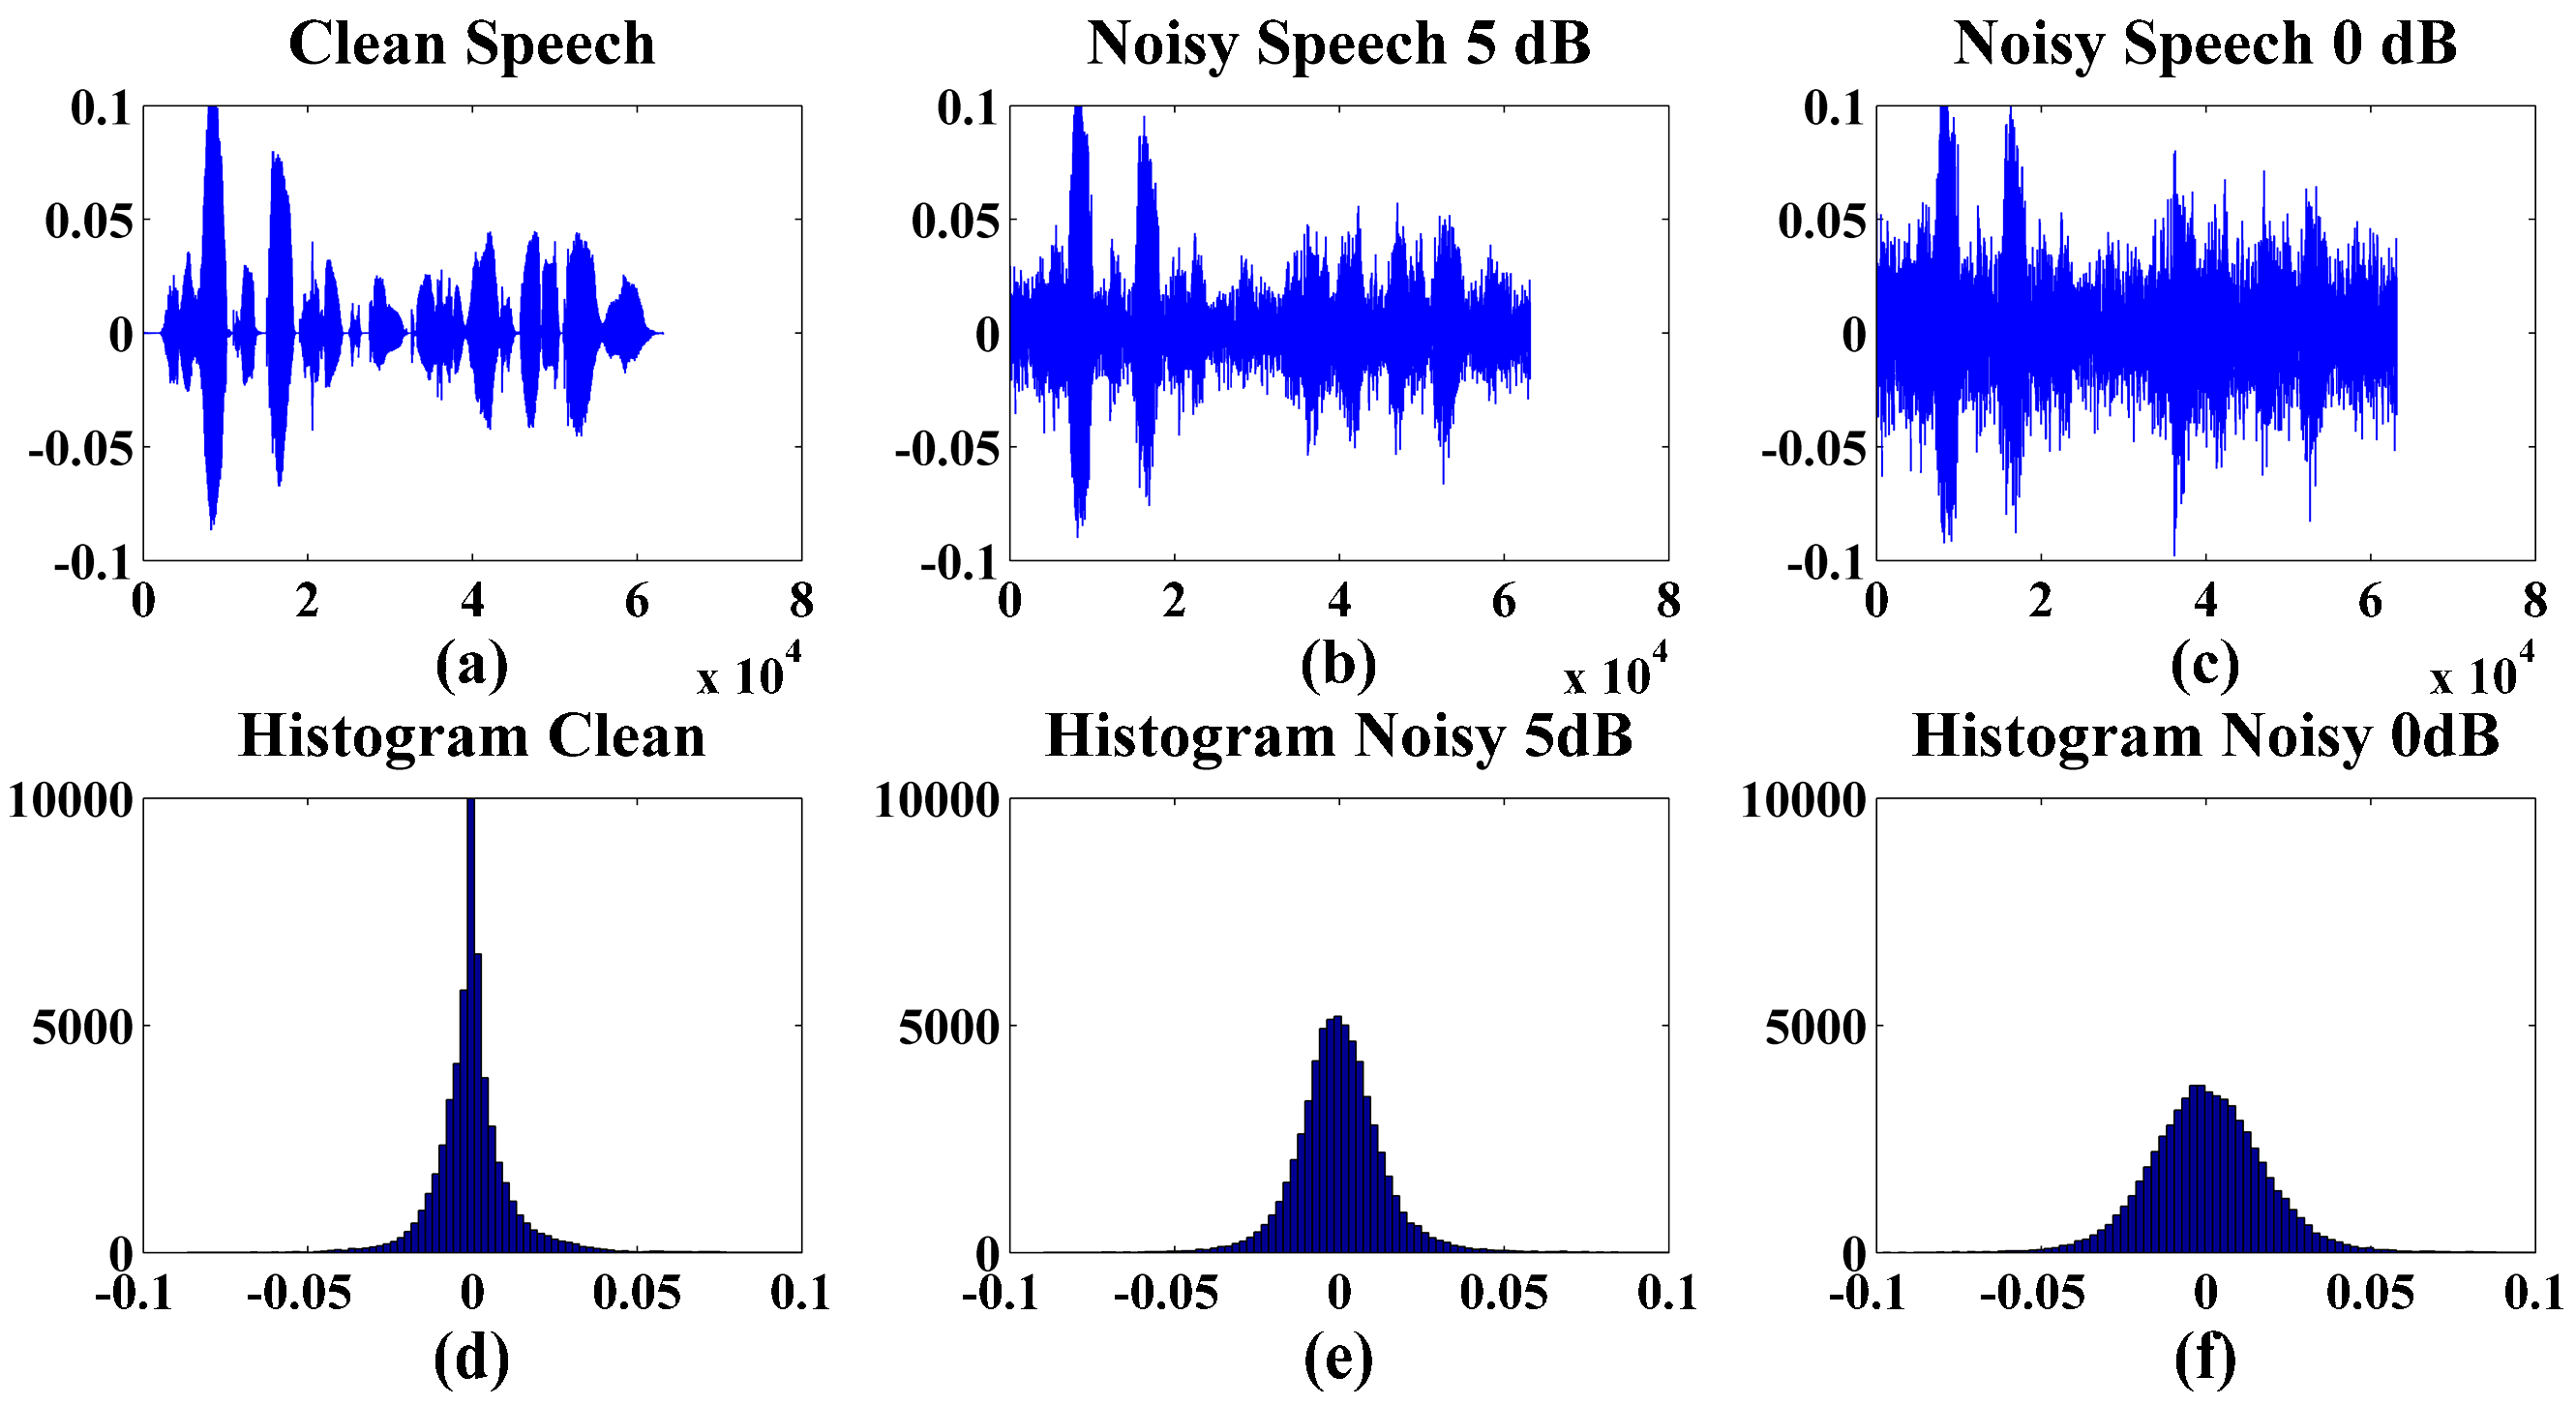
Voice activity detection usually addresses a binary decision in the presence of speech for each frame of the noisy signal. The proposed VAD block diagram is shown in Figure 1. The proposed VAD method is explained in detail in the following subsections. The motivation for the proposal is to identify a robust feature that would improve the accuracy of the VAD. The implementation steps of the proposed VAD are explained in detail as follows.

2.1. Preprocessing

Noise reduction is used as a preprocessing step in the proposed methodology. It deals with suppressing the background noise available in the noisy speech signal. The input noisy speech s k ( t ) is obtained by corrupting the clean speech x k ( t ) by the additive noise v k ( t ) , as in (1),
s k ( t ) = x k ( t ) + v k ( t )
To reduce the effect of background noise from the noisy speech signal, spectral subtraction proposed by Boll [6] is used, because the statistical and structural properties of the speech signal gets corrupted when the SNR tends to go lower than −5 or −10 dB, or with complex audible events. To enhance the spectrum of the speech signal, spectral subtraction is considered. The spectrum of noise V k ( f ) was estimated during speech inactive periods and subtracted from the spectrum of the current frame S k ( f ) resulting in an estimate of the spectrum X k ( f ) of the noise reduced speech as in (2),
| X k ( f ) | = | S k ( f ) | | V k ( f ) |
In this scenario, the primary interest of this paper is in evaluation of the proposed VAD classifier under conditions of noise-cancellation, and while a ground truth measurement is used to identify speech and non-speech frames, this is to allow for sufficient evaluation, using a standard approach to noise-cancellation. The impact of noise on the speech is explained in Figure 2. The clean speech signal is corrupted by additive white noise for SNRs 0 and 5 dB. As seen in Figure 2, clean speech’s histogram shows leptokurtic and heavy-tailed distributions, while lowering the SNR cause the histogram to become mesokurtic with medium-tailed distributions.

2.2. Framing

Since the nature of the speech signal is nonstationary, the obtained noise-reduced speech is divided into a sequence of small frames of equivalent size of 20–40 ms long. The frame is to be categorized as speech or noise in most cases, therefore the VAD problem can be treated as a binary classification problem. In this paper, the noise-reduced speech is divided into 32 ms long frames with a frame shift of 10 ms with a sampling rate of 16 kHz and windowed using Hanning window. Therefore, the resultant frame consists of 512 samples and the number of frames vary depending on the length of the speech signal. These values were obtained experimentally.

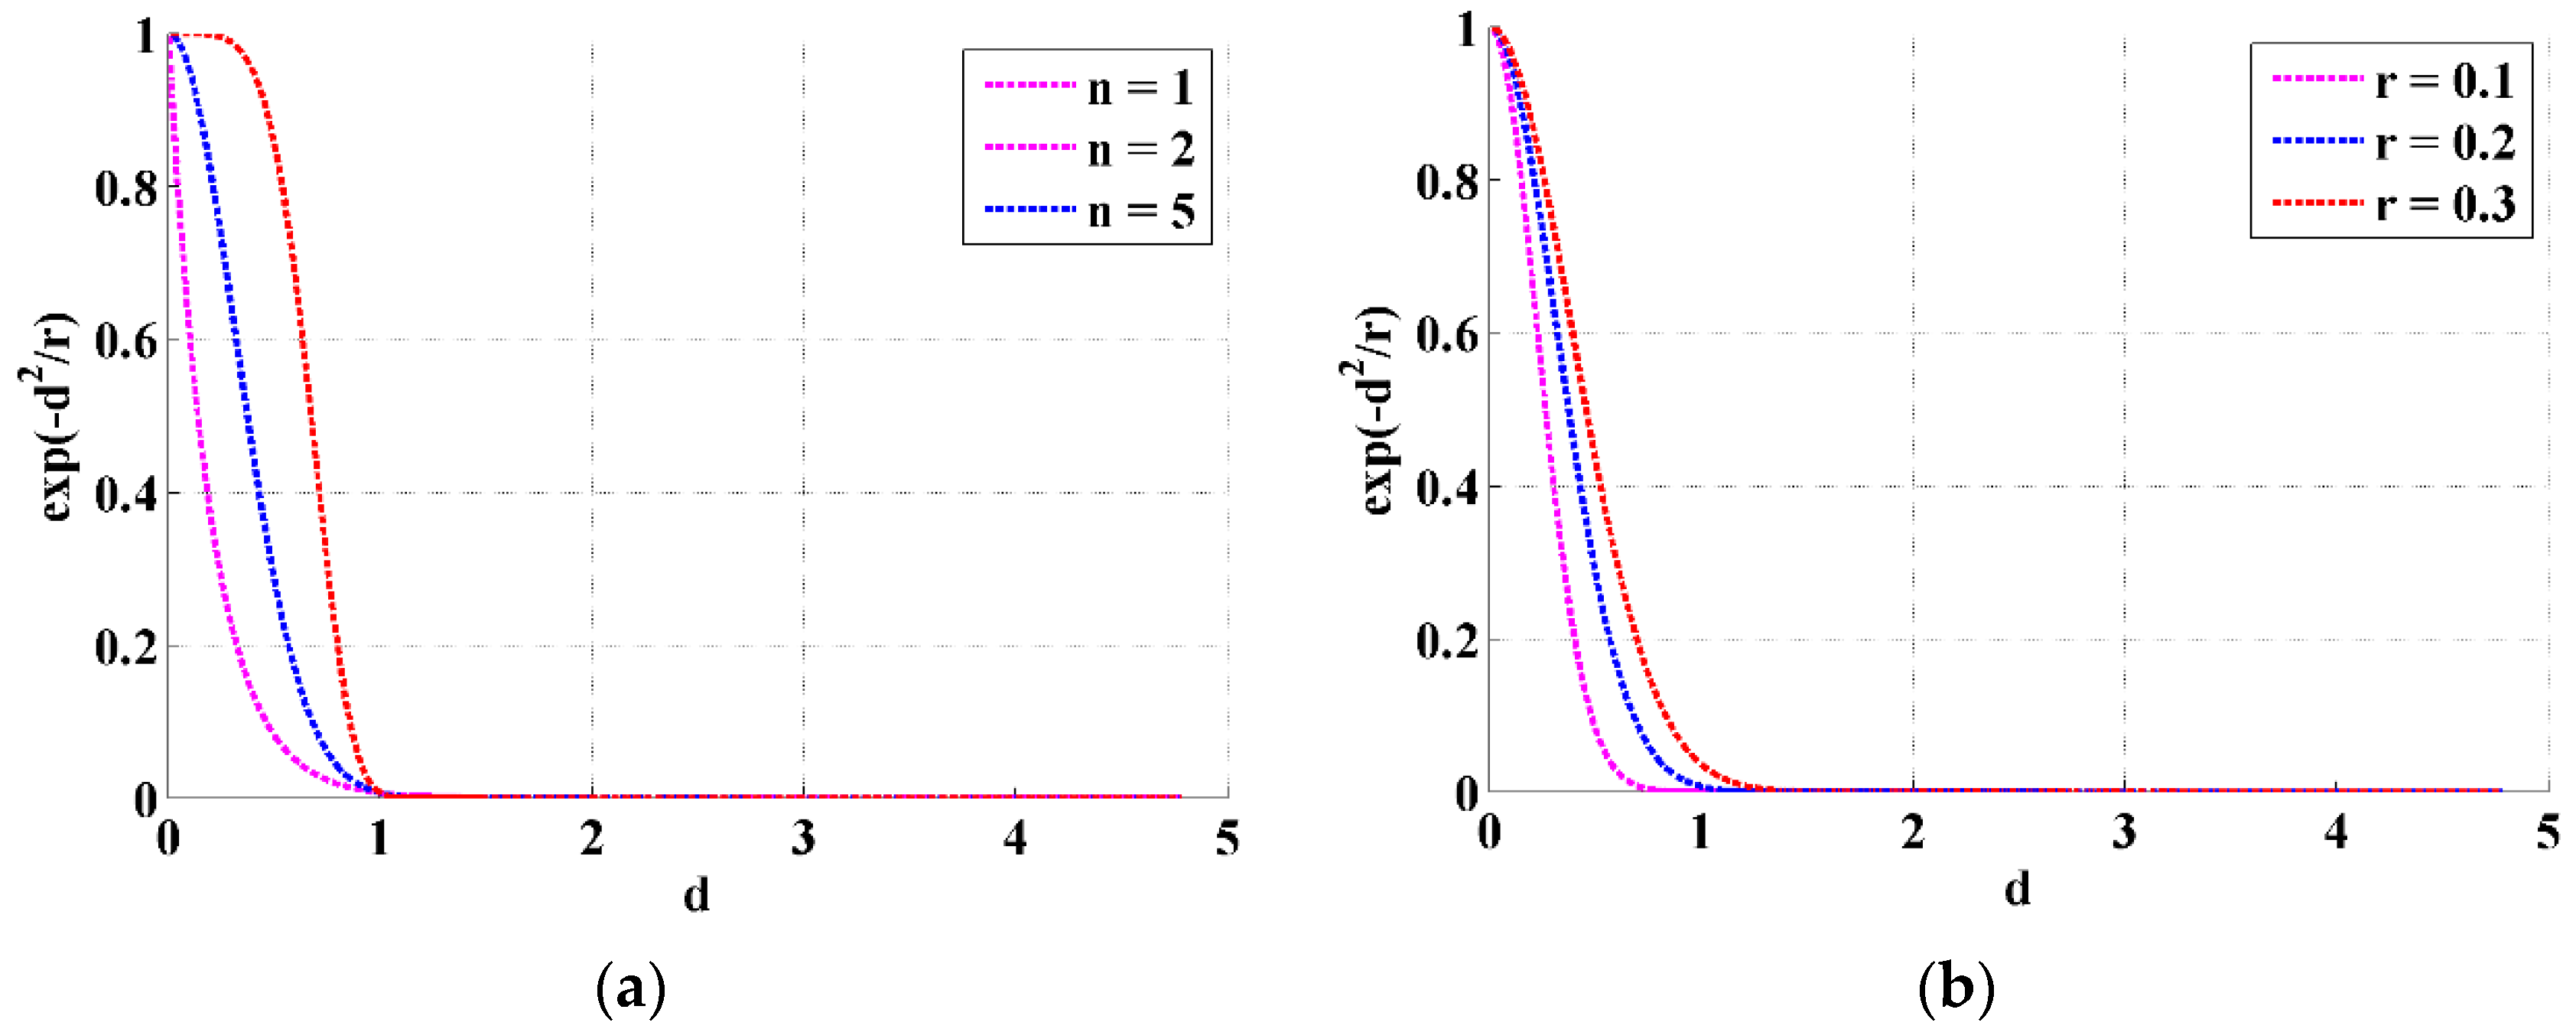
2.3. Feature Extraction—Fuzzy Entropy (FuzzyEn)

Let s(i) be the sample speech sequence, where i = 1, 2, 3, …, N (N = 512 in present case), which is reconstructed by phase-space with an embedded dimension m, and the reconstructed phase-space speech vector S i m is given in (3),
S i m = { s ( i ) ,   s ( i + 1 ) ,   ,   s ( i + m 1 ) } s 0 ( i ) ,   i = 1 , 2 , , N m + 1
and is generalized by removing the baseline as in (4),
s 0 ( i ) = m 1 j = 0 m 1 s ( i + j )
For given vector S i m , the similarity degree D i j of its neighboring vector S j m through its similarity degree is defined by fuzzy function, given in (5),
D i j = µ ( d i j m , r )
and d i j m is the maximum absolute difference of the scalar components of S i m and S j m , given in (6),
d i j m = d [ S i m , S j m ] = max l   ( 0 , m 1 ) [ ( s ( i + l ) s 0 ( i ) ) ( s ( j + l ) s 0 ( j ) ) ]
Here µ ( d i j m , r ) is the fuzzy membership function, which is given by the exponential function, as in (7),
µ ( d i j m , n , r ) = e x p ( ( d i j m ) n r )
where m, n, and r are the embedding dimension, gradient, and width of the fuzzy membership function, respectively.
For each S i m , averaging all similarity degree D i j of the neighboring vectors S j m , we get (8),
Φ i m = 1 ( N m 1 ) j = 1   j i N m D i j m
Now construct φ m ( r ) given in (9) and φ m + 1 ( r ) which is given in (10),
φ m ( r ) = 1 N m i = 1 N m Φ i m ( r )
and
φ m + 1 ( r ) = 1 N m i = 1 N m Φ i m + 1 ( r )
From this, FuzzyEn ( m , r ) of the speech, is defined by, given in (11),
FuzzyEn ( m , r ) = lim N [ ln φ m ln φ m + 1 ( r ) ]

Selection of FuzzyEn Parameters

Three parameters are crucial in calculating FuzzyEn, which are to be fixed at first. The first parameter, m, is the embedded dimension which focusses on the sequence length to be compared. The other two parameters are r and n, which determine the width or similarity tolerance and the gradient of the exponential function, respectively. Figure 3 illustrates the impact of different selection of parameters on the exponential function. In Figure 3a, the width r in the exponential membership function is fixed at 0.2 and n is varied from 1, 2, and 5. Similarly, in Figure 3b, the exponential membership function parameter n is set to 2 and the width r varies between 0.1 and 0.3. Experimentally, the width r is optimal when multiplied with standard deviation (SD) and small values of n. In this work, the embedding dimension, m, is 2 and the exponential function parameters n and r are set as 2 and 0.2 times standard deviation, respectively. Generally, too large values of embedding dimension might lead to loss of useful information. Also, underestimating the similarity tolerance, r, leads to higher noise sensitivity. So the selection of FuzzyEn parameter numbers are decided based on Mann–Whitney U-test. The lowest p-value was obtained for the parameter combination m as 2 and n and r as 2 and 0.2 times SD, respectively.
FuzzyEn is computed for all the frames of the speech signal and these values are used as the features for the SVM classifier. Therefore, the feature vector will be equal to the total number frames of the input speech signal. The frame is labeled as speech, if more than half the samples are speech, otherwise the frame is labeled as noise.

2.4. Classifier

2.4.1. Support Vector Machine (SVM)

In this work, SVM is used as a classifier, because it constructs an optimal decision function f ( x ) , that accurately predicts the unseen data in two classes by minimizing the error function shown in (12),
f ( x ) = s i g n ( g ( x ) )
where g ( x ) is the decision boundary derived from the training set samples ( x i ,   y i ) i = 1 N , x i   ϵ   R m for the corresponding target classes y i   ϵ   R m . The decision boundary is a hyperplane which is given by, as in (13),
g ( x ) = w ,   x + b
where w and b , shall be derived based on the classification accuracy of the linear problems. Generally, a nonlinear SVM model is trained to minimize the following objective function in (14),
min w ,   b ,   ξ   1 2   w 2 + C   i = 1 n ξ i Subject to  y i [ w T φ ( x i ) b ] 1 ξ i ξ i 0 ,   i = 1 , 2 , , n
where φ ( x i ) is a mapping function to map x i to its higher dimensional feature space,   ξ i is the misclassification error and C controls the tradeoff between the cost of classification and the margin. The mapping of the input training set into a higher dimensional space is done through a kernel function   K   ( x i ,   y i ) . Usually three types of nonlinear kernel functions are considered, such as polynomial kernel, multilayer kernel, and radial basis function (RBF) kernel. In this work, the RBF kernel function was used because of its excellent generalization and low computational cost [28]. The RBF kernel function is given by (15),
K   ( x i ,   y i ) = exp ( γ x i y i 2 )
where, the parameter γ = 1 / 2 σ 2 is the regularization parameter which controls the width of the Gaussian function. For this given kernel function, the error function of the classifier is given by (16),
f ( x ) = s i g n ( i = 1 N α i y i   K ( x ,   x i ) + b )

2.4.2. k-Nearest Neighbor (k-NN)

The k-nearest neighbor algorithm classifies unknown samples based on the closest training samples in the feature space [29,30]. The distance or the similarity measure determines the closeness of the k-nearest neighbor. Here, Euclidian distance is used to compute the nearest neighbor for the new feature vector. The class with majority of the neighboring votes is declared as the class of the new feature vector. Here k-NN classifier is considered to show the significance of FuzzyEn feature.

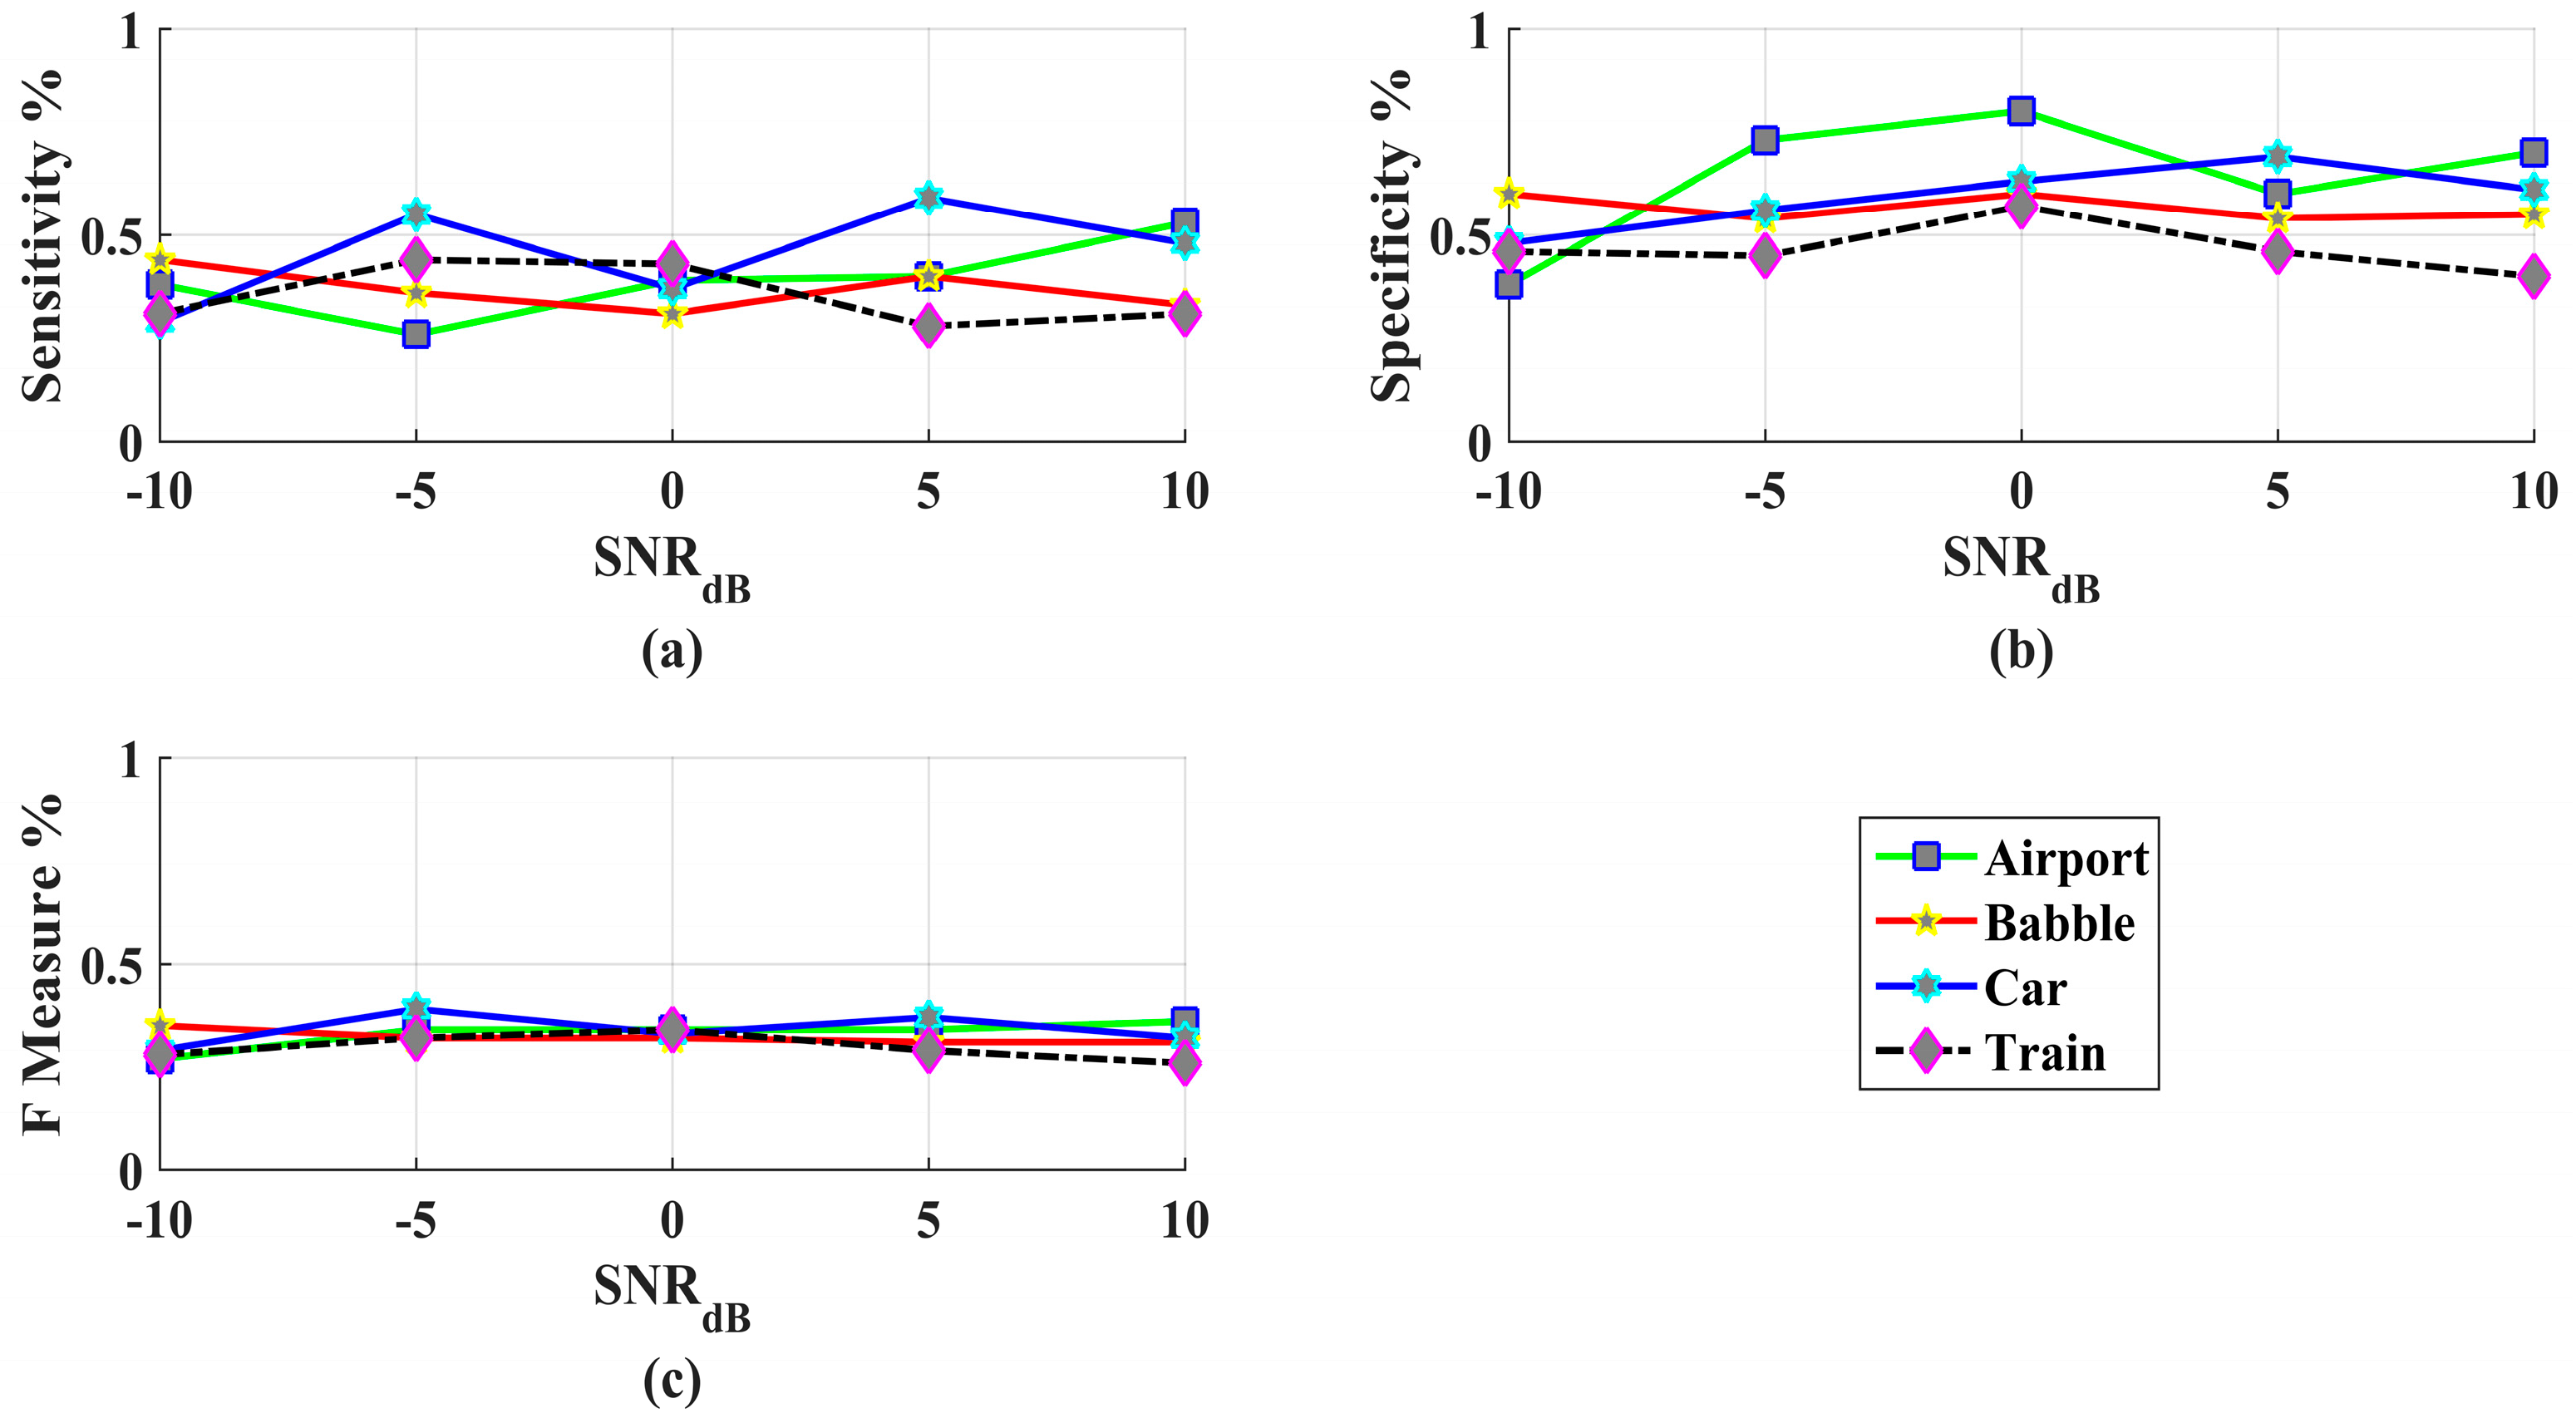
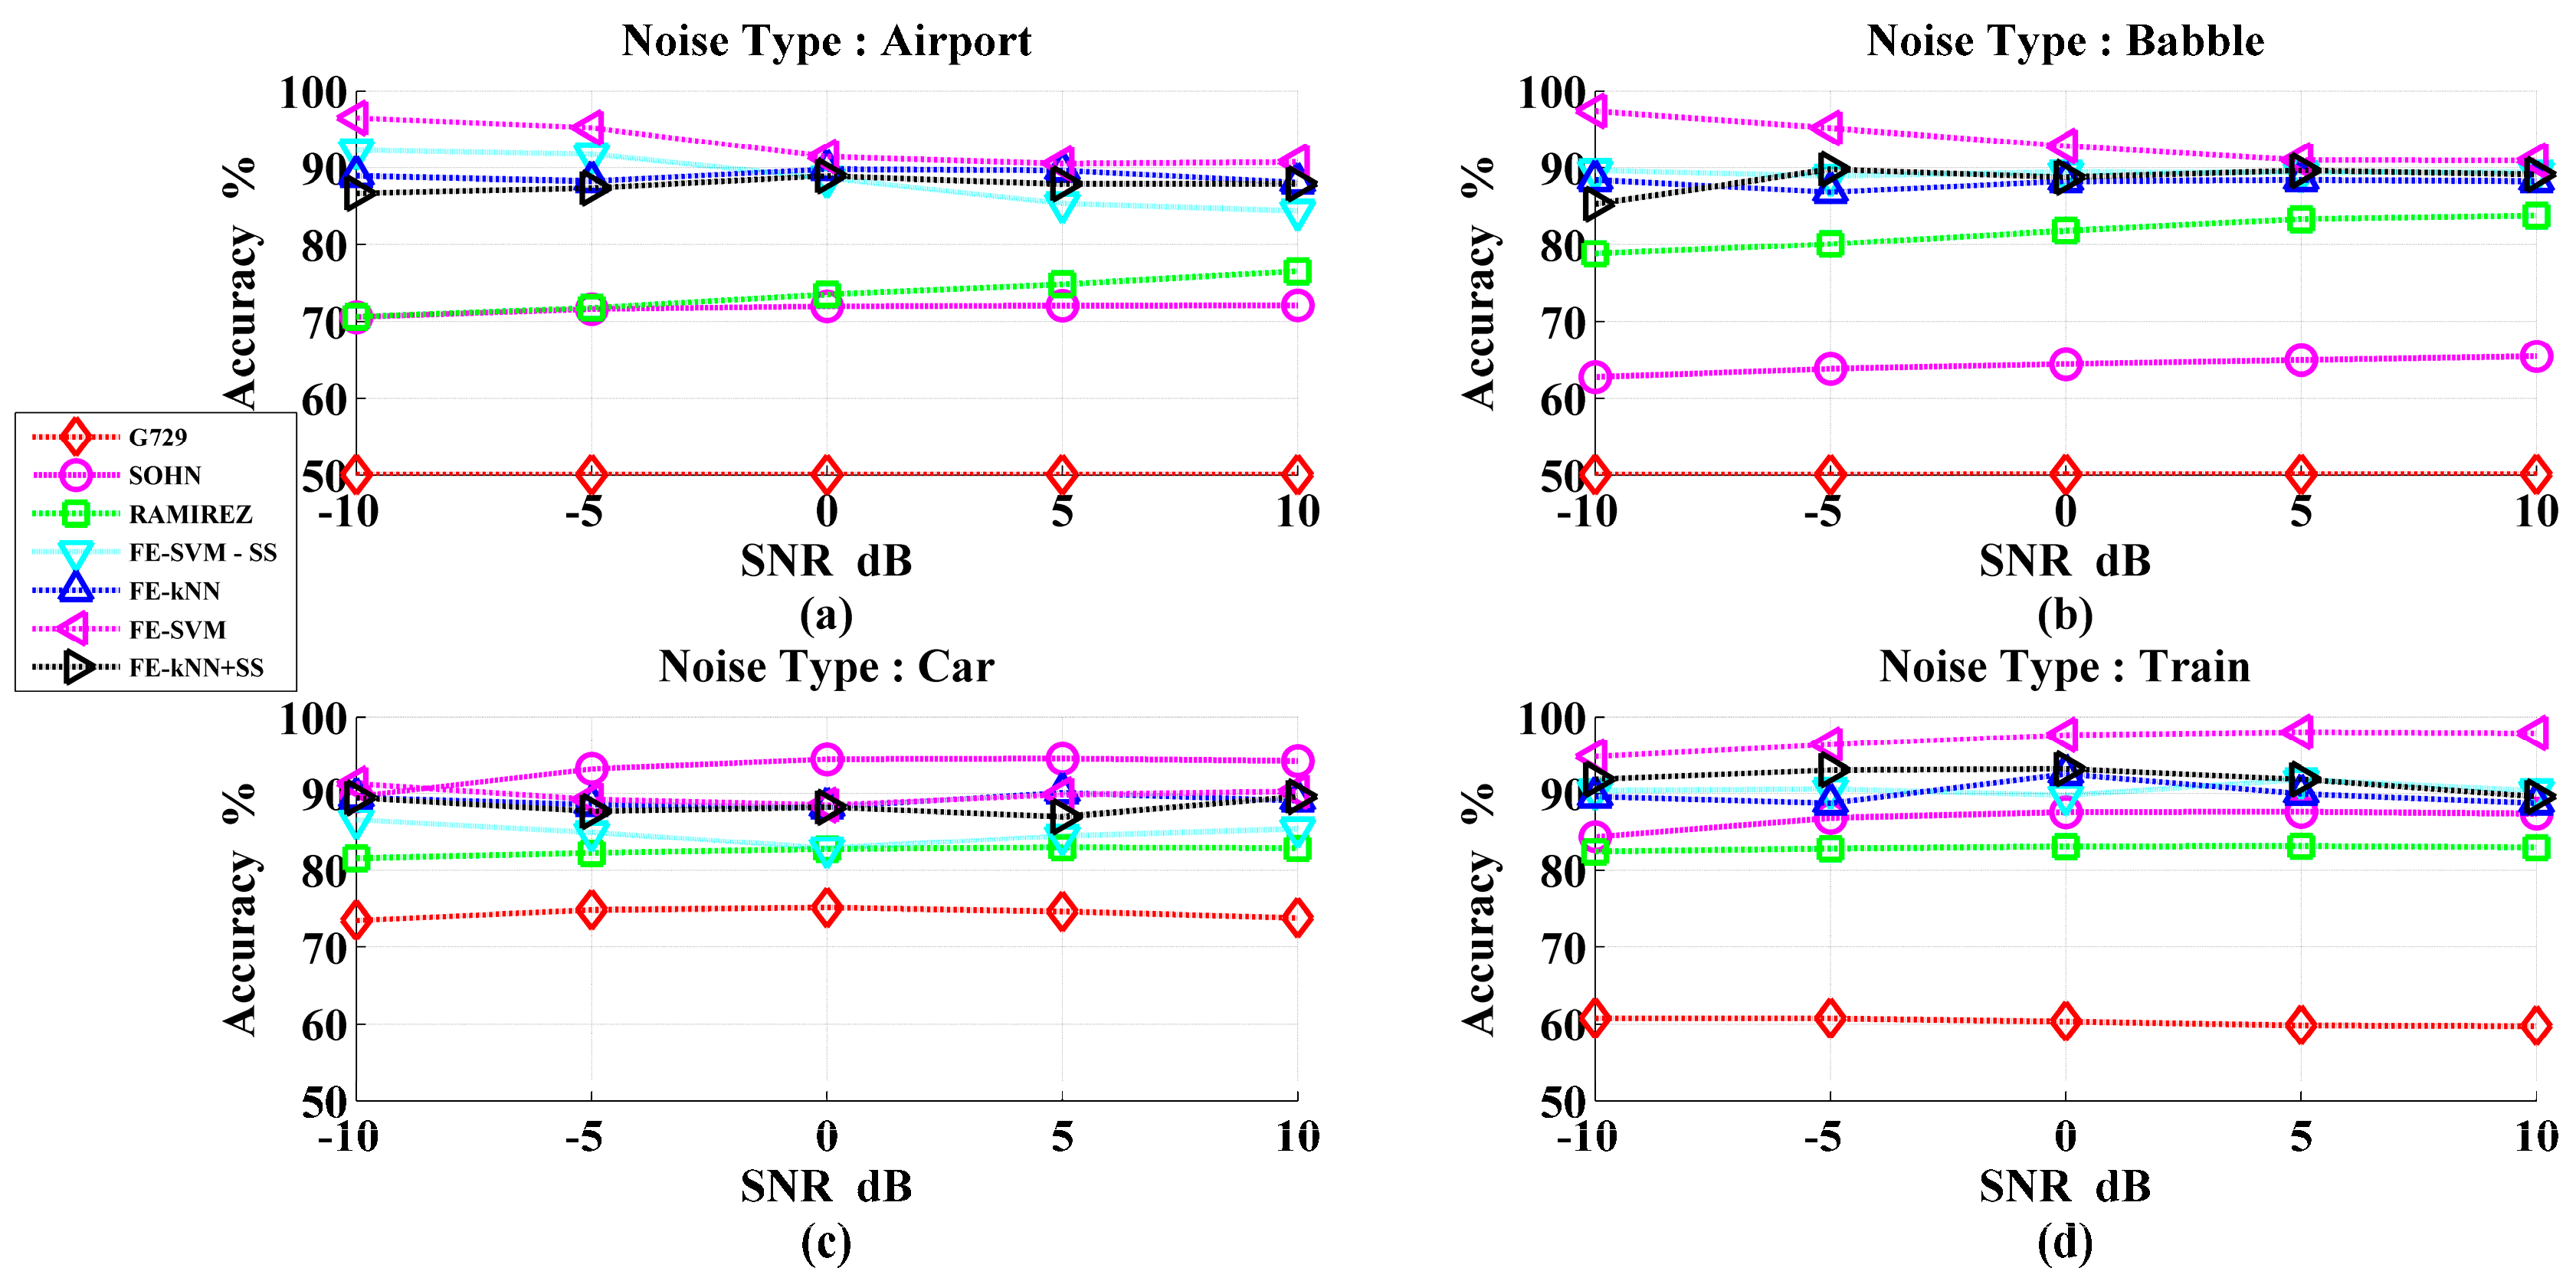
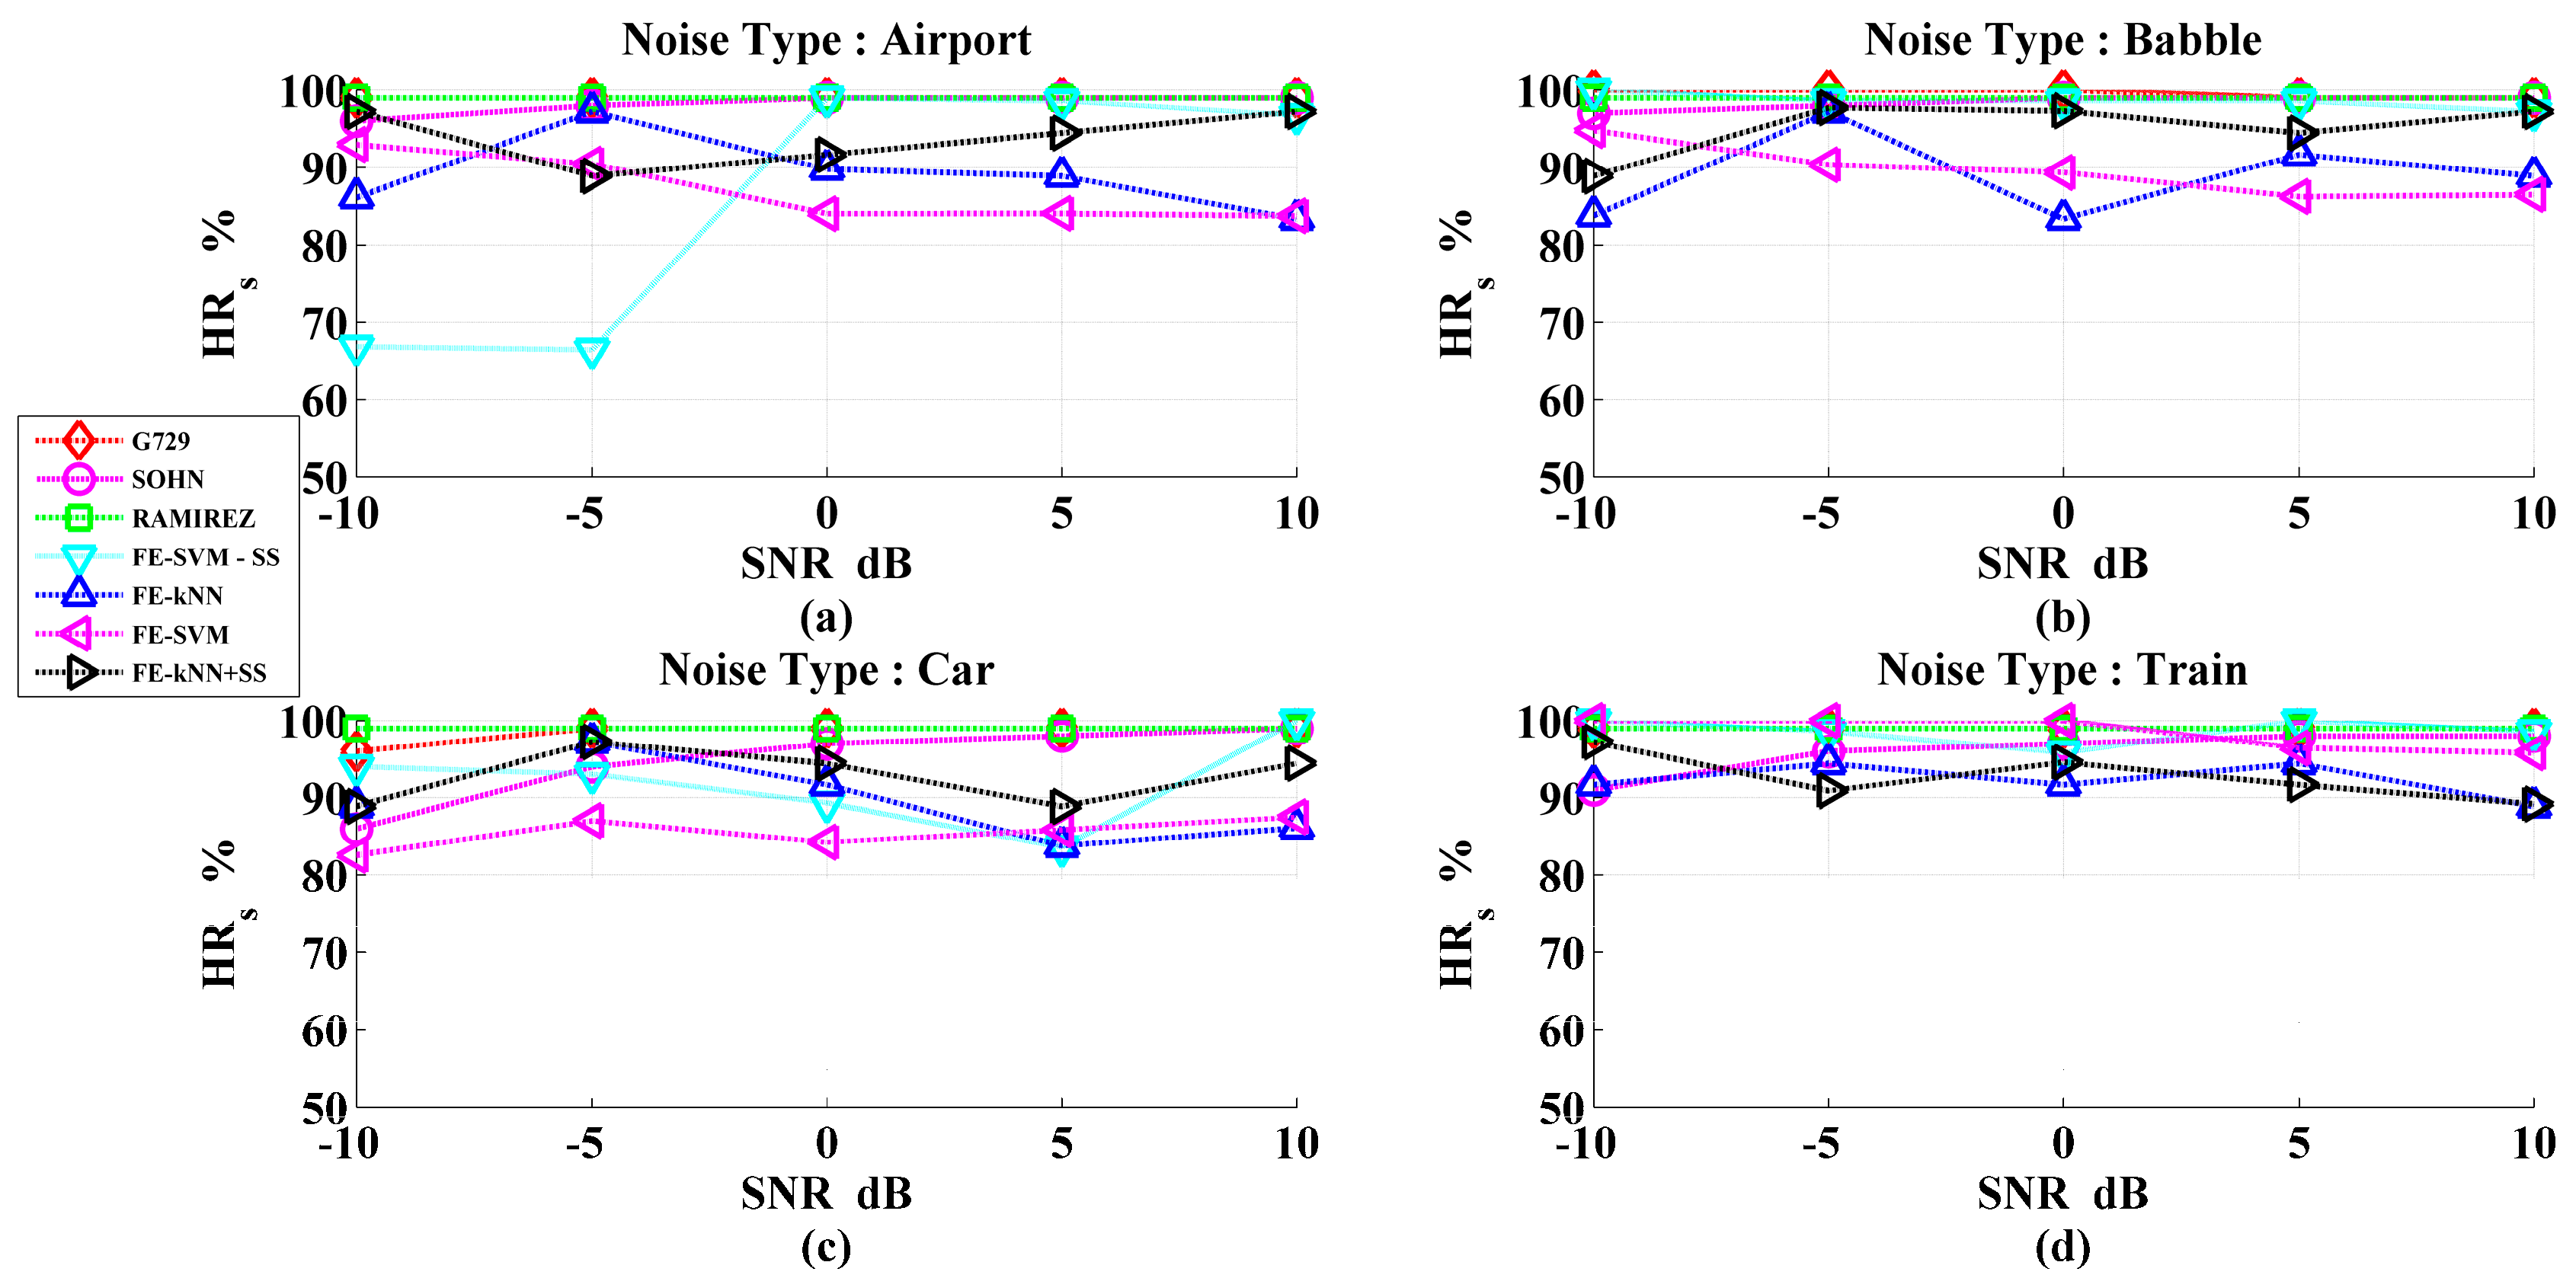
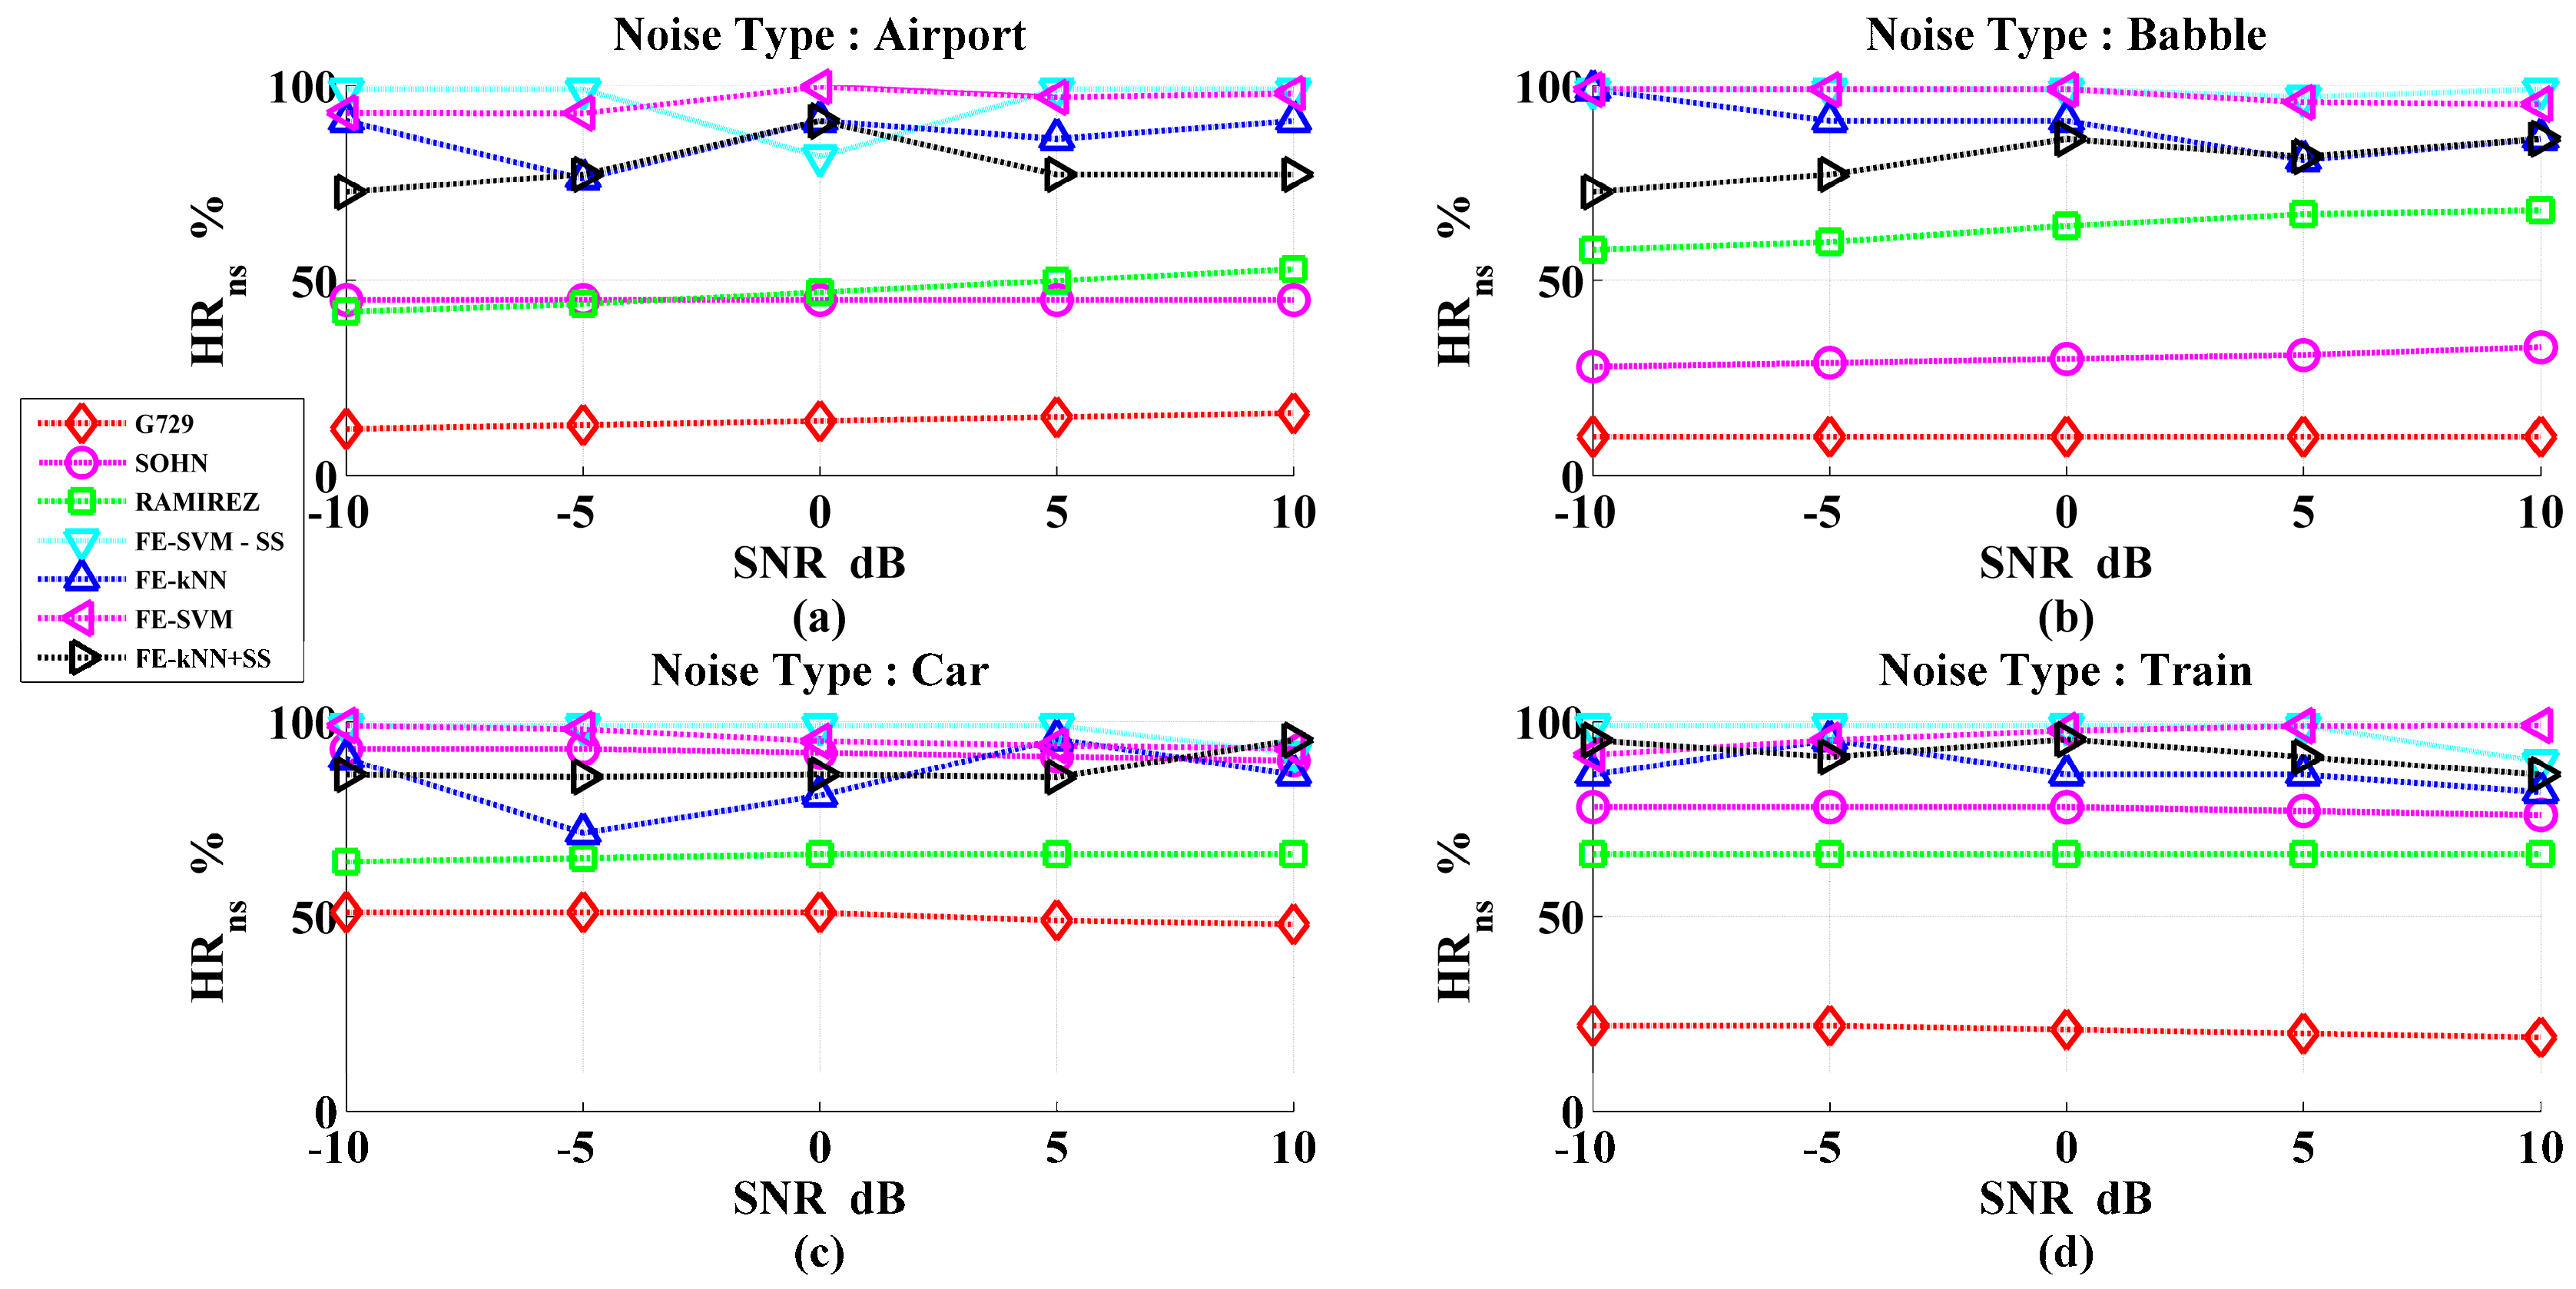
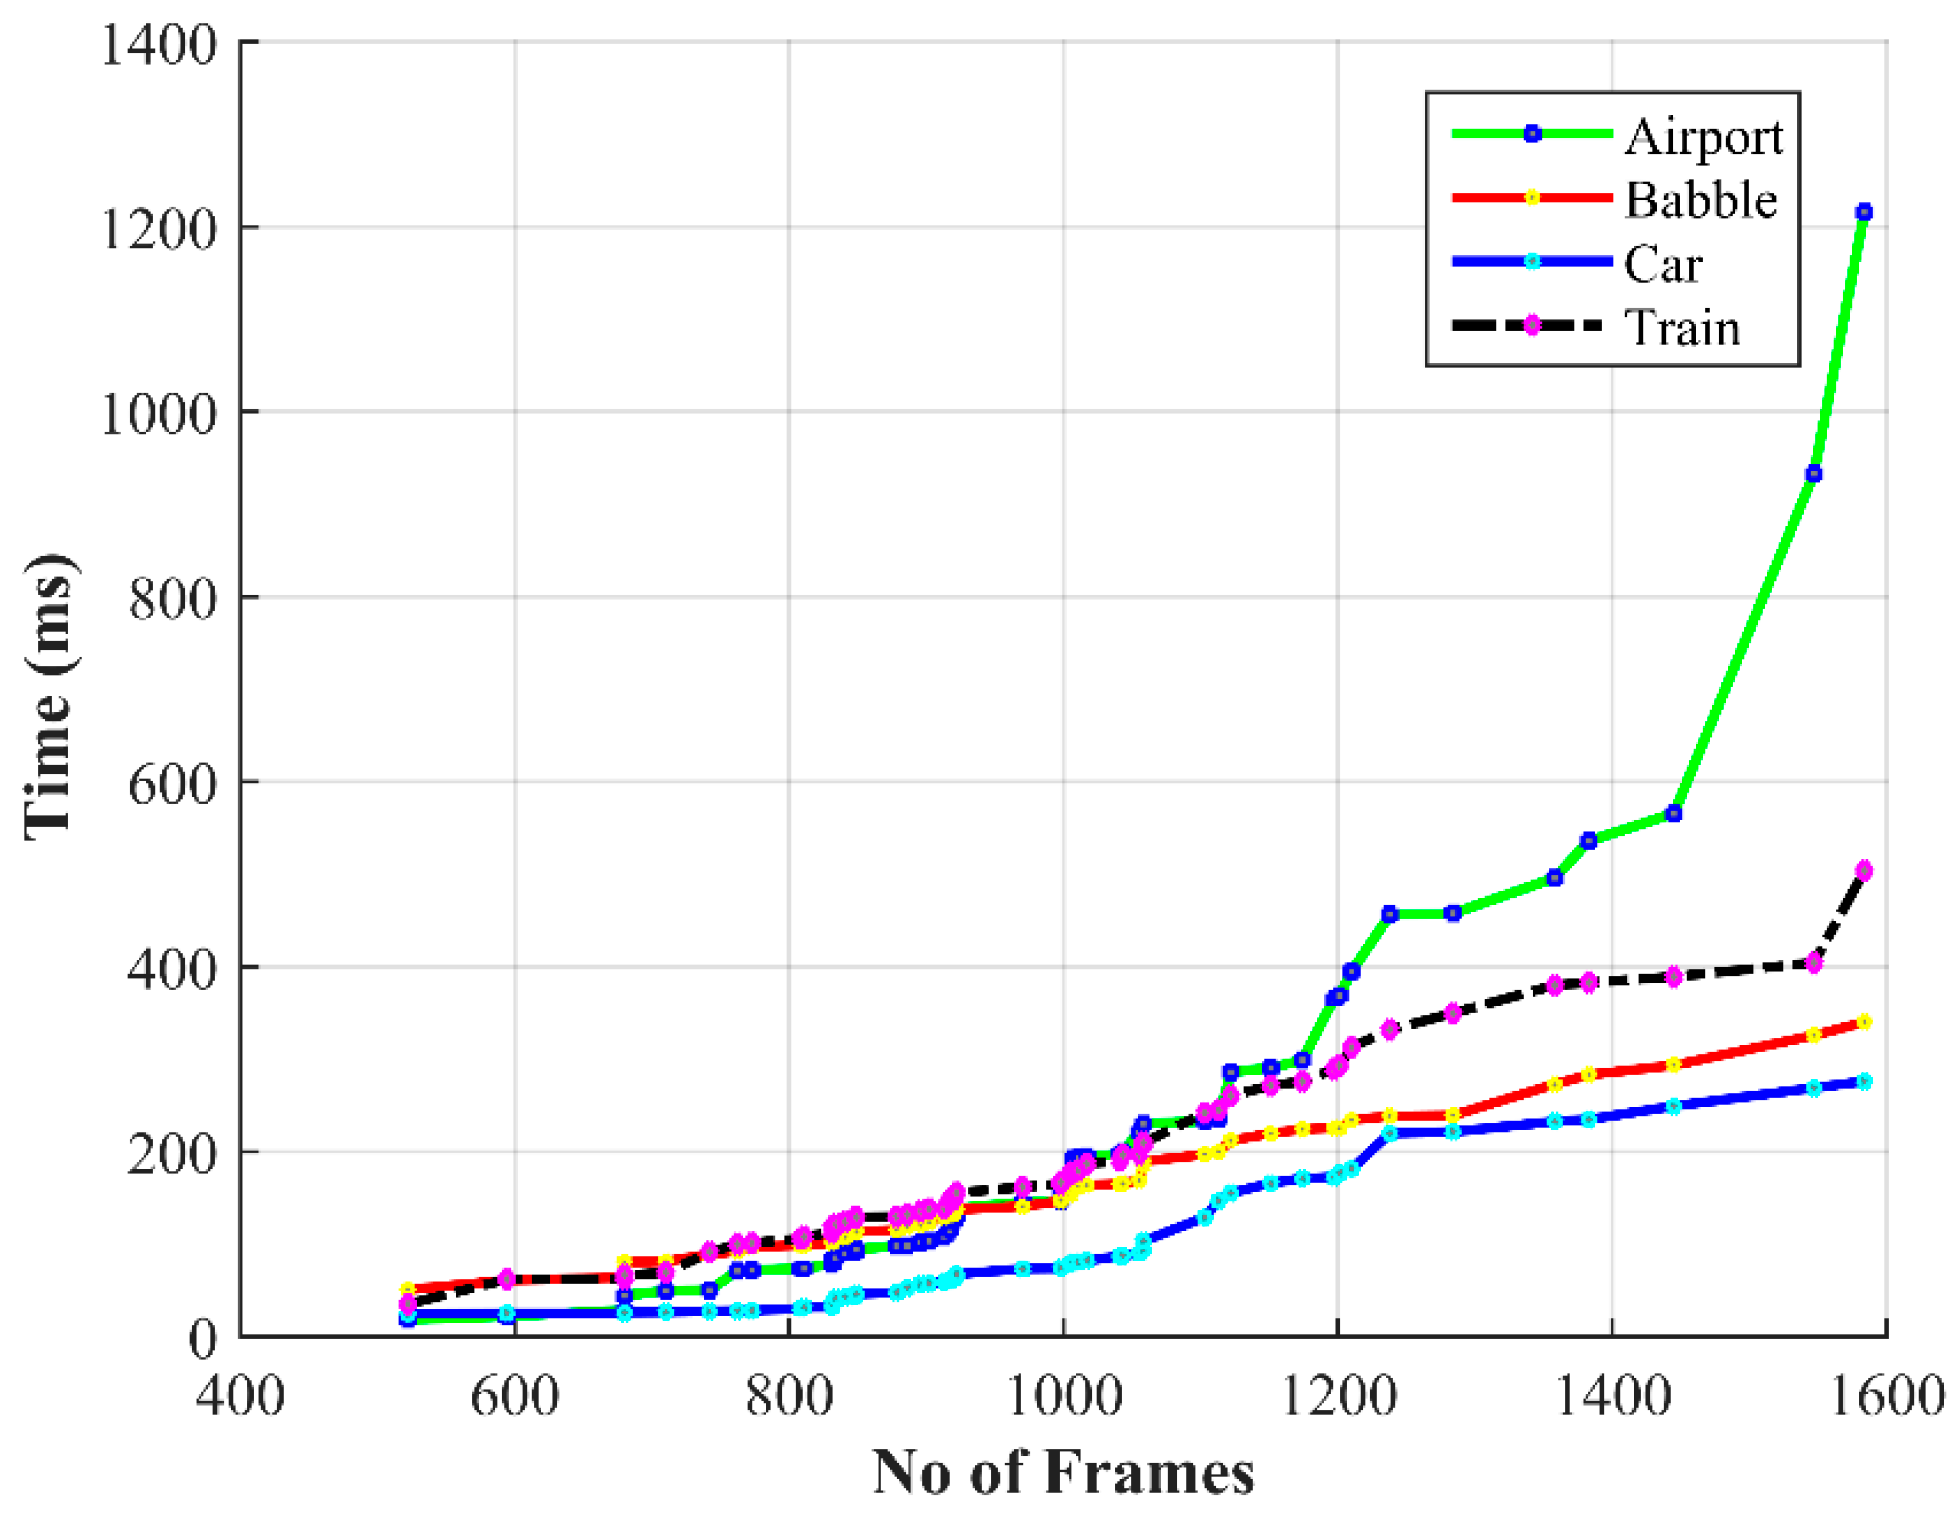
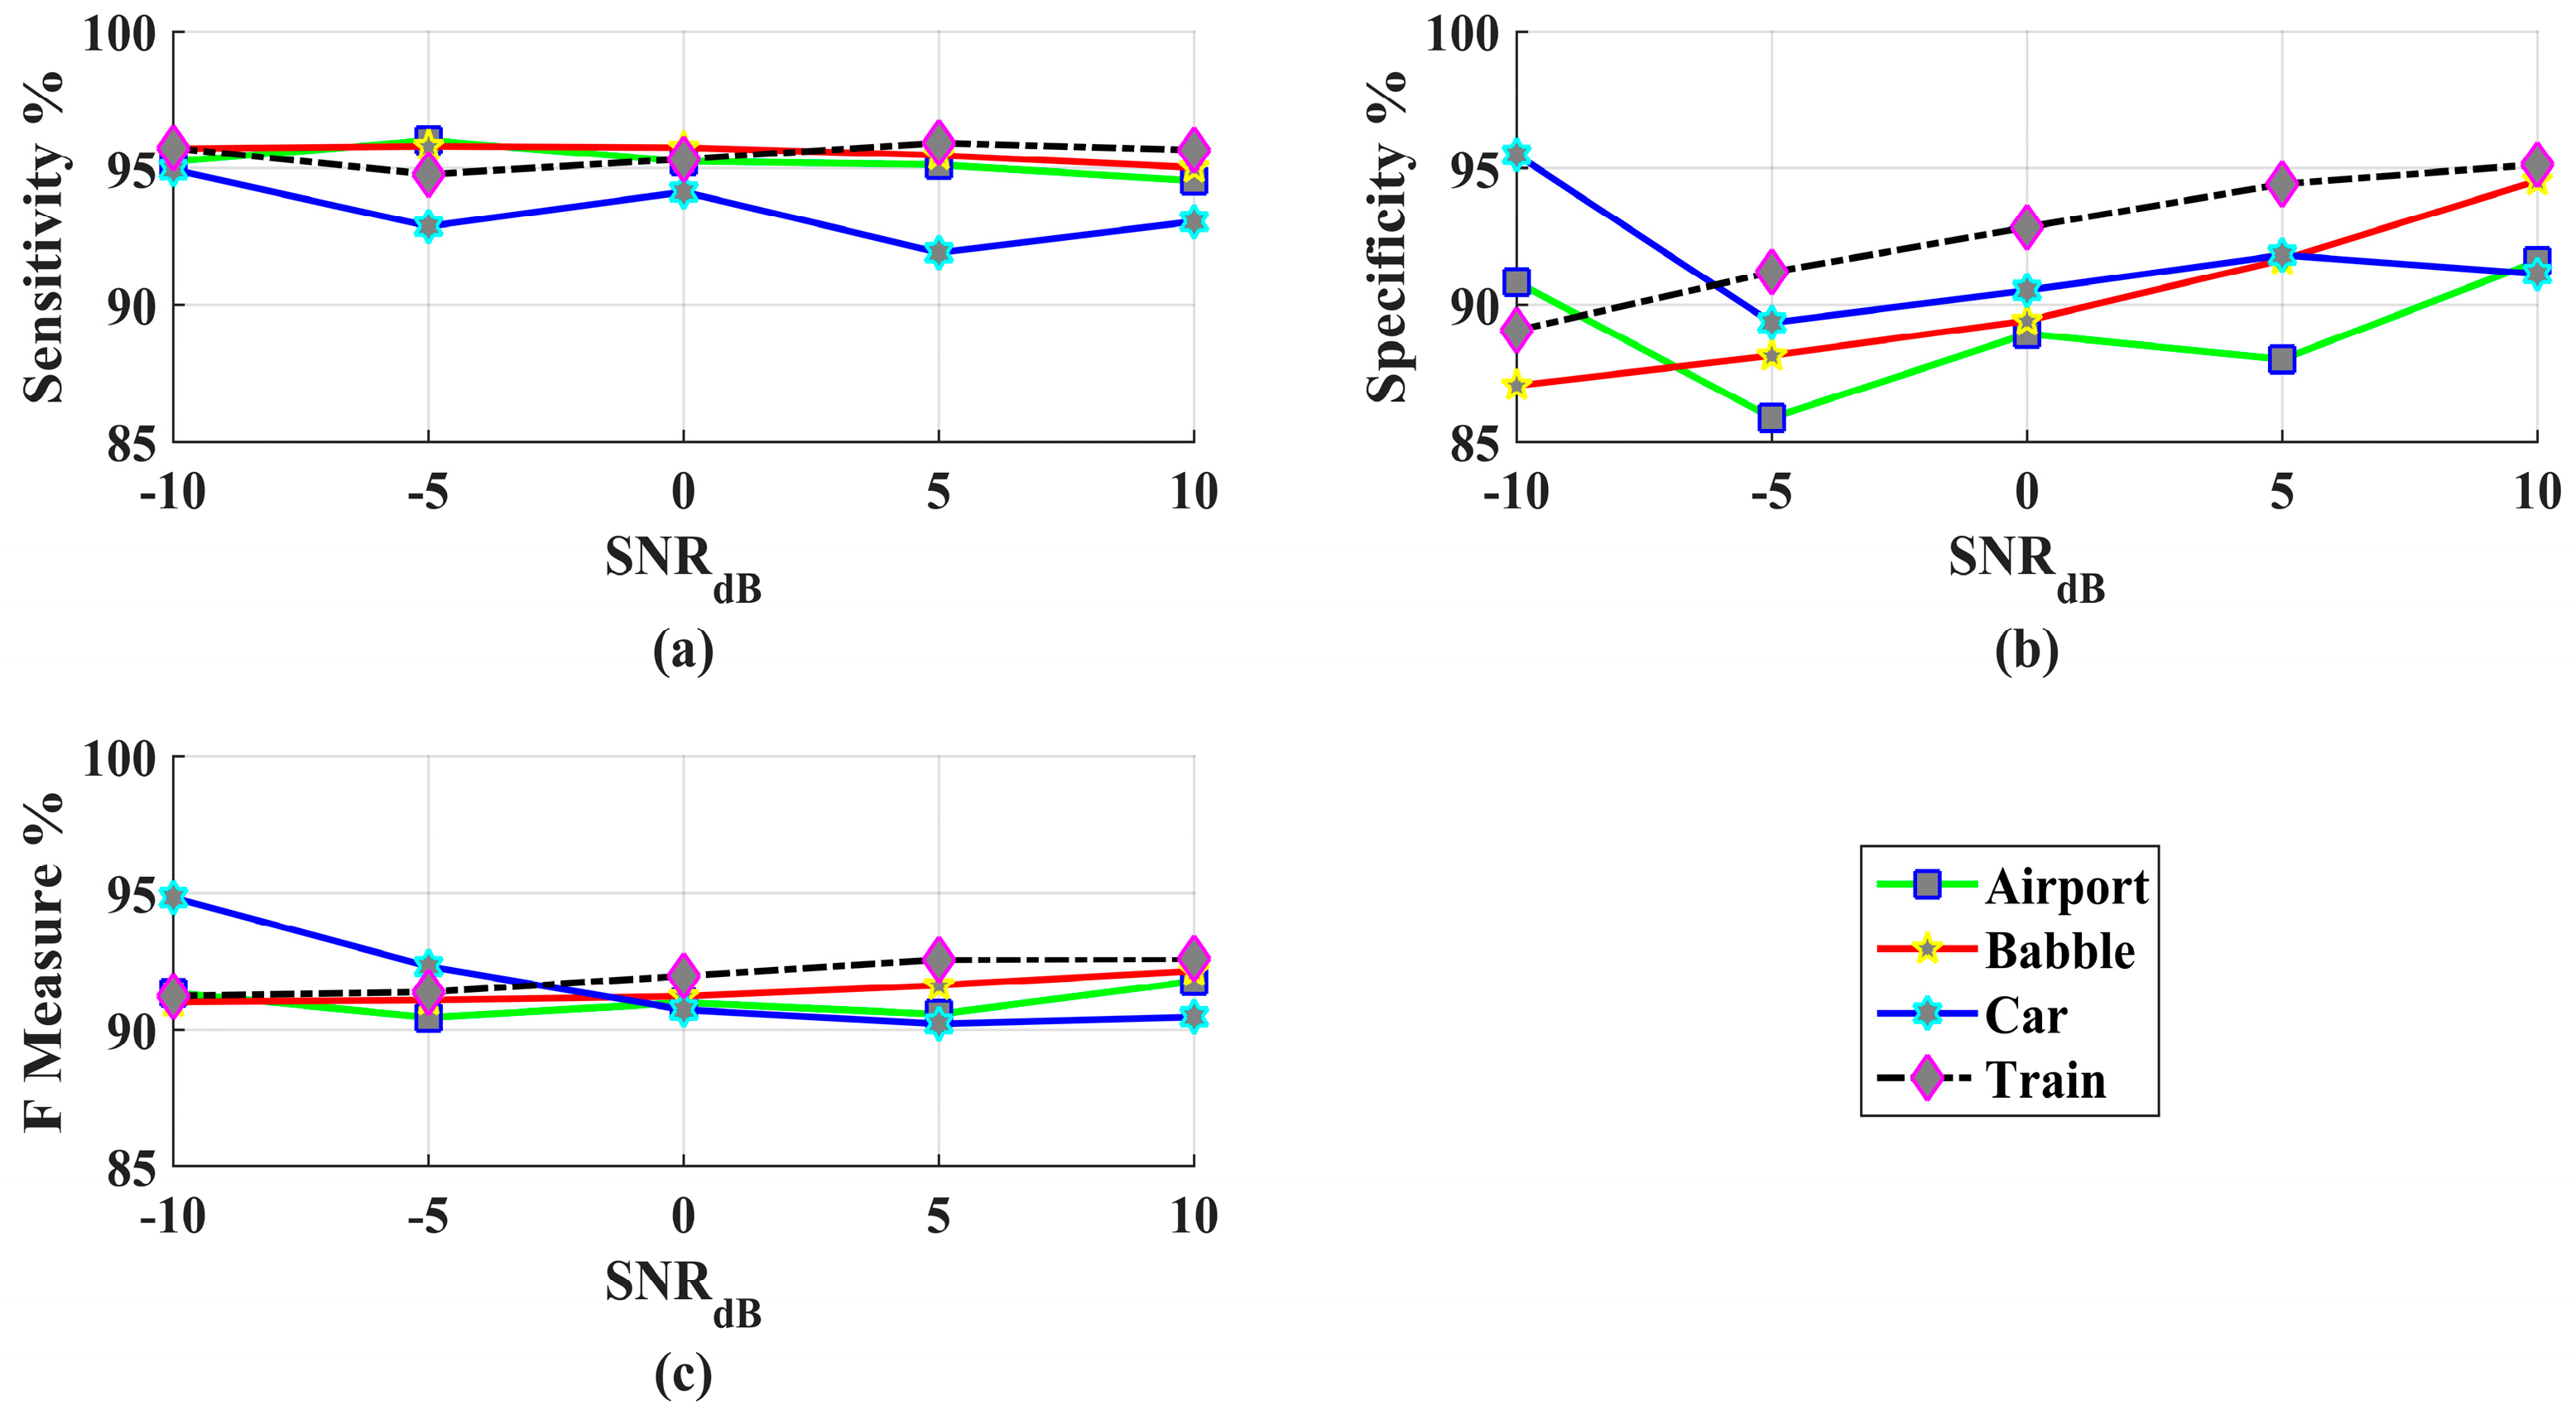
3. Results and Discussions

Speech signals for the proposed methodology were collected from TIMIT database [31] because it provides transcriptions down to word and phoneme levels. Each TIMIT sentence contains almost around 3.5 s, of which 90% is speech. To change the ratio of speech and non-speech regions by 40% to 60% [32] respectively, silence was added to the original speech of the TIMIT corpus. For experimental purposes, speech signals were selected randomly from the TIMIT database, contributing around 910 from training dataset and 320 from test dataset. Nonstationary noises for the experiment were collected from AURORA2 database [33] which was resampled to 16 kHz depending on the need. The speech signals were contaminated by various nonstationary noises of different SNR levels (−10 dB to 10 dB). Four noises—namely airport, babble, car, and train noises—were selected for experimental purposes. Babble noise by name consisted of multiple speakers speaking in the background. Airport and train noises included some speech elements along with their noises. Car noise was the car interior noise with an impulse noise at a particular instance.

Performance Evaluation

Performance evaluation of the VAD algorithm can be performed both subjectively and objectively. In subjective evaluation, a human listener evaluates for VAD errors, whereas, numerical computations are carried out for objective evaluation. However, subjective evaluation alone is insufficient to examine the VAD performance, because listening tests like ABC fail to consider the effects of false alarm [32,34,35]. Hence numerical computations through objective evaluation help in reporting the performance of the proposed VAD algorithm.
VAD performance is calculated using (17) and (18),
HR ns = N S n s ,   n s N S n s , r e f
and
HR s = N S s ,   s N S s , r e f
where, HRns and HRs, non-speech frames and speech frames correctly detected among non-speech and speech frames, respectively. NSns and NSs, refer to the number of non-speech and speech frames in the whole database, respectively, while NSns,ns and NSs,s, refer to the number of frames classified correctly as non-speech and speech frames. The overall accuracy rate is given by (19),
Accuracy = N S n s , n s + N S s , s N S n s ,   r e f + N S s ,   r e f
The best performance is achieved when three parameters referred in the Equations (17)–(19) become maximum.
Performance of the proposed FuzzyEn feature was evaluated by the SVM classifier (proposed) and was compared against k-NN classifier. In this work, 10-fold cross validation was used to ensure the reliability of the classifier. In 10-fold cross validation, the given feature vector was randomly divided into 90:10 split, where 90% of the features are used to train SVM model and 10% features as test data. The mean and standard deviation of the error rates obtained were compared against the two classifiers considered for the proposed FuzzyEn feature which is shown in Table 1. From Table 1, it is inferred that under low SNR levels the proposed FuzzyEn feature outperforms with minimal error rate for the various noisy conditions with the SVM classifier, except for car noise at 5 dB.
All experiments were conducted with MATLAB version 7.11 on a 2.4 GHZ Intel® CoreTM i7 processor running Windows 10 with 8 GB main memory. Figure 4 shows the average computing time for the SVM classifier to classify the speech and non-speech frames under various noises. From the figure it is inferred that as the size of the number of frames increases the computing time increases. Figure 5a–c shows the mean of sensitivity, specificity, and F-measures of various noises such as airport, babble, car, and train noise for FuzzyEn based VAD using spectral subtraction. Similarly, Figure 6a–c shows the standard deviation of the sensitivity, specificity, and F-measures for various noises. For various SNR levels, ranging from −10 dB to 10 dB, the parameters were computed and the graph shows that the detection of speech and non-speech frames are good by the proposed method, especially under low SNR conditions, except for car interior noise which contains a complex audible instance, where the sensitivity decreases when compared with that of the other noises.
The performance of the proposed FuzzyEn-SVM based VAD (will be referred to as FE-SVM based VAD hereafter) was compared against the standard VAD method, ITU G.729 Annex B [16], and with [13,36]. Also the same was compared using k-NN classifier with and without spectral subtraction. The final VAD decisions were made and the performance metrics like accuracy, HRs, and HRns were computed for different noises and at five SNRs (−10, −5, 0, 5, and 10 dB).
In Figure 7, the accuracy of the FE-SVM based VAD is compared against the various VAD algorithms for SNR levels ranging from −10 dB to 10 dB for airport noise, babble noise, car noise, and train noise. From the figure, it clearly states that G.729 suffers poor accuracy for airport noise with ~50% on average at various SNRs, whereas VAD algorithms by [13,36] performs better accuracy for airport noise, gradually varying at different SNR levels averaging ~71% and ~73% respectively. The proposed FE-SVM based VAD outperforms the rest, yielding ~92% average and ~90% without spectral subtraction (SS). Similarly, for the k-NN classifier, the accuracy is ~89% and ~88% with and without SS, respectively. For babble noise, the proposed FE-SVM based VAD has an accuracy of average ~93% and ~89% without SS, whereas [13] produces ~81% and [36] and G.729 manages ~64% and ~50%, respectively.
Similarly, using k-NN classifier, an accuracy of ~88% and ~89% was obtained with and without SS, respectively. For car noise, [36] dominates with an average of ~93% and the proposed FE-SVM based VAD produces ~90% and ~84% without SS, whereas [13] yields around ~82% and G.729 with an accuracy of ~74%. The accuracy from k-NN classifier is ~88% with and without SS. Finally, for train noise, G.729 yields an accuracy of ~60%, [13,36] were around ~82% and ~86% respectively, but the proposed FE-SVM based VAD outperforms with the best accuracy of ~96% and ~97% with and without SS, respectively. Similarly, while using k-NN classifier of ~92% and ~90% with and without using SS, respectively. This shows that the proposed FE-SVM based VAD yields a better accuracy rate for all noises except for the car interior noise. This is due to the effect of SS where the portion of speech was also cancelled along with the complex audible event encountered in the car interior noise.
Figure 8 and Figure 9 show hit rate performance evaluation metrics for five SNRs for different kinds of noises computed for G.729B, [13,36] and proposed FE-SVM based VAD algorithms. Figure 8 provides comparison results for HRs, and Figure 9 provides HRns results for the various VAD algorithms. It is clearly observed that, for the different VAD algorithms considered, G.729B produces a better performance for HRs at different SNR levels for the different noises and suffers worst performance for HRns. For airport noise, the proposed FE-SVM based VAD lags in HRs to [13] (~12%) and [36] (~11%) and for FE-SVM − SS, HRs lags to [13] (~14%) and [36] (~13%). For babble noise, proposed FE-SVM lags to [13] (~10%) and excels by [36] (~9%) and for FE-SVM − SS the HRs performance lags to [13] (~0.4%) and excels [36] (~0.2%). For car noise, the proposed FE-SVM based VAD lags to both [13,36] (~13% and ~9%, respectively). Finally, for train noise, the proposed FE-SVM based VAD offers better HRs against [36] (~2.4%) and suffers a lag against [13] (~0.4%). Most VAD algorithms rely on the use of post processing techniques like hangover schemes [37] which smooths the decisions at the frame level after the initial VAD decisions were made. This scheme reduces the risk of lower energy regions of speech at the ends of speech falsely rejected as noise. The number in the bracket indicates the approximate average hit-rates of speech and non-speech by which the proposed FE-SVM based VAD is better or worse than [13,36]. Similarly, for HRns performance, as shown in Figure 9, the proposed FE-SVM based VAD outperforms all the VADs considered under different SNR levels for various noises. The average HRns of the proposed FE-SVM based VAD is ~96% for airport noise, ~98% for babble noise, ~95% for car noise, and ~96% for train noise. Without this post processing scheme, the proposed FE-SVM based VAD yields ~90% average for HRs and ~95% above for HRns.
In Table 2, the average performance and average standard deviation of various VADs is compared with the proposed FE-SVM based VAD. From Table 2, it is clear that in terms of accuracy, the proposed FE-SVM based VAD is the best among all reference VAD algorithms considered here. The results show that the proposed VAD outperforms the existing VADs under all noisy conditions at different SNR levels, ~13% higher than that of VAD proposed by [13] in accuracy and ~14% higher than [36]. Similarly, for hit rates, the proposed FE-SVM based VAD excels [13,36] by ~36% and ~35%, respectively, for HRns and lags [13,36] by ~9% and ~6% for HRs. Also for clean conditions, accuracy rate of the proposed FE-SVM based VAD is ~15% higher than that of [13] and~2.5% higher than that of [36]. For hit-rates, the proposed FE-SVM based VAD lags to [13,36] for HRs by ~2% and ~1%, respectively, and for HRns, the proposed FE-SVM based VAD leads by ~36% and ~8% to [13,36], respectively.
The performance metrics ensures that the proposed FE-SVM based VAD detects speech and non-speech frames efficiently, especially under low SNR conditions. Also, for babble noises, the proposed FE-SVM based VAD manages ~90% accuracy rate, showing the proposed FuzzyEn feature is better in discriminating speech from background noises. The HRns for all the noises is ~95% and above, therefore this FuzzyEn feature is well-suited for various speech applications, namely, compression and speech coding.

4. Conclusions

In this paper, FuzzyEn feature-based VAD has been presented. The significance of the feature is discussed experimentally under various nonstationary noises at different SNR levels. The efficacy of the feature is compared with two classifiers, namely, SVM and k-NN. The performance of the classifier is analyzed by 10-fold cross validation scheme. The results show that the proposed FE-SVM based VAD outperforms the standard VAD by ~18% and recently developed VADs by ~9% in terms of accuracy rate. Similarly, at lower SNRs—around −5 dB and −10 dB—the proposed method proves its robustness under noisy conditions.

Acknowledgments

The authors gratefully acknowledge the valuable reviews and comments provided by the editors and the reviewers.

Author Contributions

R. Johny Elton was in charge of framing the concept, developing the program codes, conducting the experiments and writing the paper. P. Vasuki and J. Mohanalin were in charge of the supervision of this research, advising the data analysis methods and also helped in revising, reorganizing and proof-reading the paper. All authors have read and approved the final manuscript.

Conflicts of Interest

The authors declare no conflict of interest.

References

  1. Zhang, L.; Gao, Y.-C.; Bian, Z.-Z.; Chen, L. Voice activity detection algorithm improvement in multi-rate speech coding of 3GPP. In Proceedings of the 2005 International Conference on Wireless Communications, Networking and Mobile Computing, (WCNM 2005), Wuhan, China, 23–26 September 2005; pp. 1257–1260.
  2. Karray, L.; Martin, A. Towards improving speech detection robustness for speech recognition in adverse conditions. Speech Commun. 2003, 40, 261–276. [Google Scholar] [CrossRef]
  3. Freeman, D.K.; Southcott, C.B.; Boyd, I.; Cosier, G. A voice activity detector for pan-European digital cellular mobile telephone service. In Proceedings of the IEEE International Conference on Acoustics, Speech, and Signal Processing, Glasgow, Scotland, 23–26 May 1989; pp. 369–372.
  4. Sangwan, A.; Chiranth, M.C.; Jamadagni, H.S.; Sah, R.; Venkatesha Prasad, R.; Gaurav, V. VAD techniques for real-time speech transmission on the Internet. In Proceedings of the 5th IEEE International Conference on High Speed Networks and Multimedia Communications, Jeju Island, Korea, 3–5 July 2002; pp. 46–50.
  5. Itoh, K.; Mizushima, M. Environmental noise reduction based on speech/non-speech identification for hearing aids. In Proceedings of the IEEE International Conference on Acoustics, Speech, and Signal Processing, Munich, Germany, 21–24 April 1997; pp. 419–422.
  6. Boll, S. Suppression of acoustic noise in speech using spectral subtraction. IEEE Trans. Acoust. Speech Signal Process. 1979, 27, 113–120. [Google Scholar] [CrossRef]
  7. Makhoul, J.; Berouti, M. Adaptive noise spectral shaping and entropy coding in predictive coding of speech. IEEE Trans. Acoust. Speech Signal Process. 1979, 27, 63–73. [Google Scholar] [CrossRef]
  8. Hsieh, C.-H.; Feng, T.-Y.; Huang, P.-C. Energy-based VAD with grey magnitude spectral subtraction. Speech Commun. 2009, 51, 810–819. [Google Scholar] [CrossRef]
  9. Kotnik, B.; Kacic, Z.; Horvat, B. A multiconditional robust front-end feature extraction with a noise reduction procedure based on improved spectral subtraction algorithm. In Proceedings of the 7th European Conference on Speech Communication and Technology, Aalborg, Denmark, 3–7 September 2001; pp. 197–200.
  10. Shi, W.; Zou, Y.; Liu, Y. Long-term auto-correlation statistics based on voice activity detection for strong noisy speech. In Proceedings of the 2014 IEEE China Summit & International Conference on Signal and Information Processing, Xi’an, China, 9–13 July 2014; pp. 100–104.
  11. Lee, Y.-C.; Ahn, S.-S. Statistical Model-Based VAD algorithm with wavelet transform. IEICE Trans. Fundam. Electron. Commun. Comput. Sci. 2006, E89-A, 1594–1600. [Google Scholar] [CrossRef]
  12. Haigh, J.A.; Mason, J.S. Robust voice activity detection using cepstral features. In Proceedings of the IEEE Region 10 Conference on Computer, Communication, Control and Power Engineering, Beijing, China, 19–21 October 1993; pp. 321–324.
  13. Ramirez, J.; Segura, J.C.; Benitez, C.; Torre, A.; Rubio, A. Efficient voice activity algorithms using long-term speech information. Speech Commun. 2004, 42, 271–287. [Google Scholar] [CrossRef]
  14. Kristjansson, T.; Deligne, S.; Olsen, P.A. Voicing features for robust speech detection. In Proceedings of the Ninth European Conference on Speech Communication and Technology, Lisbon, Portugal, 4–8 September 2005; pp. 369–372.
  15. Ishizuka, K.; Nakatani, T.; Fujimoto, M.; Miyazaki, N. Noise robust voice activity detection based on periodic to aperiodic component ratio. Speech Commun. 2010, 52, 41–60. [Google Scholar] [CrossRef]
  16. G.729: A Silence Compression Scheme for G.729 Optimized for Terminals Conforming to Recommendation V.70. Available online: https://www.itu.int/rec/T-REC-G.729-199610-S!AnnB/en (accessed on 10 August 2016).
  17. Nemer, E.; Goubron, R.; Mahmoud, S. Robust voice activity detection using higher-order statistics in the LPC residual domain. IEEE Trans. Speech Audio Process. 2001, 9, 217–231. [Google Scholar] [CrossRef]
  18. Harmsen, M.; Fisher, B.; Schramm, H.; Seidl, T.; Deserno, T.M. Support Vector Machine Classification Based on Correlation Prototypes Applied to Bone Age Assessment. IEEE J. Biomed. Health Inform. 2012, 17, 190–197. [Google Scholar] [CrossRef] [PubMed]
  19. Lan, M.; Tan, C.; Su, J.; Lu, Y. Supervised and traditional term weighting methods for automatic text categorization. IEEE Trans. Pattern Anal. Mach. Intell. 2009, 31, 721–735. [Google Scholar] [CrossRef] [PubMed]
  20. Mohanty, S.; Bebartta, H.N.D. Performance Comparison of SVM and k-NN for Oriya Character Recognition. Int. J. Adv. Comput. Sci. Appl. 2011, 1, 112–116. [Google Scholar] [CrossRef]
  21. Vapnik, V.N. Statistical Learning Theory; Wiley: New York, NY, USA, 1998. [Google Scholar]
  22. Chen, W.; Wang, Z.; Xie, H.; Yu, W. Characterization of Surface EMG signal based on Fuzzy Entropy. IEEE Trans. Neural Syst. Rehabil. Eng. 2007, 15, 266–272. [Google Scholar] [CrossRef] [PubMed]
  23. Richman, J.S.; Randall Moorman, J. Physiological time-series analysis using approximate entropy and sample entropy. Am. J. Physiol. Heart Circ. Physiol. 2000, 278, H2039–H2049. [Google Scholar] [PubMed]
  24. Chen, W.; Zhuang, J.; Yu, W.; Wang, Z. Measuring complexity using FuzzyEn, ApEn and SampEn. Med. Eng. Phys. 2009, 31, 61–68. [Google Scholar] [CrossRef] [PubMed]
  25. Holzinger, A.; Hörtenhuber, M.; Mayer, C.; Bachler, M.; Wassertheurer, S.; Pinho, A.; Koslicki, D. On Entropy-Based Data Mining. In Interactive Knowledge Discovery and Data Mining in Biomedical Informatics; Springer: Berlin/Heidelberg, Germany, 2014; pp. 209–226. [Google Scholar]
  26. Mayer, C.; Bachler, M.; Hortenhuber, M.; Stocker, C.; Holzinger, A.; Wassertheurer, S. Selection of entropy-measure parameters for knowledge discovery in heart rate variability data. BMC Bioinform. 2014, 15, S2. [Google Scholar] [CrossRef] [PubMed]
  27. Mayer, C.; Bachler, M.; Holzinger, A.; Stein, P.K.; Wassertheurer, S. The Effect of Threshold Values and Weighting Factors on the Association between Entropy Measures and Mortality after Myocardial Infarction in the Cardiac Arrhythmia Suppression Trial (CAST). Entropy 2016, 18, 129. [Google Scholar] [CrossRef]
  28. Hariharan, M.; Fook, C.Y.; Sindhu, R.; Adom, A.H.; Yaacob, S. Objective evaluation of speech dysfluencies using wavelet packet transform with sample entropy. Digit. Signal Process. 2013, 23, 952–959. [Google Scholar] [CrossRef]
  29. Muhammad, N.M.; Yaacob, S.; Nagarajan, R.; Hariharan, M. Comapatients expression analysis under different lighting using k-NN and LDA. Int. J. Signal Process. Image Process. 2010, 1, 249–254. [Google Scholar]
  30. Duda, R.O.; Hart, P.E.; Stork, D.G. Pattern Classification, 2nd ed.; Wiley: New York, NY, USA, 2001. [Google Scholar]
  31. Garofolo, J.S.; Lamel, L.F.; Fisher, W.M.; Fiscus, J.G.; Pallett, D.S.; Dahlgren, N.L. TIMIT Acoustic-Phonetic Continuous Speech Corpus Linguistic Data Consortium. Available online: https://catalog.ldc.upenn.edu/LDC93S1 (accessed on 9 August 2016).
  32. Beritelli, F.; Casale, S.; Ruggeri, G.; Serano, S. Performance Evaluation and Comparison of G.729/AMR/ Fuzzy Voice Activity Detectors. IEEE Signal Process. Let. 2002, 9, 85–88. [Google Scholar] [CrossRef]
  33. Hirsch, H.-G.; Pearce, D. The AURORA experimental framework for the performance evaluations of speech recognition systems under noisy conditions. In Proceedings of the ISCA ITRW ASR2000, Paris, France, 18–20 September 2000; pp. 18–20.
  34. Ma, Y.; Nishihara, A. Efficient voice activity detection algorithm using long-term spectral flatness measure. EURASIP J. Audio Speech Music Process. 2013, 2013. [Google Scholar] [CrossRef]
  35. Ghosh, P.K.; Tsiartas, A.; Narayanan, S. Robust Voice Activity Detection Using Long-Term Signal Variability. IEEE Trans. Audio Speech Lang. Process. 2011, 19, 600–613. [Google Scholar] [CrossRef]
  36. Sohn, J.; Kim, N.S. A statistical model-based voice activity detection. IEEE Signal Process. Lett. 1999, 6. [Google Scholar] [CrossRef]
  37. Davis, A.; Nordholm, S.; Togneri, R. Statistical Voice Activity Detection Using Low-Variance Spectrum Estimation and an Adaptive Threshold. IEEE Trans. Audio Speech Lang. Process. 2006, 14, 412–424. [Google Scholar] [CrossRef]
Figure 1. Block diagram for the proposed fuzzy entropy and support vector machine based voice activity detection (VAD).
Entropy 18 00298 g001
Figure 2. Speech signals (ac) with its additive noise [0, 5 dB] with amplitude along vertical axis and time (s) along horizontal axis; its corresponding histograms (df), with amplitude along horizontal axis and frequency along the vertical axis.
Entropy 18 00298 g002
Figure 3. Exponential function (exp(−dn/r)) for different parameter selection. (a) Exponential membership function fixed with n = 2, and r varied from 0.1 to 0.3; (b) exponential membership function fixed with r = 0.2 and n varied from 1 to 5.
Entropy 18 00298 g003
Figure 4. Average computing time of the SVM classifier for the various noises such as airport, babble, car, and train.
Entropy 18 00298 g004
Figure 5. Average of (a) sensitivity (b) specificity and (c) F-Measure for the proposed FuzyyEn based VAD for the various noises such as airport, babble, car, and train.
Entropy 18 00298 g005
Figure 6. Standard deviation of (a) sensitivity (b) specificity and (c) F-Measure for the proposed FuzzyEn based VAD for the various noises such as airport, babble, car, and train.
Entropy 18 00298 g006
Figure 7. Accuracy comparisons for G.729, Sohn [36], Ramirez [13], and proposed FE-SVM based VAD for SNR values from −10 dB to 10 dB (a) airport (b) babble (c) car and (d) train.
Entropy 18 00298 g007
Figure 8. HRs comparisons for three VAD methods with our proposed method for five different SNR levels {−10 dB, −5 dB, 0 dB, 5 dB, 10 dB} (a) Airport noise—HRs (b) Babble noise—HRs (c) Car noise—HRs (d) Train noise—HRs.
Entropy 18 00298 g008
Figure 9. HRns comparisons for three VAD methods with our proposed method for five different SNR levels {−10 dB, −5 dB, 0 dB, 5 dB, 10 dB} (a) Airport noise—HRns (b) Babble noise—HRns (c) Car noise—HRns (d) Train noise—HRns.
Entropy 18 00298 g009
Table 1. Error rate of the VAD by support vector machine (SVM), k-nearest neighbor (k-NN) in % for the corrupted speech signal under various noise types for different signal-to-noise ratio (SNR) levels.
Noise TypeSNR Levels
−10−50510
SVM, k-NNSVM, k-NNSVM, k-NNSVM, k-NNSVM, k-NN
Airport3.52 ± 0.53,
11.07 ± 1.13
4.79 ± 0.96,
11.7 ± 1.86
8.56 ± 1.84,
10.21 ± 2.09
9.5 ± 1.93,
10.38 ± 2.13
9.26 ± 1.89,
11.94 ± 2.23
Babble2.61 ± 0.37,
11.59 ± 2.17
4.82 ± 0.98,
13.15 ± 1.76
7.16 ± 1.47,
11.76 ± 1.74
9.02 ± 1.88,
11.59 ± 1.53
9.07 ± 1.9,
11.76 ± 1.56
Car8.72 ± 0.94,
10.55 ± 1.16
10.74 ± 0.98,
11.42 ± 1.01
11.49 ± 1.13,
11.76 ± 1.25
10.14 ± 1.71,
9.86 ± 1.32
9.7 ± 1.62,
10.9 ± 1.8
Train5.17± 0.47,
10.38 ± 1.25
3.61 ± 0.15,
11.25 ± 2.01
2.34 ± 0.11,
7.44 ± 1.51
1.97 ± 0.15,
10.03 ± 1.92
2.1 ± 0.09,
11.25 ± 1.97
Table 2. Average performance of different algorithms for various noisy conditions at five SNR levels and at clean conditions and overall combined performance accuracy, HRs and HRns.
VADSOHNRAMIREZG.729BFE-SVMFE-k-NNFE-SVM − SSFE-k-NN + SS
NOISY CONDITIONS
Accuracy78.99 ± 2.680.09 ± 2.858.69 ± 1.393.29 ± 2.188.99 ± 3.188.34 ± 2.389.15 ± 2.8
HRs96.85 ± 2.199 ± 0.999.25 ± 0.490.09 ± 2.589.91 ± 3.383.74 ± 4.893.62 ± 1.6
HRns61.1 ± 4.560.5 ± 5.517.78 ± 2.496.73 ± 0.987.49 ± 1.998.02 ± 0.785.37 ± 2.5
CLEAN CONDITION
Accuracy95.75 ± 1.983.74 ± 2.194.98 ± 1.998.28 ± 0.693.67 ± 2.190.74 ± 2.891.81 ± 2.9
HRs99.78 ± 0.2100 ± 0100 ± 097.84 ± 1.995.78 ± 2.685.4 ± 5.694.40 ± 1.4
HRns91.7 ± 3.867.49   ±   4.1 89.97 ± 3.9100 ± 096.34 ± 2.3100 ± 088.81 ± 3.4
OVER ALL PERFORMANCE
Accuracy87.37 ± 2.381.92 ± 2.576.84 ± 1.695.76 ± 1.491.33 ± 2.689.54 ± 2.690.48 ± 2.9
HRs98.32 ± 1.299.5 ± 0.599.63 ± 0.293.97 ± 2.292.85 ± 384.57 ± 5.294.01 ± 1.5
HRns76.4 ± 4.263.99 ± 4.853.88 ± 3.298.37 ± 0.591.92 ± 2.599.01 ± 0.487.09 ± 3

