
Thermodynamic Analysis of Resources Used in Thermal Spray Processes: Energy and Exergy Methods


Abstract
:
1. Introduction
- process effectiveness efficiency and exergy destruction analysis to measure process performance in energy conversion and deviation from optimal condition;
- resources used analysis to identify and allocate the intensity consumption of resources (energy or material).
2. Analysis Methodologies
2.1. Energy Balance
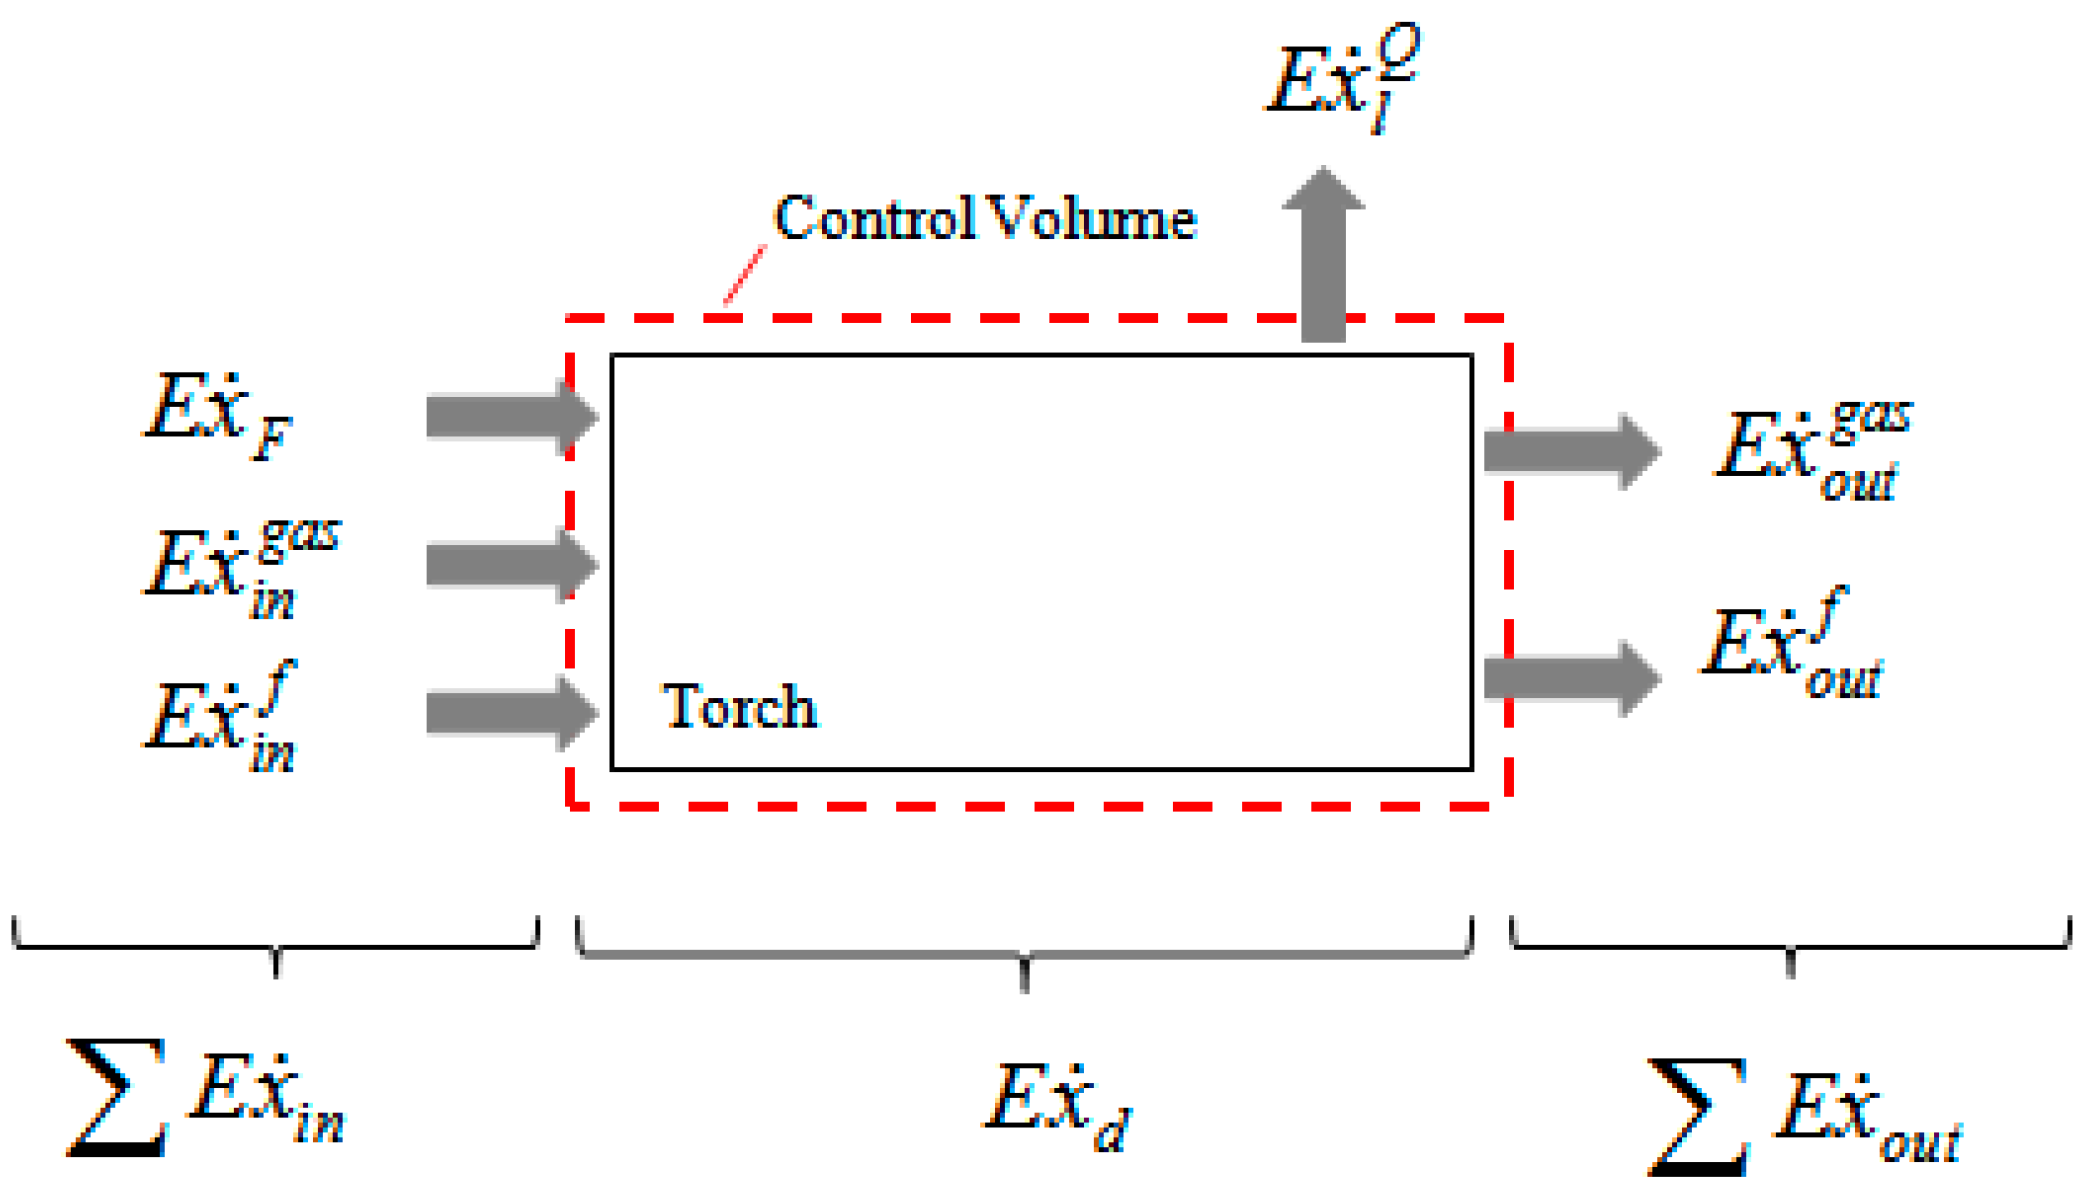
2.2. Exergy Balance
3. Results and Discussion
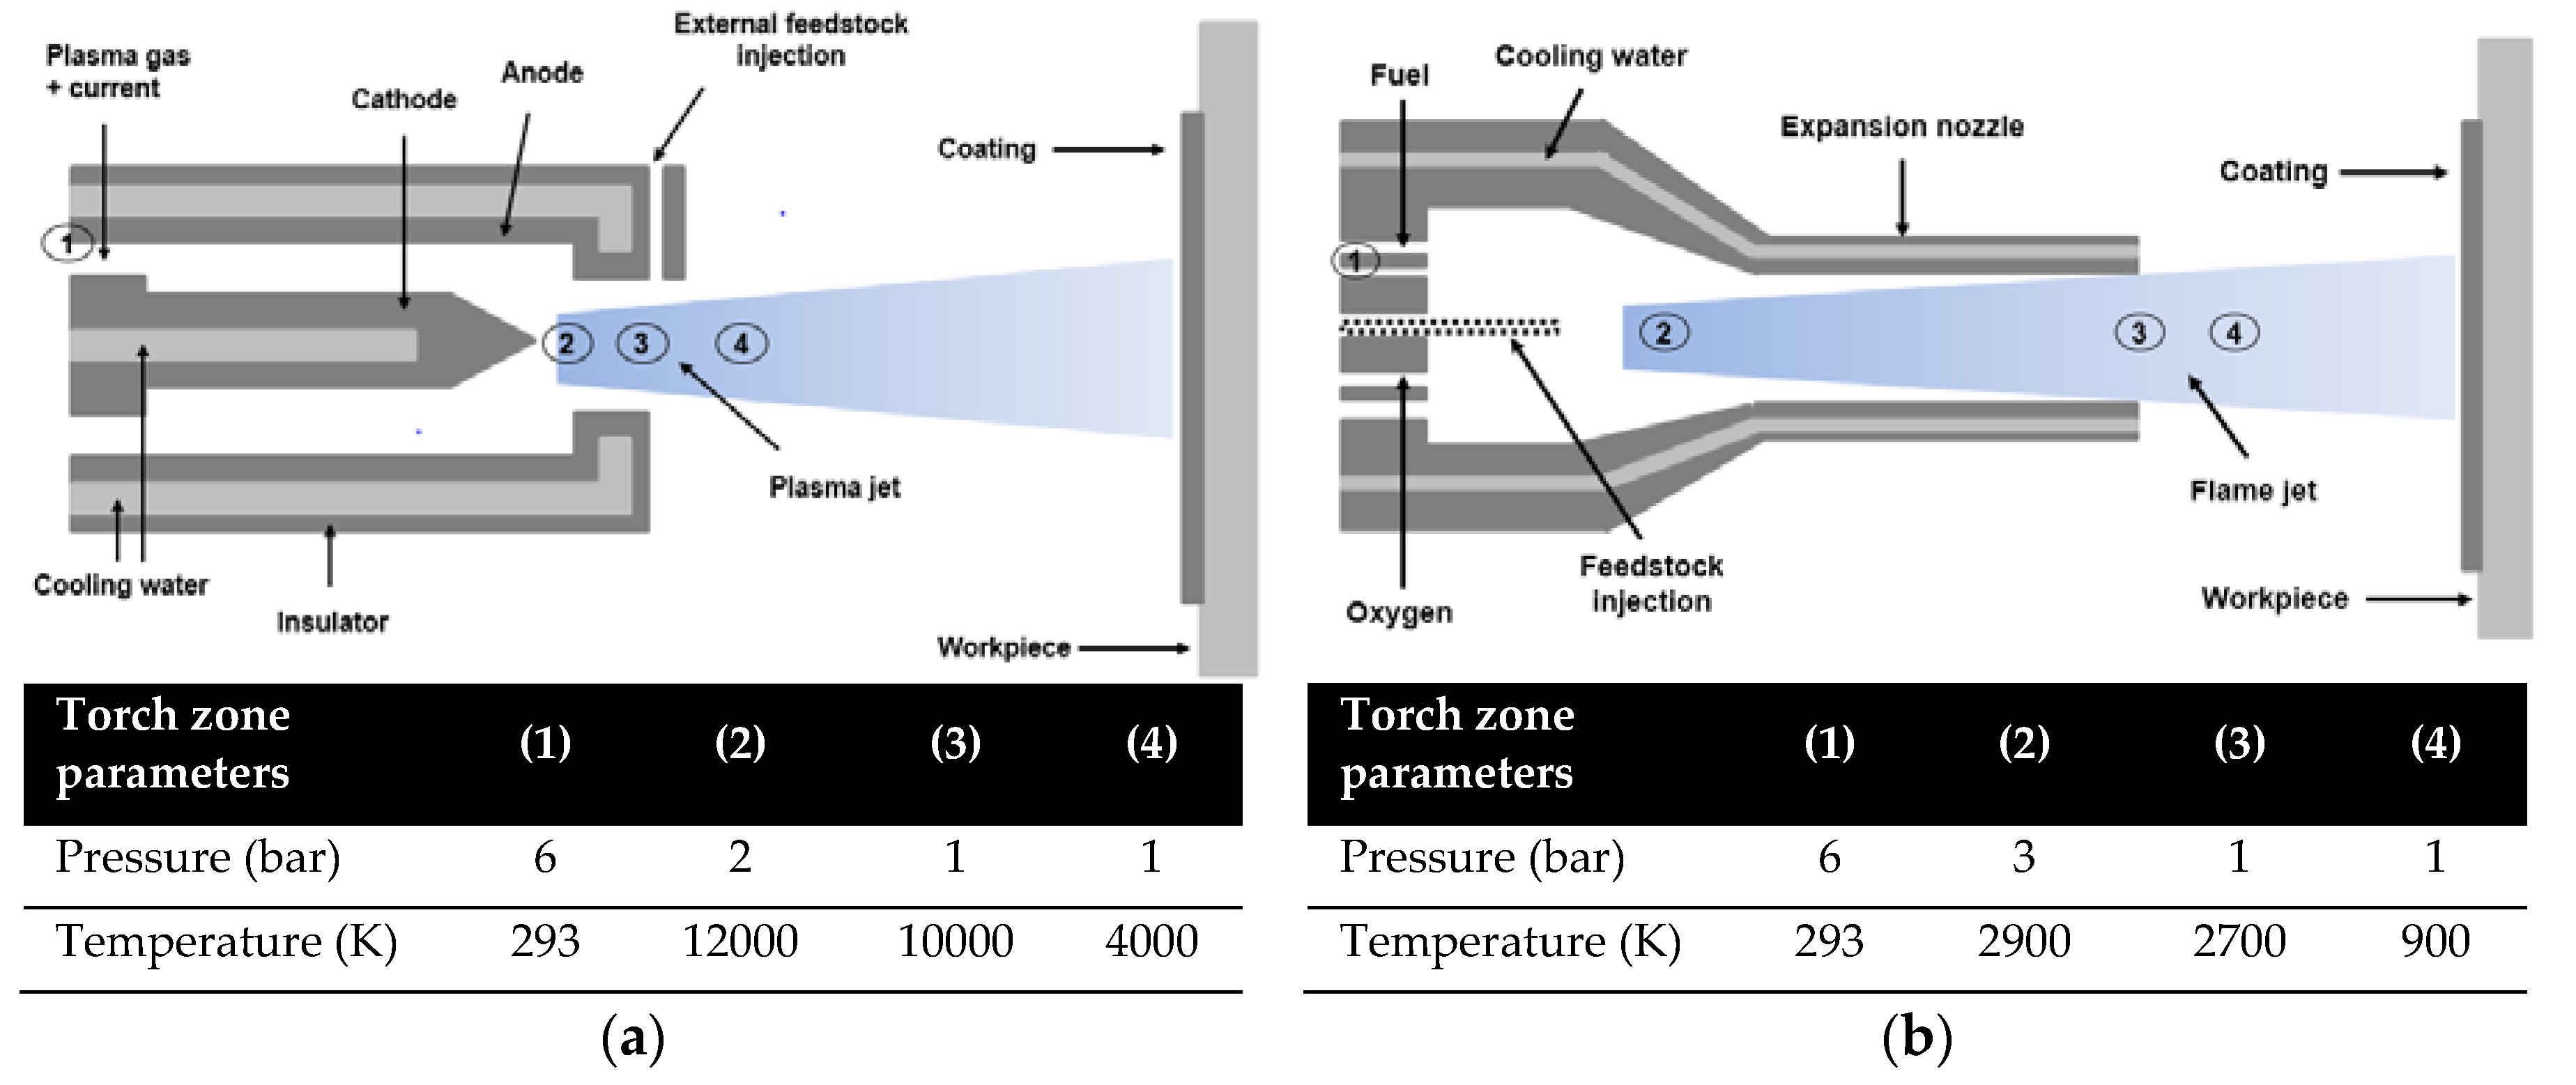
3.1. Experimental Data
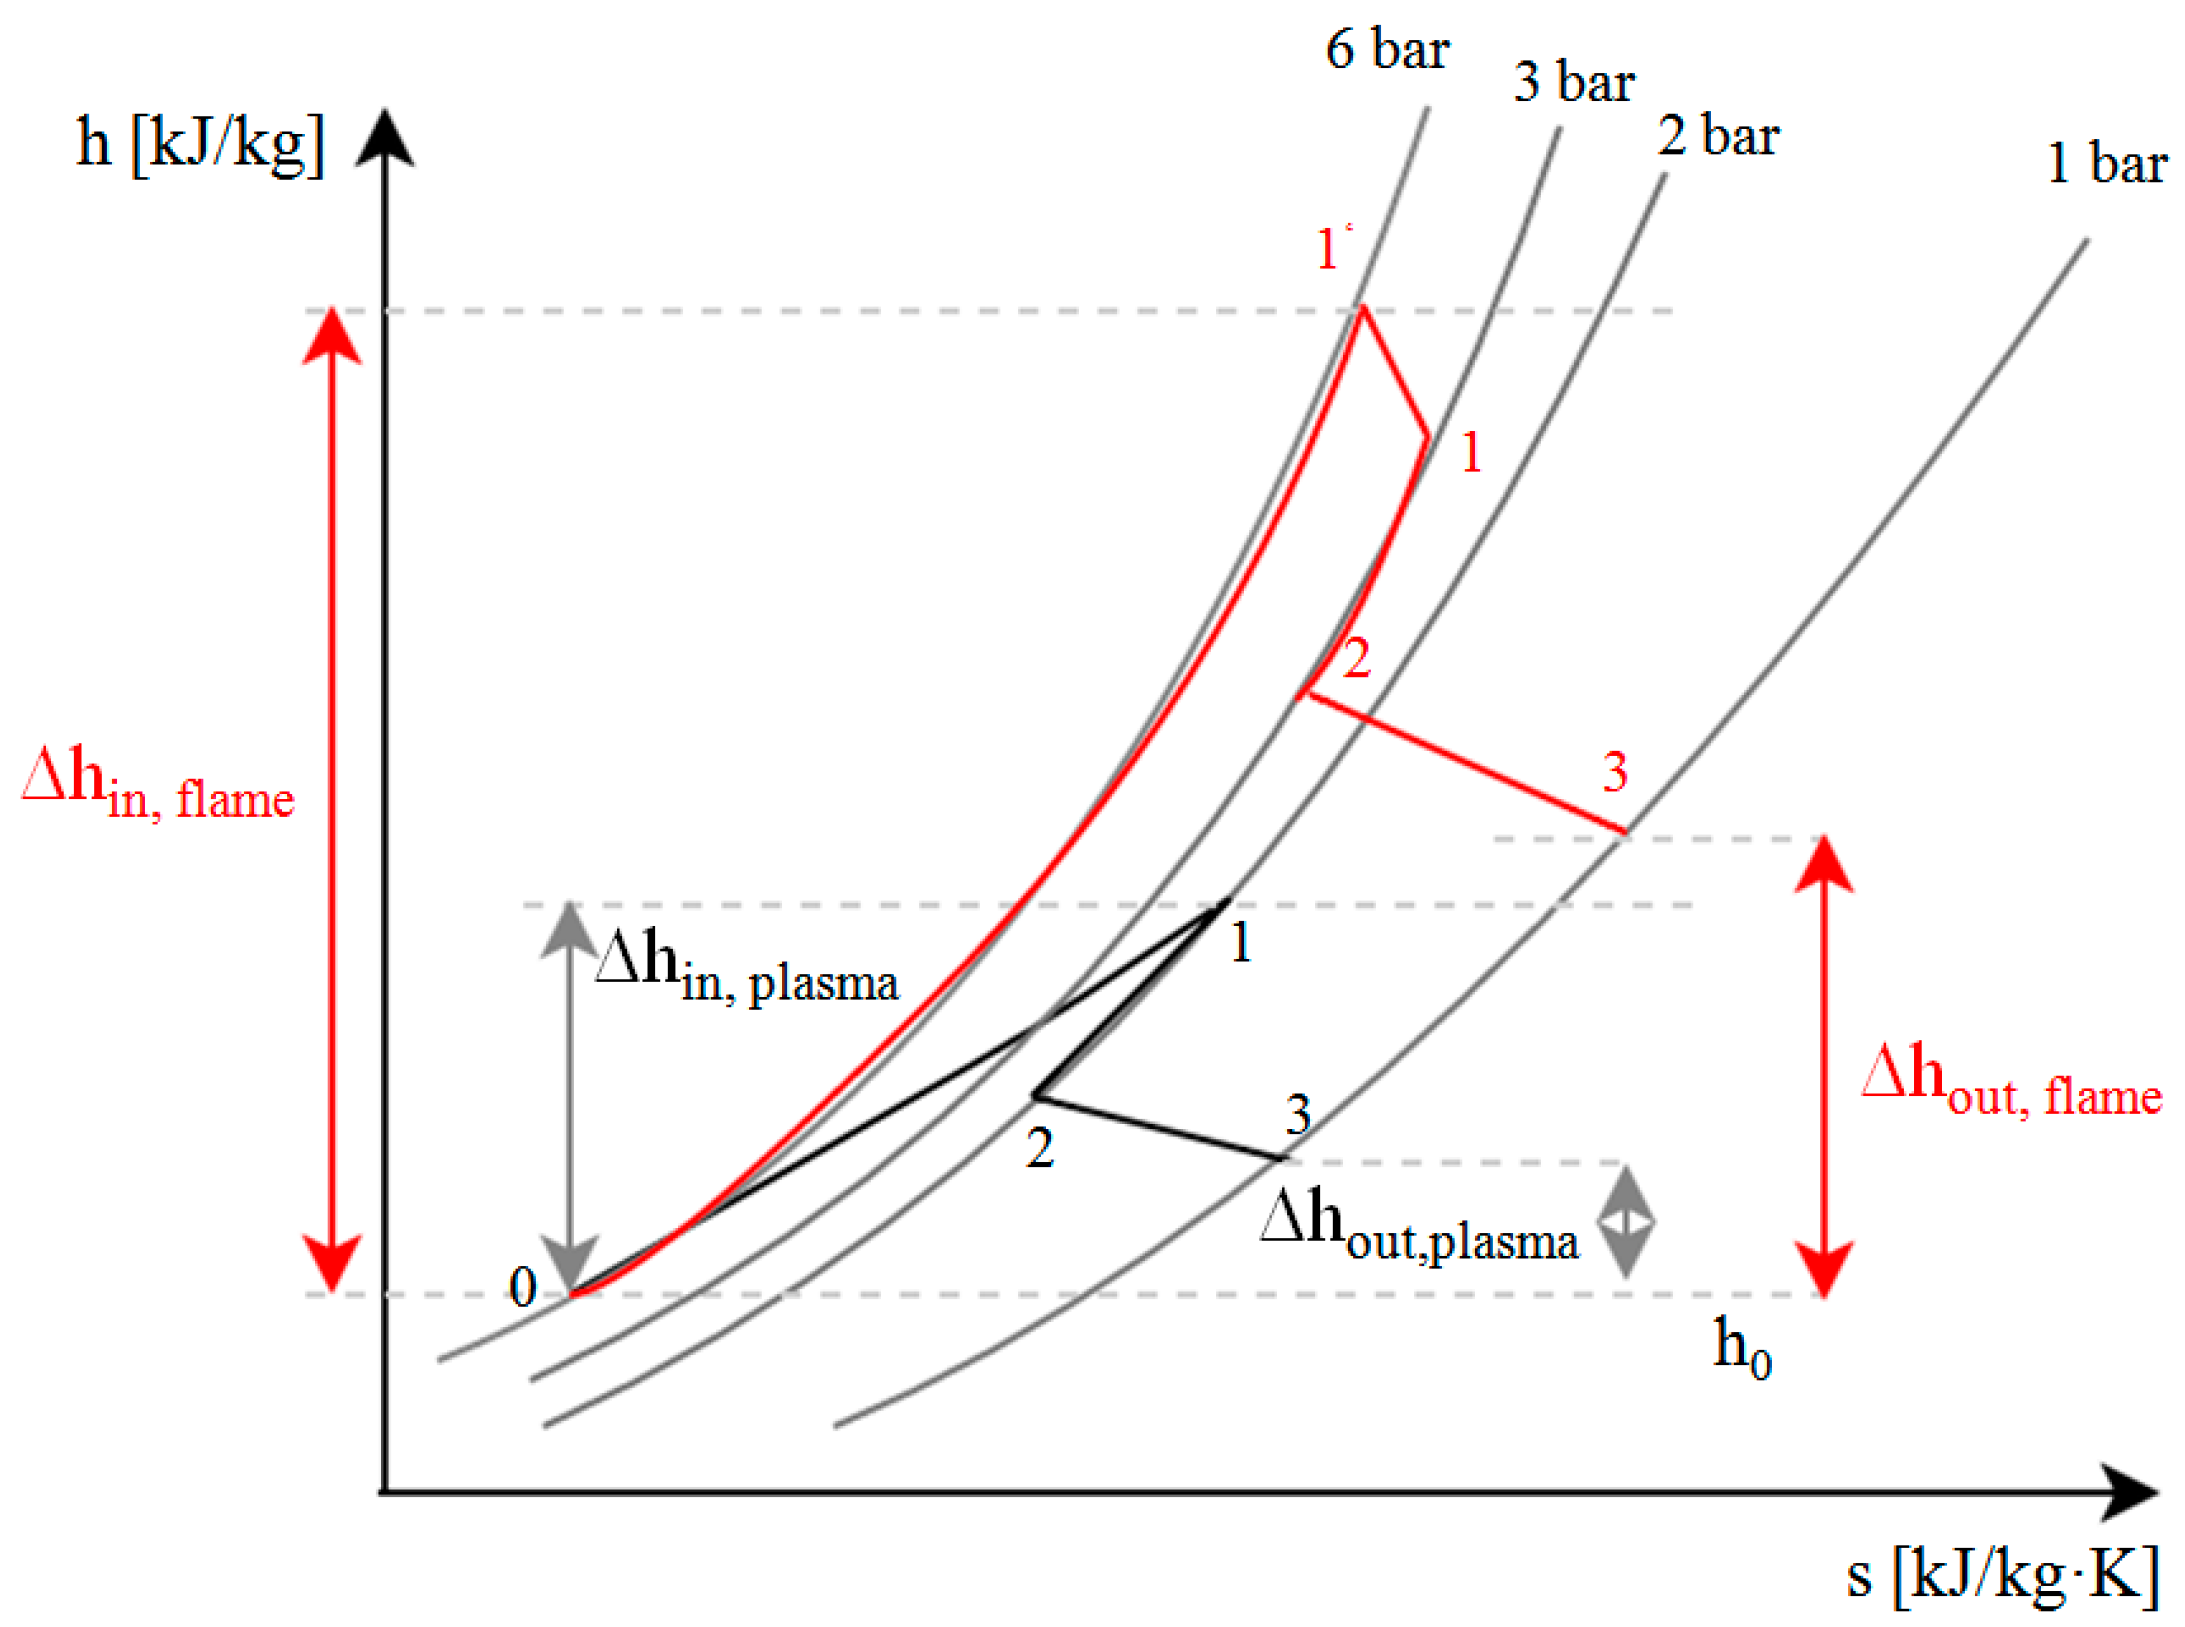
3.2. Effectiveness Analysis
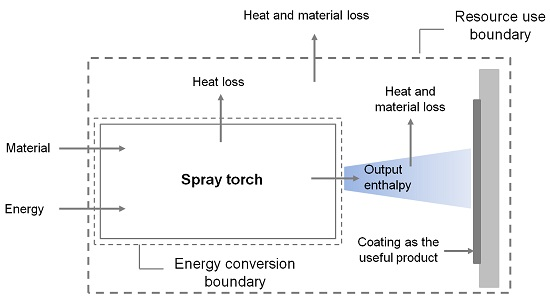
3.3. Resource Accounting
4. Conclusions
Acknowledgments
Author Contributions
Conflicts of Interest
Nomenclature
| Ar | argon |
| C2H4 | ethylene |
| C3H8O | isopropanol |
| energy rate (kW) | |
| exergy rate (kW) | |
| exergy (kJ) | |
| ex | chemical exergy (kJ/mol) |
| h | specific enthalpy (kJ/g) |
| molar enthalpy (kJ/mol) | |
| standard enthalpy of formation (kJ/mol) | |
| H2 | hydrogen |
| mass flow rate (g/s) | |
| M | molar mass (g/mol) |
| O2 | oxygen |
| n | number of moles |
| N2 | nitrogen |
| p | pressure (bar) |
| gas constant (J/mol·K) | |
| s | specific entropy (kJ/kg·K) |
| S | entropy (kJ/K) |
| T | temperature (°C or K) |
| υ | velocity (m/s) |
| work rate (kW) | |
| yi | mole fraction |
| exergy destruction ratio (%) | |
| Subscript | |
| 0 | ambient/atmospheric condition |
| F | input energy |
| d | destruction |
| en | energy |
| gen | generation |
| in | input stream |
| j | jet |
| l | loss |
| m | melt |
| min | minimum |
| mix | mixture |
| out | outlet stream |
| P | powder |
| s | solvent |
| v | vaporization |
| w | water |
| Superscript | |
| ch | chemical exergy |
| f | feedstock |
| Q | heat |
| Greek letter | |
| energy efficiency (%) | |
| degree of perfection (%) | |
| exergy efficiency (%) | |
| effectiveness efficiency (%) | |
| degree of energy ratio (%) | |
| Abbreviations | |
| APS | Atmospheric Plasma Spray |
| HVOF | High Velocity Oxy-Fuel Flame Spray |
| HVSFS | High Velocity Suspension Flame Spray |
| SPS | Suspension Plasma Spray |
References
- Bakshi, B.R.; Gutowski, T.G.; Sekulic, D.P. Thermodynamics and Destruction of Resources, 1st ed.; Cambridge University Press: Cambridge, UK, 2011; pp. 38–43, 167–189. [Google Scholar]
- Davis, J.R. Handbook of Thermal Spray Technology, 1st ed.; ASM International: Materials Park, OH, USA, 2004; pp. 3–5, 53–59. [Google Scholar]
- Jovane, F.; Westkämper, E.; Williams, D. The ManuFuture Road, 1st ed.; Springer: Berlin/Heidelberg, Germany, 2009; pp. 33–40. [Google Scholar]
- Gutowski, T.G.; Branham, M.S.; Dahmus, J.B.; Jones, A.J.; Thiriez, A.; Sekulic, D.P. Thermodynamic Analysis of Resources Used in Manufacturing Processes. Environ. Sci. Technol. 2009, 43, 1584–1590. [Google Scholar] [CrossRef] [PubMed]
- Gadow, R.; Killinger, A.; Kuhn, M.; Martinez, L.D. Verfahren und Vorrichtung zum Thermischen Spritzen von Suspensionen. German Patent DE102005038453A1, 8 February 2007. (In German)[Google Scholar]
- Killinger, A.; Kuhn, M.; Gadow, R. High-Velocity Suspension Flame Spraying (HVSFS), A New Approach for Spraying Nanoparticles with Hypersonic Speed. Surf. Coat. Technol. 2006, 201, 1922–1929. [Google Scholar] [CrossRef]
- Li, C.J.; Yang, G.J.; Wang, Z. Effect of Spray Parameters on the Structure of Nano-Structured TiO2 Deposits by Liquid Flame Spray Process. In Proceedings of the International Thermal Spray Conference, Essen, Germany, 4–6 March 2002; pp. 544–549.
- Taheri, K.; Gadow, R.; Killinger, A. Exergy analysis as a developed concept of energy efficiency optimized processes: The case of thermal spray processes. In Proceedings of the 47th CIRP Conference on Manufacturing Systems, Windsor, ON, Canada, 28–30 April 2014; Volume 17, pp. 511–516.
- Rant, Z. Exergy, a new word for “technical available work”. Forschung auf dem Gebiete des Ingenieurwesens 1956, 22, 36–37. (In German) [Google Scholar]
- Wall, G. Exergy—A Useful Concept within Resource Accounting. Available online: http://www.exergy.se/ftp/ex77c.pdf (accessed on 20 June 2016).
- Szargut, J.; Morris, D.R.; Steward, F.R. Exergy Analysis of Thermal, Chemical, and Metallurgical Processes; Hemisphere Publishing: New York, NY, USA, 1988. [Google Scholar]
- Bejan, A.; Tsatsaronis, G.; Moran, M. Thermal Design & Optimization; Wiley: New York, NY, USA, 1996. [Google Scholar]
- Cengel, Y.; Boles, M.A. Thermodynamics: An Engineering Approach, 4th ed.; McGraw-Hill: New York, NY, USA, 2006; pp. 326–328. [Google Scholar]
- Moran, M.J.; Shapiro, H.N. Fundamentals of Engineering Thermodynamics, 6th ed.; Wiley: Hoboken, NY, USA, 2007; pp. 755–759. [Google Scholar]
- Schnieder, K.E.; Belashenko, V.; Dratwinski, M.; Siegmann, S.; Zagorski, A. Thermal Spraying for Power Generation Components; Wiley: Weinheim, Germany, 2006; pp. 45–54, 145–151. [Google Scholar]
- Frazier, R.S. An Exergy Diagnostic Methodology for Energy Management in Manufacturing. Ph.D. Thesis, Oklahoma State University, Norman, OK, USA, 2006. [Google Scholar]


| Parameters | APS | SPS | HVOF | HVSFS | Unit |
|---|---|---|---|---|---|
| Ar | 39 | 39 | – | – | L/min |
| N2 | 7 | 7 | 25 | – | L/min |
| H2 | 9 | 9 | – | – | L/min |
| O2 | – | – | 320 | 320 | L/min |
| C2H4 | – | – | 90 | 90 | L/min |
| Current | 550 | 550 | – | – | A |
| Power | 39 | 39 | – | – | kW |
| Cooling power | 19.2 | 19.2 | 12.6 | 12.6 | kW |
| Water flow rate | 13.5 | 13.5 | 28.8 | 28.8 | L/min |
| Inlet water temperature | 18.5 | 18.5 | 23.7 | 23.7 | °C |
| Outlet water temperature | 39 | 39 | 30 | 30 | °C |
| Feedstock | Al2O3 Powder | 20 wt% Al2O3 in isopropanol | Al2O3 Powder | 20 wt% Al2O3 in isopropanol | – |
| Al2O3 | 46.6 | 11.6 | 46.6 | 11.6 | g/min |
| C3H8O | – | 45.6 | – | 45.6 | g/min |
| Nozzle jet axial velocity [2,15] | 600 | 600 | 1200 | 1200 | m/s |
| Spray Process | (kW) | (kW) | (kW) | (kW) | (kW) | (kW) | (kW) | (%) | Ψ (%) |
|---|---|---|---|---|---|---|---|---|---|
| APS | 39 | 19.2 | 19.8 | 37.8 | 1.17 | 23.5 | 13.1 | 50.8 | 34.6 |
| SPS | 39 | 19.2 | 19.8 | 37.8 | 1.17 | 23.5 | 13.1 | 50.8 | 34.6 |
| HVOF | 84 | 12.6 | 71.4 | 74.9 | 0.81 | 35.5 | 38.6 | 85 | 51.5 |
| HVSFS | 84 | 12.6 | 71.4 | 74.9 | 0.81 | 37.7 | 36.4 | 85 | 48.6 |
| Materials | Molar mass (g/mol) | Chemical exergy (ex) (kJ/mol) |
|---|---|---|
| Al2O3 | 101.9 | 200 |
| Ar | 39.9 | 11.7 |
| N2 | 28 | 0.72 |
| H2 | 2 | 236.1 |
| O2 | 32 | 4 |
| C2H4 | 28 | 1361 |
| C3H8O | 60 | 1998.6 |
| Streams | APS | SPS | HVOF | HVSFS | ||||
|---|---|---|---|---|---|---|---|---|
| (g) | Exergy (kJ) | (g) | Exergy (kJ) | (g) | Exergy (kJ) | (g) | Exergy (kJ) | |
| Input materials | ||||||||
| Al2O3 | 6.33 | 12.4 | 1.58 | 3.1 | 6.33 | 12.4 | 1.58 | 3.1 |
| Ar | 9.66 | 2.8 | 9.66 | 2.8 | – | – | – | – |
| N2 | 1.21 | 0.03 | 1.21 | 0.03 | 4.3 | 0.1 | 4.3 | 0.1 |
| H2 | 0.11 | 13.3 | 0.11 | 13.3 | – | – | – | – |
| O2 | – | – | – | – | 63.5 | 7.9 | 63.5 | 7.9 |
| C2H4 | – | – | – | – | 14.7 | 742 | 14.7 | 742 |
| C3H8O | – | – | 6.33 | 211 | – | – | 6.33 | 211 |
| Input energy | ||||||||
| Electricity | – | 325 | – | 325 | – | – | – | – |
| Sum of inputs | – | 353.5 | – | 555 | – | 762.4 | – | 965 |
| Output | ||||||||
| Al2O3 coating | 0.36 | 0.7 | 0.12 | 0.24 | 1.36 | 2.67 | 0.46 | 0.9 |
| Degree of perfection (ɳp) | 2 × 10⁻³ | 4.3 × 10⁻⁴ | 3.5 × 10⁻³ | 9.3 × 10⁻⁴ | ||||
© 2016 by the authors; licensee MDPI, Basel, Switzerland. This article is an open access article distributed under the terms and conditions of the Creative Commons Attribution (CC-BY) license (http://creativecommons.org/licenses/by/4.0/).
Share and Cite
Taheri, K.; Elhoriny, M.; Plachetta, M.; Gadow, R. Thermodynamic Analysis of Resources Used in Thermal Spray Processes: Energy and Exergy Methods. Entropy 2016, 18, 237. https://doi.org/10.3390/e18070237
Taheri K, Elhoriny M, Plachetta M, Gadow R. Thermodynamic Analysis of Resources Used in Thermal Spray Processes: Energy and Exergy Methods. Entropy. 2016; 18(7):237. https://doi.org/10.3390/e18070237
Chicago/Turabian StyleTaheri, Kamran, Mohamed Elhoriny, Martin Plachetta, and Rainer Gadow. 2016. "Thermodynamic Analysis of Resources Used in Thermal Spray Processes: Energy and Exergy Methods" Entropy 18, no. 7: 237. https://doi.org/10.3390/e18070237