Article

Recognition of Abnormal Uptake through 123I-mIBG Scintigraphy Entropy for Paediatric Neuroblastoma Identification

by
Milagros Martínez-Díaz
1,
Rafael Martínez-Díaz
2,
Luis M. Sánchez-Ruiz
2,* and
Guillermo Peris-Fajarnés
2
1
Departamento de Informática de Sistemas y Computadores, Universitat Politècnica de València, Valencia 46022, Spain
2
Centro de Investigación en Tecnologías Gráficas, Universitat Politècnica de València, Valencia 46022, Spain
*
Author to whom correspondence should be addressed.
Entropy 2016, 18(10), 349; https://doi.org/10.3390/e18100349
Submission received: 4 August 2016 / Revised: 16 September 2016 / Accepted: 20 September 2016 / Published: 27 September 2016
(This article belongs to the Special Issue Wavelets, Fractals and Information Theory II)

Abstract

:
Whole-body 123I-Metaiodobenzylguanidine (mIBG) scintigraphy is used as primary image modality to visualize neuroblastoma tumours and metastases because it is the most sensitive and specific radioactive tracer in staging the disease and evaluating the response to treatment. However, especially in paediatric neuroblastoma, information from mIBG scans is difficult to extract because of acquisition difficulties that produce low definition images, with poor contours, resolution and contrast. These problems limit physician assessment. Current oncological guidelines are based on qualitative observer-dependant analysis. This makes comparing results taken at different moments of therapy, or in different institutions, difficult. In this paper, we present a computerized method that processes an image and calculates a quantitative measurement considered as its entropy, suitable for the identification of abnormal uptake regions, for which there is enough suspicion that they may be a tumour or metastatic site. This measurement can also be compared with future scintigraphies of the same patient. Over 46 scintigraphies of 22 anonymous patients were tested; the procedure identified 96.7% of regions of abnormal uptake and it showed a low overall false negative rate of 3.3%. This method provides assistance to physicians in diagnosing tumours and also allows the monitoring of patients’ evolution.

1. Introduction

In the management of neuroblastoma, 123I-Metaiodobenzylguanidine (mIBG) scintigraphy remains the most specific and sensible imaging modality of staging and response to therapy evaluation [1]. A scintigraphic image is a representation of the radioactive distribution inside the body. Peaks of higher intensity than expected are the main variable analyzed by radiologists when identifying the uptake regions [2].
Analyzing an image to detect shapes is a classic problem in literature [3]. However, existing techniques cannot be applied to the images used in this article, since generally they have intrinsic problems of low resolution, low contrast and low definition, asides from noise as an important factor in its deterioration [4,5]. The proposed method performs a preprocessing of the image, extracting numeric values, which highlights the zones with a high probability of containing a tumour or metastasis [6]. Furthermore, these measurements are considered as its entropy, and allow following the evolution of the patient over time [7]. The quantitative measurement adds more descriptive information on tumours, which may be included in models of nonlinear dynamics of cancer recurrence to study the correlation between uptake and tumour relapse.
Dual-modality imaging combines functional measurements from radionuclide images with accurate anatomical information from computerized tomography. This can help the clinician to differentiate disease from normal uptake, improving diagnosis [8,9]. However, viability of dual-modality images is not always possible in children [10]. It also depends on the availability of a multiple head camera. Other authors believe that 123I-mIBG single photon emission computed tomography (SPECT) does not increase the number of lesions detected in comparison with only a planar image [11]. This is due to the difficulties of acquisition in children. Anatomic imaging modalities have also proven to be of limited value for more sophisticated questions and dilemmas arising during cancer patient management [12].
As a consequence, one of the current goals of the International Neuroblastoma Risk Group is to develop guidelines for standardized comparisons of 123I-mIBG scans, minimizing subjective assessments [13]. In order to evaluate the prognostic effects and quantify efficacy of therapy, a number of semi-quantitative scores have emerged [14,15,16,17,18,19] and have been shown to be essential for the evaluation and quantification of response to the treatment [12,20,21].
All these scoring methods divide the skeleton into anatomical sectors, then give each sector an individual score for the number of lesion sites and intensity of uptake. Intensity is usually scored as doubtful, definite, obvious or strong based upon the observer assessment in comparing to liver or other soft tissues. They have shown a good correlation with outcome although intensity measurements show low concordance between different observers because disappearance or decrease of intensity of a lesion is subjective.
The objective of our study is to assist physicians in the application of the scoring method recommended by the International Society of Paediatric Oncology Europe Neuroblastoma (SIOPEN) for neuroblastoma management [22,23] which is setting the standards for acquiring, reading and scoring the paediatric 123I-mIBG scans across Europe.
In this paper, we introduce a computerized procedure which uses a whole-body 123I-mIBG scintigraphy from which we extract adequate information in order to identify abnormal uptake regions. Our approach is based on the ratio between the specific uptake from tumours and the non-specific constant uptake threshold of the rest of tissues at the SIOPEN body sector where a tumour is located. This may assist physicians in the evaluation of planar images because it provides a quantitative measurement of each uptake region (an entropy value).
The article is structured as follows. Previous related work is detailed in Section 2. In Section 3, we introduce the method. Experimental results are provided in Section 4, a discussion in Section 5 and the conclusions drawn appear in Section 6.

2. Related Work

Some computer-aided applications for the automatic assessment of planar scintigraphic images found in the bibliography have been developed over 99mTc bone scintigraphies, but there is no specific assessment for 123I-mIBG in neuroblastoma nor for any semi-quantitative scoring method, such as the one recommended by SIOPEN. In fact, 99mTc and 123I-mIBG are similar scintigraphic procedures; in both, brightness is the primary tool used for abnormal region identification on an image. In [24], the local maximum of brightness in bones and its asymmetries are used to detect abnormalities in the skeleton in 99mTc whole-body bone scintigraphies.
Later in [25], a set of algorithms was proposed for segmentation and lesion grey level determination. In fact, op.cit. proposes the lesion grey level as an uptake measurement evidence. They used a set of previous measurements of pixel intensity’s mean and standard deviation at different body parts to create a grey level of reference.
Images obtained in 99mTc scans are very different from 123I-mIBG due to a combination of diverse factors, the most important of which is that different radiopharmaceuticals have different biodistributions. For instance, previous work on bone segmentation with 99mTc bone scintigrams in [26,27] based on detecting edges is not applicable as a general rule in paediatric neuroblastoma 123I-mIBG scintigraphies because bones are not always visible. Skeletal uptake is only visible in neuroblastoma in those patients with bone metastases. Thus, a method that works in planar 123I-mIBG scintigraphy even when no bones are visible is required.
In children, other facts, such as lower dosage used because of their smaller size and the increased risk of motion during acquisition, result in lower photon counts and, therefore, the Poisson noise present in 123I-mIBG scintigraphy is higher.
This highlights that the application of techniques to improve image quality, such as image enhancement based on histogram with successful application in the detection of lesions in 99mTc scintigraphies [28] do not seem useful in 123I-mIBG scans in neuroblastoma detection. In [29], although the Poisson noise level was reduced, physicians preferred non-processed planar images rather than the processed version due to the blur effect on features and general image degradation.
As a result of the above, the algorithms successfully used in 99mTc are not directly applicable in 123I-mIBG in paediatric neuroblastoma. Nevertheless, the use of pixel intensity’s mean and standard deviation is useful in 123I-mIBG.
In [4,5] an objective metric U ¯ (background) was introduced for measuring the strength of 123I-mIBG uptake at scans. This metric uses the mean and the standard deviation of the intensity of the whole-body scan to transform each pixel value into a normalized scale in order to minimize variation in measurements between different scans.

3. Materials and Methods

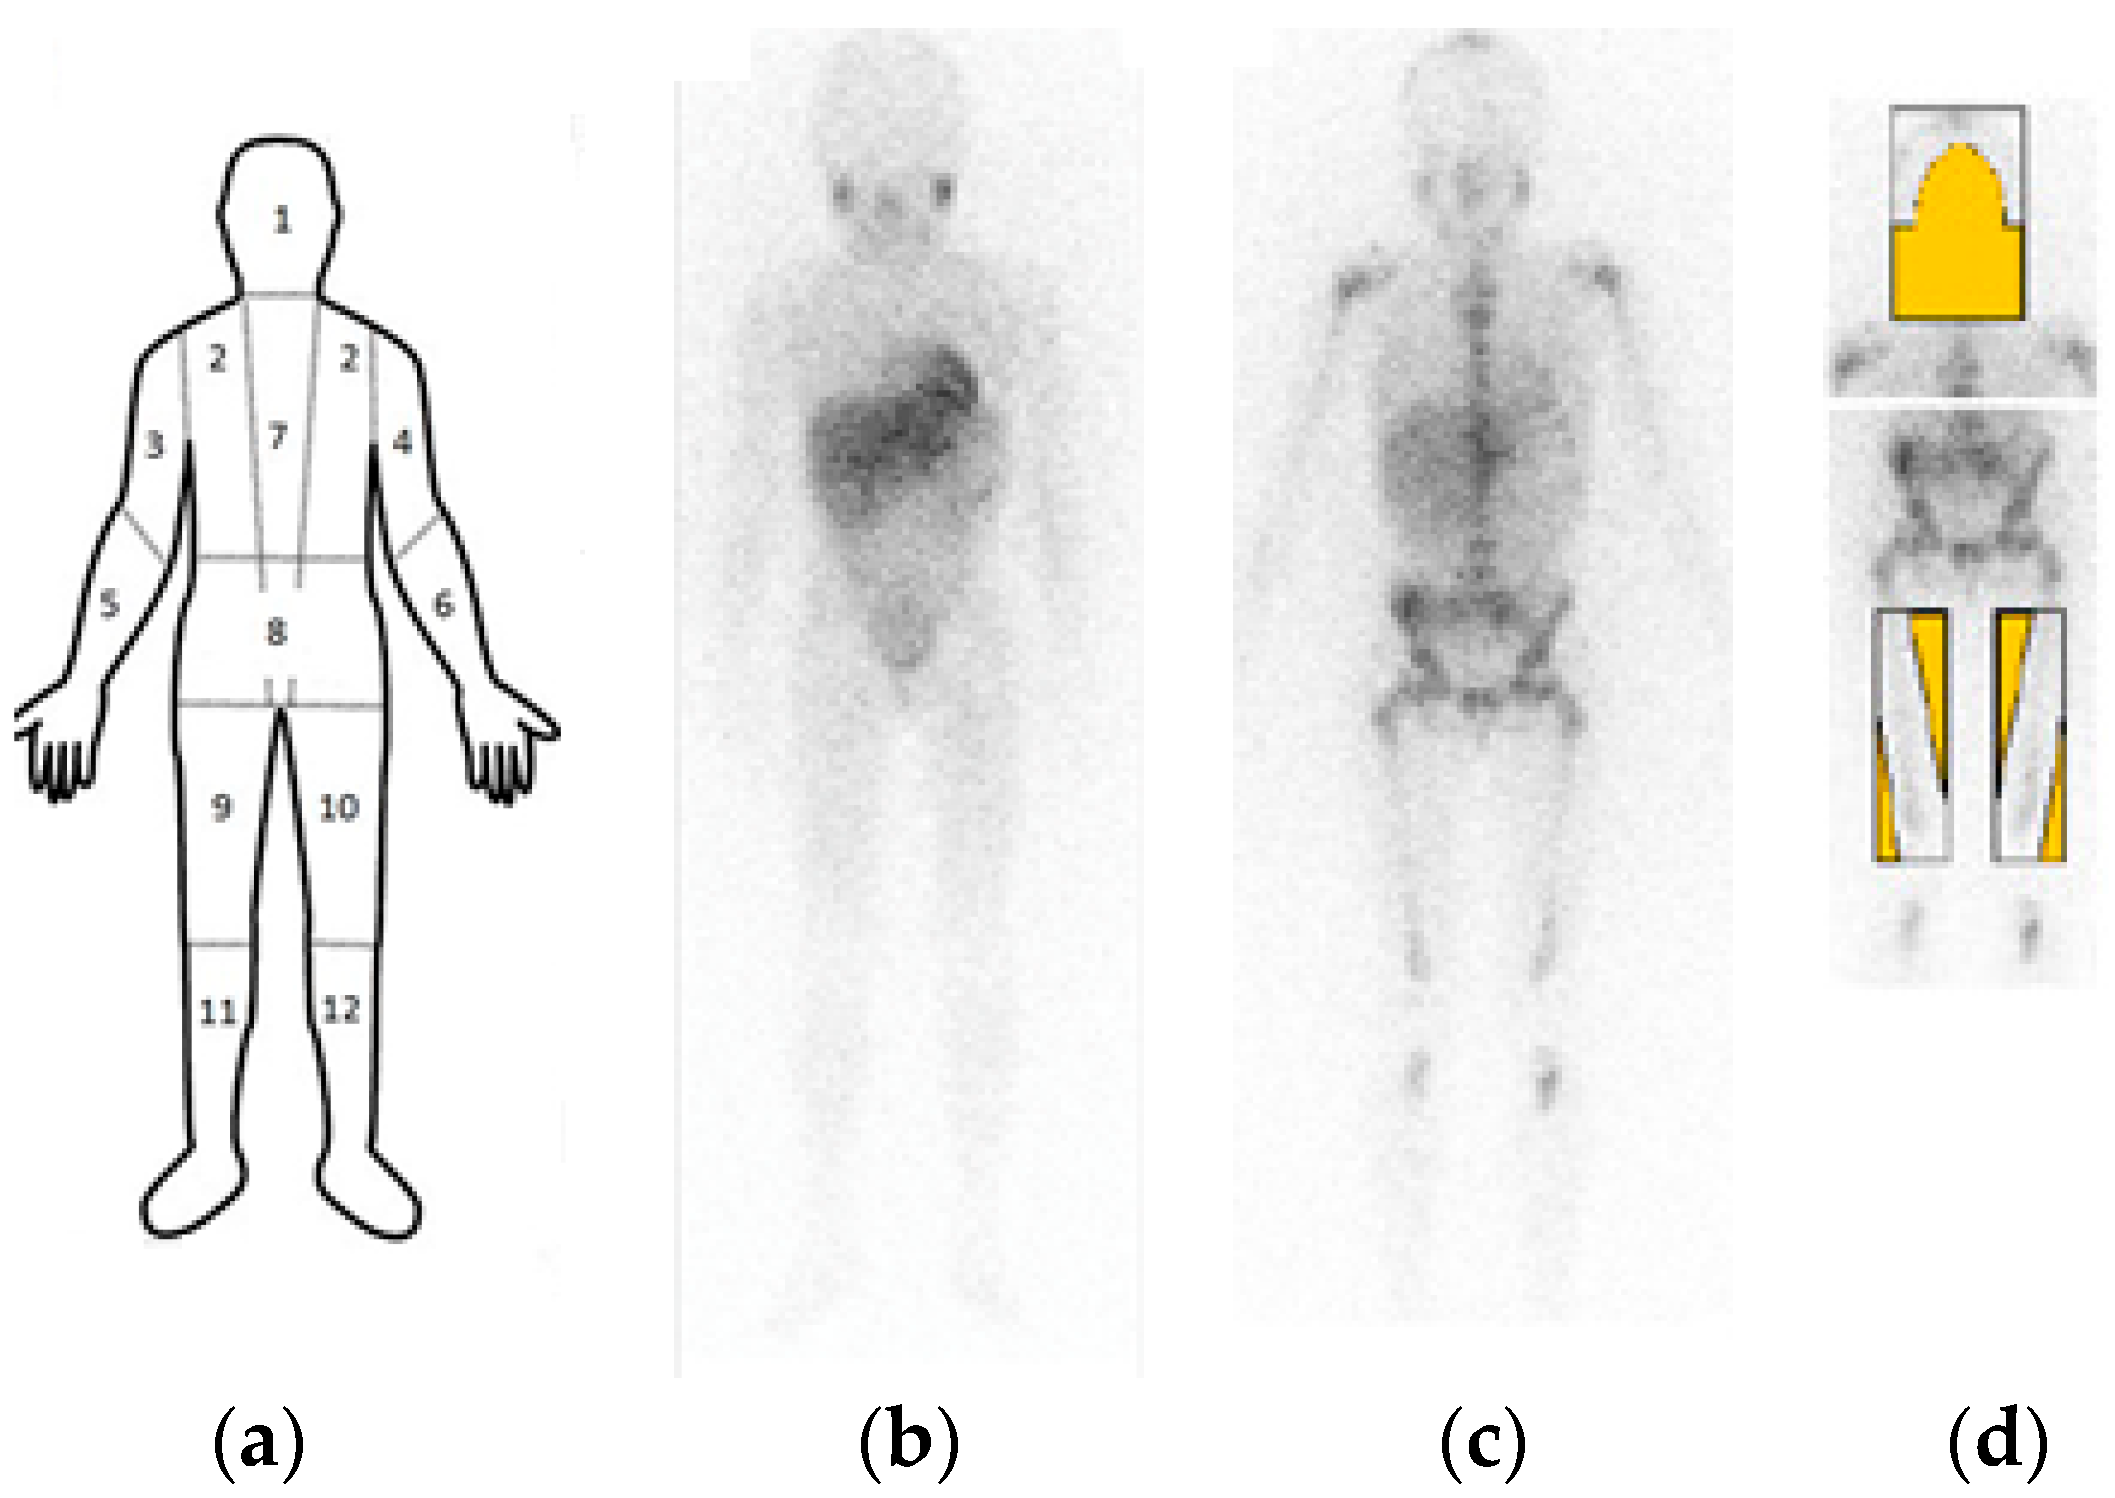
3.1. Data Acquisition and Analysis

123I-mIBG scintigraphies were acquired in patient studies of La Fe Hospital by its Nuclear Medicine Unit, as part of the usual medical treatment following their standardized guidelines, described in [30], after a slow intravenous injection of 123I-mIBG (Dose: 100 µCi/Kg) and using a scintillation camera set to a photopeak equal to the principal gamma photon emitted, that is, of 159 KeV. Each study is composed of two planar images, the anterior and the posterior views of the patient body, from which a minimum of 250,000 and a maximum of 500,000 photon counts were obtained. The use of these scintigraphies for this study was approved by the La Fe Hospital’s Biomedical Research Ethics Committee.
High peaks of intensity (photo counts) are to be observed at the locations of lesions. These peaks are abnormal because they appear at locations where no physiological uptake is expected. Post treatment, another scan is performed. Response to treatment is assessed as good if abnormal peaks of intensity disappear and regions return to the expected light intensity.
Due to the fact that non-specific uptake is different at each part of the body, the SIOPEN semi-quantitative scoring method [22,23] divides the body into anatomical sectors with 123I-mIBG uptake comparable behavior [13] (Figure 1).
A region with abnormal uptake is visible because its intensity is higher than the local average at the sector where it is located. Nevertheless, it is possible for the absolute value of a given tumour’s intensity to be lower than that of a region in another sector where no intensity peaks are observed.
Therefore, it is impossible to use a single grey level threshold to distinguish between abnormal and physiological uptake. We define an abnormal uptake region as any region with intensity suspiciously higher than the local average at its sector. We try to automatically identify only those abnormal ones that are suspicious enough of being pathological.

3.2. Pre-Processing

At this step we prepare the image for analysis and information extraction. First, we filter the image with an Adaptive Wiener Filter and then we make a body division into SIOPEN anatomical sectors.
Noise is an important factor degrading scintigraphic images [29]. An Adaptive Wiener Filter is a good candidate for reducing noise; it has been used with success in nuclear medicine images [31,32,33]. In low-detail image areas where noise is more visible, it reduces as much noise as possible but in high-detail regions only a small amount of filtering is performed and the image is not blurred [1].
Let us denote, by I W B , the filtered anterior (or posterior) view of a whole body 123I-mIBG scintigraphy. In both views of every test scintigraphy, patients’ body SIOPEN sectors [22] were identified by placing a rectangle to delimiter them: skull, thoracic cage, proximal right upper limb, distal right upper limb, proximal left upper limb, distal left upper limb, spine, pelvis, proximal right lower limb, distal right lower limb, proximal left lower limb and distal left lower limb.
Each image of a sector is identified as I 1 ,   I 2 ,   I 12 as shown in Figure 1. The number of each sector is assigned as defined in [22]. We identified the whole trunk, which is fully covered by sectors 2 and 8 (Figure 1), as I T . We use this image in order to facilitate detecting the liver and tumours inside the trunk.
As we are interested in evaluating only inside body parts of the image, we create a new image I which is formed by the I k and is just the image formed by the pixels of I W B corresponding to the SIOPEN Sectors.

3.3. Peaks Detection

The image I is a set of points (i, j), whose intensity is a value x i j [ 0 ,   X m a x ] . Tumours have neither a predefined shape nor an absolute intensity level in I . Main evidence of tumour existence is the peak of intensity at its location due to the specific uptake at the tumour’s tissue. Thus, points (i, j) belonging to the tumour are bound to have a value x i j close to the maximum intensity X m a x in I and greater than some unknown thresholds of abnormal intensity X T h r e s .
X T h r e s is a different value for each specific body sector k, as each of them presents different uptake behaviour. So, points belonging to a tumour located at sector k are bound to have a value x i j greater than its local sector threshold of abnormal intensity X T k .
Hence, at each sector, k, we should consider the following as abnormal suspicious ROIs:
R O I X T k = { ( i ,   j ) I K :   x i j [ X T k ,     X m a x ] }
In order to define the values of the unknown local thresholds X T k , we denote by I ¯ , I ¯ k and σ I , σ I k the average and standard deviation of I and of each I k , with k   { 1 , 2 , , 12 , T } , respectively.
X T k should be greater than I ¯ k . How much greater than I ¯ k depends on the specific sector k and thus a coefficient C k will be properly introduced later to weigh it.
In order to take objective and comparable uptake measurements between scans [32] we transform the image I into Q I ,
Q I ( i ,   j ) = max { x i j I ¯ σ I , 0 }
As it is based on the whole-body average, we use it to estimate a generic approximation X T G l o b a l to be used as X T k in each sector k. If the pixel (i, j) has a normalized value higher than C G times Q I ¯ , then it has an abnormal peak of intensity. Where Q I ¯ is the average of Q I .
We take the generic C G 1 and then:
Q I ( i , j ) > C G Q I ¯
x i j I ¯ σ I > C G Q I ¯
X i j > I ¯ + σ I C G Q I ¯
Thus it is natural to fix
X T G l o b a l = I ¯ + σ I C G Q I ¯
At every sector, peaks which are higher than X T G l o b a l are very likely to be pathological because they have very high intensity. In previous studies [4,5], all the informed tumours analyzed had an intensity value greater than Q I ¯ .
But, especially in limb sectors, only light physiological uptake should be observed and abnormal peaks, due to metastases, could not be so high and, thus, they will not be detected with X T G l o b a l . For a better local approximation at each sector k, we transform again x i j but now into its local normalized value:
Q I k ( i , j ) = max { x i j I k ¯ σ I k , 0 }
Now we calculate at each sector k, average Q I k ¯ and standard deviation σ I k and we will take the sector threshold S T k as in Equation (4) but now with a sector coefficient C k 1 as
S T k = I k ¯ + σ I k C k Q I k ¯
Points belonging to a tumour located at sector k are bound to have a value x i j greater than its sector threshold S T k . It is a good candidate to identify abnormal uptake when it is present. However, when there is no pathological uptake, image features are very different and S T k is not applicable. Especially at limb sectors, when only physiological uptake is present, the counts of photons detected are very low. Images of sectors could even be empty, or contain noise only, due to the lack of samples, as shown in Figure 1b, where only light physiological uptake is visible at the limbs. The image changes when pathological uptake appears as shown in Figure 1c. The counts of photons detected increase and produce a more detailed sector image. Our information extraction method needs to differentiate between both situations.
If we analyze images at the whole-body level, this effect is less perceptible since there is always high physiological uptake as some regions such as at the liver, the bladder and the head. This fact makes whole-body image I a perfect reference to detect pathological pattern at limbs when it is present. We can achieve that by comparing the average of normalized uptake at the whole-body Q I ¯ with the average at each limb sector Q I k ¯ . We define the ratio R k between the average of uptake levels as
R k = Q I ¯ Q I k ¯
We will analyze the use of this ratio in a test subset in order to discriminate the value of R k when only light physiological uptake is present. In such cases, there are no peaks and that means that I ¯ or I k ¯ are low. S T k is much smaller than X T G l o b a l and any x i j greater than S T k is very unlikely to be pathological.
Let us consider the coefficient ρ k > 1 , so that X T k is a valid threshold for sector k only if it is high enough, that is, if X T G l o b a l ρ k S T k . Otherwise, we use X T G l o b a l as the threshold for the sector k. So we consider the local threshold X T k given by
X T k = { X T G l o b a l , X T G l o b a l > ρ k S T k S T k , X T G l o b a l ρ k S T k
The process of detecting the abnormal uptake regions consists of calculating the set R O I X T k for each SIOPEN sector by using Equations (1) and (8).
We must take into account the following issues related to the kind of image in order to improve the information extraction process.
Firstly, owing to the high noise level in an image, even after filtering, a single pixel may still have a high scintigraphic value. For this reason it is sensible to evaluate the image by exploring windows of size J × J pixels, never by single pixels. In this manner, at Equation (1) we replace the use of the raw counts at every pixel by a smoothing average count calculated over the 3 × 3 neighbouring pixels in the sub-window.
Later on, when disease is present at limbs, pathological uptake could be located only at the bones [7]. Those bone parts with metastases become visible and, at worst, only the skeleton is visible while soft tissue presents low uptake or it is not visible at all due to neuroblastoma tissue consuming all the 123I-mIBG (Figure 1c) [7].
Thus, in general, the pixels at areas where the bones are to be located are relevant for our detection process. For every SIOPEN sector I k we define a new image I k m a s k where irrelevant areas are discarded. For instance, at lower limbs, pixels outside bone regions are irrelevant, as shown in masked areas in Figure 1d. Pixels close to the knees and ankles are relevant together with those close to the femur and tibia position. At the upper limbs, relevant areas are those near to the shoulders and at central positions. At the head, salivary glands’ position could be discarded because uptake is always present in them.
At trunk sectors, the existence of primary tumours in soft tissue is possible, so bone search patterns are less useful and we search in the whole I T .
In summary, for every SIOPEN sector, we process its masked sector I k m a s k with an exploring window W J of 3 × 3 pixels and X T k defined in Equation (8). We get the sub-image R O I X T k redefining Equation (1) as
R O I X T k = { W J   I k m a s k :   W J ¯ [ X T k ,   X m a x ] }
where W J ¯ is the average of x i j     W J . R O I X T k contains all the abnormal shining region R O I # present in I k , that is, each tumour, metastasis, the liver, bladder, etc.

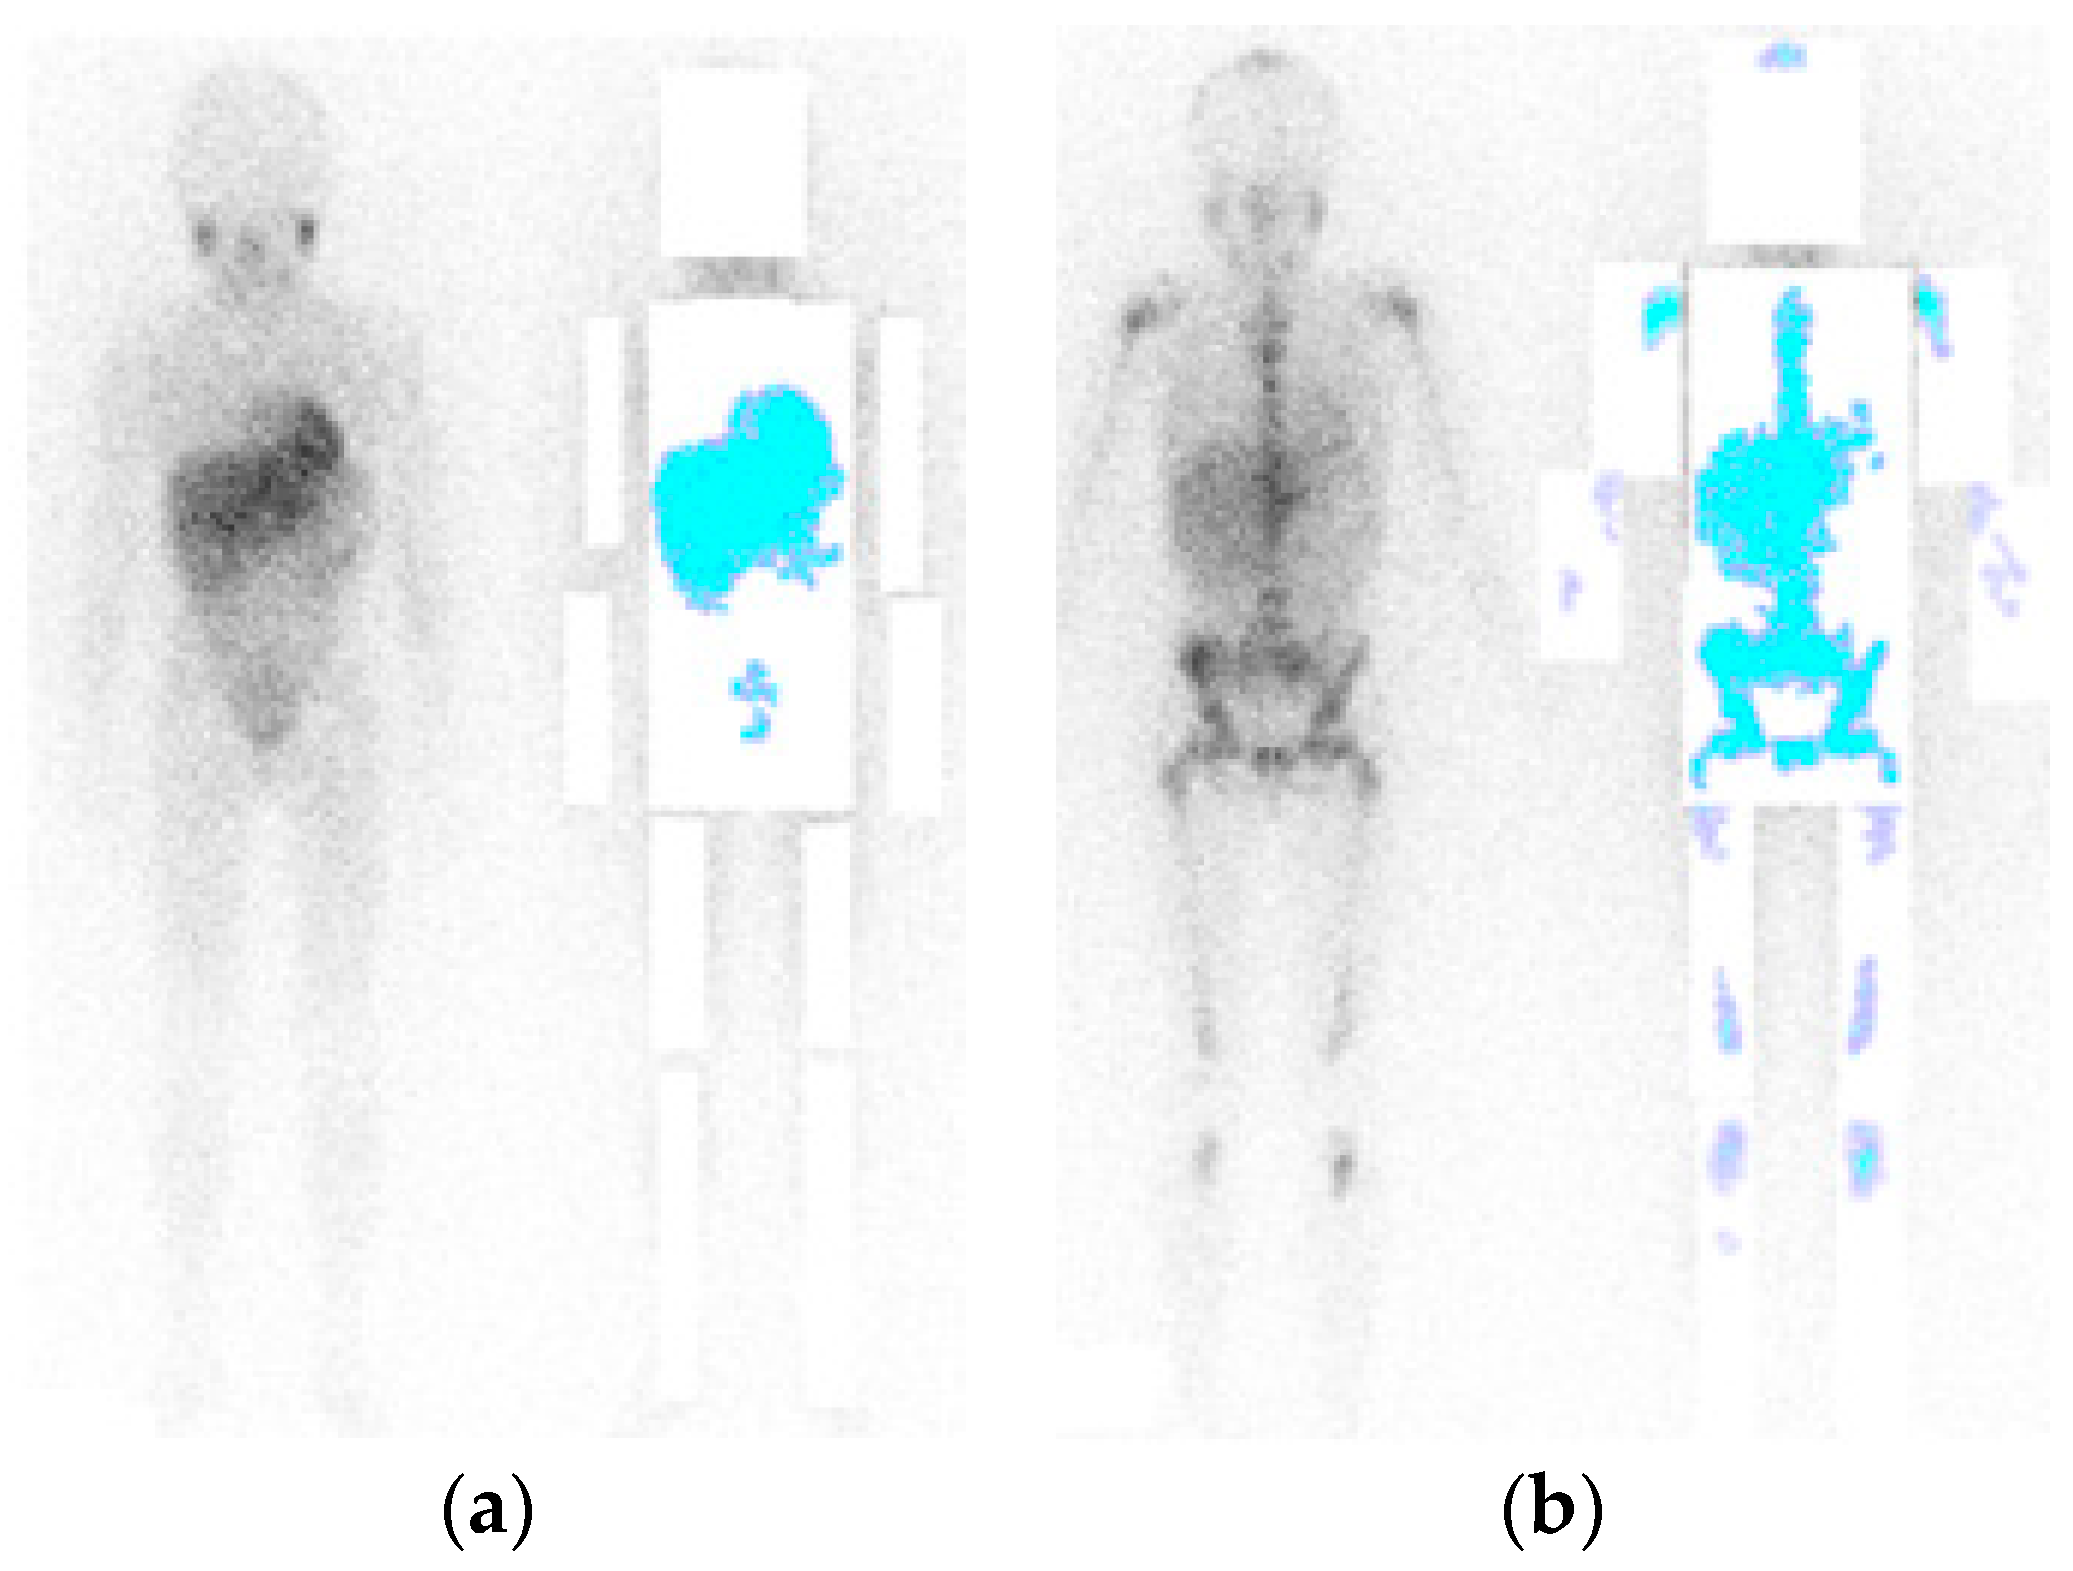
3.4. Region Growth and Classification
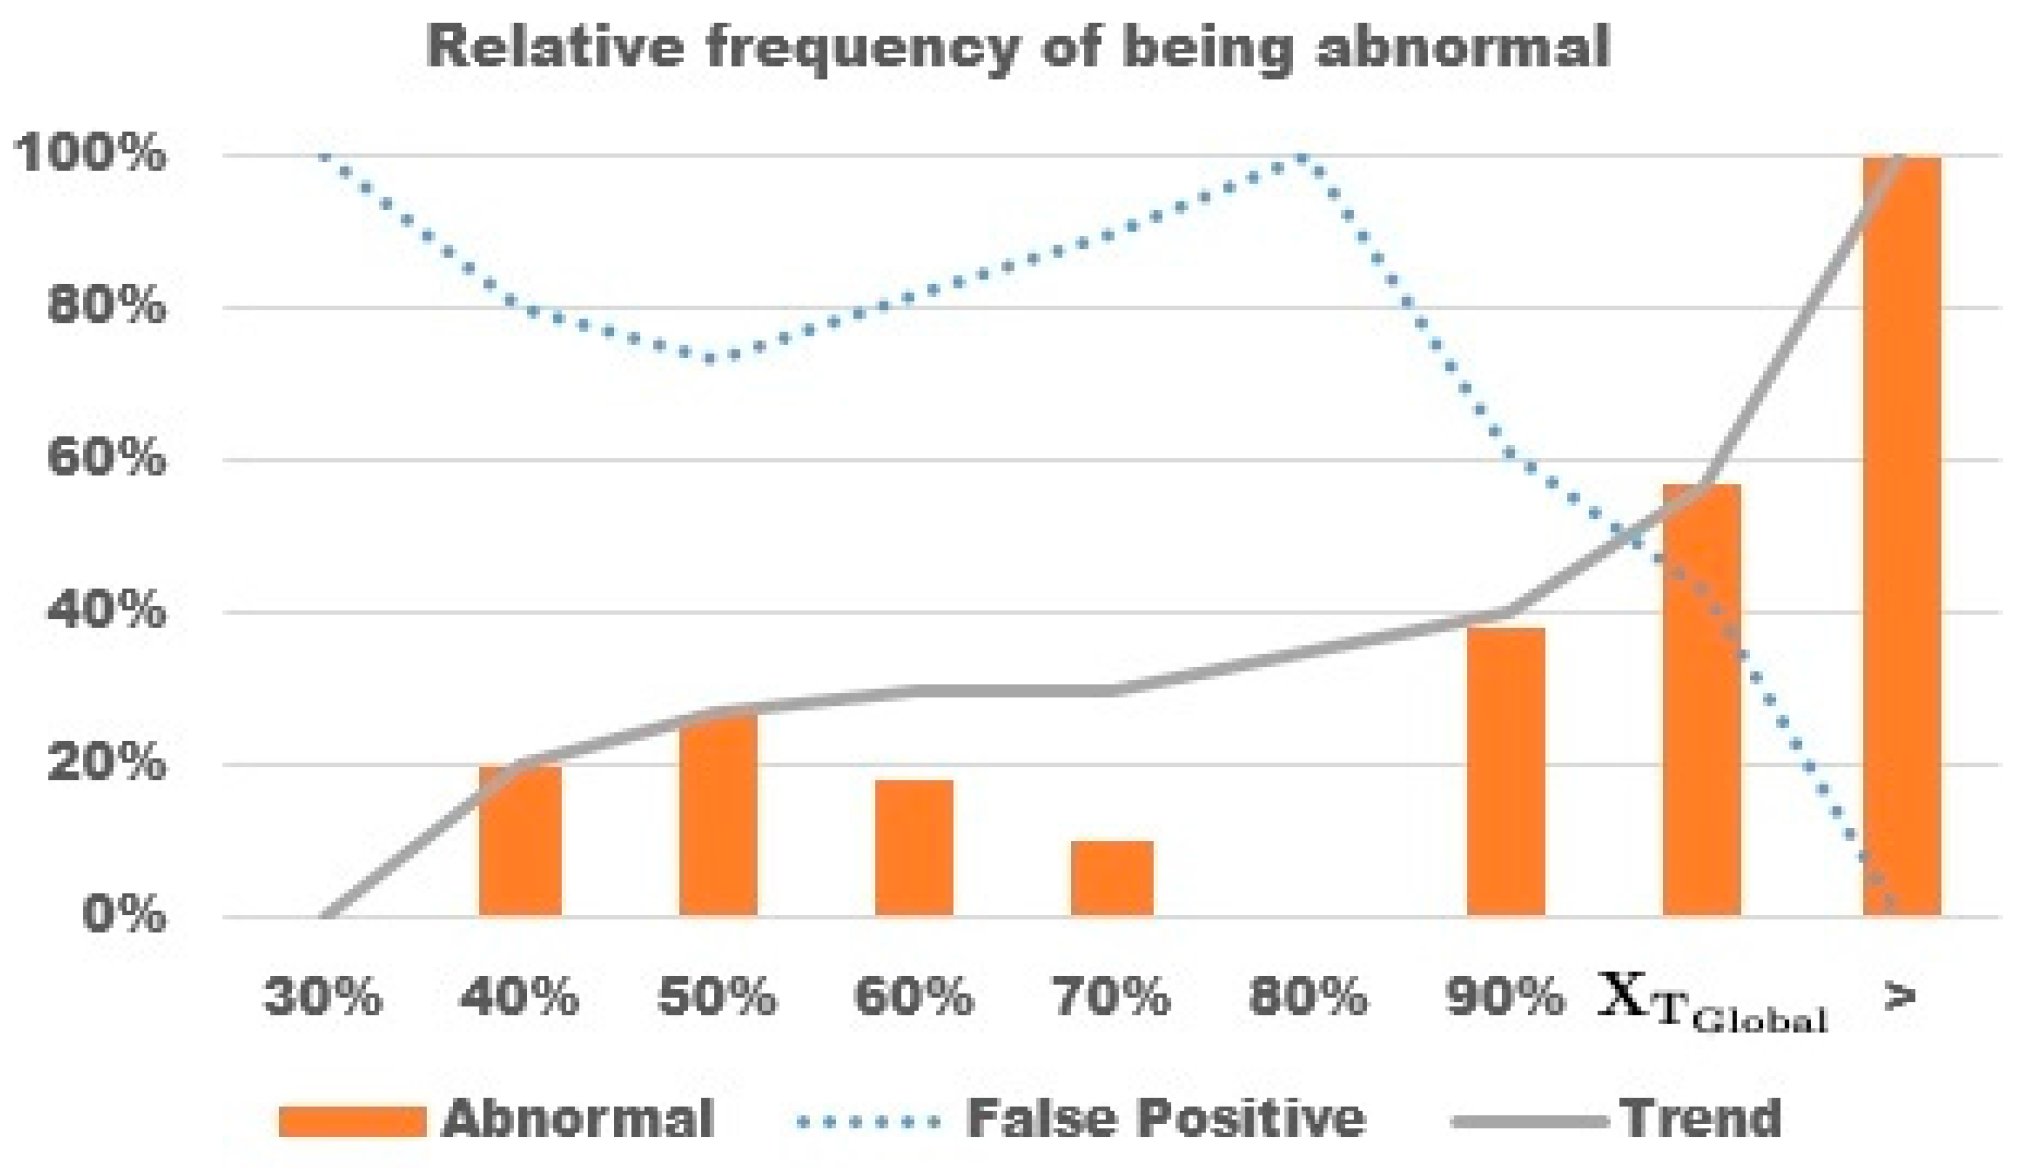
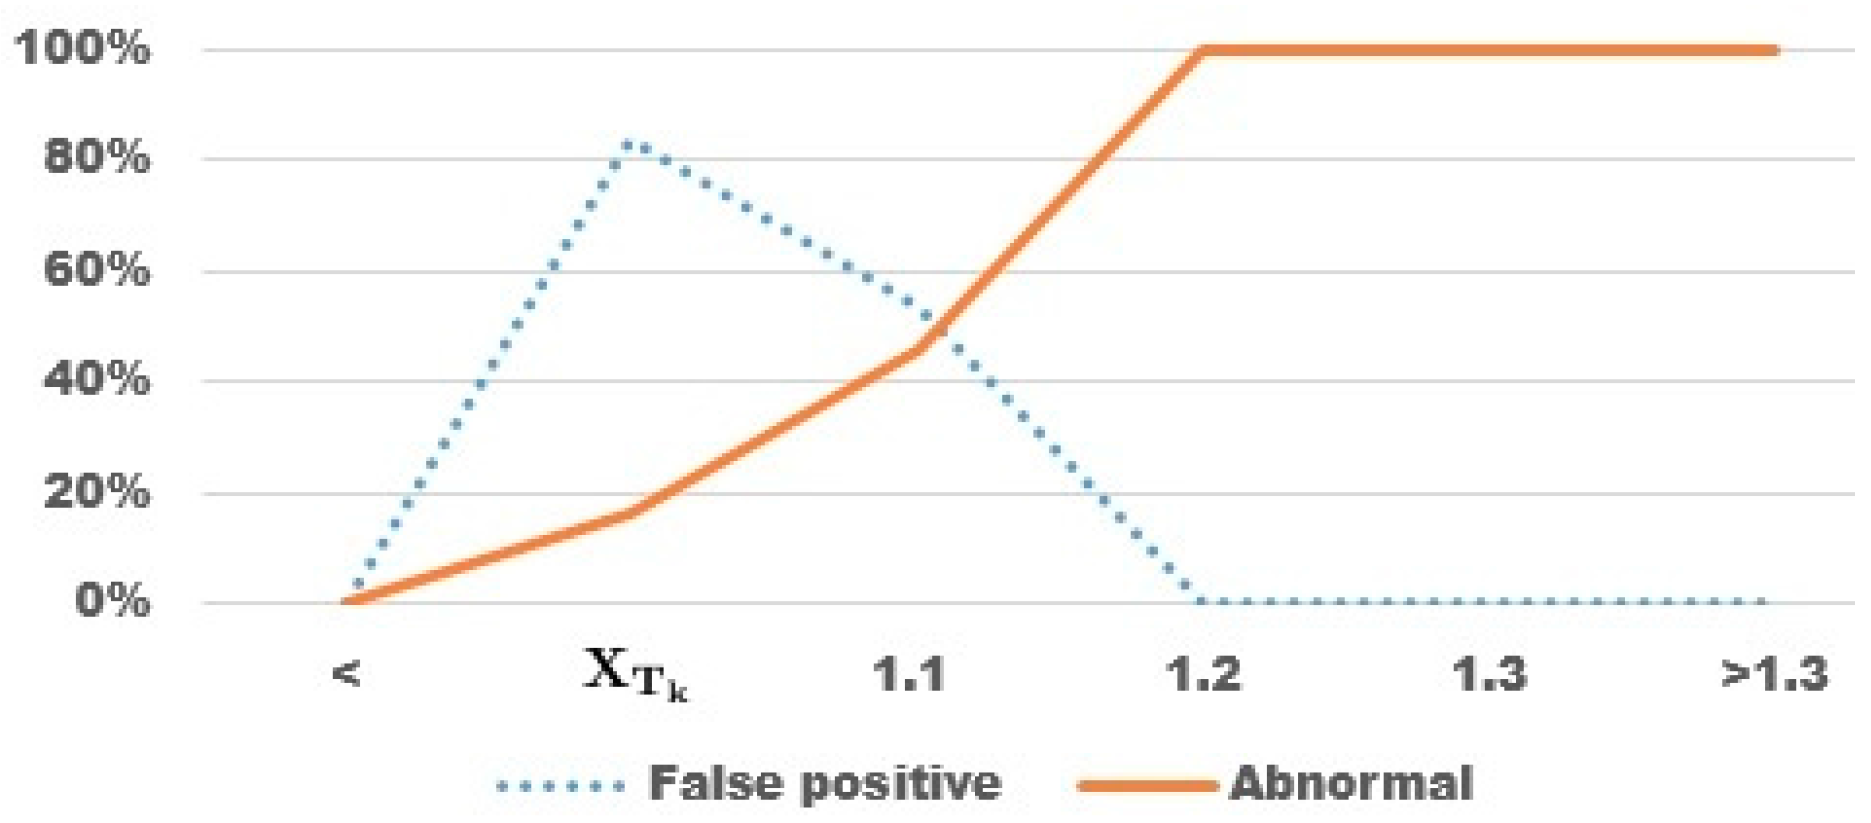
This step consists of individually identifying every abnormal uptake R O I # . So for every I k we create a binary map I k m a s k , of same size as I k , of selected pixels in sub-image R O I # where
x i j = { 1 ,   ( i , j ) R O I X T k 0 , o t h e r w i s e
Recalling that a given pixel is a 4-neighbour of some other I k m a s k pixel if they share an edge, whereas a 4-connected component in a binary map is a region formed by pixels of the same value where each pixel is a 4-neighbour of another pixel in that region, we now identify inside each of them all 4-connected components R O I 1 k ,   , R O I m k formed by pixels set to 1.
Each isolated high intensity peak on a uniform light intensity area matches directly with a 4-connected component with all of its pixels with a very similar high grey level. Other abnormal uptake regions could match with 4-connected components formed by a group of pixels whose levels of intensity may spread between X T k and X m a x . An example of the results of the detection process is shown in Figure 2.
Once all the abnormal regions R O I 1 k ,   , R O I m k are identified we proceed to calculate their respective entropy as the average uptake measurement Q I ( R O I # ) ¯ .
Values of Q I ( R O I # ) ¯ higher than Q I ¯ are very likely to correspond to pathological uptake regions, while R O I # with Q I ( R O I # ) ¯ lower than Q I ¯ . are marked as uncertain uptake, so we sort them in descending order.
Also, the value Q I ( R O I # ) ¯ allows comparison with the evolution in time of that given ROI which enables the verification of the effectiveness of the treatment.

4. Results

The experimental set contains 48 whole-body 123I-mIBG scintigraphies, taken with different gamma-cameras, belonging to 22 children under 14 labeled patients P A 1 to P A 22 , suffering from neuroblastoma. We have at least one scan of each patient and for twelve of them, we have a series of two or more scintigraphies in times T 1 , T 2 , etc.
We split the test set into two subsets. The first subset is formed by the first scintigraphy of each patient’s series. We used this subset of 22 scintigraphies in order to estimate the parameters of the algorithm. The second subset is formed by the rest of the scans of every patient. We used it to test an algorithm with fixed parameters.
The ROIs to be automatically identified at scan correspond to the specific uptake at tumours and metastatic sites when the pathological pattern is present. There is always a visible physiological uptake in some trunk sites such as the bladder and the liver, and they are also considered ROI. In the first subset, we tested different approximations to X T h r e s . First we took measurements of Q I ¯ and Q I k ¯ separating sectors with the physiological pattern from those with the pathological other. Values of Q I k ¯ greater than Q I ¯ . were observed when the pathological pattern is not visible in the image of a given limb sector k. In such cases, the image of sectors had a very low definition because of the low number of samples. We estimate then that a given limb sector k with possible abnormal uptake should have a value of R k < 1 in Equation (7).
We considered X T G l o b a l defined in Equation (4) as the threshold for every SIOPEN sector. We started by taking C G = 1 and an exploring sub-window W 3 of size 3 × 3 pixels. Results are shown in Table 1.
X T G l o b a l as a single grey threshold of abnormal uptake detected 70.4% of ROIs. It showed an extremely low false positive rate of only 2.8% in total. Nevertheless, it had a high false negative rate in the rest of areas, especially at sectors I 5 , I 6 , I 10 and I 12 .
Then we made tests with a different X T k for each SIOPEN sector as defined in Equation (10). We started by taking a value of ρ k = 3 and C k = 1 at each sector. With these settings we obtained a high false positive rate on legs and arms because of the low photon counts at those sectors making I k ¯ low while the peaks of lesions were much higher than Q I k ¯ . In order to reduce false positives, we increased C k for limb sectors up to C k = 3 .
Finally, we processed the second test subset by using an exploring sub-window W 3 and taking C G = 1 . At limb sectors we set ρ k = 3 and C k = 3 and we did not search inside if R k < 1 in Equation (7). Results are shown in Table 2, and a summary of the procedure in Table 3.
A total of 96.7% of ROIs were detected. It showed a lower overall false negative rate of 3.3%. On the other hand, it had a global false positive rate of 16.0%.
The chart in Figure 3 allows establishing a probability model based on experience by using the success rate obtained in the classification of ROIs detected. In the vertical axis, relative frequency of being abnormal is displayed according to the intensity of a given detected R O I # . Relative frequency of being abnormal is greater than 50% when intensity is higher than 95% of X T G l o b a l .
The probability of being abnormal increases with intensity. If we connect the obtained intensity value in a given ROI with the value in the sector in which it is found X T k , it has a chance of about 50% of being abnormal when intensity of a detected ROI is greater than 1.1 times X T k and it is close to 100% when it is greater than 1.2 times X T k , as we can see in Figure 4.

5. Discussion

X T G l o b a l was a good threshold, especially in trunk sector I T , with a false negative rate of 0%. As expected, any region selected at any SIOPEN sector with X T G l o b a l with C G = 1 had a high confidence level of being a pathological uptake region. Increasing C G would not improve results, since false negative happened because of peaks in limbs with low intensity.
When identifying sectors in images such as the trunk or the head, the frame boundaries were much more precise. However, when selecting others, such as arms or legs, it was very complicated to differentiate between outside and inside the body. It was because degradation of the image is usually higher on these image parts because of the motion of children. Although the patient body is usually placed in the supine position with the arms down alongside the body, in some scans they appeared bent or with the hands up. Another factor was the usual low number of counts in limbs, especially in distal parts. The lack of enough counts blurs the body limits.
That is why these false positives happen mainly at sectors I 5 and I 6 . In the other sectors, false positive findings with X T k are those which have low Q I ( R O I # ) ¯ . As Q I ( R O I # ) ¯ increases, R O I # is more probably a pathological uptake region. When it is higher than Q I ¯ it is very likely to be so.
In general, false positives did not pose a problem to radiologists as it is worth paying attention to any region with an increased intensity higher than the local average.
As likelihood values of being abnormal based on intensity are calculated from samples, a probability model could be enhanced as long as more scans are analyzed and the results incorporated.
Finally, as appointed in Section 2, there is not any other work using this type of scintigraphies where the bones are not always visible, hence why it is not possible to establish a comparison of the results obtained with any other image processing method.

6. Conclusions

A process to automatically identify and delineate abnormal high uptake regions in the whole-body 123I-mIBG scintigraphies, studying neuroblastoma in children, is proposed for assisting physicians in staging a response to therapy assessment by pointing out the areas with the evidence of an uptake higher than an objective threshold of abnormal uptake.
This information extraction from scintigraphies facilitates the following of the evolution of the illness over time in an objective way, by assigning a measurement for every uptake that could be considered as its entropy.
Peaks of higher intensity than expected are the main variable analyzed by clinicians in order to identify tumours and metastatic sites and it is also the main variable used in our method.
We tested, with success, its use with the SIOPEN sectors as the fixed reference for where to calculate the abnormal thresholds X T G l o b a l and X T k , thus it could assist in the application of this validated scoring method. By using the local estimation X T k , 96.7% of ROIs were detected and it showed a low overall false negative rate of 3.3%.
Likelihood values of being abnormal, based on intensity, could be calculated from samples. Relative frequency of being abnormal is higher than 50% when intensity of the ROI is greater than 1.1 times X T k and about 100% when it is greater than 1.2 times X T k . With the aim of improving the results reducing false positives, the body division into SIOPEN sectors should be done very accurately and the likelihood model enhanced as more scans are analyzed.

Acknowledgments

The use of the scintigraphies for this study was approved by the La Fe Hospital’s Biomedical Research Ethics Committee. The authors are grateful to La Fe physicians for their collaboration.

Author Contributions

Guillermo Peris-Fajarnés and Luis M. Sánchez-Ruiz conceived the experiments; Rafael Martínez-Díaz designed and performed the experiments; Rafael Martínez-Díaz, Guillermo Peris-Fajarnés and Luis M. Sánchez-Ruiz analyzed the data and contributed materials and analysis; all authors tested the results; Rafael Martínez-Díaz and Milagros Martínez-Díaz wrote the draft paper, Luis M. Sánchez-Ruiz and Guillermo Peris-Fajarnés revised and approved the final manuscript. All authors have read and approved the final manuscript.

Conflicts of Interest

The authors declare no conflict of interest.

References

  1. Charron, M. Contemporary approach to diagnosis and treatment of neuroblastoma. Q. J. Nucl. Med. Mol. Imaging 2013, 57, 40–52. [Google Scholar] [PubMed]
  2. Olivier, P.; Colarinha, P.; Fettich, J.; Fischer, S.; Frokier, J.; Giammarile, F.; Gordon, I.; Hahn, K.; Kabasakal, L.; Mann, M.; et al. Guidelines for radioiodinated mIBG scintigraphy in children. Eur. J. Nucl. Med. Mol. Imaging 2003, 30, B45–B50. [Google Scholar] [CrossRef] [PubMed]
  3. Lim, J.S. The Adaptive Wiener Filter. In Two-Dimensional Signal and Image Processing, 1st ed.; Prentice-Hall, Inc.: Upper Saddle River, NJ, USA, 1990; pp. 536–540. [Google Scholar]
  4. Krom, A.; Wickham, F.; Hall, M. Evaluation of image enhancement software as a method of performing half-count bone scans. Nucl. Med. Commun. 2013, 34, 78–85. [Google Scholar] [CrossRef] [PubMed]
  5. Hannequin, P.; Mas, J. Statistical and heuristic image noise extraction (SHINE): A new method for processing Poisson noise in scintigraphic images. Phys. Med. Biol. 2002, 47, 4329–4344. [Google Scholar] [CrossRef] [PubMed]
  6. Martínez-Díaz, R.; Balaguer, J.; Sánchez-Ruiz, L.; Bello, P.; Castel, V.; Perís-Fajarnés, G. On analytical methods in neuroblastoma detection. Abstr. Appl. Anal. 2013, 2013, 341346. [Google Scholar] [CrossRef]
  7. Martínez-Díaz, R.; Balaguer, J.; Sánchez Ruiz, L.; Bello, P.; Castel, V.; Rivas, A.; Cañete, A.; Falgas, M.; Luis Loaiza, J.; Perís-Fajarnés, G. Quantitative approach to assist neuroblastoma assesment by measuring I-123 mIBG uptake in scintigraphic images. Image Anal. Stereol. 2015, 34, 135–144. [Google Scholar]
  8. Hasegawa, B.; Tang, H.; Da Silva, A.J.; Wong, K.; Iwata, K.; Wu, M. Dual-modality imaging. Nucl. Instrum. Methods Phys. Res. 2001, 471, 140–144. [Google Scholar] [CrossRef]
  9. Brisse, H.; McCarville, M.; Granata, C.; Krug, K.; Wootton-Gorges, S.; Kanegawa, K.; Giammarile, F.; Schmidt, M.; Shulkin, B.; Matthay, K.; et al. Guidelines for imaging and staging of neuroblastic tumors: Consensus report from the international neuroblastoma risk group project. Radiology 2011, 261, 243–257. [Google Scholar] [CrossRef] [PubMed]
  10. Rufini, V.; Giordano, A.; Di Giuda, D.; Petrone, A.; Deb, G.; De Sio, L.; Donfrancesco, A.; Troncone, L. 123I-mIBG scintigraphy in neuroblastoma: A comparison between planar and SPECT imaging. Q. J. Nucl. Med. 1995, 39, 25–28. [Google Scholar] [PubMed]
  11. Gelfand, M.; Elgazzar, A.; Kriss, V.; Masters, P.; Golsch, G. Iodine-123-mIBG SPECT versus planar imaging in children with neural crest tumors. J. Nucl. Med. 1994, 35, 1753–1757. [Google Scholar] [PubMed]
  12. Keidar, Z.; Israel, O.; Krausz, Y. SPECT/CT in tumor imaging: Technical aspects and clinical applications. Semin. Nucl. Med. 2003, 33, 205–218. [Google Scholar] [CrossRef] [PubMed]
  13. Matthay, K.; Shulkin, B.; Ladenstein, R.; Michon, J.; Giammarile, F.; Lewington, V.; Pearson, A.; Cohn, S. Criteria for evaluation of disease extent by 123I-metaiodobenzylguanidine scans in neuroblastoma: A report for the International Neuroblastoma Risk Group (INRG) Task Force. Br. J. Cancer 2010, 102, 1319–1326. [Google Scholar] [CrossRef] [PubMed]
  14. Ady, N.; Zucker, J.; Asselain, B.; Edeline, V.; Bonnin, F.; Michon, J.; Gongora, R.; Manil, L. A new 123I-mIBG whole body scan scoring method—Application to the prediction of the response of metastases to induction chemotherapy in stage IV neuroblastoma. Eur. J. Cancer 1995, 31, 256–261. [Google Scholar] [CrossRef]
  15. Suc, A.; Lumbroso, J.; Rubie, H.; Hattchouel, J.; Boneu, A.; Rodary, C.; Robert, A.; Hartmann, O. Metastatic neuroblastoma in children older than one year: Prognostic significance of the initial metaiodobenzylguanidine scan and proposal for a scoring system. Cancer 1996, 77, 805–811. [Google Scholar] [CrossRef]
  16. Perel, Y.; Conway, J.; Kletzel, M.; Goldman, J.; Weiss, S.; Feyler, A.; Cohn, S. Clinical impact and prognostic value of metaiodobenzylguanidine imaging in children with metastatic neuroblastoma. J. Pediatr. Hematol. Oncol. 1999, 21, 13–18. [Google Scholar] [CrossRef] [PubMed]
  17. Matthay, K.; Edeline, V.; Lumbroso, J.; Tanguy, M.; Asselain, B.; Zucker, J.; Valteau-Couanet, D.; Hartmann, O.; Michon, J. Correlation of early metastatic response by 123I-metaiodobenzylguanidine scintigraphy with overall response and event-free survival in stage IV neuroblastoma. J. Clin. Oncol. 2003, 21, 2486–2491. [Google Scholar] [CrossRef] [PubMed]
  18. Katzenstein, H.; Cohn, S.; Shore, R.; Bardo, D.; Haut, P.; Olszewski, M.; Schmoldt, J.; Liu, D.; Rademaker, A.; Kletzel, M. Scintigraphic response by 123I-metaiodobenzylguanidine scan correlates with event-free survival in high-risk neuroblastoma. J. Clin. Oncol. 2004, 22, 3909–3915. [Google Scholar] [CrossRef] [PubMed]
  19. Messina, J.; Cheng, S.; Franc, B.; Charron, M.; Shulkin, B.; To, B.; Maris, J.; Yanik, G.; Hawkins, R.; Matthay, K. Evaluation of semiquantitative scoring system for metaiodobenzylguanidine (mIBG) scans in patients with relapsed neuroblastoma. Pediatr. Blood Cancer 2006, 47, 865–874. [Google Scholar] [CrossRef] [PubMed]
  20. Yanik, G.; Parisi, M.; Shulking, B.; Naranjo, A.; Kreissman, S.; London, W.; Villablanca, J.; Maris, J.; Park, J.; Cohn, S.; et al. Semiquantitative mIBG scoring as a prognostic indicator in patients with stage 4 neuroblastoma: A report from the children’s oncology group. J. Nucl. Med. 2013, 54, 541–548. [Google Scholar] [CrossRef] [PubMed]
  21. Decarolis, B.; Scheneider, C.; Hero, B.; Simon, T.; Volland, R.; Roels, F.; Dietlein, M.; Berthold, F.; Schmidt, M. Iodine-123 metaiodobenzylguanidine scintigraphy scoring allows prediction of outcome in patients with stage 4 neuroblastoma: Results of the cologne interscore comparison study. J. Clin. Oncol. 2013, 31, 944–951. [Google Scholar] [CrossRef] [PubMed]
  22. Lewington, V.; Sever, Z.; Lynch, T.; Giammarile, F.; McEwan, A.; Shulkin, B.; Staudenherz, A.; Ladenstein, R. Development of a new, semiquantitative I-123 mIBG reporting method in high risk neuroblastoma. Eur. J. Nucl. Med. Mol. Imaging 2009, 50, 1379–1379. [Google Scholar]
  23. Lewington, V.; Poetschger, U.; Boubaker, A.; Bar-Sever, Z.; Drake, B.; Staudenherz, A.; Castellani, M.R.; Lambert, B.; Grange, K.; Brock, P.; et al. The prognostic value of semi-quantitative 123I-mIBG scintigraphy at diagnosis in high-risk neuroblastoma: Validation of the SIOPEN score method. J. Clin. Oncol. 2011, 29, 9511. [Google Scholar]
  24. Yin, T.; Chiu, N. A computer-aided diagnosis for locating abnormalities in bone scintigraphy by a fuzzy system with a three-step minimization approach. IEEE Trans. Med. Imaging 2004, 23, 639–654. [Google Scholar] [CrossRef]
  25. Jia-Yann, H.; Pan-Fu, K.; Yung-Sheng, C. A set of image processing algorithms for computer-aided diagnosis in nuclear medicine whole body bone scan images. IEEE Trans. Nucl. Sci. 2007, 54, 514–522. [Google Scholar]
  26. Sajn, L.; Kononenko, I.; Milcinski, M. Computerized segmentation and diagnostics of whole-body bone scintigrams. Comput. Med. Imaging Graph. 2007, 31, 531–541. [Google Scholar] [CrossRef] [PubMed]
  27. Sajn, L.; Kukar, M.; Kononenko, I.; Milcinski, M. Computerized segmentation of whole-body bone scintigrams and its use in automated diagnostics. Comput. Meth. Programs Biomed. 2005, 80, 47–55. [Google Scholar] [CrossRef] [PubMed]
  28. Jeong, C.; Kim, K.; Kim, T.; Kim, S. Comparison of image enhancement methods for the effective diagnosis in successive whole-body bone scans. J. Digit. Imaging 2011, 24, 424–436. [Google Scholar] [CrossRef] [PubMed]
  29. Wesolowski, C.; Yahil, A.; Puetter, R.; Babyn, P.; Gilday, D.; Khan, M. Improved lesion detection from spatially adaptive, minimally complex, Pixon reconstruction of planar scintigraphic images. Comput. Med. Imaging Graph. 2005, 29, 65–81. [Google Scholar] [CrossRef] [PubMed]
  30. Bombardieri, E.; Giammarile, F.; Aktolun, C.; Baum, R.; Delaloye, A.; Maoli, L.; Moncayo, R.; Mortelmans, L.; Pepe, G.; Reske, S.; et al. 131I/123I-metaiodobenzylguanidine (mIBG) scintigraphy procedures guidelines for tumour imaging. Eur. J. Nucl. Med. Mol. Imaging 2010, 37, 2436–2446. [Google Scholar] [CrossRef] [PubMed]
  31. King, M.; Doherty, P.; Schwinger, R.; Penney, B. A Wiener Filter for nuclear medicine images. Med. Phys. 1983, 10, 876–880. [Google Scholar] [CrossRef] [PubMed]
  32. King, M.; Schwinger, R.; Doherty, P.; Penney, B. Two-dimensional filtering of SPECT images using the Metz and Wiener filters. J. Nucl. Med. 1984, 25, 1234–1240. [Google Scholar]
  33. Vieira, M.; Bakic, P.; Maidment, A.; Schiabel, H.; Mascarenhas, N. Filtering of poisson noise in digital mammography using local statistics and adaptive wiener filter. In Breast Imaging; Maidment, A.D.A., Bakic, P.R., Gavenonis, S., Eds.; Springer Berlin Heidelberg: Philadelphia, PA, USA, 2012; pp. 268–275. [Google Scholar]
Figure 1. (a) The SIOPEN semi-quantitative scoring method divides the skeleton into 12 anatomic segments; (b) View of patient PA2 in time T1; (c) Idem in time T2; (d) Regions excluded: salivary glands with uptake always present; at lower limbs, all except bones where metastases are localized.
Entropy 18 00349 g001
Figure 2. An example of an analysis of two 123I-mIBG scans of a patient P A 2 . On (a), original scan with no disease and the automatically selected regions are due to physiological uptake. Detected regions match with two big 4-connected regions: the liver and the bladder. On (b), original scan with metastases. The automatically selected regions are several small 4-connected regions at the head and limbs. The trunk, the spine, the liver and the tailbone are grouped together in a big 4-connected region.
Entropy 18 00349 g002
Figure 3. Chart which connects the probability of a ROI detected being abnormal as function of its intensity in relation to the global value X T G l o b a l .
Entropy 18 00349 g003
Figure 4. Chart which connects the probability of a detected ROI to be a false positive or a correct detection, as a function of its intensity value in respect to its sector X T k .
Entropy 18 00349 g004
Table 1. Percentage of detections by this quantitative method. True results are confirmed by physicians using qualitative methods. False positive occurs when a region is wrongly detected according to the physician’s reports. A false negative occurs when a ROI is not detected.
%False Positive%False Negative
I10.0%25.0%
IT4.2%0.0%
I30.0%50.0%
I40.0%36.4%
I50.0%100.0%
I60.0%75.0%
I90.0%54.6%
I100.0%58.3%
I110.0%83.3%
I120.0%83.3%
Totals:2.8%29.6%
Results with global threshold X T G l o b a l
Table 2. Regions of interest (ROI) detected by changing the threshold value used in Table 1.
%False Positive%False Negative
I111.1%0.0%
IT4.2%0.0%
I310.0%0.0%
I421.4%0.0%
I562.5%0.0%
I663.6%0.0%
I90.0%18.2%
I109.1%16.7%
I1114.3%0.0%
I120.0%14.3%
Totals:16.0%3.3%
Results with local threshold X T k
Table 3. Procedure of detection of ROI at each sector.
X T G l o b a l = I ¯ + σ I Q I ¯
I k { I 1 ,   I 12 } do
   S T k = I k ¯ + σ I k 3 Q I k ¯
R k = Q I ¯ Q I k ¯
  if ( R k   1 ) then X T k = X T G l o b a l
else if ( X T G l o b a l > 3   S T k ) then X T k =   X T G l o b a l
  else X T k =   S T k
end if
end if
  R O I X T k = { ( i , j ) I k :   x i j [ X T k ,   X m a x ] }
Done
The parameter C G = 1 is used in order to calculate the X T G l o b a l , and ρ k = 3 and C k = 3 for S T k .

