Article

Wavelet Entropy as a Measure of Ventricular Beat Suppression from the Electrocardiogram in Atrial Fibrillation

School of Engineering, University of Hull, Hull, HU6 7RX, UK
Entropy 2015, 17(9), 6397-6411; https://doi.org/10.3390/e17096397
Submission received: 16 July 2015 / Revised: 9 September 2015 / Accepted: 14 September 2015 / Published: 17 September 2015
(This article belongs to the Special Issue Wavelet Entropy: Computation and Applications)

Abstract

:
A novel method of quantifying the effectiveness of the suppression of ventricular activity from electrocardiograms (ECGs) in atrial fibrillation is proposed. The temporal distribution of the energy of wavelet coefficients is quantified by wavelet entropy at each ventricular beat. More effective ventricular activity suppression yields increased entropies at scales dominated by the ventricular and atrial components of the ECG. Two studies are undertaken to demonstrate the efficacy of the method: first, using synthesised ECGs with controlled levels of residual ventricular activity, and second, using patient recordings with ventricular activity suppressed by an average beat template subtraction algorithm. In both cases wavelet entropy is shown to be a good measure of the effectiveness of ventricular beat suppression.

Graphical Abstract

1. Introduction

Atrial fibrillation is a cardiac arrhythmia in which the small upper chambers of the heart beat rapidly and not coordinated with the large ventricular chambers. It is the most prevalent abnormal heart rhythm in the elderly and a major health concern and drain on health service resources due to an aging population [1,2]. Atrial fibrillation is a significant risk factor for stroke, accounting for a third of all strokes and is a contributing factor for heart failure [1].
There is a range of therapeutic options for atrial fibrillation which attempt to restore the normal heart rhythm or reduce symptoms and stroke risk [1]. However, success rates of restoring sinus rhythm are relatively poor, particularly in patients with the persistent classification of the arrhythmia which is more resilient to termination [1]. Hence the optimum treatment for a specific patient is unknown and is the focus of much clinical research.
The electrocardiogram (ECG) is one of the main diagnostic tools for cardiac disease and arrhythmias. It records the electrical potentials generated by the cardiac muscles and cells that cause the heart to contract and relax. The ECG is completely non-invasive using electrodes placed on the skin at appropriate anatomical locations. The atrial and ventricular activations on the ECG are distinct but because the atrial muscle mass is much smaller than that of the ventricles the electrical signal associated with atrial activation is proportionally smaller. In the case of normal sinus rhythm, the atrial activation is seen as a distinct feature on the ECG called the P wave which, although small in amplitude, can be readily observed because it occurs when the ventricles are electrically quiescent. However, in the case of atrial fibrillation where the atria beat continuously and rapidly, there is no discrete P wave and atrial activations manifest as a low amplitude and rapidly fluctuating signal called the fibrillatory wave or f-wave. Much of the f-wave is obscured by the large QRST complex which is the manifestation of the electrical activation and recovery phases of each ventricular beat. The f-wave yields useful information about the underlying arrhythmia. For example, the atrial activation rate can be determined non-invasively rather than by invasive electrophysiological study [3,4], it contains information about the complexity of the underlying atrial propagation [5,6] and the effects of treatment can be quantified and predicted [7,8,9,10,11].
Analysis of the continuous f-wave requires suppression of the large ventricular activity from the ECG [8]. Many algorithms have been proposed to achieve this objective [12,13,14,15,16,17,18,19]. These algorithms take advantage of the disassociation of the atrial and ventricular activities to estimate the underlying atrial component during ventricular beats. One such algorithm is average beat subtraction (ABS) [20]. ABS subtracts a template QRST complex at each ventricular beat to provide an estimate of the underlying atrial signal. This template is derived from the average QRST complex from a collection of many beats from the same ECG lead. The disassociation between atrial and ventricular activities ensures there is little atrial activity in the average QRST complex. The effectiveness of the algorithm is limited because beat-by-beat QRST morphology changes due to heart rate fluctuations and respiration for example, so that the average beat cannot accurately represent in all beats the actual beat [21]. This results in residual ventricular activity remaining in the estimated atrial signal. Despite this limitation ABS remains one of the most widely used algorithms in clinical studies [22]. Several enhancements to the basic ABS algorithm have been proposed to ameliorate these limitations but all ventricular suppression algorithms have their limitations and do not completely remove the ventricular activity.
This brings us to the focus of the present study which has the aim of quantifying the effectiveness of ventricular suppression from the ECG in atrial fibrillation using wavelet entropy. Despite the substantial research effort in developing ventricular suppression algorithms, little attention has been given to quantifying the effectiveness of these algorithms in terms of the residual ventricular activity. Some studies have looked at the effectiveness of suppression algorithms in terms of estimated clinical parameters, for example dominant frequency, amplitude of the estimated atrial signals or reduction in spectral power concentration [14,23,24,25,26]. Many studies have used computer simulations or synthesised ECGs with known and completely separable ventricular and atrial activities [17]. In the present study a wavelet based approach is proposed to quantify ventricular activity suppression. Wavelet analysis has been demonstrated to be useful in a range of applications related to ECG analysis [27]. Wavelet analysis is potentially well suited to quantification of residual ventricular activity after QRST suppression because of its ability to localise signal features in time and scale [27].
The aim of the present study is to demonstrate wavelet entropy as a tool to quantify the effectiveness of QRST suppression in the ECG of atrial fibrillation. Note that in this study wavelet analysis is not used to suppress the ventricular activity, the focus is on wavelet techniques for quantifying residual ventricular activity in the QRST suppressed signal and could be applied regardless of the suppression algorithm used. In this study the previously referred to ABS algorithm is used because of its simplicity and known limitations that serve to illustrate the effectiveness of the wavelet residual activity measurement. Examples to illustrate the wider applicability of the approach are also included.

2. Methods

2.1. Ventricular Activity Suppression by Average Beat Subtraction

The aim of ventricular activity suppression is to eliminate the components of the ECG originating from the ventricles so that only the components originating from the atria remain, allowing the analysis of the f-wave unhindered by ventricular activity [25]. The major ventricular components to be suppressed are the QRS complex corresponding to ventricular depolarisation and T wave corresponding to ventricular repolarisation. One of the simplest suppression algorithms is the ABS algorithm. Noting that during atrial fibrillation the atrial and ventricular electrical activities are disassociated enables the calculation of an average ventricular beat template that is free of any underlying atrial activity. Subtraction of the ventricular beat template at each ventricular beat then yields an estimate of the underlying f-wave. The basic ABS algorithm can be enhanced in several ways, for example by morphological clustering or separate QRS and T wave templates [28]. However, for the purpose of the present study only the basic ABS algorithm without these refinements is considered. This serves to illustrate the limitation of the algorithm with the proposed method of quantifying the residual ventricular activity.
The first step of the ABS algorithm was to generate the QRST template specific to the particular ECG lead under analysis. Each ventricular beat was located using an automatic threshold based QRS detector. The locations of the R wave peaks were identified as r(j), j = 1: nb where nb is the total number of beats. Defining the beat window wb = [−w1, ... −2, −1, 0, 1, 2, ... w2] with limits −w1 and w2 which straddle the entire QRST segment relative to the R wave peak, the collection of all QRST segments was constructed
X = [x1, x2,..., xnb]T
where xi is the i-th QRST segment the same length as the beat window.
The average beat template, denoted qrstav, was then calculated as the mean value across all beats according to
q r s t a v ( k ) = 1 n b j = 1 n b X ( k , j )
where k denotes the sample number and j the beat number.
Having derived the average beat template it remains to subtract the template from each beat resulting in the QRST suppressed ECG. Samples outside the beat window remain unchanged.
Inevitably the QRST suppressed ECG contains some residual ventricular activity because the average beat template is not an accurate model of the ventricular activity at every beat. Wavelet analysis was used to detect the residual ventricular activity as described in the following section.

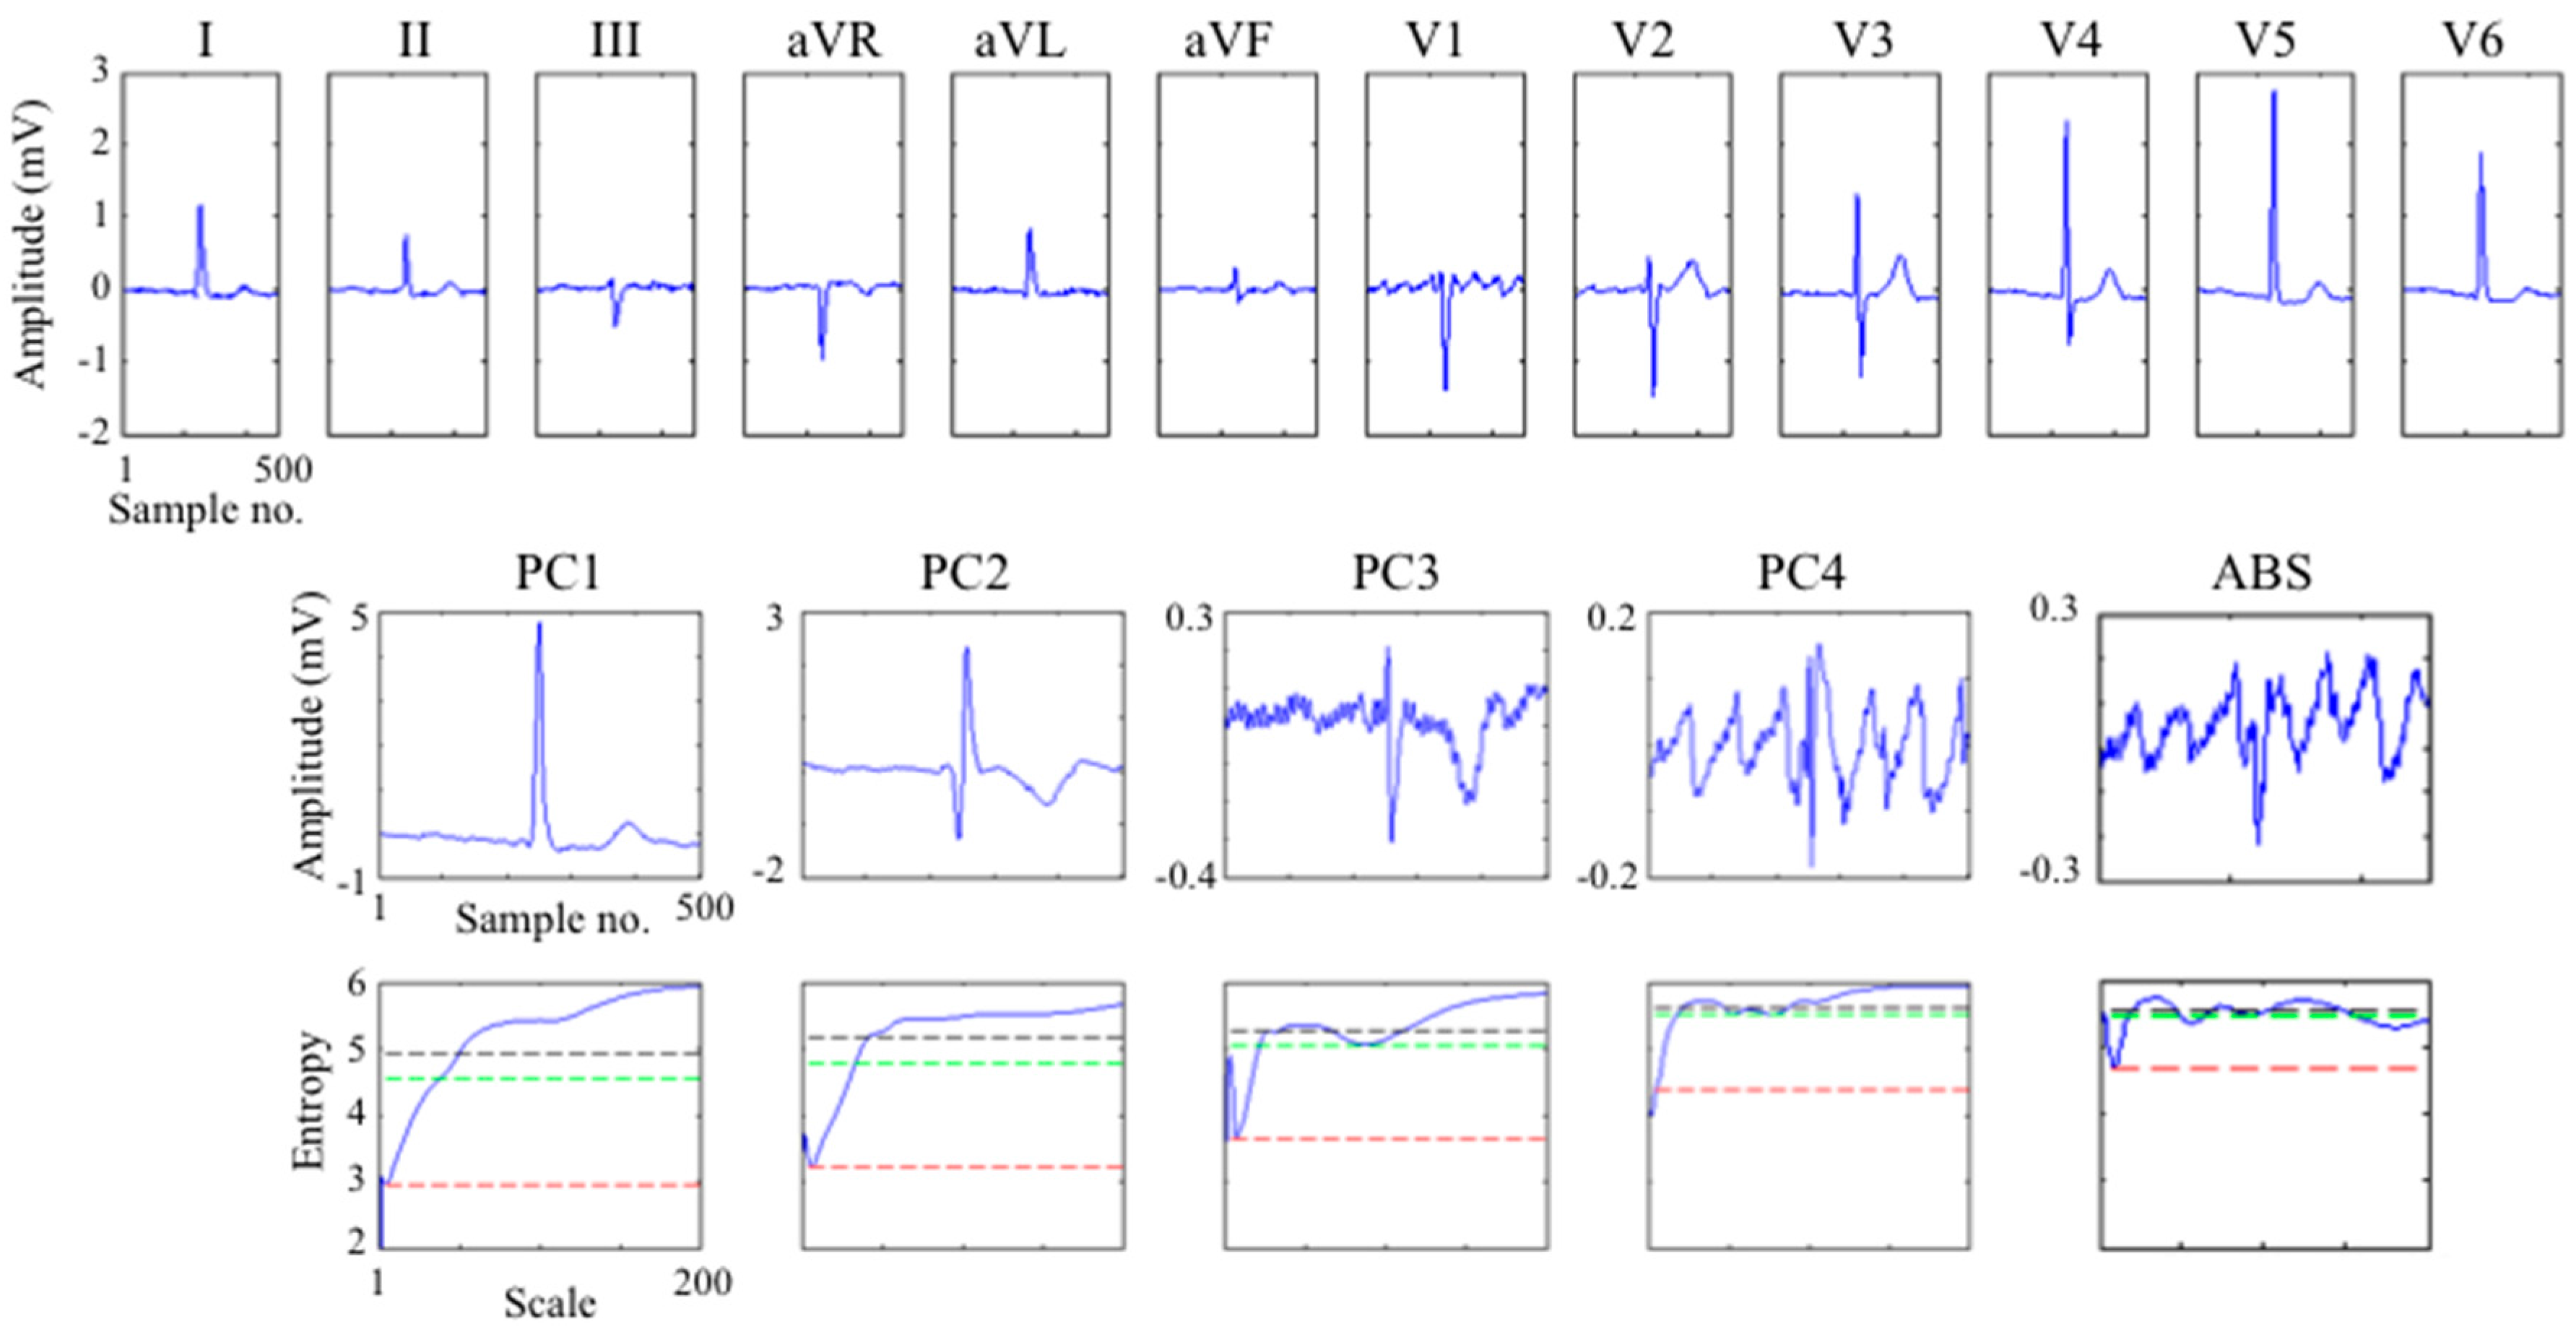
2.2. Wavelet Analysis for Identifying Residual Ventricular Activity

The continuous wavelet transform is the correlation of a signal with an analysing wavelet function across a range of scales and translations of the wavelet function. The mother wavelet has the form
ψ a , b ( t ) = 1 a ψ ( t b a )
and the continuous wavelet transform of the signal x(t) is defined by
T ( a , b ) = 1 a x ( t ) ψ * ( t b a ) d t
where ψ * is the complex conjugate of the wavelet function and a and b are the scale and translation parameters respectively. The transform provides a measure of similarity between the signal and wavelet function at specific scale and translation. There are numerous mother wavelet functions but an appropriate choice is one with similarity of shape to the analysed signal. In practice this choice is not critical as many wavelets have similar properties and are able to characterise similarity with good localisation in both scale and translation. In the present study the n-th order derivative of Gaussian probability density function with general form ψ ( n ) ( t ) = d n ( e t 2 / 2 ) / d t n was used with n = 4 or “Gaus4” wavelet. It was anticipated that this wavelet would provide good localisation of the residual ventricular activity.
Having identified a mechanism for localising the residual ventricular activity using wavelet analysis, a novel wavelet entropy method was then designed to quantify the residual activity.

2.3. Wavelet Entropy Measure of Residual Ventricular Activity

Entropy is well known for its characterisation of the information content of a signal: a highly variable signal yields greater information than one that varies little. This concept has been extended to the frequency and wavelet domains by considering the spectral and wavelet energy distributions [29]. A signal with wide variation in spectral content is considered to yield greater information content and hence has greater entropy than one with a narrow spectral distribution. As such wavelet entropy characterises the ‘organisation’ of a signal and has found use in biomedical applications such as the analysis of EEG and ECG [30,31].
Following wavelet analysis of a signal, the energy at a particular scale and translation is given by
E ( a , b ) = | T ( a , b ) | 2 .
Following a similar definition of the wavelet energy probability distribution by Sello [29], who calculated the distribution across scales at each translation or time point, here the distribution is calculated across translations at each scale according to Equation (6):
P ( a , b ) = | T ( a , b ) | 2 | T ( a , b ) | 2 d b
and the corresponding wavelet entropy is given by
S ( a ) = P ( a , b ) log ( P ( a , b ) ) d b .
In Equations (6) and (7) translation variable b is effectively the time variable, so the integral is across the duration of the signal of interest. In this case the wavelet entropy provides an indication of the temporal distribution of wavelet energy at each scale. The entropy of a scale with a broad temporal energy distribution will be greater than one with a narrow temporal distribution. With regard to the current application to QRST suppressed ECG, any residual ventricular activity will be expressed as wavelet energies which are not evenly temporally distributed but with a periodicity corresponding to the ventricular rate. Conversely, the continuous f-wave will have a relatively constant temporal energy distribution. Further, the atrial and ventricular wavelet energies will likely occur at different scales due to the different frequency content of the QRST and f-waves. Hence the temporal energy distribution may yield information about the effectiveness of ventricular suppression in the ECGs of atrial fibrillation. Optimum suppression of ventricular activity would be expected to maximise the wavelet entropies at scales corresponding to ventricular and atrial activations. To explore the measurement of effectiveness of ventricular activity suppression, three wavelet entropy based indices were defined:
(i)
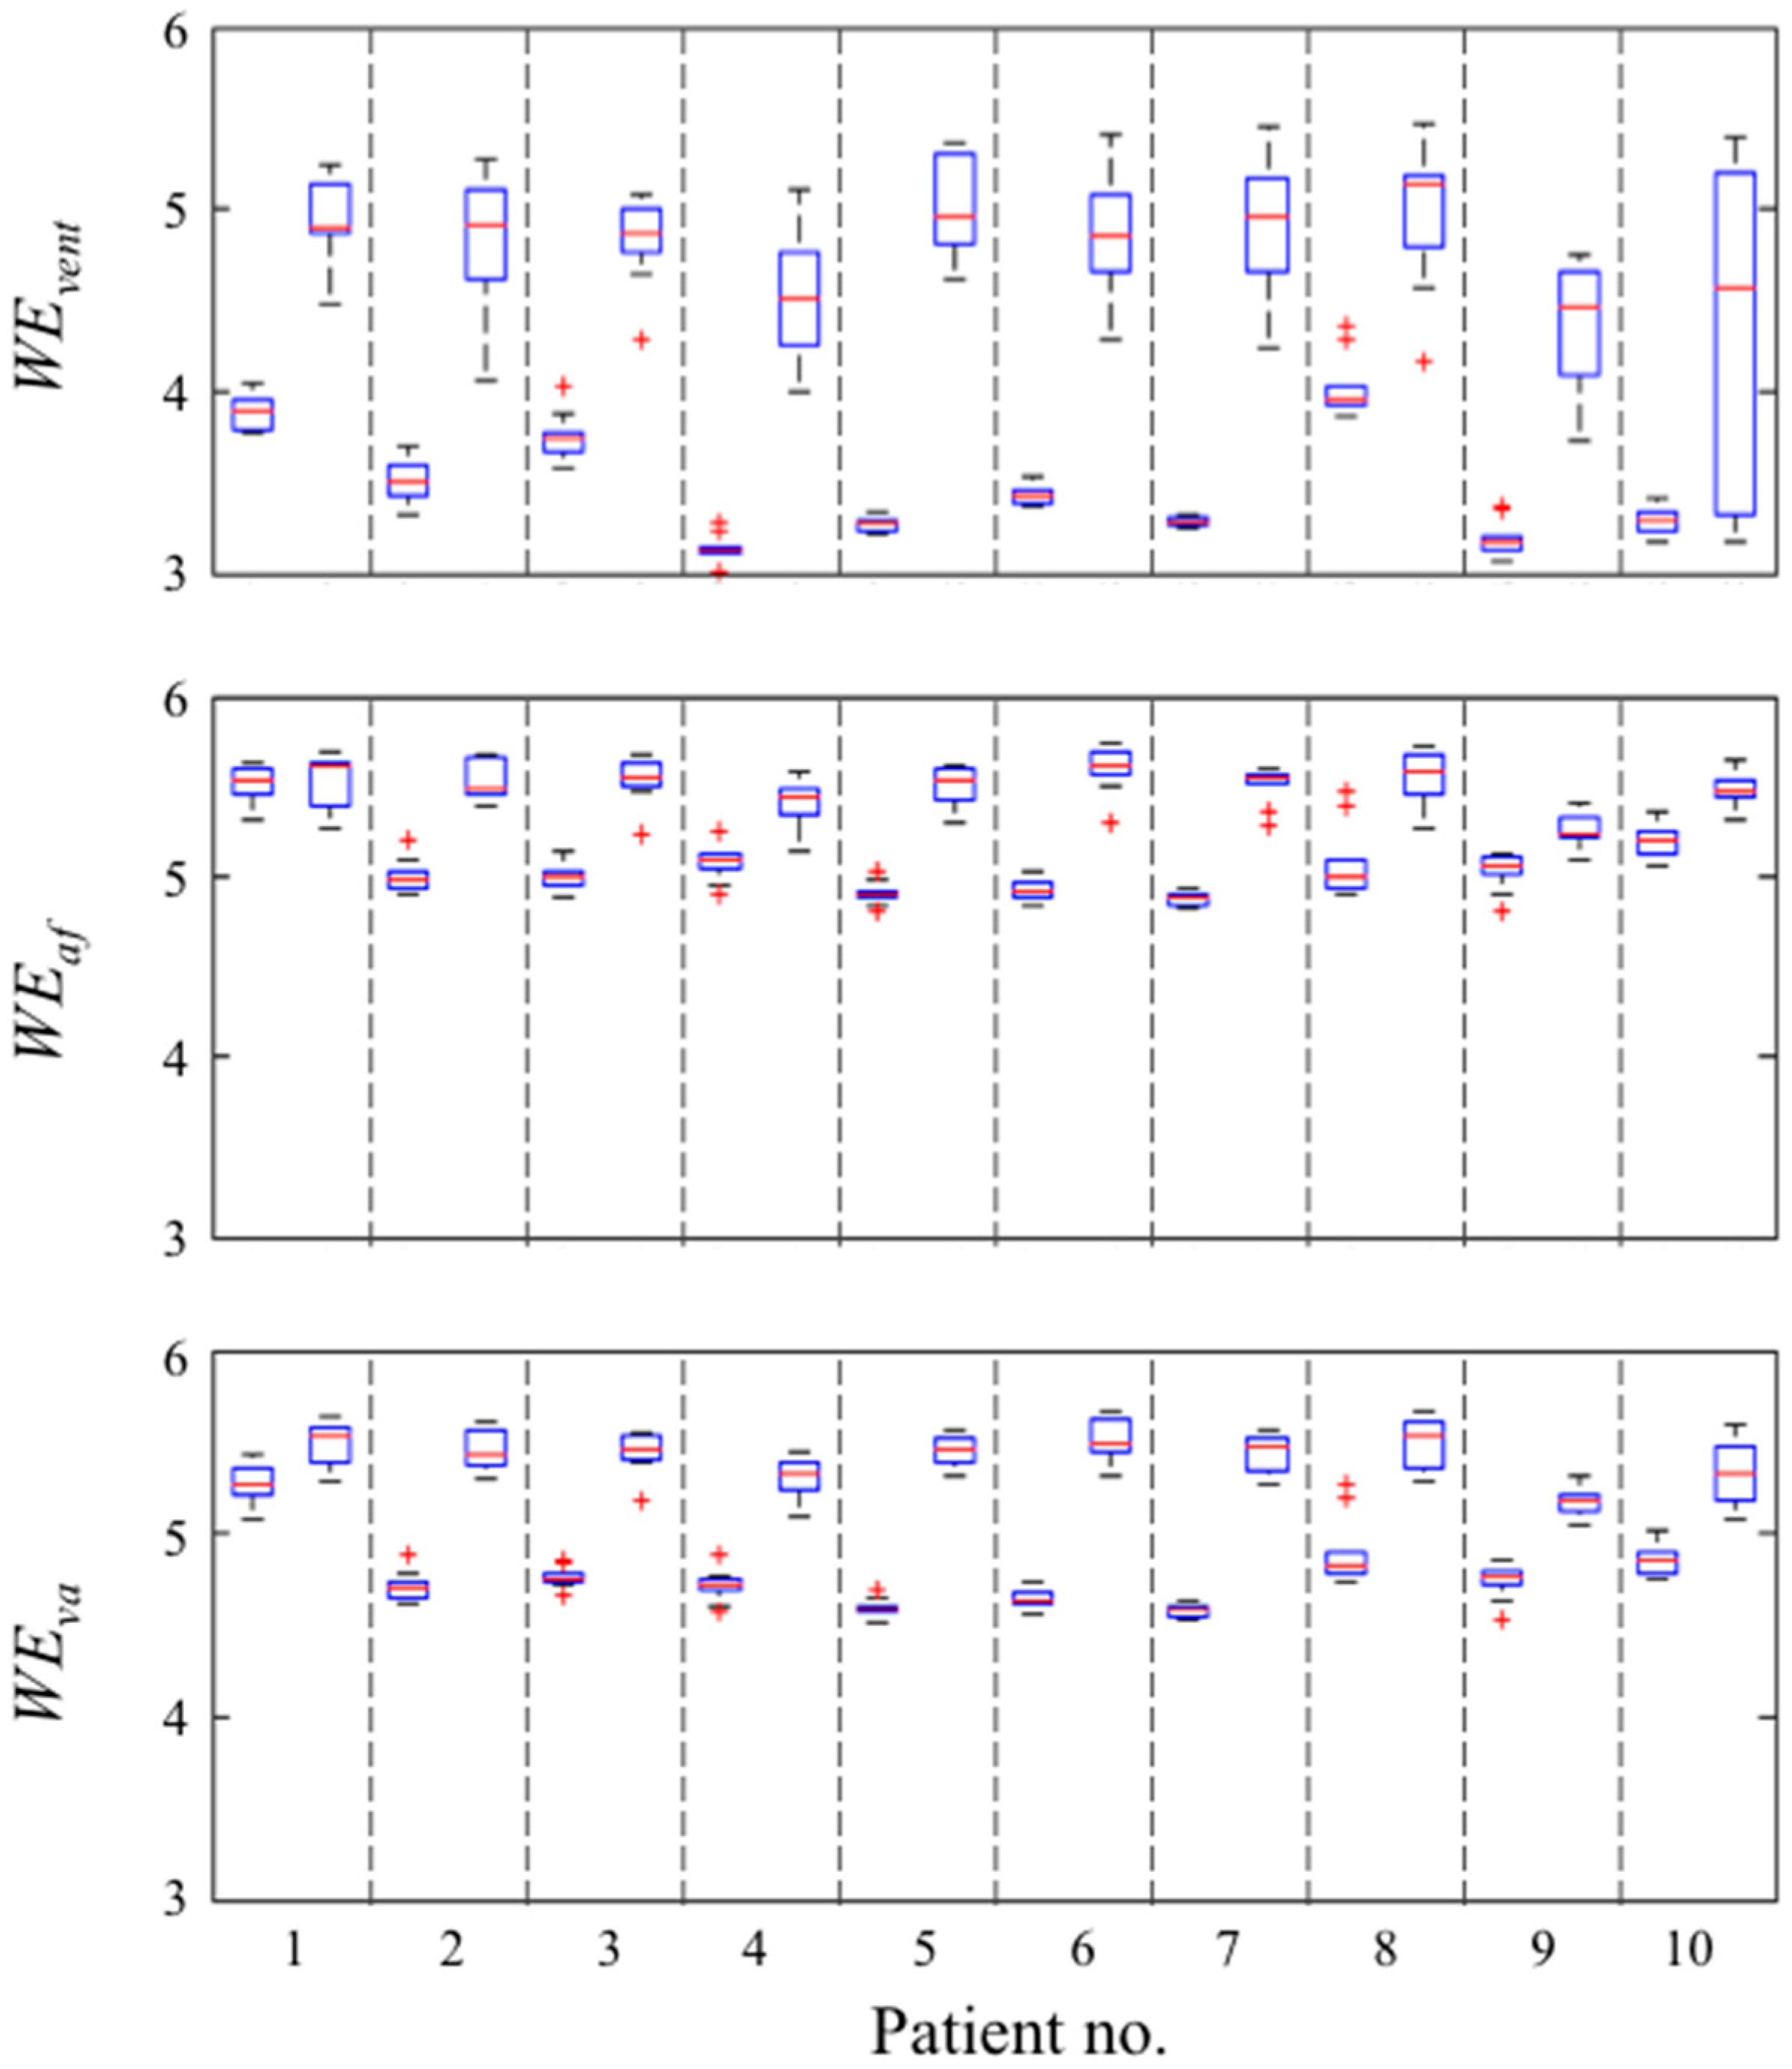
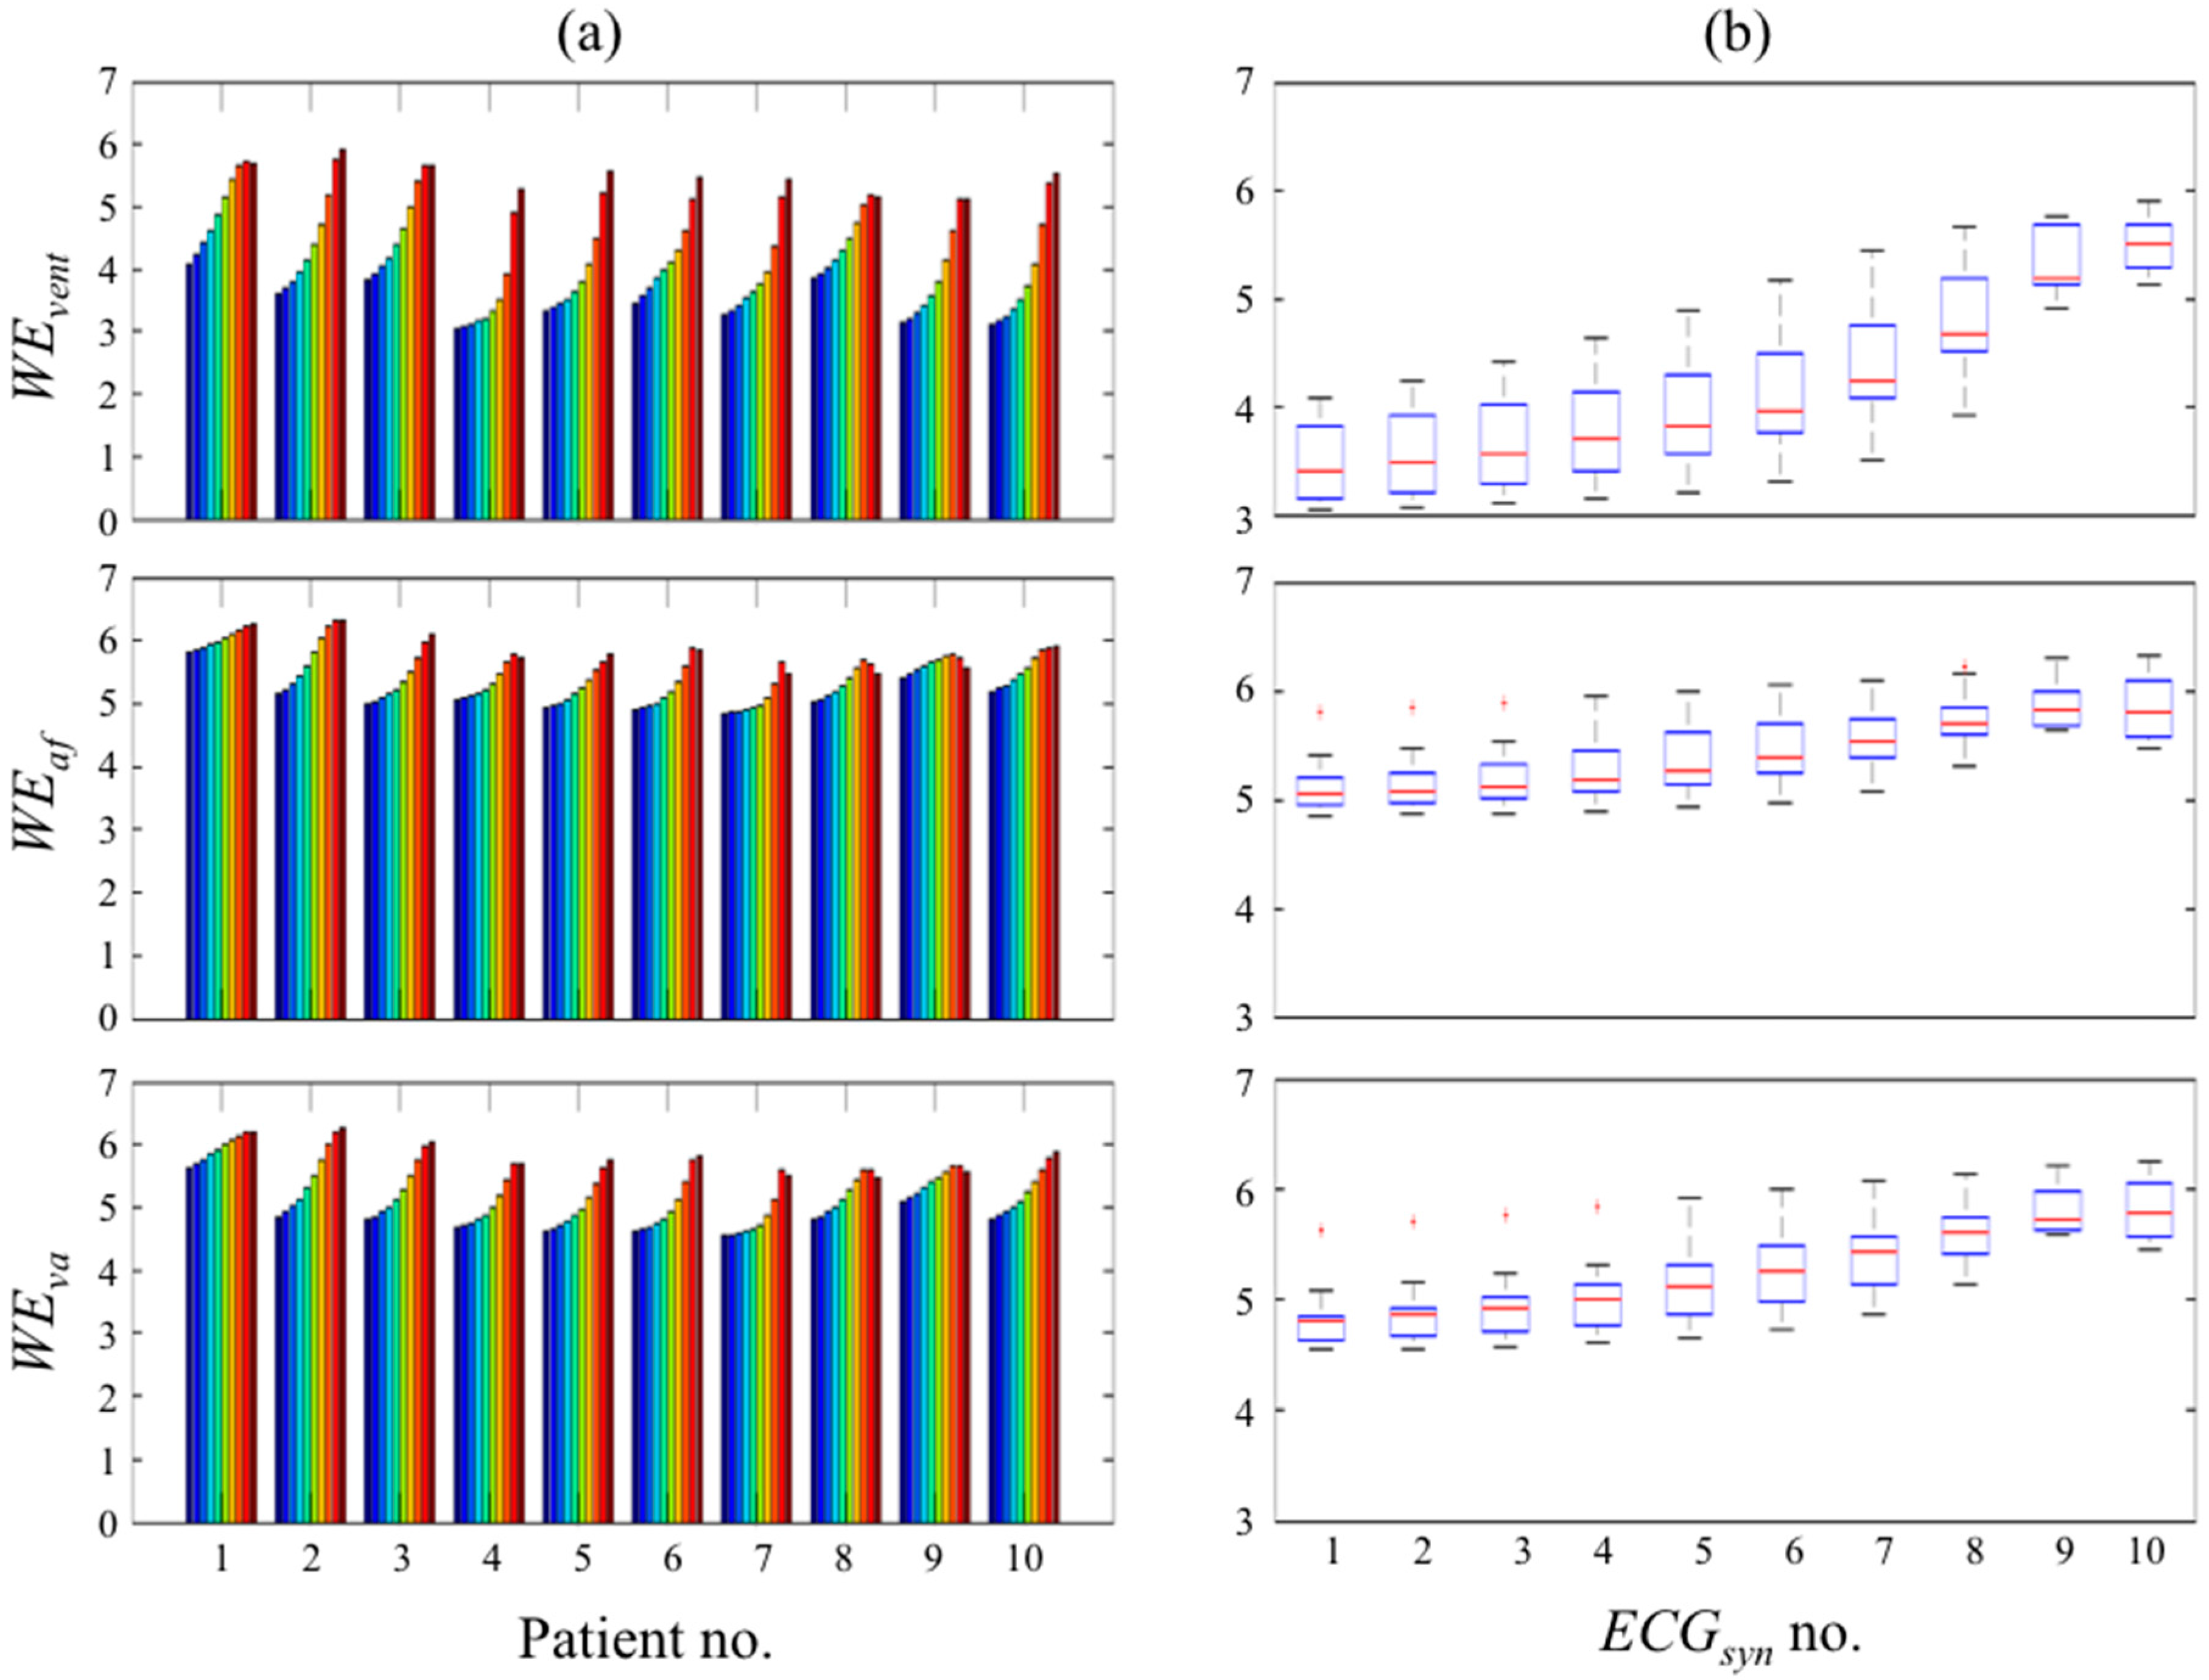
Ventricular scale band wavelet entropy (WEvent) defined as the minimum wavelet entropy at scales corresponding to predominantly ventricular activity. Since the ventricular activity, particularly the QRS complex, contains higher frequency components than the f-wave, the frequency range 12.5 to 50 Hz with corresponding scales for the “Gaus4” wavelet of 20 to 5 respectively was used in this study. Motivation for choosing the minimum entropy in this waveband was the observation that the minimum entropy is highly influenced by the degree of QRS residual.
(ii)
Atrial scale band wavelet entropy (WEaf) defined as the average wavelet entropy across scales corresponding to predominantly the f-wave. The f-wave has frequencies typically in the range 3 to 10 Hz and the corresponding scales for the “Gaus4” wavelet are 80 to 25 respectively for the sample rate used in this study.
(iii)
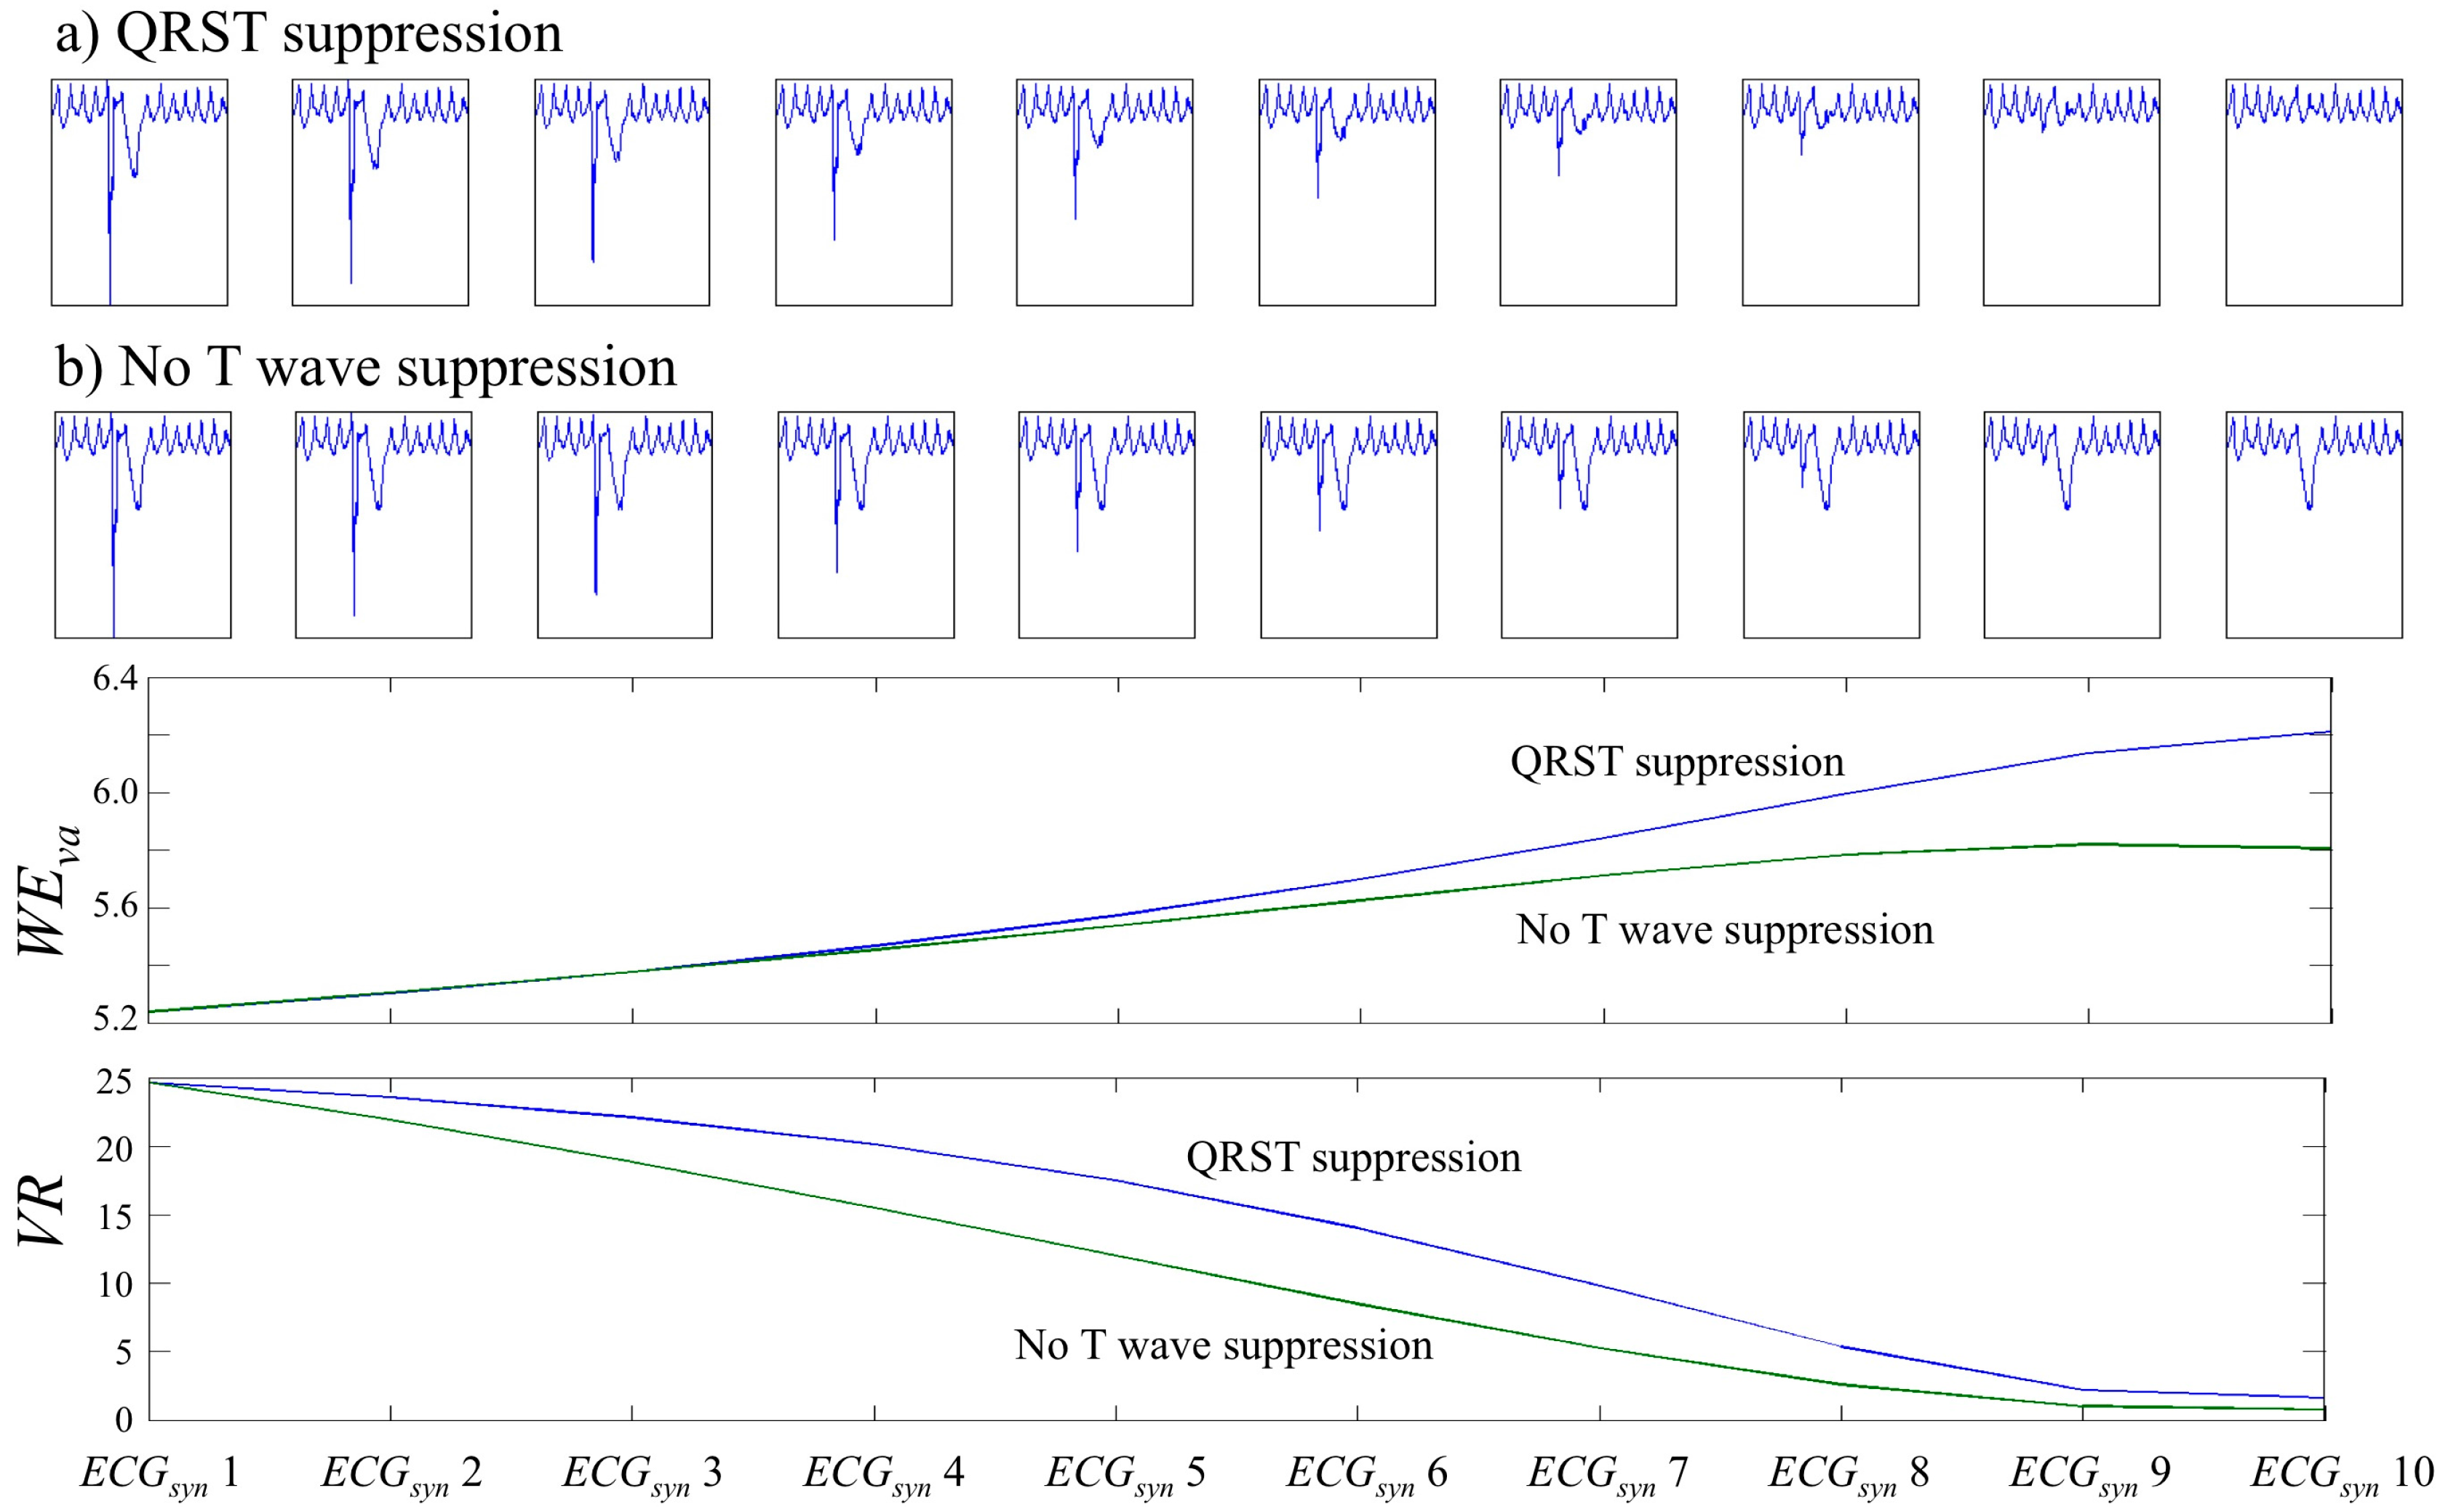
Wide scale ventricular and atrial band wavelet entropy (WEva) defined as the average wavelet entropy across scales containing both the above atrial and ventricular scale bands specifically 5 (minimum scale of WEvent) to 80 (maximum scale of WEaf). This serves to define a single index for quantifying the quality of ventricular suppression taking account of both atrial and ventricular scale wavelet entropies.

3. Experimental Studies and Discussion

Application of the entropy measures of residual ventricular activity from QRST suppressed ECGs in atrial fibrillation was demonstrated in two experimental studies. First, a study with synthesised ECGs in which different amplitudes of residual ventricular activity were simulated. Second, a study on real ECGs of patients in atrial fibrillation to which the ABS ventricular suppression algorithm was applied. Both studies utilised the ECG recordings from 10 atrial fibrillation patients for which ethical approval was obtained and all patients provided informed consent. The ECGs were recorded at a sample rate of 500 Hz, amplitude resolution of 5 µV and bandwidth of 0.05 to 100 Hz. Lead V1 was analysed since it is the most commonly analysed lead for atrial fibrillation studies due to its high amplitude f-wave in most patients [25]. However, to show wide applicability of the technique, examples for QRST suppression in multi-lead ECGs using blind source separation are provided.

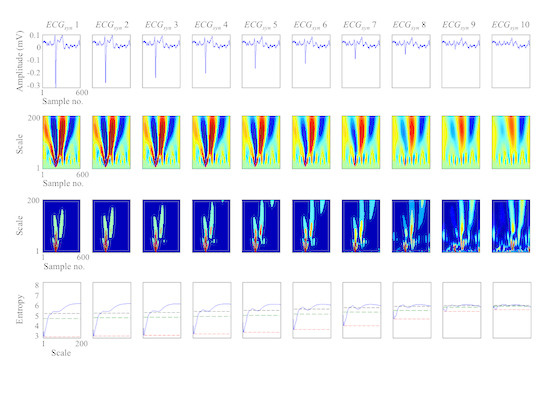
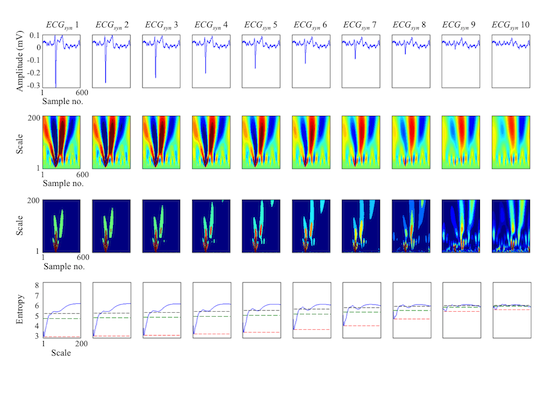
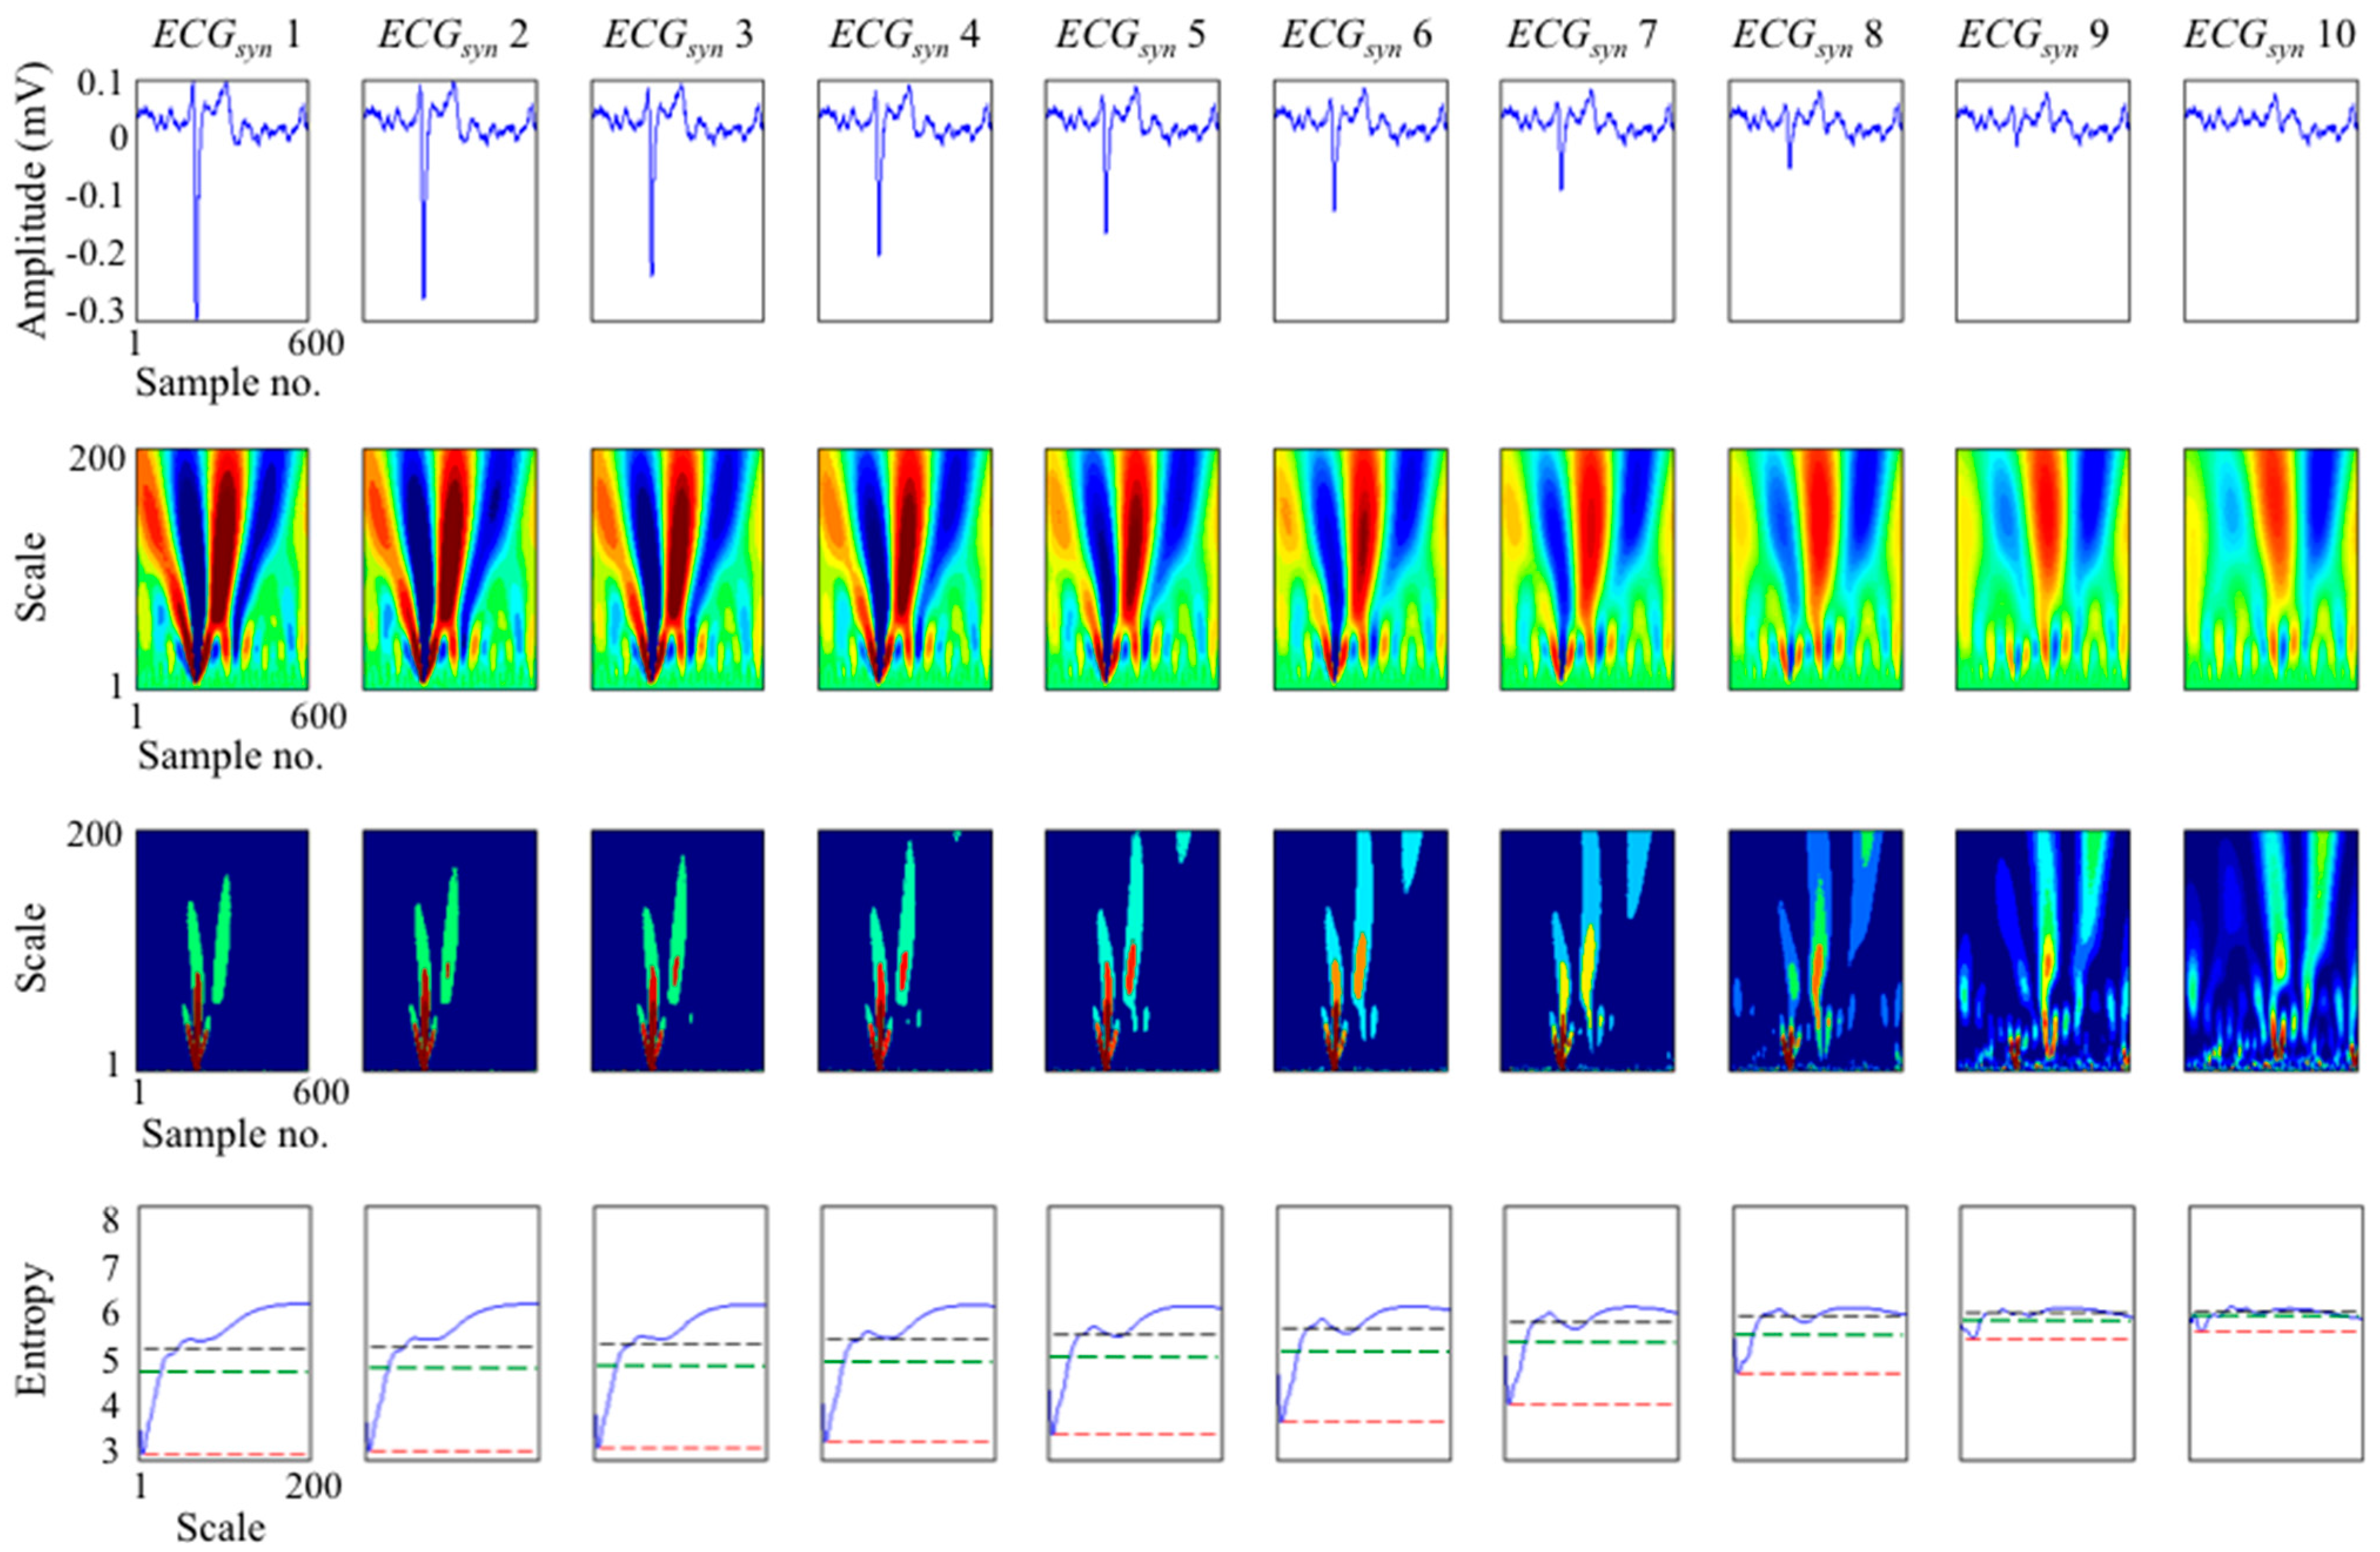
3.1. Study on Synthesised ECGs

Using the patient recordings for lead V1, for each patient a series of 10 synthesised single beat ECGs with decreasing levels of residual ventricular activity were constructed as follows. First, the longest f-wave segment free of ventricular activity was identified in each recording. Second, in each recording the average QRST complex was calculated. Third, 10 synthesised single beat ECGs were constructed by adding to the segment of ventricular free f-wave the average QRST with decreasing levels of amplitude as in Equation (8).
E C G s y n ( i ) = f w a v e + ( 10 i ) 9 q r s t a v , i = 1 : 10 .
This generated 10 synthesised ECGs for each patient, 100 ECGs in total, each simulating QRST suppressed ECGs with different levels of QRST suppression ranging from completely unsuppressed (i = 1) to completely suppressed (i = 10). Figure 1 shows the synthesised ECGs for one patient along with the results of the wavelet entropy analysis for these synthesised ECGs.
From Figure 1, decreasing levels of residual ventricular activity gave rise to increasing wavelet entropy, particularly WEvent. This was a result of the decreased wavelet energies at the high frequency ventricular scales and consequently the more even energy distribution across the duration of the ECG segment as can be seen in the wavelet energy contour plots (Figure 1). This result is confirmed for all simulations in Figure 2, which shows the wavelet entropies for the synthesised ECGs constructed from all patient ECGs. Clearly, more effective ventricular activity suppression gave significantly higher ventricular and atrial scale entropies. Compared to no suppression at all (ECGsyn(1)) wavelet entropies were significant higher (all p < 0.001, paired t-test) across all levels of suppression (ECGsyn(i), i = 2: 10) with the most significant increase for complete suppression (WEvent: ECGsyn(1) = 3.45 ± 0.36 vs. ECGsyn(10) = 5.48 ± 0.24, p < 0.0000001 and WEaf: ECGsyn(1) = 5.14 ± 0.23 vs. ECGsyn(10) = 5.85 ± 0.31, p < 0.00001 and WEva: ECGsyn(1) = 4.85 ± 0.32 vs. ECGsyn(10) = 5.82 ± 0.28, p < 0.00001).
The simulation study suggests that most effective ventricular suppression was achieved when WEva increased from 4.85 ± 0.32 (no suppression) to 5.82 ± 0.28 (complete suppression).
Figure 1. Wavelet analysis of electrocardiograms (ECGs) synthesised from one patient with decreasing levels of residual ventricular activity (columns 1 to 10). Columns show the analysis of each synthesised ECG with column 1 having the maximum residual QRST amplitude and the final column having no residual QRST. (Row 1) Synthesised ECG segments of 600 samples (1.2 s) duration with decreasing amplitudes of residual QRST. (Row 2) Wavelet coefficients of the ECG displayed as a colour contour map. (Row 3) Wavelet energy displayed as a colour contour map. (Row 4) Wavelet entropy as a function of scale with ventricular wavelet entropy (WEvent) indicated by a red horizontal line, atrial wavelet entropy (WEaf) indicated by a black horizontal line and wide scale band wavelet entropy (WEva) indicated by a green horizontal line.
Entropy 17 06397 g001
Figure 2. Wavelet entropies WEvent, WEaf and WEva for all synthesised electrocardiograms (ECGs). (a) Bar charts of wavelet entropies for synthesied ECGs grouped by patient simulation. For each patient the bars are ordered by increasing levels of QRST suppression (Blue: ECGsyn(1), no suppression, red: ECGsyn(10), total suppression). (b) Boxplots of wavelet entropies of synthesised ECGs, bar indicates median and boxes indicate interquartile range across patients at each suppression level.
Entropy 17 06397 g002

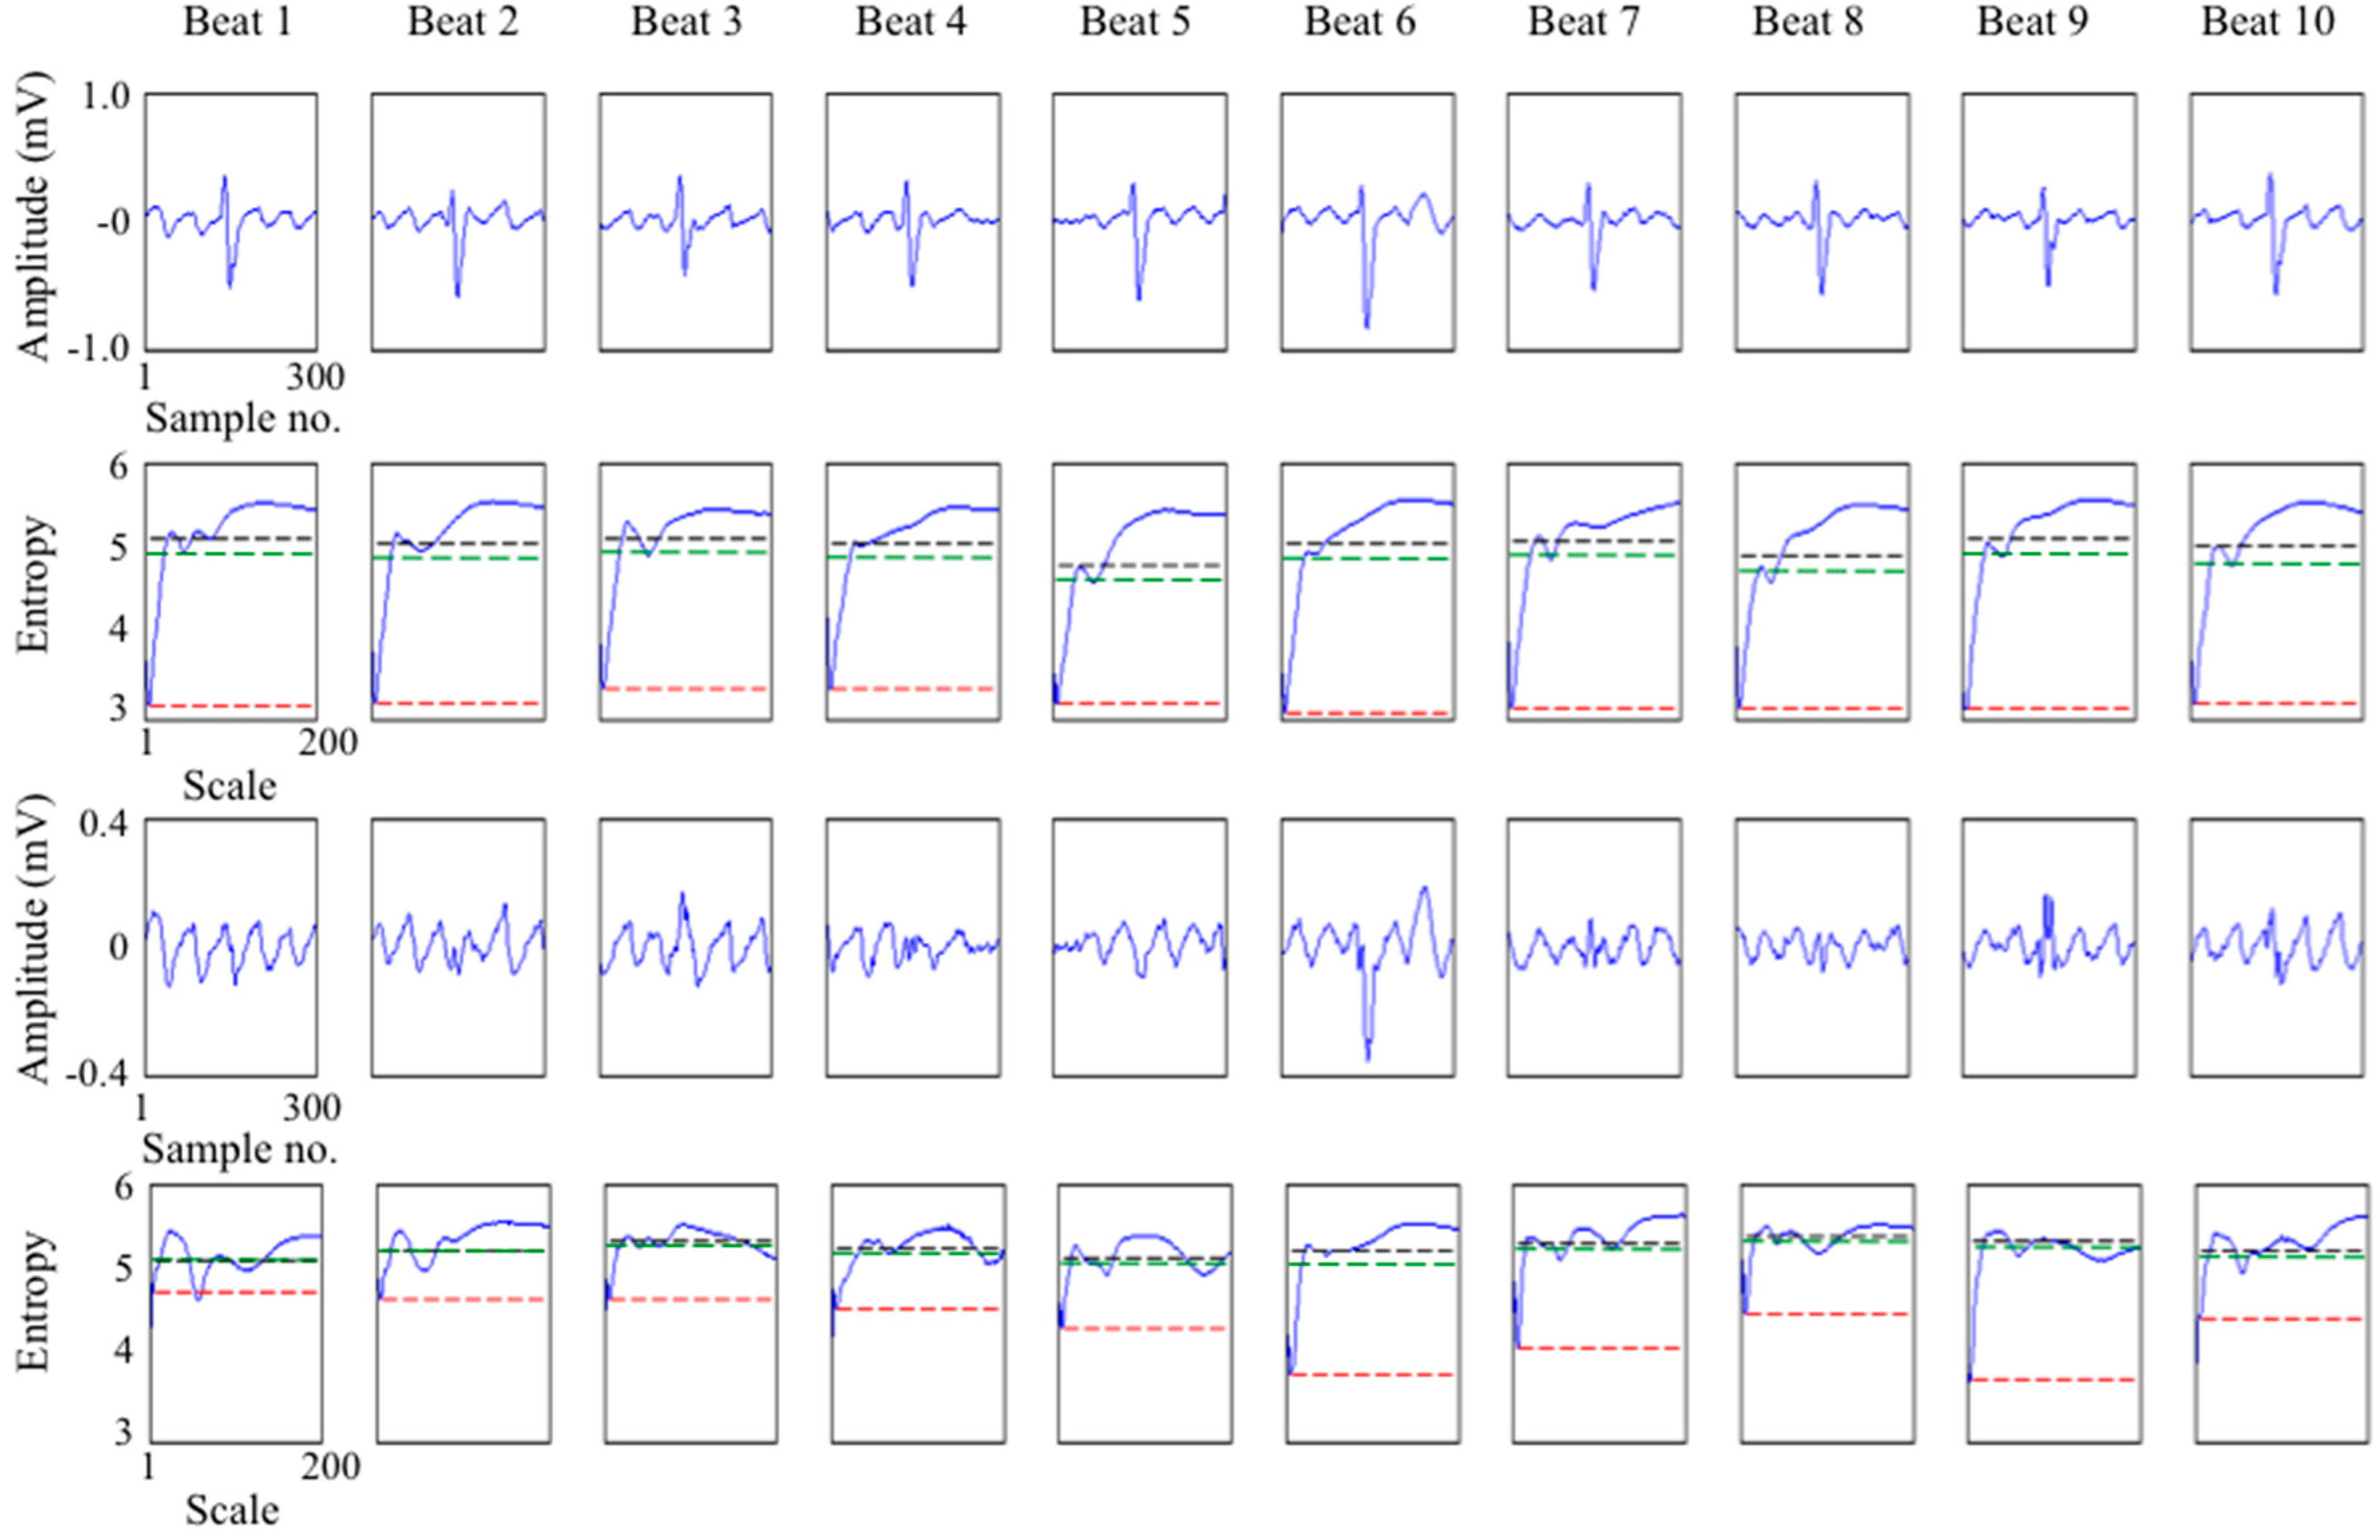
3.2. Study on Real ECGs with ABS Ventricular Suppression

The aim of this study was to demonstrate the application of the method to real ECGs with ventricular beats suppressed by the ABS algorithm. It demonstrates how the “quality” of ventricular beat suppression can be quantified beat-by-beat. Lead V1 from the ECGs of the 10 patients were analysed. The ABS algorithm was used to suppress QRST at each beat as previously described. The effectiveness of ventricular suppression was quantified by the wavelet entropy measures on a beat-by-beat basis for the first 10 beats of each recording by comparing the entropies for unsuppressed and suppressed ECGs.
Figure 3 illustrates the analysis for a single patient recording. It shows the unsuppressed and ABS suppressed beats along with their wavelet entropies for the first 10 beats in one patient recording. Wavelet entropy for the suppressed beats, particularly WEvent, clearly correlates with the extent of QRST suppression. Notably for example, the ABS algorithm performed very well with no visible residual activity in beat 1 for which the corresponding WEvent = 4.8, but performed poorly in beat 6 for which WEvent = 3.8. Over all analysed beats for this subject, ventricular beat suppression significantly increased wavelet entropies (WEvent: 3.19 ± 0.10 vs. 4.35 ± 0.37, p < 0.000001 and WEaf: 5.03 ± 0.10 vs. 5.25 ± 0.09, p < 0.001 and WEva: 4.74 ± 0.09 vs. 5.17 ± 0.08, p < 0.000001, paired t-test).
Figure 3. Wavelet analysis of 10 beats from one patient (columns 1 to 10). Columns show the analysis of each beat. (Row 1) The unsuppressed electrocardiogram (ECG) segment of 300 samples (0.6 s) duration. (Row 2) Wavelet entropy as a function of scale for the unsuppressed ECG with ventricular wavelet entropy (WEvent) indicated by a red horizontal line, atrial wavelet entropy (WEaf) indicated by a black horizontal line and wide scale band wavelet entropy (WEva) indicated by a green horizontal line. (Row 3) The ECG segment after QRST suppression by the average beat subtraction (ABS) algorithm. (Row 4) Wavelet entropy as a function of scale for the suppressed ECG with ventricular wavelet entropy (WEvent) indicated by a red horizontal line, atrial wavelet entropy (WEaf) indicated by a black horizontal line and wide scale band wavelet entropy (WEva) indicated by a green horizontal line.
Entropy 17 06397 g003
This result is confirmed for all the patient recordings in Figure 4. For each patient recording there is considerable variability of wavelet entropies (as indicated by the interquartile range in Figure 4) across beats. Such variability of performance is expected with the basic ABS algorithm since beat to beat QRST morphology changes are common, due for example to respiratory or postural changes. Overall across the 10 patient recordings and considering the mean wavelet entropies for each suppressed and unsuppressed recording, ABS achieved very highly significant increases in WEvent (3.48 ± 0.02 vs. 4.76 ± 0.12, p < 0.00001, two-sample t-test) and WEaf (5.06 ± 0.04 vs. 5.49 ± 0.05, p < 0.00001) and WEva (4.78 ± 0.04 vs. 5.41 ± 0.05, p < 0.00001).
Figure 4. Wavelet entropies (WEvent, WEaf and WEva) of patient electrocardiograms (ECGs) with unsuppressed and suppressed ventricular activity with the average beat subtraction (ABS) algorithm. Boxplots show the median (red line) and interquartile range (box) of entropies over the first 10 beats. For each patient the box on the left is for the unsuppressed ECG and the box on the right is for the ABS suppressed ECG.
Entropy 17 06397 g004

3.3. Application to Multi-Lead ECG

To demonstrate the general applicability of the wavelet based indices, the application to multi-lead ECGs was considered. Multi-lead f-wave extraction techniques based on blind source separation techniques such as principal and independent component analysis have been developed [7,16]. These algorithms consider the atrial and ventricular activities of the ECG to arise from mixtures of signals from the atrial and ventricular sources. The blind source separation process aims to separate the atrial and ventricular activities into different components considering all recorded leads. Here we consider principal component analysis as the blind source separation algorithm [7,15,32]. Figure 5 shows a patient 12-lead ECG along with the first 4 principal components and their associated wavelet entropies. V1 showed the most prominent f-wave in the 12-lead ECG. The first three principal components were dominated by ventricular activities and their WEva values were 4.56, 4.78, 5.04 reflecting the progressive suppression of the ventricular activity in these components. The forth principal component contained the separated f-wave and had WEva of 5.51. The f-wave obtained by the ABS algorithm applied to V1 is also shown for comparison and its WEva was 5.46.
Figure 5. Wavelet analysis of the 12-lead electrocardiogram (ECG) of one patient with atrial and ventricular activities separated by principal component analysis and average beat subtraction (ABS). (Row 1) The unsuppressed 12-leave ECG segment of 500 samples (1.0 s) duration. The f-wave is visible in lead V1. (Row 2) The first 4 principal components of the 12-lead ECG (PC to PC4). The first three principal components (PC1, PC2, PC3) were dominated by ventricular activity. PC4 contained the separated f-wave. The f-wave extracted from lead V1 by the ABS algorithm is also shown. (Row 3) Wavelet entropy as a function of scale for each principal component and ABS extracted f-wave with ventricular wavelet entropy (WEvent) indicated by a red horizontal line, atrial wavelet entropy (WEaf) indicated by a black horizontal line and wide scale band wavelet entropy (WEva) indicated by a green horizontal line.
Entropy 17 06397 g005

3.4. Comparison to Other Measures of the Effectiveness of Ventricular Beat Suppression

Few measures to quantify the effectiveness of ventricular beat suppression have been described. In simulation scenarios where the definitive underlying f-wave signal is known indices such as cross correlation and normalised mean square error can been used [14]. It is more challenging in the case of real ECGs where the underlying f-wave is not known. Some studies have simply compared the amplitude of the f-wave in the suppressed QRST segment with the amplitude in the TQ segment where there is no ventricular activity on the reasonable assumption that any residual activity is likely to increase the signal amplitude [24]. A more robust solution was proposed by Alcaraz et al. with the ventricular residue index (VR) [14]
V R i = 1 1 Q n = 1 Q x A A 2 ( n ) k = r i H r i + H x A A 2 ( k ) max k = r i H , .... , r i + H ( x A A ( k ) )
where VRi is the ventricular residue at beat i, Q the number of sample points across the beat segment, xAA is the QRST suppressed ECG, ri is the sample point of the R wave peak and H specifies a window of length 2H + 1 sample points centered on ri and encompasses the QRS interval.
Conceptually VR can be considered similar to the ratio of the energy of the residual QRS to the energy of the entire segment [33]. Lower VR indicates more effective ventricular suppression. Implementations of this algorithm used H corresponding to 50 ms assuming a QRS interval of approximately 100 ms for all beats for all patients [14,33], presumably to avoid the difficult detection of the true onset and offset of the QRS complex and the additional computational burden. Clearly the effectiveness of the algorithm is dependent upon the specified window since choosing a window which is too small potentially misses residual activity occurring outside the window. This is most apparent because VR does not take account of any residual T wave, which may be substantial if not suppressed adequately [34]. This limitation is avoided in the wavelet entropy approach because it considers the wavelet energy across scale bands corresponding to T wave as well as QRS complex, so that residual T wave is captured by the approach.
To illustrate this Figure 6 compares VR and wavelet entropy index WEva for two synthesised cases: (a) QRST suppression and (b) QRS suppression but no T wave suppression. As expected, for case (a) (QRST suppression) WEva increased and VR decreased as the residual ventricular activity reduced. However, for case (b) (QRS suppression only) where significant T wave residual existed, rather than VR being greater than case (a), it was smaller, wrongly suggesting improved ventricular suppression. The wavelet entropy measure on the other hand accurately reflected the residual T wave because WEva was smaller relative to case (a), suggesting less effective ventricular suppression.
Figure 6. Comparison of wide scale band wavelet entropy (WEva) and residue index (VR) for synthesised electrocardiograms (ECGs) with decreasing levels of residual ventricular activity: (a) QRST suppression; and (b) QRS suppression but no T wave suppression. (Row 1) Synthesised ECG segments of 900 samples (1.8 s) duration with decreasing amplitudes of residual QRST. (Row 2) Same as row 1 but without T wave suppressed to simulate an f-wave with large T wave residual. (Row 3) WEva for simulated cases (a) (blue line) and (b) (green line). Note residual T wave results in lower WEva as would be expected. (Row 4) VR for simulated cases (a) (blue line) and (b) (green line). Note residual T wave results in lower VR.
Entropy 17 06397 g006

4. Conclusions

New measures to quantify the quality of ventricular activity suppression of the ECG in atrial fibrillation based on wavelet entropy have been proposed. They are based on entropy as a measure of the temporal energy distribution of wavelet coefficients of ECG beat segments. Superior suppression results in higher entropy values due to the broad temporal energy distributions at ventricular and atrial scale bands. This reflects the removal of the highly concentrated (in scale and time) energy associated with the ventricular activity. The measures have been shown to be effective on both synthesised and real ECGs. Not only do they have application in the assessment of ventricular activity suppression beat-by-beat as demonstrated in the present study, but also in comparing the effectiveness of different ventricular suppression algorithms, which will be the focus of future work.

Acknowledgments

The author would like to thank J.P. Bourke and S. King who facilitated ECG data collection at the Freeman Hospital, Newcastle upon Tyne, UK.

Conflicts of Interest

The author declares no conflict of interest.

References

  1. January, C.T.; Wann, L.S.; Alpert, J.S.; Calkins, H.; Cigarroa, J.E.; Cleveland, J.C.; Conti, J.B.; Ellinor, P.T.; Ezekowitz, M.D.; Field, M.E; et al. 2014 AHA/ACC/HRS guideline for the management of patients with atrial fibrillation: A report of the American College of cardiology/American heart association task force on practice guidelines and the heart rhythm society. J. Am. Coll. Cardiol. 2014, 64. [Google Scholar] [CrossRef]
  2. Stewart, S.; Murphy, N.; Walker, A.; McGuire, A.; McMurray, J.J.V. Cost of an emerging epidemic: An economic analysis of atrial fibrillation in the UK. Heart 2004, 90, 286–292. [Google Scholar] [CrossRef] [PubMed]
  3. Bollmann, A.; Husser, D.; Stridh, M.; Sörnmo, L.; Majic, M.; Klein, H.U.; Olsson, S.B. Frequency measures obtained from the surface electrocardiogram in atrial fibrillation research and clinical decision-making. J. Cardiovasc. Electrophysiol. 2003, 14. [Google Scholar] [CrossRef]
  4. Ng, J.; Kadish, A.H.; Goldberger, J.J. Effect of electrogram characteristics on the relationship of dominant frequency to atrial activation rate in atrial fibrillation. Heart Rhythm 2006, 3, 1295–1305. [Google Scholar] [CrossRef]
  5. Guillem, M.S.; Climent, A.M.; Castells, F.; Husser, D.; Millet, J.; Arya, A.; Piorkowski, C.; Bollmann, A. Noninvasive mapping of human atrial fibrillation. J. Cardiovasc. Electrophysiol. 2009, 20, 507–513. [Google Scholar] [CrossRef] [PubMed]
  6. Bonizzi, P.; de la Salud Guillem, M.; Climent, A.M.; Millet, J.; Zarzoso, V.; Castells, F.; Meste, O. Noninvasive assessment of the complexity and stationarity of the atrial wavefront patterns during atrial fibrillation. IEEE Trans. Biomed. Eng. 2010, 57, 2147–2157. [Google Scholar] [CrossRef] [PubMed]
  7. Raine, D.; Langley, P.; Murray, A.; Dunuwille, A.; Bourke, J.P. Surface atrial frequency analysis in patients with atrial fibrillation: A tool for evaluating the effects of intervention. J. Cardiovasc. Electrophysiol. 2004, 15, 1021–1026. [Google Scholar] [CrossRef] [PubMed]
  8. Bollmann, A.; Husser, D.; Mainardi, L.; Lombardi, F.; Langley, P.; Murray, A.; Rieta, J.J.; Millet, J.; Olsson, S.B.; Stridh, M.; et al. Analysis of surface electrocardiograms in atrial fibrillation: Techniques, research, and clinical applications. Europace 2006, 8, 911–926. [Google Scholar] [PubMed]
  9. Alcaraz, R.; Rieta, J.J. A non-invasive method to predict electrical cardioversion outcome of persistent atrial fibrillation. Med. Biol. Eng. Comput. 2008, 46, 625–635. [Google Scholar] [CrossRef] [PubMed]
  10. Meo, M.; Zarzoso, V.; Meste, O.; Latcu, D.G.; Saoudi, N. Catheter ablation outcome prediction in persistent atrial fibrillation using weighted principal component analysis. Biomed. Signal Process. Control 2013, 8, 958–968. [Google Scholar] [CrossRef]
  11. Alcaraz, R.; Rieta, J.J. Sample entropy of the main atrial wave predicts spontaneous termination of paroxysmal atrial fibrillation. Med. Eng. Phys. 2009, 31, 917–922. [Google Scholar] [CrossRef] [PubMed]
  12. Holm, M.; Pehrson, S.; Ingemansson, M.; Sörnmo, L.; Johansson, R.; Sandhall, L.; Sunemark, M.; Smideberg, B.; Olsson, C.; Olsson, S.B. Non-invasive assessment of the atrial cycle length during atrial fibrillation in man: introducing, validating and illustrating a new ECG method. Cardiovasc. Res. 1998, 38, 69–81. [Google Scholar] [CrossRef]
  13. Stridh, M.; Sörnmo, L. Spatiotemporal QRST cancellation techniques for analysis of atrial fibrillation. IEEE Trans. Biomed. Eng. 2001, 48, 105–111. [Google Scholar] [CrossRef] [PubMed]
  14. Alcaraz, R.; Rieta, J.J. Adaptive singular value cancelation of ventricular activity in single-lead atrial fibrillation electrocardiograms. Physiol. Meas. 2008, 29, 1351–1369. [Google Scholar] [CrossRef] [PubMed]
  15. Langley, P.; Bourke, J.P.; Murray, A. Frequency analysis of atrial fibrillation. In Proceedings of Computers in Cardiology, Cambridge, MA, USA, 24–27 September 2000; pp. 65–68.
  16. Rieta, J.J.; Castells, F.; Sánchez, C.; Zarzoso, V.; Millet, J. Atrial activity extraction for atrial fibrillation analysis using blind source separation. IEEE Trans. Biomed. Eng. 2004, 51, 1176–1186. [Google Scholar] [CrossRef] [PubMed]
  17. Mainardi, L.; Sörnmo, L.; Cerutti, S. Understanding atrial fibrillation: the signal processing contribution, part I; Morgan & Claypool Publisher: San Rafael, CA, USA, 2008. [Google Scholar]
  18. Mateo, J.; Rieta, J.J. Radial basis function neural networks applied to efficient QRST cancellation in atrial fibrillation. Comput. Biol. Med. 2013, 43, 154–163. [Google Scholar] [CrossRef] [PubMed]
  19. Petrėnas, A.; Marozas, V.; Sörnmo, L.; Lukosevicius, A. An echo state neural network for QRST cancellation during atrial fibrillation. IEEE Trans. Biomed. Eng. 2012, 59, 2950–2957. [Google Scholar] [PubMed]
  20. Slocum, J.; Sahakian, A.; Swiryn, S. Diagnosis of atrial fibrillation from surface electrocardiograms based on computer-detected atrial activity. J. Electrocardiol. 1992, 25. [Google Scholar] [CrossRef]
  21. Xi, Q.; Sahakian, A.V.; Swiryn, S. The effect of QRS cancellation on atrial fibrillatory wave signal characteristics in the surface electrocardiogram. J. Electrocardiol. 2003, 36, 243–249. [Google Scholar] [CrossRef]
  22. Platonov, P.G.; Corino, V.D.; Seifert, M.; Holmqvist, F.; Sörnmo, L. Atrial fibrillatory rate in the clinical context: Natural course and prediction of intervention outcome. Europace 2014, 16. [Google Scholar] [CrossRef] [PubMed]
  23. Langley, P.; Stridh, M.; Rieta, J.J.; Sörnmo, L.; Millet-Roig, J.; Murray, A. Comparison of atrial rhythm extraction techniques for the estimation of the main atrial frequency from the 12-lead electrocardiogram in atrial fibrillation. In Proceedings of Computers in Cardiology, Memphis, TN, USA, 22–25 September 2002; pp. 29–32.
  24. Langley, P.; Rieta, J.J.; Stridh, M.; Millet, J.; Sörnmo, L.; Murray, A. Comparison of atrial signal extraction algorithms in 12-lead ECGs with atrial fibrillation. IEEE Trans. Biomed. Eng. 2006, 53, 343–346. [Google Scholar] [CrossRef] [PubMed]
  25. Petrutiu, S.; Ng, J.; Nijm, G.M.; Al-Angari, H.; Swiryn, S.; Sahakian, A.V. Atrial fibrillation and waveform characterization. Eng. Med. Biol. Mag. 2006, 25, 24–30. [Google Scholar] [CrossRef]
  26. Goodfellow, J.; Escalona, O.J.; Walsh, P.R.; Kodoth, V.; Manoharan, G. Estimation of atrial fibrillatory frequency by spectral subtraction of wavelet denoised ECG in patients with atrial fibrillation. In Proceedings of Computing in Cardiology, Cambridge, MA, USA, 7–10 September 2014; pp. 329–332.
  27. Addison, P.S. Wavelet transforms and the ECG: A review. Physiol. Meas. 2005, 26. [Google Scholar] [CrossRef] [PubMed]
  28. Lemay, M.; Jacquemet, V.; Forclaz, A.; Vesin, J.M. Spatiotemporal QRST cancellation method using separate QRS and T-waves templates. In Proceedings of Computers in Cardiology, Lyon, France, 25–28 September 2005; pp. 611–614.
  29. Sello, S. Wavelet entropy and the multi-peaked structure of solar cycle maximum. New Astron. 2003, 8, 105–117. [Google Scholar] [CrossRef]
  30. Rosso, O.A.; Blanco, S.; Yordanova, J.; Kolev, V.; Figliola, A.; Schürmann, M.; Başar, E. Wavelet entropy: A new tool for analysis of short duration brain electrical signals. J. Neurosci. Methods 2001, 105, 65–75. [Google Scholar] [CrossRef]
  31. Watson, J.N.; Uchaipichat, N.; Addison, P.S.; Clegg, G.R.; Robertson, C.E.; Eftestol, T.; Steen, P.A. Improved prediction of defibrillation success for out-of-hospital VF cardiac arrest using wavelet transform methods. Resuscitation 2004, 63, 269–275. [Google Scholar] [CrossRef] [PubMed]
  32. Raine, D.; Langley, P.; Shepherd, E.; Lord, S.; Murray, S.; Murray, A.; Bourke, J.P. Principal component analysis of atrial fibrillation: Inclusion of posterior ECG leads does not improve correlation with left atrial activity. Med. Eng. Phys. 2015, 37, 251–255. [Google Scholar] [CrossRef] [PubMed]
  33. Lee, J.; Song, M.H.; Shin, D.G.; Lee, K.J. Event synchronous adaptive filter based atrial activity estimation in single-lead atrial fibrillation electrocardiograms. Med. Biol. Eng. Comput. 2012, 50, 801–811. [Google Scholar] [CrossRef] [PubMed]
  34. Lemay, M.; Vesin, J.M.; van Oosterom, A.; Jacquemet, V.; Kappenberger, L. Cancellation of ventricular activity in the ECG: Evaluation of novel and existing methods. IEEE Trans. Biomed. Eng. 2007, 54, 542–546. [Google Scholar] [CrossRef] [PubMed]

