Article

Setting Diverging Colors for a Large-Scale Hypsometric Lunar Map Based on Entropy

Key Laboratory of Lunar and Deep Space Exploration, National Astronomical Observatories, Chinese Academy of Sciences, Beijing 100012, China
*
Author to whom correspondence should be addressed.
Entropy 2015, 17(7), 5133-5144; https://doi.org/10.3390/e17075133
Submission received: 8 May 2015 / Revised: 14 July 2015 / Accepted: 17 July 2015 / Published: 22 July 2015
(This article belongs to the Special Issue Entropy, Utility, and Logical Reasoning)

Abstract

:
A hypsometric map is a type of map used to represent topographic characteristics by filling different map areas with diverging colors. The setting of appropriate diverging colors is essential for the map to reveal topographic details. When lunar real environmental exploration programs are performed, large-scale hypsometric maps with a high resolution and greater topographic detail are helpful. Compared to the situation on Earth, fewer lunar exploration objects are available, and the topographic waviness is smaller at a large scale, indicating that presenting the topographic details using traditional hypsometric map-making methods may be difficult. To solve this problem, we employed the Chang’E2 (CE2) topographic and imagery data with a resolution of 7 m and developed a new hypsometric map-making method by setting the diverging colors based on information entropy. The resulting map showed that this method is suitable for presenting the topographic details and might be useful for developing a better understanding of the environment of the lunar surface.

1. Introduction

The concept of “entropy”, as redefined by Shannon in 1948 [1], is used to express the amount of information and to quantify the abstraction of information, which is considered to be one of the fundamental elements of information theory. As early as the 1970s, Batty reworked Shannon’s analysis and introduced information entropy into GIScience. He developed the concept of “spatial entropy”, which was used to measure the spatial information abstraction from discrete spatial intervals in 1974 [2]. Information entropy theory has since been applied in many research fields in geography and GIScience [3,4]. In the study of topographic feature extraction, entropy was used to improve the accuracy of the results of high resolution topographic feature extraction by Sofia et al. [5,6], In the study of spatial information aggregation, Batty introduced an approach to the measure locational phenomena in spatial hierarchy using entropy statistics, which might be used in spatial aggregation [7]. In thematic map-making, by defining “symbolic entropy” to qualify the symbolic information of maps, Ruiz et al. in 2012 described a method to determine the pattern spatial association between different thematic maps [8].
Lunar topographic map making is important in the lunar exploration to provide lunar surface information such as craters, linear structures [9], or rocks. As early as 1959, a lunar probe called Luna 3 was launched by the Soviet Union, which captured the first images of the dark side of the moon. Several years later, the United States executed the Apollo manned lunar exploration program in 1969, which captured a substantial amount of lunar topographic data. With these data, Bowker and Hughes produced a lunar topographic atlas [10]. Additionally, Tiernan produced select topographic maps covering the landing site of Apollo 17 [11]. During the 1990s, other countries or territories engaged in lunar scientific exploration work, including the Europe Union, India, Japan and China. In 1994, the US initiated the Clementine Lunar Mapping Project [12]. The captured data were used in a Clementine Lunar Imagery Atlas by Bussey and Spudis [13]. The Europe Space Agency launched SMART-1 in 2003. Japan also launched the Kaguya program in 2007. With the captured data, Araki created a global lunar topographic map [14]. India launched the Chandrayaan Lunar Exploration Program in 2008. China started the Change’E (CE) lunar exploration program in 2007, executing three missions: CE1 in 2007, CE2 in 2009 and CE3 in 2013. The captured data were used to create an atlas of the global topographic map of the moon [15,16].
The lunar topographic map was widely used in landing site selection for the lunar lander and determining navigation roads for the lunar rover. However, as the development of lunar exploration grows, additional large-scale maps with detailed lunar surface information are required. However, the topographic map discussed above displays a small scale and cannot satisfy this need. Therefore, we must develop new map making methods. A hypsometric map is a type of thematic map that is used to represent topographic characteristics by filling different map areas with diverging colors. One of the most common data sources for this map is the Digital Elevation Model (DEM). A hypsometric map is composed of thousands of rasters, each raster is assigned with a color, and the information of the topographic pattern can be revealed by the colors. Better diverging colors can outline the maximum information in the topographic patterns and assist map readers in understanding the topographic characteristics of the map. Therefore, the cartographer must select suitable diverging colors for the hypsometric map. From a related study covering “spatial entropy” and “symbolic entropy”, entropy could be used to qualify the abstraction of the spatial information. Therefore, we investigate applying the entropy when setting the diverging colors for the map to display the maximum topographic information.
In this study, the first section is an introduction of entropy and why entropy is applied in setting the diverging colors for a hypsometric map. Section 2 provides a description of the data source for the hypsometric map and details problems in setting the diverging colors for a lunar large-scale map and how to apply the entropy in solving these problems. Section 3 details the results of the method applied in the hypsometric map making in CE2 atlas editing. The final section presents the conclusions and the suggestions for future research.

2. Data Source and Method

2.1. CE2 Lunar DEM Data

In this approach, the data source for the lunar hypsometric map making originated from the CE2 lunar DEM data. The method to capture the data and the location of the selected on the lunar surface will be discussed in the following paragraphs.

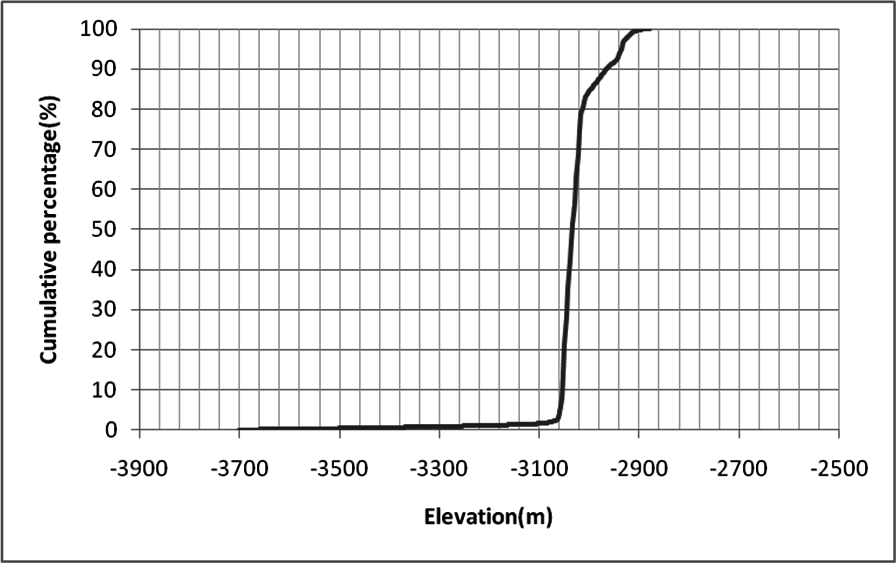
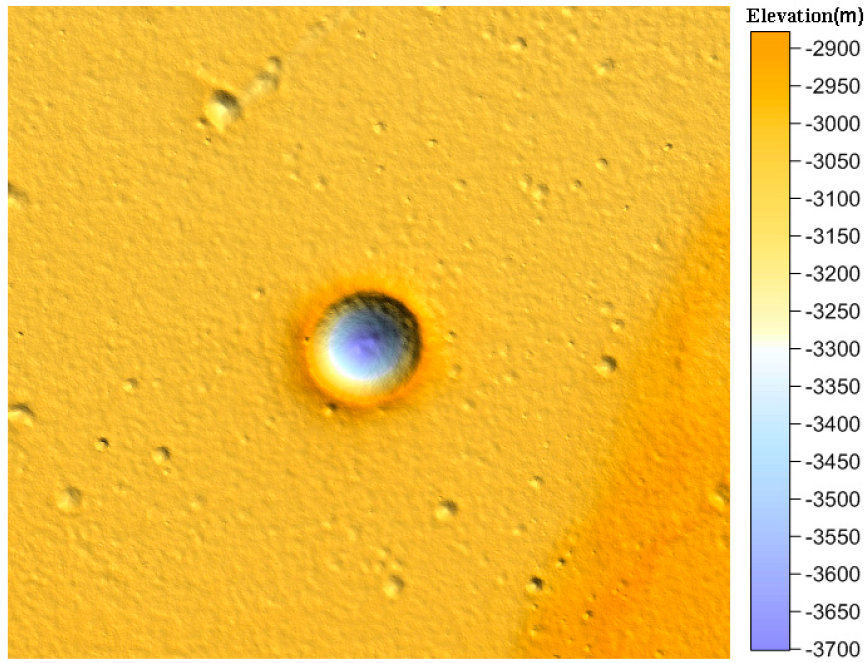
2.1.1. Data Characteristics

The original CE2 lunar topographic data were captured with a stereoscopic camera. The stereoscopic camera on the CE2 is a vital payload (Figure 1). The camera is composed of a time delay and integration charge coupled device (TDI CCD), which scans the lunar surface in a linear array push broom imaging mode, capturing the images both from the front-view and back-view along with a flying direction. The two linear arrays share the identical optical imaging system and are mounted on the focal plane in parallel. The total number of pixels is 6144, and the size of the pixel is 10.1×10.1 μm. Other technical parameters are shown in Table 1. The camera was used to capture the lunar image from two orbits, one 100 km away from the lunar surface (43 km wide with a spatial resolution of 7 m) and the other from a 15 km orbit (9.2 km wide with a resolution of 1.5 m).
According to the orbits of the CE2 probe (100 km ±15 km and 15 km ± 5 km) and the transition of the lunar elevation (−9.2 km ~ 10.6 km), the line frequency of the camera in the 100 km orbit ranged over 169 ~ 301 fps and that of the 15 km orbit over 833~2200 fps. The image data are captured by the camera controller. These data form the original CCD stereoscopic dataset, and then are transmitted through the1553 B bus to bulk memory storage. When the CE2 probe flies over an area, the data stored in the bulk memory are coded and modulated and then sent to the earth observation through the transmit antenna. All data then will be received by the ground systems. After data processing, the CCD image data will be produced, which is the source data for lunar digital products.

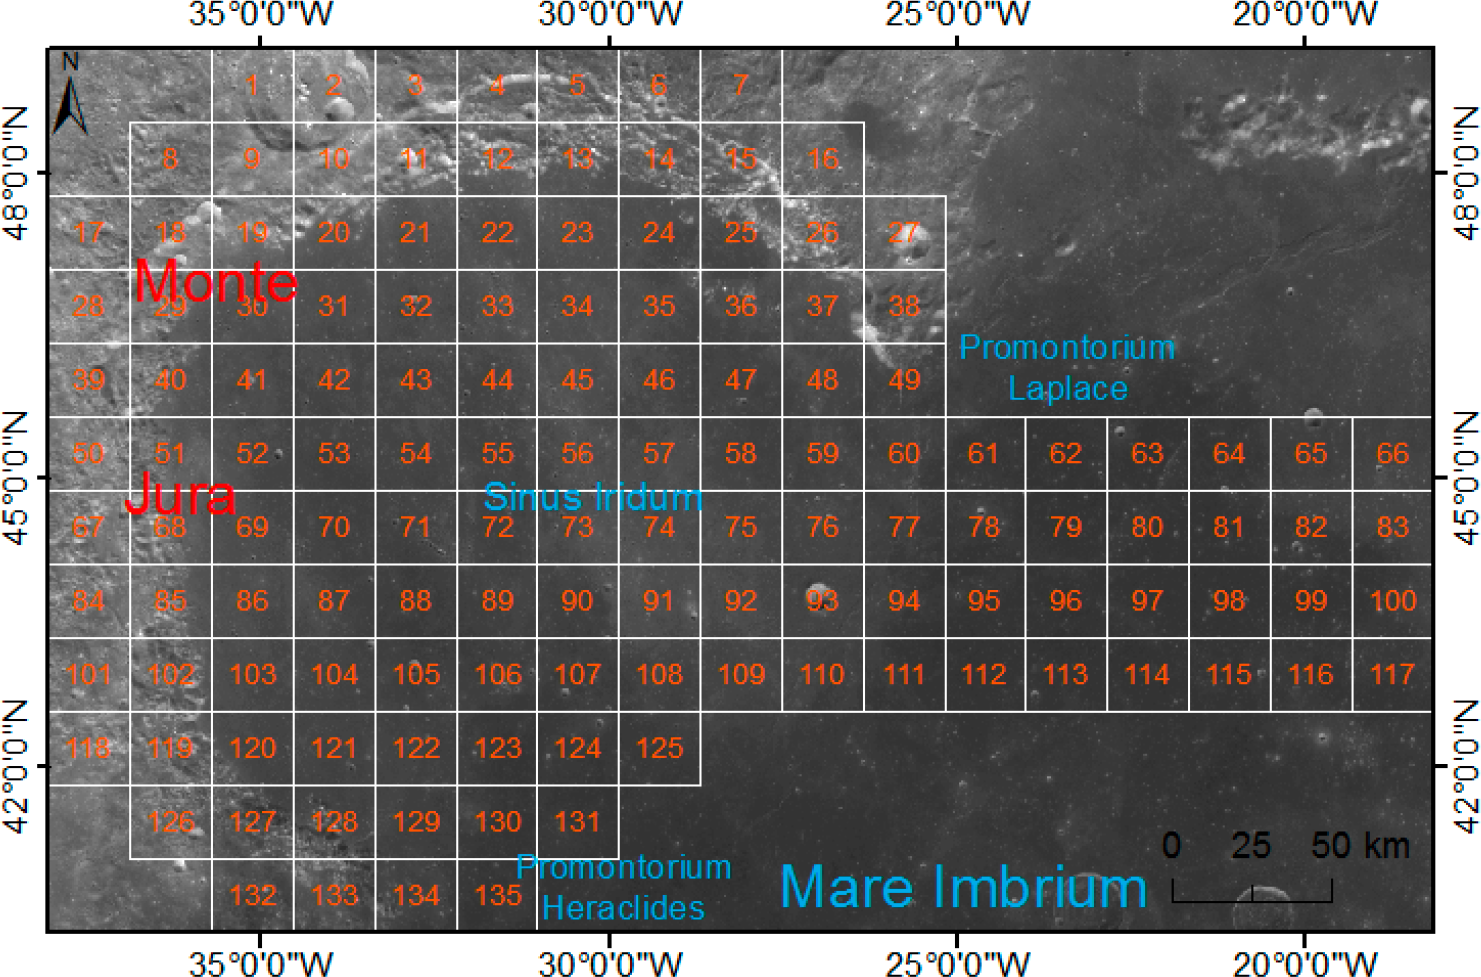
2.1.2. Mapping Areas

The selective mapping area of this approach is located in the Sinus Iridum, residing to the north of the Mare Imbrium. The Sinus Iridum appears as a half circle-shaped gulf with a diameter of approximately 236 km and may have been formed by an impact several billion years ago. The mountain Monte Jura is located in the west and north part of this area. The southwest sharp corner of this mountain is called Promontorium Heraclides, and the northeast sharp corner is called Promontorium Laplace. A flat plain covered in basalt is noted in the inner part of Sinus Iridum. Through an analysis of the topographic parameters, multiple craters in this area display diameters below 10 km. The elevation of the area ranged from −1900 m to −3700 m, and the average elevation is approximately −2700 m. The average slope is 5.3°, and the average topographic waviness is 16 m.
To represent the topographic details of the mapping area on a large scale, the mapping area is divided into 135 smaller mapping areas, each approximately 2.5 km long and approximately 2.3 km wide. All of the mapping areas are represented under the Moon Mercator Coordinate System. The coverage of these areas is shown in Figure 2.

2.2. Diverging Color Setting Method

2.2.1. Problems in Color Setting

In hypsometric map making, color is one of the major elements in representing different elevation, and color setting has a direct relationship to the quality of the map. In producing the Chang’E-1 topographic atlas of the moon, a diverging color list for the global hypsometric map was designed by hand, including a series of warm orange colors for the highland and another series of cold blue color for the lunar mare. The color changes smoothly from blue to orange as the elevation increases, and all of the mapping areas utilize this color model.
In the color setting for the CE2 hypsometric map, the diverging color list was preserved. However, this list encountered several problems. When making hypsometric maps at a global scale, multiple geographic features are noted and the topographic waviness is large. Therefore, the color distribution is almost even. However, when produce a hypsometric map at a large scale, the distribution of the elevation in select mapping areas are rather uneven because the map extent is small. To define the problem clearly, the “No. 32” map is taken as an example. The minimum elevation of this area is −3701.57 m, the maximum elevation is −2878.11 m, the average elevation is −3026.06 m, and the standard deviation is 57.67 m; the distribution of the elevation is shown in Figure 3.
From Figure 3, the distribution of the elevation is rather uneven, displaying a low ratio ranging from −3700 m to −3100 m with the majority distributed around −3000 m. Therefore, the color setting should comply with the distribution of the elevation. The majority of the colors (such as 15 or more colors) should be assigned to the elevation around −3000 m, and the elevation with low ratios could be assigned with one or two colors. If a color model with an even distribution is applied, then most part of the mapping area shares the identical color, which might reduce the quality of map and complicate the interpretation. Figure 4 shows the result of applying the available diverging color list in Map 32.
In Figure 4, the majority of the map is covered with a warm yellow color, and a blue color is only noted in the center crater. The topographic details of the entire map are not well presented. To represent these details better, a unified diverging list is not advisable, and a new method must be developed for dynamically creating the colors to represent mapping areas with unevenly distributed elevations.

2.2.2. Diverging-Colors Setting Rules Based on Entropy

Shannon’s classic function for the calculation of entropy to measure spatial probability distribution is defined as the following:
H = N i = 1 p i ln p i
N i = 1 p i = 1
According to Equation (1), it is assumed that the spatial extent of a hypsometric map is divided into “N” classes, and each class is assigned with a diverging color “ci”. The probability of occurrence in each class is then “pi” (i = 0, 1, 2, …, N), indicating “pi” could be calculated as follows:
p i = a r e a i / a r e a m a p
To develop a rich information map, the entropy should be at a maximum. For each class, the “pi” should then be equal, indicating that the “areai” of each class is equal. Simultaneously, the information of a hypsometric map is decided by two parameters, “pi” and “ci”:
I i = p i × c i
To evaluate the information of a hypsometric map, the following function can be used:
M = N i = 1 , j = 1 , i j ( I i I j ) 2 = p i 2 × N i = 1 , j = 1 , i j ( c i c j ) 2
In the CIE-LAB (the parameters of the color model used in this manuscript was defined in 1976) color model, color is defined as a linear function. For the diverging colors “ci”, a minimum value cmin and a maximum value cmax are then always noted. The other colors reside on the number line between cmin and cmax. To obtain the maximum information for a hypsometric map, the color interval between each pair of adjacent colors should be equal.

2.2.3. Apply the Rules in the Color Setting of a Lunar Hypsometric Map

(1) For the DEM data of a mapping area, the entire raster number is assumed to be “M”. The distribution of elevation is calculated. The elevation is ordered from the minimum to maximum. The maximum elevation is marked as “Emax” and the minimum elevation as “Emin”. The colors are set according to the distribution of the elevation. The total classified number is set as “N”. The entire mapping area can be assumed to be divided into “N” parts and each part has approximately the identical raster number, “M/N”. The raster number from the minimum value could then be calculated. When the raster number accumulate to “M/N”, the elevation value will then be marked as an interval value. After the“N-1” elevation value is selected, the entire map is divided into N classes.
(2) The equation for transforming the RGB Color Model (x, y, z) into the CIE-LAB Color Model (l, a, b) is calculated as follows:
l = 116 × f ( y / Y n ) 16
a = 500 × [ f ( x / X n ) f ( y / Y n ) ]
b = 200 × [ f ( y / Y n ) f ( z / Z n ) ]
where:
f ( t ) = { t 1 / 3 , i f t > ( 6 29 ) 3 1 3 × ( 29 6 ) 2 × t + 4 29 , o t h e r w i s e
where “Xn”, “Yn” and “Zn” are the CIE-XYZ tristimulus values of the reference white point.
For the diverging colors, a “Cmin” in the RGB Color Model (r1,g1,b1), a “Cmax” in RGB Color Model (r2,b2,c2), a “Cmin” in the CIE-LAB Color Model (l1,a1,b1), a “Cmax” in CIE-LAB Color Model (l2,a2,b2) are assumed. The parameters and code for transferring from RGB to CIE-LAB are defined as Algorithm 1:
Algorithm 1. Transform from RGB to CIELAB.
1:// RGB parameters
2:C(r,g,b);
3:// CIE-XYZ parameters
4:C(x,y,z);
5:// CIE-LAB parameters;
6:C(l,a,b);
7:double Xn = 96.4221;
8:double Yn = 100;
9:double Zn = 82.5221;
10:// RGB to CIE-XYZ parameters
11:double rxf = 0.17697;
12:double xr = 0.49;
13:double xg = 0.31;
14:double xb = 0.2;
15:double yr = 0.17697;
16:double yg = 0.81240;
17:double yb = 0.01063;
18:double zr = 0;
19:double zg = 0.01;
20:double zb = 0.99;
21:double rx = 2.36461;
22:double ry = −0.89654;
23:double rz = −0.46807;
24:double gx = −0.51517;
25:double gy = 1.42641;
26:double gz = 0.08876;
27:double bx = 0.0052;
28:double by = −0.01441;
29:double bz = 1.0092;
30:// RGB to CIE-XYZ
31:x = (xr × r + xg × g + xb × b)/rxf;
32:y = (yr × r + yg × g + yb × b)/rxf;
33:z = (zr × r+zg × g+zb × b)/rxf;
34:// DivideN(double dn)
35:if (dn > Math.pow(6.0/29.0, 3)) then DivideN(dn) = Math.pow(dn,1.0/3);
36:else DivideN(dn) = 1.0/3.0 × 29.0/6.0 × 29.0/6.0 × dn + 16.0/116.0;
37// CIE-XYZ to CIE-LAB
38:l = DivideN(y/Yn) × 116 − 16;
39:a = 500 × (DivideN(x/Xn) – DivideN(y/Yn));
40:b = 200 × (DivideN(y/Yn) – DivideN(z/Zn));
41:Return C(l,a,b)
For a color between Cmin and Cmax (marked as Ci in the CIE-LAB Color Model (li,ai,bi)), the code to calculate the Ci is defined as Algorithm 2:
Algorithm 2. Calculate the color distance between two colors.
1:// Color parameters
2:Cmin(l1,a1,b1);
3:Cmax(l2,a2,b2);
4:Ci(li,ai,bi);
5:// Cdis(Cmin,Cmax)
6:Cdis(Cmin, Cmax) = Math.sqrt(Math.pow((l1 − l2), 2) + Math.pow((a1 − a2), 2) + Math.pow((b1 − b2), 2));
7:// Calculate Ci
8:t = Cdis(Cmin,Ci)/Cdis(Ci,Cmax);
9:li = (l1 + t × l2)/(1 + t);
10:ai = (a1 + t × a2)/(1 + t);
11:bi = (b1 + t × b2)/(1 + t);
12:Return Ci(li,ai,bi)
The equation for transforming the CIE-LAB Color Model (l, a, b) into an RGB Color Model (x, y, z) is calculated as follows:
x = X n × f 1 ( 1 116 × ( l + 16 ) + 1 500 × a )
y = Y n × f 1 ( 1 116 × ( l + 16 ) )
z = Z n × f 1 ( 1 116 × ( l + 16 ) 1 200 × b )
where:
f 1 ( t ) = { t 3 , i f t > 6 29 3 × ( 6 29 ) 3 × ( t 4 29 ) , o t h e r w i s e
To transform the Ci(li,ai,bi) from a CIE-LAB Color Model to an RGB Color Model Ci(ri,gi,bi), the following code in Algorithm 3 is used:
Algorithm 3. Transform from CIE-LAB to RGB.
1:// CIE-LAB to CIE-XYZ
2:// Parameters are the same as Algorithm 1.
3:double fy = (l + 16.0)/116.0;
4:if (fy > 6.0/29) then y = Yn × Math.pow(fy, 3);
5:else y = (fy − 16.0/116.0) × 3 × 6.0/29.0 × 6.0/29.0 × Yn;
6:double fx = fy + a/500;
7:if (fx > 6.0/29) then x = Xn × Math.pow(fx, 3);
8:else x = (fx − 16.0/116.0) × 3 × 6.0/29.0 × 6.0/29.0 × Xn;
9:double fz = fy − b/200;
10:if (fz > 6.0/29) then z = Zn × Math.pow(fz, 3);
11:else z = (fz − 16.0/116.0) × 3 × 6.0/29.0 × 6.0/29.0 × Zn;
12:// CIE-XYZ to RGB
13:r = (rx × x + ry × y + rz × z) × rxf;
14:g = (gx × x + gy × y + gz × z) × rxf;
15:b = (bx × x + by × y + bz × z) × rxf;
16:Return C(r,g,b)
(3) With the diverging colors discussed in the former step, the hypsometric map is created automatically. This map is then exported as an image.

3. Results and Discussion

With the mapping method provided by this approach, the hypsometric map of the lunar surface at a large scale can be produced. The mapping area “No. 32” is taken as an example. The map is divided into 32 classes. Because two typical topographies are present at the large scale on the lunar surface (the relative high place and the relative low place), we set two pairs of the initial color(all in the RGB Color Model): Cmin(140,140,255) to Cmax(255,255,255) to represent the relative low place and Cmin(255,255,255) to Cmax(255,163,0) to represent the relative high place. Each topography has 16 classes. The map result is shown in Figure 5.
In the mapping area in Figure 5, the elevation changed substantially in the crater, whereas the other areas are almost flat. When the color model is also even, the colors were distributed primarily in the crater, whereas the remaining portions are identical in color, complicating the interpretation of the topographic information. After adjusting the diverging colors by neglecting the change in the crater, the colors distributed evenly in the area outside the crater, enhancing the representation and clarifying the topographic details.

4. Conclusions

In this approach, we developed a diverging-color setting method for a lunar large scale hypsometric map based on entropy, and we applied this method to edit a CE2 atlas. The experiment shows that this method could improve the visualization of the hypsometric map. The topographic details of the lunar surface could be more clearly presented than the method utilized in the CE1 atlas. However, several drawbacks of the method are noted. First, for the diverging colors, we neglected the entropy difference between different colors, and this parameter might be considered in future research. Second, because this method was designed for a hypsometric map to represent the topographic details at a large scale, this process might not be suitable at other scales. Third, because we set different color models for different mapping areas, comparing the elevation for neighboring maps is not straightforward.

Acknowledgments

We thank the GRAS of China Lunar Exploration Program for providing the lunar data in our research. We also feel grateful to all the anonymous reviewers and editors for helping us improve the quality of this article. This study is funded by National Natural Science Foundation of China, 41401509, National Natural Science Foundation of China 41371414 and Open Research Fund Program of the Key Laboratory of Digital Mapping and Land Information Application Engineering, National Administration of Surveying, Mapping and Geoinformation, China (NO. GCWD201402).

Author Contributions

Xingguo Zeng proposed the main idea of this manuscript and was responsible for the research process. Lingli Mu provided and Jianjun Liu set up and managed the research framework for this approach in the DEM data pre-processing phase. Yiman Yang assisted with the experimental work in the calculation and mapping of the hypsometric map. All authors have read and approved the final manuscript.

Conflicts of Interest

The authors declare no conflict of interest.

References

  1. Shannon, C.E. A Mathematical Theory of Communication. Bell Syst. Tech. J 1948, 27, 379–423. [Google Scholar]
  2. Batty, M. Spatial Entropy. Geogr. Anal. 1974, 6, 1–31. [Google Scholar]
  3. Pászto, V.; Tuček, P.; Voženílek, V. On Spatial Entropy in Geographical Data, Proceedings of the GIS Ostrava, Ostrava, Czech Republic, 25–28 January 2009.
  4. Batty, M. Space, Scale and Scaling in Entropy Maximizing. Geogr. Anal. 2010, 42, 395–421. [Google Scholar]
  5. Sofia, G.; Tarolli, P.; Cazorzi, F.; Dalla Fontana, G. An Objective Approach for Feature Extraction: Distribution Analysis and Statistical Descriptors for Scale Choice and Channel Network Identification. Hydrol. Earth Syst. Sci. 2011, 15, 1387–1402. [Google Scholar]
  6. Sofia, G.; Dalla Fontana, G.; Tarolli, P. High-Resolution Topography and Anthropogenic Feature Extraction: Testing Geomorphometric Parameters in Floodplains. Hydrol. Process. 2014, 28, 2046–2061. [Google Scholar]
  7. Batty, M. Entropy in Spatial Aggregation. Geogr. Anal. 1976, 8, 1–21. [Google Scholar]
  8. Ruiz, M.; López, F.; Páez, A. Comparison of Thematic Maps Using Symbolic Entropy. Int. J. Geogr. Inf. Sci. 2012, 26, 413–439. [Google Scholar]
  9. Li, K.; Chen, J.; Tarolli, P.; Sofia, G.; Feng, Z.; Li, J. Geomorphometric Multi-Scale Analysis for the Automatic Detection of Linear Structures on the Lunar Surface. Earth Sci. Front. 2014, 21, 212–222. [Google Scholar]
  10. Bowker, D.E.; Hughes, J.K. Lunar Orbiter Photographic Atlas of the Moon; NASA Special Publication: Washington, DC, USA, 1971. [Google Scholar]
  11. Tiernan, M.; Roth, L.; Thompson, T.W.; Elachi, C.; Brown, W.E., Jr. Lunar Cartography with the Apollo 17 Alse Radar Imagery. The Moon. 1976, 15, 155–163. [Google Scholar]
  12. Kirk, R.L.; Archinal, B.A.; Gaddis, L.R.; Rosiek, M.R. Lunar Cartography: Progress in the 2000s and Prospects for the 2010s, International Archives of the Photogrammetry, Remote Sensing and Spatial Information Sciences, Volume XXXIX-B4, Proceedings of XXII ISPRS Congress, Melbourne, Australia, 25 August–1 September 2012.
  13. Bussey, B.; Spudis, P. The Clementine Atlas of the Moon; Cambridge University Press: Cambridge, UK, 2004. [Google Scholar]
  14. Araki, H.; Tazawa, S.; Noda, H.; Ishihara, Y.; Goossens, S.; Sasaki, S.; Kawano, N.; Kamiya, I.; Otake, H.; Oberst, J.; Shum, C. Lunar Global Shape and Polar Topography Derived from Kaguya-LALT Laser Altimetry. Science 2009, 323, 897–900. [Google Scholar]
  15. Li, C.L.; Liu, J.J.; Ren, X.; Mou, L.L.; Zou, Y.L.; Zhang, H.B.; Lü, C.; Liu, J.Z.; Zuo, W.; Su, Y.; et al. The Global Image of the Moon by the Chang’E-1: Data Processing and Lunar Cartography. Sci. China Earth Sci. 2010, 5(3), 1091–1102. [Google Scholar]
  16. Mu, L.L.; Li, C.L.; Liu, J.J.; Ren, X.; Zou, X.D. A New Mapping Method for the Moon with the Chang’E-1 Data. Proceedings of the 26th International Cartographic Conference, Dresden, Germany, 25–30 August 2013.
Figure 1. Stereoscopic camera on the CE2.
Entropy 17 05133f1
Figure 2. Selected mapping areas.
Entropy 17 05133f2
Figure 3. Distribution of the elevation of Map 32.
Entropy 17 05133f3
Figure 4. Map result when applying the available diverging color list.
Entropy 17 05133f4
Figure 5. Map results when applying the calculated diverging color list.
Entropy 17 05133f5
Table 1. Technical parameters for the camera.
Technical parameterContent
Spectrum range450 ~ 520 nm
Quantization level8 bit
MTF≥ 0.2 (considering the influence of speed altitude ratio adjustment)
S/N (ρ = 0.2,θ = 60°)≥ 100
Gain3 selections (G = 0.7, 1.0, 2.0)
Width of the image43 km (@ 100 km orbit), 9.2 km (@ 15 km orbit)
Base to height ratio≥ 0.45
Pixel resolutionBetter than 10 m
Optical system factorCCD Stereo camera focal length144.3 mm
Relative apertureF/9
Integral number5 selections (16, 32, 48, 64 and 96)
Stereo angleFront view +8°, back view −17.2°
CCD detective unitPixel number6144
Pixel size10.1 μm × 10.1 μm

