1. Introduction
The new generation of personal authentication technologies based on individual biological characteristics is the core of various applications of the real or the virtual society. Face recognition is the most natural mode of identification. Unlike other modalities like fingerprints, palmprints and iris scans, the face is a passive biometric whose frontal and profile views can be captured from a distance without an active participation of the user. This advantage makes it useful for security and surveillance tasks, so face recognition has become a hot topic and also one of the most challenging research topics in recent years (see [
1–
3]).
Face recognition based on principal component analysis (PCA) is a basic and classical method (see [
4]). The PCA method computes the covariance matrix of the training images and calculates the eigenvalues and eigenvectors of this matrix. Then the components that correspond to the top few largest eigenvalues (equal to the corresponding variances) are retained to achieve the purpose of data dimensionality reduction (see [
4–
6]). Finally certain classifiers such as the nearest neighbor algorithm (see [
7]) are used to recognize the query face images. Many important face recognition methods such as kernel PCA (KPCA) and linear discriminate analysis (LDA) are derivatives or transformations of PCA (see [
8–
12]).
In the PCA method, the total information in the training samples is evaluated by the total variance. The remaining components keep most of the variance, that is, most of the information. To the best of our knowledge, besides the variance, the information can also be computed by entropy, which is an important complement of the variance. The variance evaluates the degree of dispersion of a variable, while the entropy evaluates the uncertainty of its distribution. We note that the entropy-based feature extraction methods are not as popular as the conventional methods like PCA and LDA. Till now, some new entropy information theoretic methods for feature extraction have been developed. One research area is to discuss new entropy functions, new computational algorithms or new entropy estimation techniques in feature extraction such as in the works of Mamta and Hanmandlu [
3,
13] and Hacine-Gharbi
et al. [
14]. Another research area is to combine entropy features with other face recognition methods. For example, Cament
et al. [
15] combined entropy-like weighted Gabor features with the local normalization of Gabor features. Marsico
et al. [
16] used Gallery entropy for template selection in face biometric identification systems. Chai
et al. [
17] first divided a face image into a few regular blocks of a given size, then explored the information entropy on image patches to automatically learn the number of sets in which each region should be divided. Besides, some recent research has also made use of entropy in PCA such as [
18], where the authors presented a new rotational-invariant PCA based on maximum correntropy criterion and a half-quadratic optimization algorithm is adopted to compute the correntropy objective. However we notice that all these research projects do not define an entropy matrix to load the entropy information, just like the covariance matrix loading the variance information.
If a dimension reduction method can make good use of both the variance information and the entropy information, and extract features representing most of the two kinds of information, it is expected to be an ideal recognition method. In this paper, based on the traditional definition of entropy, Shannon entropy, we try to find new feature extraction method. We construct a new entropy matrix to load the entropy information, similar to the covariance matrix loading the variance information. Then we integrate the entropy information and the variance information by using the proposed entropy matrix and PCA or its extension methods. Note that PCA is a global statistical facial recognition method, whose significant disadvantage is to treat all features equally. In fact, different elements (pixels) in a face image matrix play different roles for face recognition. Another disadvantage of PCA is that it does not use some useful classification information in face recognition, so based on the above basic entropy matrix, we first construct a weighting entropy matrix to transform the original facial images, whose aim is to treat the important local features differently and fully use the classification information. Then PCA can be performed on the transformed facial images to make full use of the entropy information and variance information. Our proposed method contains two stages where the first stage uses the local features measured by the entropy information matrix and the second one is correlated to the global features measured by the covariance information matrix. As far as we know, although some literature in the pattern recognition field has discussed entropy-weighted methods and the fusion of local and global features, our proposed method for the construction of the entropy matrix and the novel entropy-difference weighting (EW) matrix are new research ideas.
The paper is organized as follows: Section 2 defines a new entropy matrix and the corresponding EW matrix for transforming the original training samples. Section 3 proposes a combination method of EW matrix and the linear PCA method. Also the combination of the nonlinear KPCA with the proposed EW method is introduced for improving the recognition effects. Section 4 gives the experimental results. Section 5 summarizes the whole paper and the concluding remarks.
2. A New Entropy Matrix and the Entropy-Difference Weighting (EW) Matrix
2.1. General Data Division Method for Small Sample Size Problems and Shannon Entropy Matrix
For a certain random variable
whose possible values are
, Shannon entropy
is given by the formula:
where
is the probability of
and
is usually set to 2. The possible range of information entropy is
, where the left equal sign holds (
) corresponding to the minimum uncertainty if and only if the probability of a certain value of the random variable is equal to 1 and the probabilities of the other values are all equal to 0, and the right equal sign holds (
) if and only if
which implies the maximum uncertainty of the random variable.
Suppose a
image matrix
. This paper uses information entropy (Shannon) to measure the uncertainty information for each
,
,
. For the training images, we divide the possible range of each
(
,
) into several sections,
i.e., data division, which is necessary when the size of the training samples is not large enough to cover all the possible values of
. For example, there are only 10 images for each subject in the ORL facial database and 11 images for each subject in the Yale one, but for these gray face images, the possible values of each
are integers ranging from 0 to 255. In this case, directly computing the entropy without dividing the data will greatly affect the reliability of the results due to the sparse problem. Specifically, corresponding to
, we define a
matrix
, where:
is the threshold which need to be predetermined and
is
a symbol representing the
th section, whose specific numerical value does not matter. For facial gray images,
,
are integers in (0, 255). Note that besides gray images, this data division method can be extended to the generally case when
(
,
) is continuous.
We mainly discuss the estimation of entropy for each
(
,
) in face application. If the training samples
contain
subjects,
i.e.,
, where
is a
matrix whose
element is
, each
can be transformed to an identification matrix according to
Equation (2). Denote the entropy matrix for the training sample
as
. Denote the frequency of
in
training samples by
,
. According to
Equation (1), it is easy to give an estimation of
, say
:
Sometimes, only a threshold is needed to divide all the matrix elements into two parts,
i.e.,
. Let
in this binary process, we have:
So it is possible for the entropy to be used as the traditional weighting coefficient since it varies in the interval [0, 1]. This idea is important in the following research. Generally for any
we can set
to make
and
, (
,
). Besides this treatment, recent references such as Heo and Gader [
19] show an important idea of weighting without the sum-to-one constraint, which relaxes constraint of the one generally required for weighting methods having the sum-to-one constraint. The relaxed constraint makes it possible to accommodate measures that do not satisfy the sum-to-one constraint if
.
2.2. Specific Data Division Techniques in Treating Face Images
For face recognition, the specific data division techniques to be used need to be discussed. According to
Equation (4), if we divide all the matrix elements into two parts,
i.e., only a threshold is needed, the entropy can be used as a basis of the traditional weighting coefficient since it is in the range of [0, 1]. This data division is reasonable here due to the fact that for the gray facial images whose features are in [0, 255], the vast majority of small changes in the gray scale is used to show 3D facial contour visual effects, which are generally of no use in facial recognition and could be marked into one classification. Other big features which play great role in recognition can be marked into the other classification. This binary treatment also possesses the advantage of simplicity in calculation. The remaining work is to choose a threshold value
to transform all the elements for
image matrix into either 1 or 0 to form a new identification matrix. In the practice, we can search values from 0 to 255 to find the best
for the best recognition rate. It is easy to see that different type of facial images can have different
value.
Denote
be the identification matrixes, where
is a
matrix whose
element is:
Here
is a specific form of
Equation (2). Then we have:
where
is 1 or 0,
denote the probability of
in the
element among the matrix set. Practically
can be estimated by the corresponding frequency as
Equation (7):
2.3. Entropy-Difference Weighting (EW) Matrix
Just as the covariance matrix loads the information of the training sample, which can be used to carry out the eigendecomposition to extract the principle components, the proposed entropy matrix can load the information of the distribution uncertainty of the training sample. Proper usage of this entropy matrix can help extract good features of the training samples. For example, an entropy-matrix-based component analysis is a further prospective study which may produce meaningful results. However, in this paper, we try to combine the covariance information and the entropy information of the training samples so as to extract the more valuable features than just using one of them such as PCA.
For facial images without too much interference by some outer factors, after doing many experiments on different facial databases we find a conclusion that after data division, the within-class uncertainty of
(
,
) is often small while the between-class uncertainty is often large if each classification is reasonable classified. This conclusion is similar to the idea of Fisher’s linear discriminant analysis LDA (see [
11,
12]) of finding an optimal projection maintaining the largest discrete distance between classes and the smallest discrete distance within classes. Therefore, it is reasonable to compute a total entropy matrix to evaluate the overall uncertainty of
. Also an entropy matrix for each classification is computed to evaluate the within-class uncertainty of
, whose elements are expected to be considerably small. Then the average within-class entropy matrix is computed, whose elements are all also considerably small. The difference of the total entropy matrix and the average within-class entropy matrix, which is called an entropy-difference matrix in this paper, can reflect the importance of each element of
in pattern recognition. The mathematical formulae are as follows:
Suppose there are
classes in the total facial images. Denote
,
,
, where
is the
entropy element of the
th class and
, where
, be the total entropy matrix, the within-class entropy matrix of the
th class
and the average within-class entropy matrix among
classes, respectively. Define:
be an entropy-difference matrix loading the information of how important each
(
,
) is as far as its entropy is concerned. Similar to the famous Fisher criterion, the relationship between
and
is as follows:
A large
implies a large total entropy
and a small within-class entropy
according to
Equation (8), that is, a small within-class uncertainty and a large between-class uncertainty of
among training samples.
A small
mostly shows large elements in both
and
or small elements in both
and
, that is, a
whose within-class uncertainty and between-class uncertainty are both small, or both large in training samples.
Based on the above criterion, we can use
as a weighting matrix to re-evaluate the original
image matrix
, so
is called the EW matrix in this paper. We believe that an element
in
is large implies that
is an important element since it is useful for classification and recognition. At the same time, a small element
in
means the corresponding
is an interference feature or redundant feature which needed to be given a small weight since it is of no use for recognition.
Denote
be the transformed samples of
by the entropy-difference matrix, where
is also a
matrix. We have:
that is,
is the Hadamard product (also known as the Schur product) of matrices
and
. The processes of both
Equations (8) and (
9) are an entropy-difference matrix weighting method for the original data matrix, which is called an EW method in this paper. After this weighting process, some covariance analysis methods such as PCA can be performed to extract the important features for pattern recognition. Then, according to
Equations (8) and (
9), we get the coefficient matrix
and use it to transform the input facial image matrix. To sum up, the main step of EW method for treating face images is as follows.
For each facial image matrix, by using a threshold value to transform its elements into 1 or 0, we get a new identification matrix.
For all identification matrixes, we compute a total entropy matrix to evaluate the overall uncertainty of each feature
.
In each classification, an entropy matrix is also computed to evaluate the within class uncertainty. Then the average entropy matrix of different classes can be calculated.
Compute the difference of the total entropy matrix and the average classification entropy matrix. Use the difference matrix to transform the original image matrix.
In Section 3, we will discuss how to combine the EW method with the PCA or KPCA methods to make use of both entropy information and covariance information. We find that this combination also has other meaningful interpretations. Note that as a weighting method, the EW matrix can take advantage of the training samples’ local information through entropy, so it can be fused with other global statistics methods such as PCA. The usual facial recognition methods based on global statistics often treat each feature
of the training images equally. However the important features of human faces often concentrate on some local positions. Although the global methods can reach the global optimum, they fail to use the important local features and thus cannot fully improve the computational efficiency. For refining the local features, one possible way is to set a coefficient or weight with values in [0, 1] to correspond with the feature
in a
matrix
. Then
can be transformed with the coefficient so as to remain or strengthen the important features and cut or weaken redundant or interfering features. The more important a feature is, the closer the coefficient set is to 1. The more redundant a feature is, the closer the coefficient set is to 0. On the other hand, a global statistical method such as PCA does not use the category information of the training samples to help learning facial features, while this category information is very important and useful for facial recognition, so in order to obtain the transforming coefficients for a feature and make use of the category information of the training images, this paper firstly uses the proposed EW method to process the original training facial images. We compute the entropy for each feature to symbolize the degree of its importance and obtain the corresponding coefficient. Using the coefficients to make linear transformation for each training image can reduce the noise, eliminate the interference and fully refine the classification information from the training images.
3. The EW-based Principal Components Analysis (EW-PCA) Method and the EW-based Kernel Principal Components Analysis (EW-KPCA) Method
3.1. The EW-based Principal Components Analysis (EW-PCA)
The EW method can process different data matrices including facial image matrices to achieve the aim of preserving the important information and reducing the redundant by using entropy difference. As an important application, we combine the EW method with the popular PCA method to load both the entropy information and the covariance information to reach a better recognition effect.
First, we introduce the main procedure of PCA. For a
image matrix
, it can be straightened to be a
column vector according to its rows. We also use
to represent this column vector. Denote
be the
covariance matrix of all training samples, where
. Compute the eigenvalues and eigenvectors of
, which can be achieved with singular value decomposition (SVD) method or other proper methods. Then pick out the top d eigenvalues according to their information contribution. The
corresponding eigenvectors form a
matrix
. The eigenfaces of facial image can be obtained through
, where
and
is a
matrix.
The EW-based PCA method is as follows. Suppose
are the transformed matrixes from
according to (
9). Straighten
to be the
column vectors, whose covariance matrix is
, where
. The eigenvectors of
corresponding to the top
d eigenvalues can form a
transformation matrix
. The eigenfaces of facial images can be obtained through
Equation (10):
where
and
is a
matrix. We call this method as EW-PCA method, which is expected to obtain high recognition rates since it possesses both the global and the local advantages.
The remaining work is to calculate the vector norm such as the Euclidean distance between the eigenfaces of the test image and each training image, respectively. Based on the idea of classifying the test image to its nearest neighbor (see [
7]), we rank those distances according to the ascending order. The minimum distance and its corresponding training category is the category that the test image should be judged into.
3.2. The EW-based Kernel Principal Components Analysis (EW-KPCA) Method
Since most practical data are nonlinear, current linear methods cannot study their latent rules. Kernel-based methods can deal with this problem (see [
8,
9]). The basic idea of kernel methods is to map the original nonlinear data into a high-dimensional feature space
to make the mapped data linear. Then the linear methods such as PCA can be used to extract the features from the mapped data. With a kernel trick of
we can get the mapped covariance of samples
and
. Commonly used kernels include polynomial kernel
, radial basis function kernel
, sigmoid kernel
, ANOVA kernel
and Laplacian kernel
,
etc. Then a
kernel matrix
can be obtained with certain kernel.
Through the kernel trick, kernel PCA (KPCA) avoids the curse of dimensionality and greatly reduces the amount of computation. However, the disadvantages of KPCA method are that it still treats different elements in an
image matrix equally, ignoring some important local features (elements) and abandoning the sample classification information as well, so we propose the EW-based KPCA (EW-KPCA) method.
Still denoting
be the straightened
column vectors, without loss of generality, we select the polynomial kernel with
and
to compute the kernel matrix
, that is,
,
. The centralized matrix (see [
20]) of
is
in
Equation (11):
where
is the
matrix of
. Calculate the eigenvalues and eigenvectors of
and the eigenvectors corresponding to the top
eigenvalues can form a
transformation matrix
. The eigenfaces of facial images can be obtained through the transformation (
12):
where
is a
matrix. Finally, like the mentioned method of classifying the test image to its nearest neighbor, we can obtain the recognition results.
Note that in this paper, we focus on feature extraction with our EW method and its combination with PCA and KPCA, so we simplify the discussion about kernels and recognition methods. Other research can be proposed to determine how to choose a suitable kernel for the practical data to achieve the best recognition rates, or how to choose a proper recognition method to adapt different applications for a fixed kernel, which are omitted here for clarity.
4. Experiments and Analysis
In this section, we demonstrate the effect of the proposed EW method with the popular ORL face image database (see [
21]) and the Yale database (see [
11]), compare PCA with EW-PCA methods through experiments, and KPCA with EW-KPCA as well. The ORL database contains a set of face images taken between April 1992 and April 1994 at the labs of Cambridge University. The size of each image is 92×112 pixels, with 256 gray levels (from 0 to 255) per pixel. The images are organized in 40 directories (one for each subject), in which 35 subjects are male and five subjects are female. In each of these directories, there are 10 different images of that subject. For some subjects, the images were taken at different times, varying the lighting, facial expressions (open/closed eyes, smiling/not smiling) and facial details (glasses/no glasses). Face poses change to some extent. Images have some rotation from depth and plane. Face scale also has as much as 10% change, so ORL is an ideal experimental database for facial recognition.
The Yale face database comes from Yale University and contains 165 gray scale images of 15 individuals. There are 11 images per subject, one per different facial expression or configuration: center-light, with glasses, happy, left-light, without glasses, normal, right-light, sad, sleepy, surprised, and winking. The ORL and the Yale have different focuses, respectively. At the same time they both contain abundant types of changes. The tests based on these two databases can fully reflect the performance of different face recognition methods. Besides, according to Sections 2.1 and 2.2, the methods of data division, entropy matrix and EW matrix are expected to have advantages in small sample size databases rather than big size ones, so we here do not consider some big face databases. The following experiments’ running environment was a Win7 system, Intel (R) Core (TM) 2 Duo CPU 1.60 GHz, Ram 2.00 GB, MATLAB R2009a version.
4.1. Experiments of EW Method
The EW results based on the ORL facial database are shown in
Figures 1 and
2. In
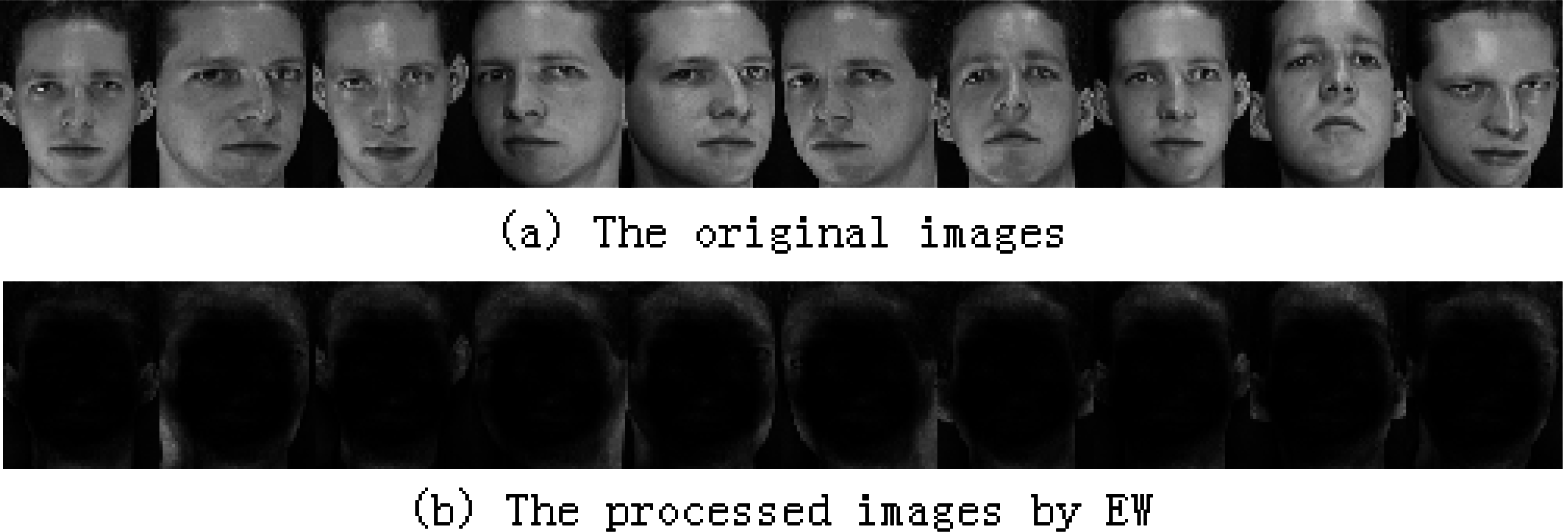
Figure 1, the threshold value
is set to be 52. The determination of
is by searching the values in [0, 1] through many experiments to get an approximately best value. Further discussion about how to choose or tune this parameter is provided in Section 5.
Figure 1a shows the original images and
Figure 1b are the images ideally processed by the EW method. As can be seen in
Figure 1a, there were changes of lightening, expression, pose and rotation angle, and the overall changes cover a wide range. In the images processed by EW (
Figure 1b), we can see that the light changes were basically eliminated. In the areas containing rich features such as the eyes, the nose, the mouth, the ears and the face contour, the critical features had been remained, which showed a small lighter area in the images. Other features were weakened to some extent, which showed a darker area in the images. Through the EW method, we obtained an ideal local feature retention effect in
Figure 1b.
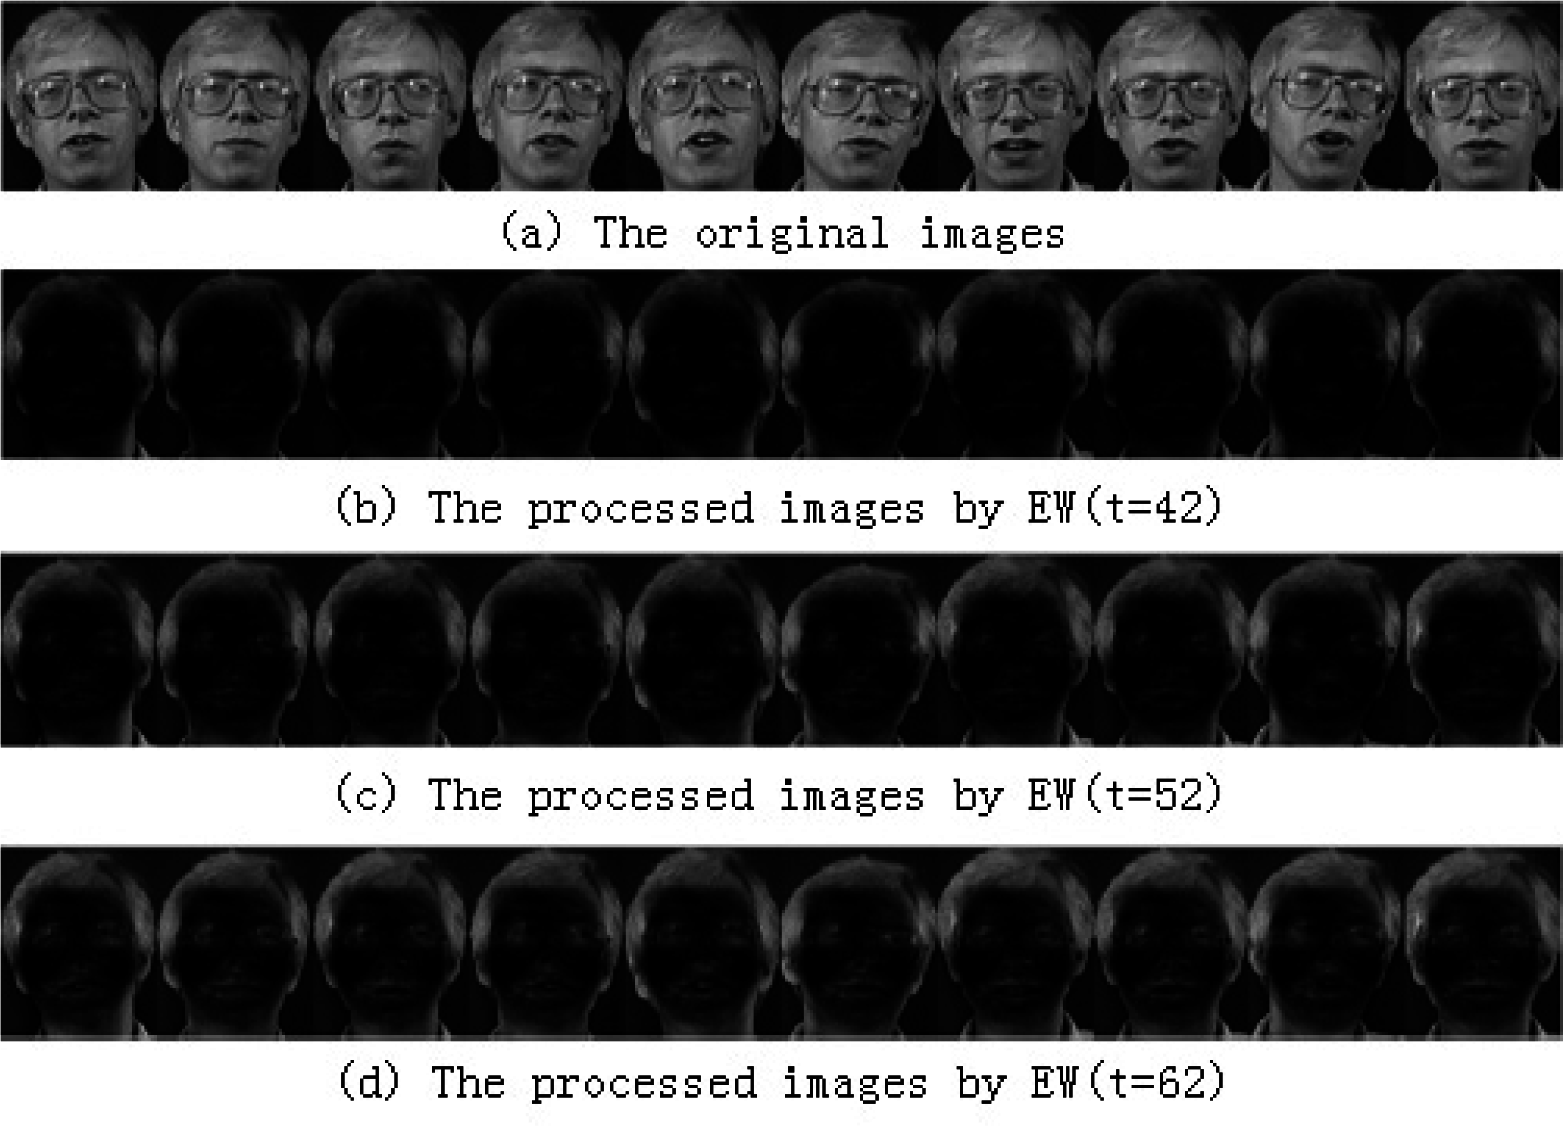
In the ORL facial database, since images of different subjects approximately satisfy the condition of balanced illumination levels, the approximately optimal threshold values
for different subjects are approximately the same, say
. Further, our multiple experiments showed that besides the optimal
, EW with a rough or approximate threshold may also achieve a relatively good local feature retention effect, so in
Figure 2, besides
, we also tried the values around it such as
t = 42 and
t = 62.
Figure 2b–d shows the different effects for local feature retention, generally speaking, these effects were apparent indicting that the EW method was robust to a certain extent as far as the threshold value was concerned. On the other hand, compared to
Figure 2c,
Figure 2b seemed not to fully to extract features, while
Figure 2d seemed to extract too many local features which were not beneficial for classification and recognition.
The EW processed results of Yale face database were shown in
Figures 3 and
4. In
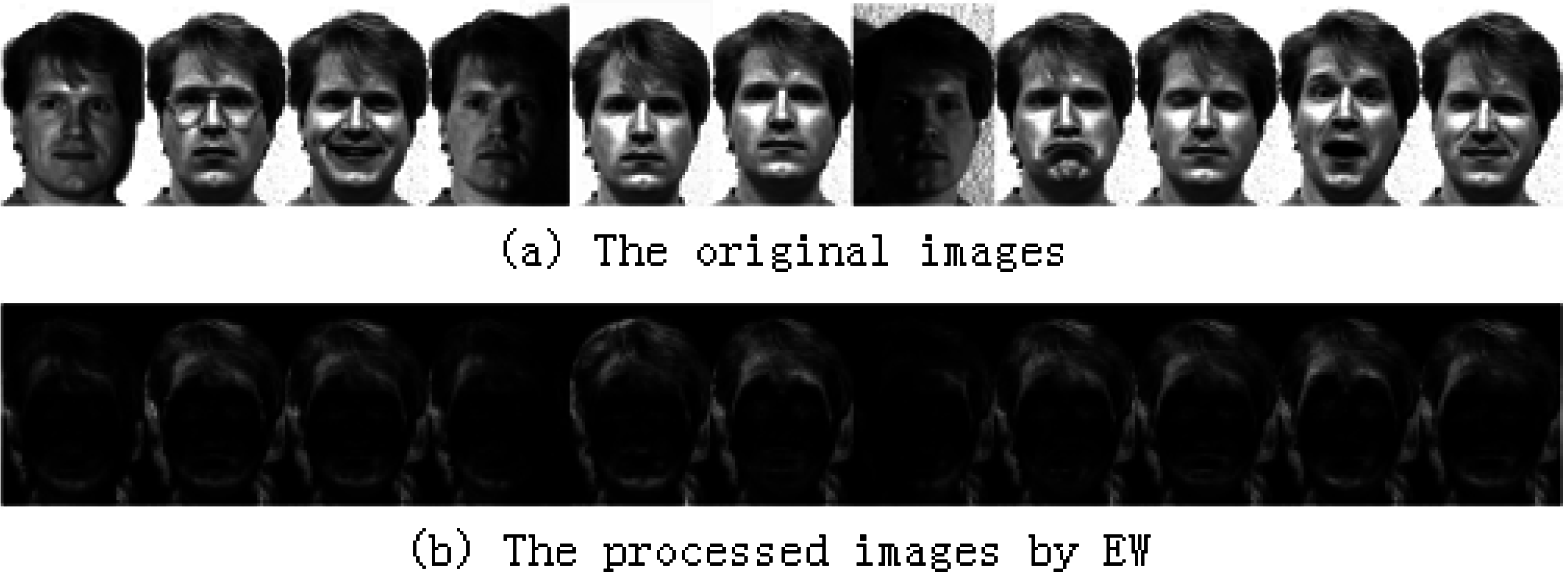
Figure 3, the threshold
. In
Figure 3a, the original images contained changes of the light, the expression, the background in different light environment as well as the change of wearing glasses or not. All images were frontal perspectives, but the variation of the lightening and expression was very rich. In
Figure 3b, after the ideal EW treatment with threshold value
, the changes of the background under different light conditions and the influence of wearing glasses were successfully eliminated. Similar to the effects of the ORL database, through the EW method, the critical features of the feature- rich areas are retained, so we obtained an ideal local feature retention effect.
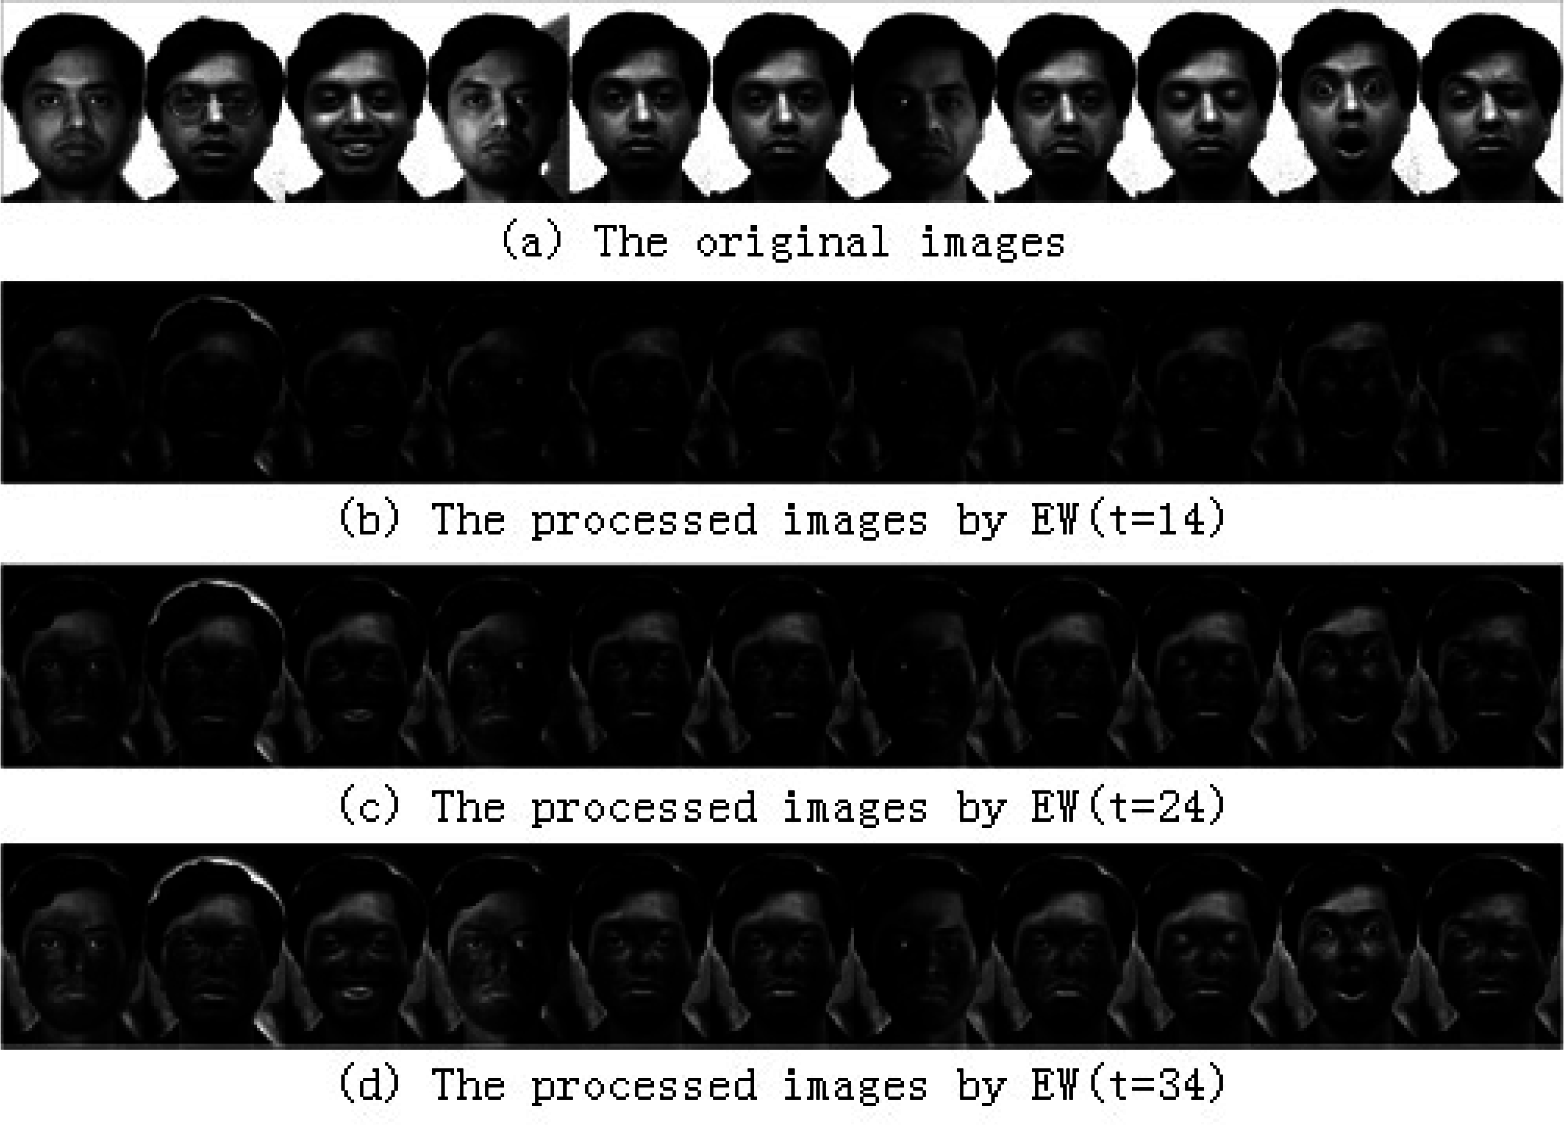
In the Yale facial database, similar to the conclusions with the ORL database, the optimal threshold values
for different subjects are approximately the same, say
. For another subject of the Yale, besides the approximately optimal threshold
, different EW effects with nearby threshold values such as
and
were also calculated in
Figure 4.
Figure 4a is the original images.
Figure 4b–d show the different local feature retention effects. Compared to
Figure 4c,
Figure 4b appears to be less well characterized, while
Figure 4d seems to extract too many local features which were not conducive to identification. Although there were differences in the EM local retention effects when the thresholds varied in a reasonable range, on the whole these differences of the EW feature retention effects was reasonably small which indicted the robustness of the proposed method to a certain degree.
4.2. The Comparison between PCA and EW-PCA Experiments
We used a closed-form solution by supposing the query (or the test) images must belong to a certain classification (or subject) in a predetermined facial set. In order to obtain more objective and accurate experimental results, the test samples were randomly selected from the total set. Each experiment was repeated 50 times and their average value was taken as the final result. Especially, our experiments were carried out according to the following three programs:
Program 1: For each subject, randomly select one image as the test image, and the remaining ones are used as the training images. This program was aimed at assessing face recognition methods under ideal testing circumstances.
Program 2: For each subject, randomly select half of the images as the test images, and the remainder as the training images. This program was designed to assess the face recognition methods in a general testing circumstance.
Program 3: For each subject, randomly select one image as the training image, and the remaining ones as the test images. This program was designed to assess the face recognition methods under a challenging testing circumstance.
We used the ORL database and the Yale database, respectively, to compare the recognition rates of EW-PCA and PCA, in which we selected the nearest neighbor classification rule (see [
7]) as the classifier by calculating the Euclidean distance between the test image and each training image and classify the test image to its nearest classification. The experimental results are summarized in
Figures 5–
10.
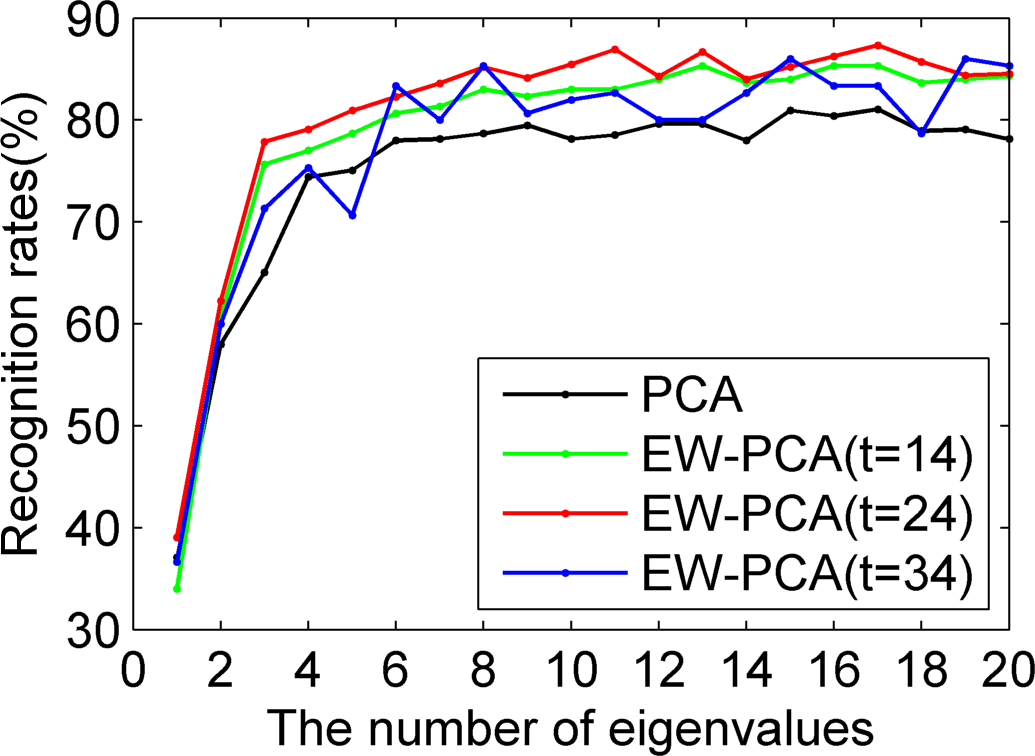
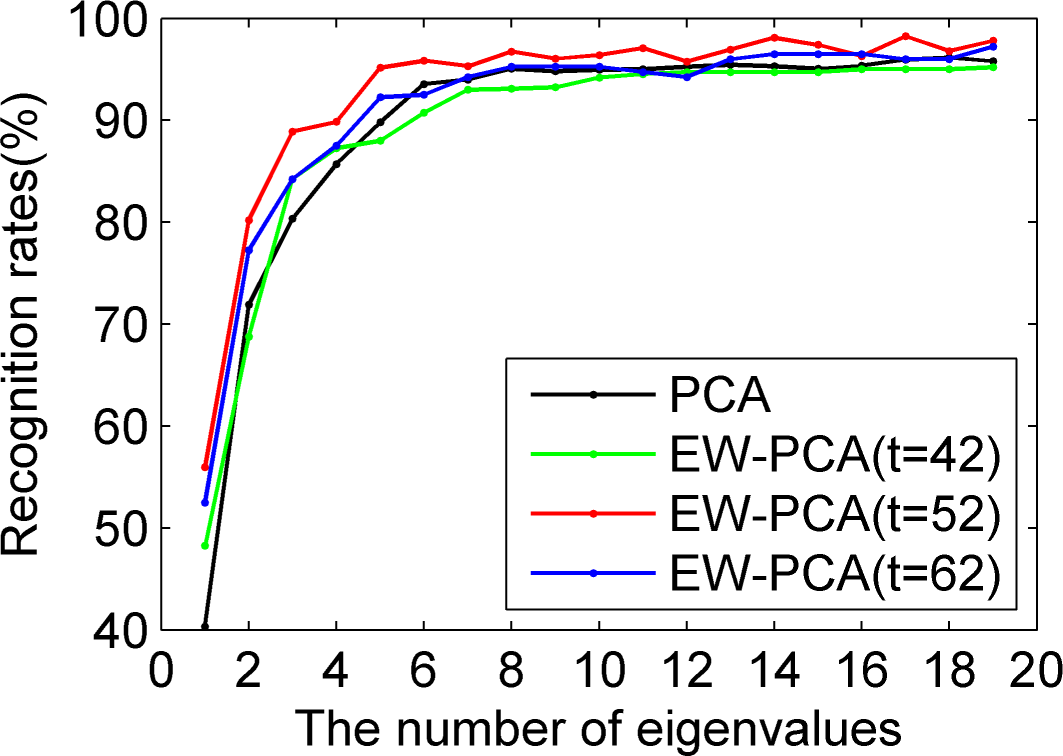
Figures 5–
7 were all results of ORL by comparing PCA, EW-PCA with
, EW-PCA with
and EW-PCA with
, where the approximately optimal threshold value
. The only difference among
Figures 5–
7 was that they used Program 1, Program 2 and Program 3, respectively, with other settings the same. Here
and
were used to demonstrate how the difference was when the threshold varied in a small range on the basis of
.
Generally, we focused on the comparison of PCA and EW-PCA with
, the approximately optimal threshold value. It can be seen from
Figure 5 that the highest recognition rates were basically close in the red fold line and the dark fold line, the former was a little higher than the latter, but if the selected eigenvalues were relatively small, for example, just keeping two eigenvalues, the recognition rate of EW-PCA with
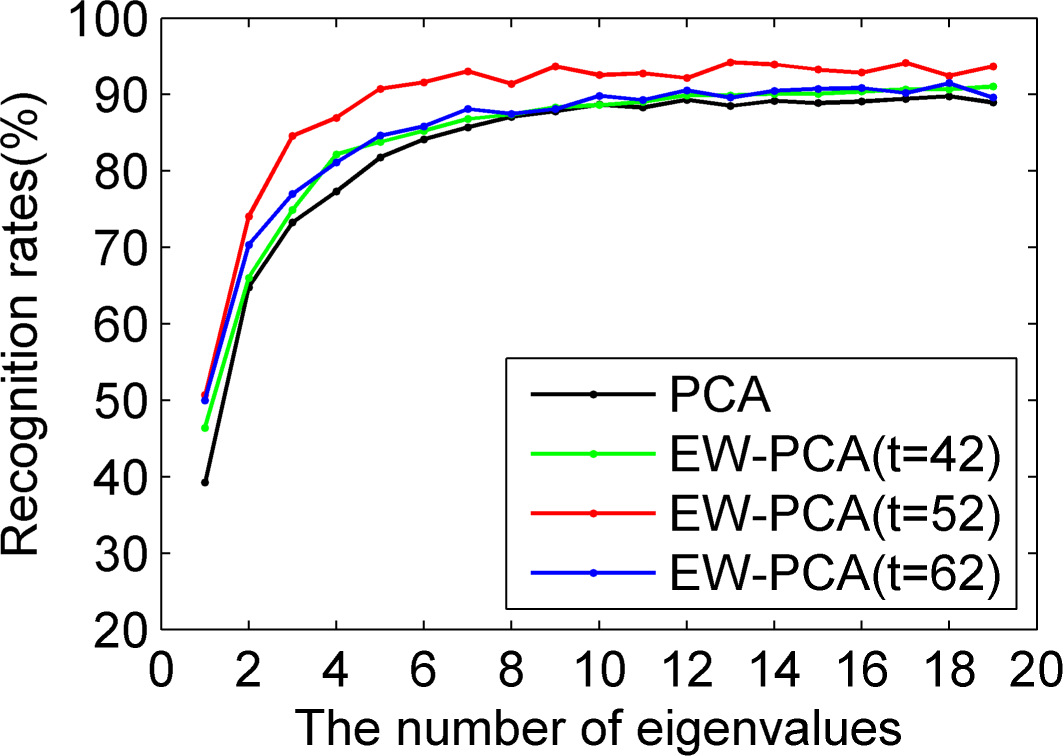
was obviously better than that of PCA. In
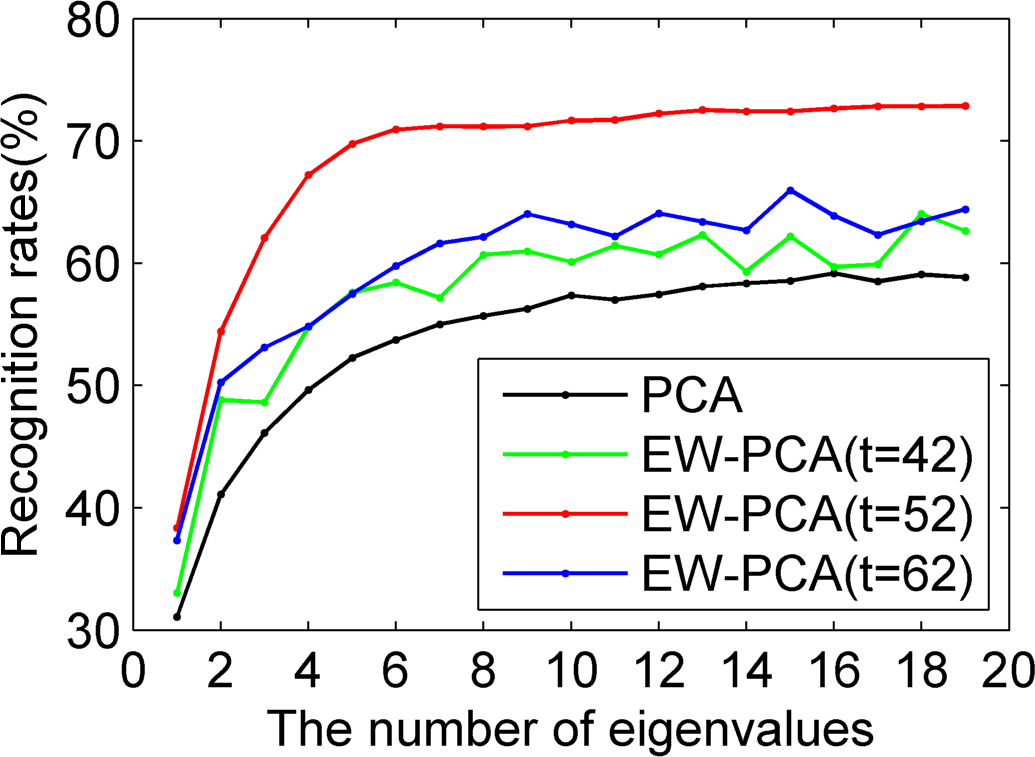
Figure 6 and
Figure 7, the overall recognition rates of the red fold line were significantly superior to those of the dark fold line, especially for
Figure 7, under the challenging circumstance, the advantage of the EW-PCA with
relative to PCA was much more obvious than that of
Figure 5 and
Figure 6.
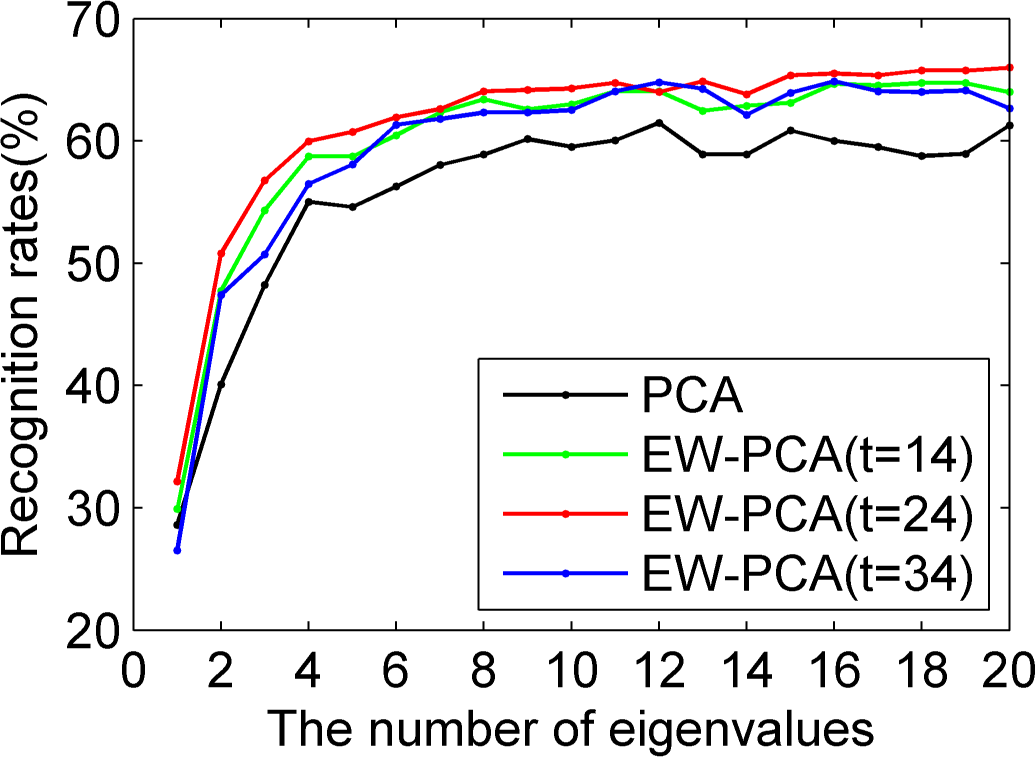
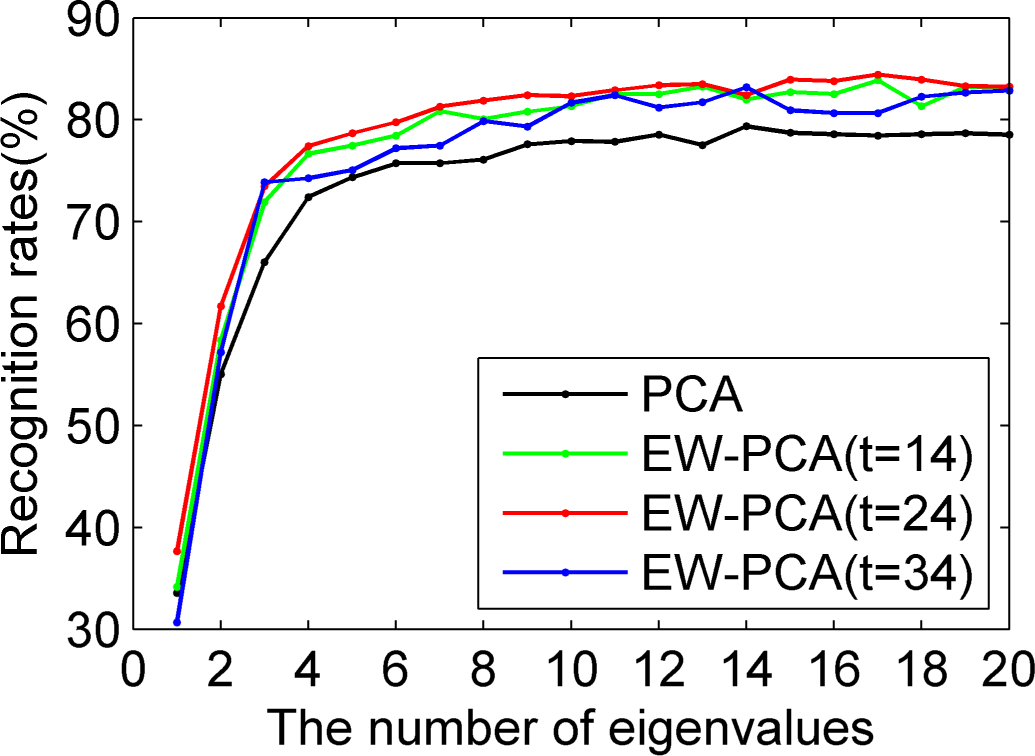
Figures 8–
10 used Yale to compare EW-PCA and PCA with Program 1, Program 2 and Program 3, respectively, other settings being the same. In
Figures 8–
10 we demonstrated the recognition rates of PCA, EW-PCA with
, EW-PCA with
and EW-PCA with
, where the approximately optimal threshold value
. It can be seen from
Figures 8–
10 that no matter which program is used, the recognition rates of the proposed EW-PCA with
were higher than those of the PCA. The fewer the number of selected eigenvalues was, the more obvious the advantage of the EW-PCA with an appropriate threshold.
In
Figures 8–
10, besides the approximately optimal threshold value, EW-PCA with other threshold values around it also reached higher recognition rates than PCA under Program 2 and Program 3, which meant that under a general testing circumstance (Program 2) or a challenging testing circumstance (Program 3) our proposed EW-PCA method was a good and robust feature extraction method. It was easily seen that from Program 1 to Program 3,
i.e., with the increasing difficulty of testing circumstance, the advantage of EW-PCA method was more and more obvious.
4.3. The Experimental Comparison between KPCA and EW-KPCA
Based on the ORL, we used Program 1, Program 2 and Program 3, respectively, to carry out the experiments and compare the recognition rates of KPCA and EW-KPCA with other conditions the same. Without loss of the generality, we chose the polynomial kernel with
and
for simplicity.
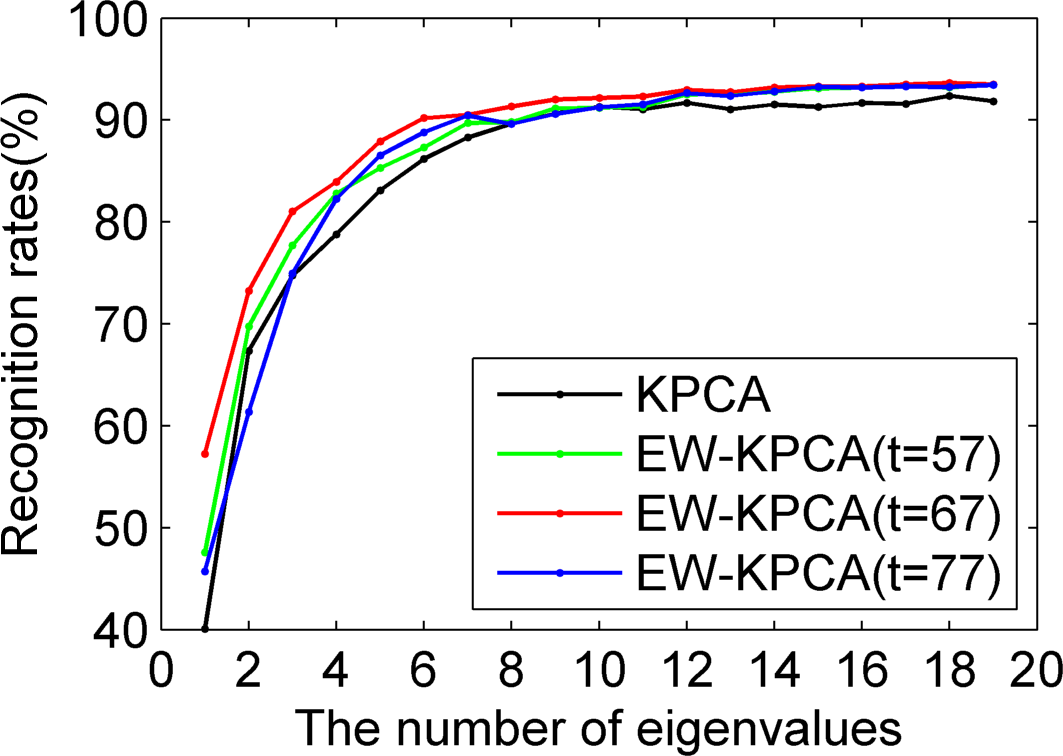
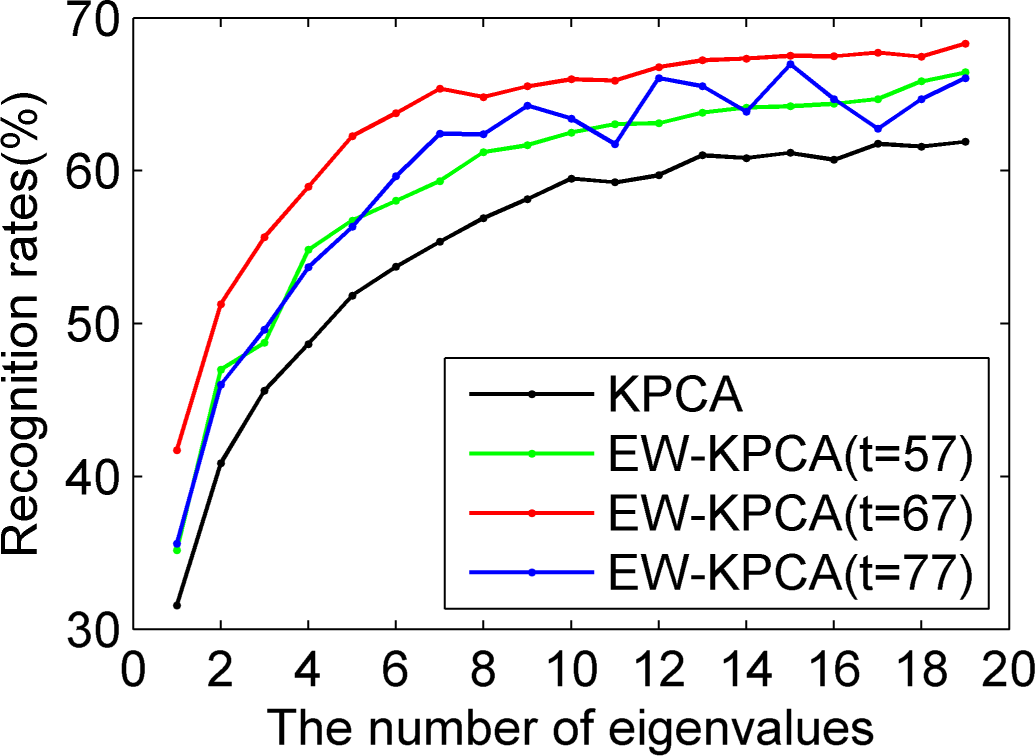
The experiments are summarized as
Figures 11–14, where the approximately optimal threshold value of EW-KPCA was the same one of
, and the results of threshold values around
,
i.e.,
and
were also given. Just like the excellent recognition effect of EW-PCA,
Figures 11–14 show that the overall recognition rates of EW-KPCA with
were higher than KPCA, especially under the challenging circumstances of Program 3 and with a few remaining eigenvalues. EW-KPCA also showed the robustness when the threshold value varied in a reasonable range, say
i.e.,
and
. This robustness especially lied in Program 3, where the recognition rates of all EW-PCA were consistently higher than KPCA. The same conclusion could be drawn with the Yale database, whose experiments were omitted here for brevity.
4.4. The Experimental Comparison between EW-PCA and Linear Discriminant Analysis (LDA)
Since the proposed EW-PCA used the information of classes to construct the weight matrix, another meaningful research task is to compare EW-PCA with certain methods considering both the covariance information and the classification information. It is well known that the famous LDA method (see [
11,
12]) can be viewed as the transformation and extension of PCA by using the information of classes. LDA is closely related to PCA in that they both look for linear combinations of variables which best explain the data (see [
22,
23]), but the main purpose of this linear feature combination for LDA is to separates two or more classes of the objects. LDA aims to find the discriminative vector
satisfying
, where
and
are between-class covariance matrix and within-class covariance matrix, respectively.
We compared EW-PCA with LDA using the ORL database. The experimental results suggested that if a selected threshold value was suitable, the optimal recognition rate of EW-PCA was a little higher than the optimal recognition rate of LDA. For example, when we selected the threshold value
for EW-PCA method, under Program 1 the optimal recognition rate for EW-PCA was 96.2% while that of LDA was 96.1%, under Program 2 the optimal recognition rate for EW-PCA was 91.8% while that of LDA was 91.5%. Here the optimal recognition rate was figured out by comparing different numbers of eigenvalues. Due to the fact the focus of the paper was to propose a new idea about fusing entropy matrix and covariance matrix, more specific experimental results about comparison between EW-PCA and LDA were omitted here.
5. Conclusions and Discussion
For the training samples, on the basis of data division, this paper defined an entropy matrix to load the uncertainty information. Then this paper proposed an entropy-difference matrix to reflect the classification information evaluated by the total entropy and the within-class entropy, so an EW method was proposed to make use of the local important features whose idea was similar to the famous Fisher discriminate criteria. Then the EW method was combined with the traditional methods such as PCA or KPCA, the goal of which was not only integrating the local and global features, but also to integrate the entropy information and covariance information. Especially for face recognition, binary processing for data division was used on the image matrix data, which gave a simple and efficient method for computing entropy, and consequently made the combination of the information of entropy and variance efficient. A significant conclusion about information entropy across classes was that an element
in a
image matrix
was important if its within-class entropy was small and between-class entropy was large.
As an extension study of our proposed EW method, we compared the PCA method to the EW-PCA method and compared the KPCA method to the EW-KPCA method, respectively. The experiments based on the ORL and the Yale databases showed that our proposed EW-PCA method and EW-KPCA method outperformed the PCA method and KPCA method, respectively. This paper choose two databases (the ORL and the YALE) which are not big in size, because we want to demonstrate the advantages of data division when computing the entropy matrix
for small size databases. Theoretically speaking, we can directly calculate the entropy matrix without data division when sample size is large enough.
The EW-based methods overcome the disadvantages of the general global methods which treat the feature of each dimension of the training images equally and do not use the category information of the training images to help studying facial features. The EW-PCA and EW-KPCA procedures are clear and complete, while the determination of the threshold parameters is an incipient research topic. The determination of
presented in this paper searches for the approximately best value in [0, 1] through many experiments. Further research could involve finding efficient searching and iterative algorithms to obtain this threshold value, where an adaptive way may be a good way. In addition, researchers may select threshold value according to some prior knowledge, simplifying the complex of acquisition process. Besides, our multiple experiments show that EW-PCA with a rough or approximate threshold may also be superior to PCA to a certain extent.
The proposed method is more suitable for processing frontal facial images, where the recognition rates of our EW methods is significantly better than the methods not using EW. If the angle of view or expression changes, the recognition effects using the EW method is not so obvious, so we need to pay more attention to this method in application. In addition, the EW method can also be combined with other face recognition methods such as the two-dimensional PCA method, to further improve the corresponding algorithm. Through the effective recognition rates for different methods of EW-PCA and EW-KPCA, we see that the EW-based method is the essential part of the whole algorithm which improves the efficiency of the algorithm.
In this paper, the EW coefficient matrix
was calculated by the difference of the total entropy matrix and the average within-class entropy matrix, i.e.,
. For other applications, researchers can also consider the ratio of the total entropy matrix and the average within-class entropy matrix as the definition of the new entropy-based coefficient matrix, which is an interesting project for future study.
It is worth noting that besides the above EW facial recognition method, our entropy-based matrix
can also be applied to other areas of pattern recognition or data reduction as an original information matrix, which is likely to form new entropy-based recognition methods. In general application, it is possible for
or
in the expression
, to meet the need of multiple data rather than binomial data. The entropy-based supervised or semi-supervised methods can also be put in various applications.


